the effect of a wet radome on dualpol data quality -...
TRANSCRIPT

P13.15 The effect of a wet radome on dualpol data quality
Michael Frech∗
Deutscher WetterdienstHohenpeissenberg Meteorological Observatory, Germany
1. Introduction
Operational radar systems typically are equipped with aradome. A radome protects the radar system and al-lows continuous operation under all weather conditions.The potential disadvantage of using a radome is thatit may affect the outgoing and incoming microwave, inparticular when the radome is wet. Radomes are typ-ically optimized to minimize the transmission loss andto avoid azimuthal variations of the received signal dueto radome seams. Furthermore, the radome material ischosen to be hydrophobic, in order to avoid as much aspossible additional attenuation due to a wet radome sur-face. Radome attenuation is discussed in a number ofpapers where the effect typically is analyzed under ide-alized conditions (e.g. Manz, 2001). The level of attenu-ation will also depend on rainfall intensity and type. Thedependence on rainfall intensity has been investigatedrecently in Kurri and Huuskonen (2008). Under opera-tional conditions, the attenuation of the radar signal maydepend on elevation and azimuth. For example, atten-uation may be quite heterogeneous under strong windconditions because the radome is not equally wet (e.g.Germann (2000). The effect wet radome attenuation onpolarimetric moments so far has not been investigated indetail.
In this work we investigate the effect of radome atten-uation on polarimetric moments under operational con-ditions. Data are taken from the dualpol C-band radarat the Hohenpeissenberg Meteorological Observatory .This radar is the research radar of the German Met.
∗Corresponding author address: Michael Frech, DWD, Meteo-rologisches Observatorium Hohenpeissenberg, D-82383 Hohenpeis-senberg, Germany. Email: [email protected] abstract, AMS Radar conference 2009, Williamsburg, VA.
Service, DWD. The radar is protected by a 12-year oldradome of orange-peel type. No dedicated maintenancehas been applied to this radome.
Eleven months of radar data are analyzed and statis-tics are computed to identify the mean attenuation ofa wet radome and its variability. Variability may be ex-pected due to the meteorological conditions at the radarsite (e.g. wind) or due to the type of hydrometeors (e.g.snow vs. rain).
2. The data
Data from February to December 2008 are analyzed. Weperform 5 minute volume scans in STAR (SimultaneousTransmitt and Receive) mode. In STAR mode, each vol-ume contains 10 elevation angles. The main character-istics of the scan definition are briefly described here:
STAR-Mode (every 5 min), with the following settings:
• 10 elevation angles: 0.5◦, 1.5◦, 2.5◦, 3.5◦, 4.5◦,5.5◦, 8◦, 12◦, 17◦, 25◦
• elevation angles 0.5 - 4.5◦: PRF = 640 Hz,AZ-rate 16◦/s, range= 230 km.
• elevation angles 5.5 - 25◦: PRF = 1160 Hz,AZ-rate 16◦/s, range= 128 km.
• Raw-range bin resolution: 125 m
• Range averaging: 250 m.
• pulse width: 0.8 µs
• Dynamic angle synching (DAS) with 1◦ raywidth.
1

• The following moments are available:CZH, CZV, UZH, UZV, V H, V V, WH, WV,ΦDP , ZDR, ρHV , KDP , with
CZH, CZV : clutter corrected reflectivity factorZ, horizontal (H) and vertical V ) polariza-tion.
UZH, UZV : un-corrected reflectivity factor Z,horizontal (H) and vertical V ) polarization.
V H, V V : line-of-sight Doppler velocity, fromhorizontal (H) and vertical V ) polarization.
WH, WV : Doppler spectral width, from hori-zontal (H) and vertical V ) polarization.
ZDR: Differential reflectivity.ΦDP : Differential phase.KDP : Specific differential phase.ρhv: Cross-correlation coefficient.
The reference precipitation measurement is a raingauge at the radar site. These data with one-minute res-olution are used to define the onset and end of a precip-itation event over the site. Furthermore, the independentprecipitation data allow the classification of the attenua-tion effect with respect to precipitation rate.
3. Case study with moderate precip-itation
Two screenshots of ZDR taken 25.4.2008 just before andduring precipitation at the radar site are shown in Fig-ure 1. The situation was characterized by strong graupelshowers. From literature (e.g. Bringi and Chandrasekar,2001) it is known that graupel is typically characterizedby slightly negative or near zero ZDR which is consistentwith the ZDR-values before the precipitation reaches theradar site. During the precipitation event at the site, ZDR
becomes positive which can be attributed to differentialradom attenuation of ZH and ZV because the charac-ter of precipitation (graupel) did not change. A morequantitative impression on the magnitude of attenuationis shown in Figure 2. Here we compute sweep averagesof radar moments at el = 1.5◦. In order to reduce scat-ter due to bad signal quality and clutter we only considerdata at r > 4 km, ρHV > 0.8 and z < 12000 m. We
Figure 1: ZDR [dB] screenshots taken 25.4.2008 beforethe precipitation event reaches the site (left) and whilethe event is over the site (right). The scale of ZDR isfrom -1 (yellow) to +2 (red).
2

0 0.2 0.4 0.6 0.8
1
11:00 11:30 12:00 12:30 13:00 13:30 14:00
[dB
]
ZDR Median
12 13 14 15 16 17
11:00 11:30 12:00 12:30 13:00 13:30 14:00
[dB
Z] ZH Median
ZV Median
0
0.2
0.4
0.6
11:00 11:30 12:00 12:30 13:00 13:30 14:00
[mm
/min
] Ombrometer
Figure 2: ZDR [dB] variability due to a wet radome.Before the precipitation reaches the radar site, ZDR isslightly negative. During the precipitation event ZDR be-comes positive (ZDR ≈ 0.8).
make the assumption that there is no overall change inprecipitation type and intensity as seen by the radar. Assuch, any variations are attributed to the radome effect.As a reference we show the rain-gauge measurementsat the radar site. Once the precipitation reaches the site,we notice a decrease of ZH and ZV of about 3 and 4 dB,respectively. ZV attenuation is stronger which is high-lighted by the increase of ZDR up to a value of 0.8 dB.Stronger ZV attenuation can be attributed to the moreor less vertically aligned water runoff from the radome.From Figure 2 we can also deduce a drying time of theradome on the order of 30 min which can be related tothe time it takes to reach again the magnitudes of theradar moments as observed just before the precipitationevent reaches the site. RHOHV shows a weak decrease(not shown) and there is no clear picture seen in PHIDP
4. Case study with intense precipi-tation
As another example we consider an event of very intenseprecipitation (up to 4 mm/min) observed on 17.5.2008.We again show two screenshots of radar products beforeand while the cell is over the radar site (Figure 3). Note
Figure 3: ZDR [dB] screenshots taken 17.5.2008 beforethe precipitation event reaches the site (left) and whilethe event is over the site (right), 17.5.2008. The scale ofZDR is from -6.4 (blue) to +6.4 (red). Zero ZDR codedwith as yellow.
3

-5-4-3-2-1 0 1
18:00 18:30 19:00 19:30 20:00 20:30 21:00
[dB
]
ZDR Median
9 11 13 15 17 19
18:00 18:30 19:00 19:30 20:00 20:30 21:00
[dB
Z]
ZH MedianZV Median
0 1 2 3 4 5
18:00 18:30 19:00 19:30 20:00 20:30 21:00
[mm
/min
]
Ombrometer
Figure 4: ZDR [dB] bias during an intense precipitationevent.
that we use a different color scale compared to the one ofFigure 1. There are a number of features readily visiblefrom Figure 3. First of all we see strong attenuation ef-fects in ZDR (blue colors behind the leading edge of thecell south-west from the radar site). The leading edgeof the cell is characterized by large positive ZDR values(up to +5 dB) which is indicative of large drop sizes in-cluding possibly hail. This corresponds to drop sizes of≈ 6− 8 mm (Bringi and Chandrasekar, 2001). When thecell is over the site, ZDR assumes large negative values(≈ −5 to −4 dB). We furthermore observe ray-shapeddisturbances when the cell is over the site. Those distur-bances appear to be not coherent, as they are not visi-ble in the Doppler moments. The source of those echosappears related to a shielding problem which has beenfixed in the meanwhile. Similar to the previous case wecompute sweep averaged values of each radar moment,in order to quantify the relative magnitude changes foreach moment. The time series of Z, ZDR and ombrome-ter data (Figure 4) substantiate the more qualitative viewof the screenshots (Figure 3). Here we find a strongnegative bias in ZDR. The attenuation of ZH is signifi-cantly stronger than for ZV . The overall attenuation ofZH is on the order of 10 dB which is due to a combina-tion of the wet radome effect and the path attenuation bythe cell itself. A large negative ZDR deviation is alreadyobserved before the precipitation reaches the site. Thecontribution of the wet radome to the ZDR bias is difficult
to quantify in this case. The data suggest that the micro-physical structure of the cell and the associated attenu-ation dominate the (negative) ZDR bias. This is differentfrom the previous case where we find positive ZDR. Theweak/moderate precipitation event starting around 19:15UTC shows a positive ZDR bias consistent with the pre-vious case study.
5. Statistical analysis
a. Bias as a function of time
We analyze the effect of radome attenuation consideringall precipitation events from February to December 2008.The data sample is expected to be rather heterogeneousso we initially define criteria to isolate specific precipita-tion events from the data. We only consider precipitationevents that have at least a duration of 10 minutes. Fur-thermore, we require a period of 30 minutes without anyprecipitation at the radar site prior the precipitation event.The 30 minute sequence is defined as the dry radomereference where radar data is expected to be affectedsolely by the radome design characteristics. Applyingthese criteria to the data we obtain about 70 samples forfurther analysis which is still a rather small sample sizefor a statistical analysis. Nevertheless we perform somebasic analysis in order to identify basic properties of theradome attenuation effect. For these samples, the aver-age accumulated rain and its range is shown in Figure5. In the following we consider only the first 30 minutesafter the beginning of a precipitation event. The analysisis carried for four elevation angles: 0.5◦ (sweep 9), 1.5◦
(sweep 8), 2.5◦ (sweep 7) and 8◦ (sweep 3).The corresponding relative change of ZDR as a func-
tion of time is shown in Figure 6 for sweep 8. This mo-ment is impacted most by a wet radome. The ZDR biasincreases initially more or less linearly for the first 20-30 minutes before maximum attenuation for a given rainevent is reached. The average differential attenuationis +0.3 dB. Considering a required accuracy of 0.1 dBfor ZDR, wet radome attenuation has to be consideredand should be corrected for in operational applications.The spread in ZDR bias suggests that the bias is de-pendent on the actual rain rate and other meteorologicaleffects which may lead to a heterogeneous wettening of
4

0
0.5
1
1.5
2
2.5
0 5 10 15 20 25 30
accu
mul
ated
rai
n [m
m]
min
median, sweep8
Figure 5: Average accumulated rain (median) and thedistribution of rain amounts for the samples to studyradom attenuation. The range is defined by the 1st andthird quartile of the distribution at a given time.
the radome. The dependence on rain rate will be inves-tigated in the next section.
For illustrative purposes we show also the variation ofρhv which does not show a comparable systematic be-haviour as a function event time (Figure 7). Here devia-tions on the order of 0.002 are observed due to radomeattenuation which is smaller than the required accuracy(0.005) but which adds to the overall uncertainty in ρhv
from other components in the radar system.
b. Bias as a function of elevation angle
In principle, the influence of wet radome may be eleva-tion dependent as the water coating of the radom willbe variable. This may be due to variable exposure of aradom element to the precipitation event, e.g whether it isup or downstream of the main atmospheric flow. This isan aerodynamic effect which may cause variable radomewater coating as a function of azimuth and elevation.Furthermore an elevation dependent water coating canbe expected as more and more water is collected whilethe water drains off from the radome due to gravitation.This water runoff is collected in little streams which maycause an additional azimuthal dependence in attenua-tion. In principle, the analysis of the elevation depen-dence could take into account wind speed as a further
0
0.1
0.2
0.3
0.4
0.5
0.6
0.7
0.8
0 5 10 15 20 25 30Z
DR
,t=i m
in -
ZD
R,t=
0 m
in [d
B]
min
median, sweep8
Figure 6: ZDR change relative to the average “dry” ZDR
[dB].
-0.006
-0.004
-0.002
0
0.002
0.004
0 5 10 15 20 25 30
ρ hv,
t=i m
in -
ρhv
,t=0
min
[ ]
min
median, sweep8
Figure 7: Φdp and ρhv change relative to the average“dry” values.
5

0
0.05
0.1
0.15
0.2
0.25
0.3
0.35
0.4
0.45
0.5
0 5 10 15 20 25 30
ZD
R,t=
i min
- Z
DR
,t=0
min
[dB
]
min
median, sweep3median, sweep7median, sweep8median, sweep9
Figure 8: ZDR [dB] bias as function of four elevation an-gle: sweep 3 (8◦), 7 (2.5◦), 8 (1.5◦) and 9 (0.5◦).
variable. This may be considered at a later stage of theanalysis when a larger data set is available.
The analysis of the four elevation angles shows no dis-tinct differences for ZDR (Figure 8). This would suggestan elevation independence of ZDR attenuation at leastfor the sample considered here.
c. Bias as a function of rain rate
Previous case studies show that the bias is a function ofrain rate. We therefore anaylse the sample with respectto rain rate focusing on ZDR. The results are shown inFigure 9
Up to a rain rate of ≈ 0.15 mm/min, there is a steadyincrease of ZDR bias up to a level of 0.6 dB. On average,this bias remains constant for larger rain rates (satura-tion effect). The scatter is relatively large for larger rainrates due to a small sample size. Since our sample alsoincludes a number of snow cases, we carried out a sen-sitivity study by removing the snow samples. The resultis shown in Figure 10. Snow cases are mainly related tosmall precipitation rates. Removing those samples leadsa more or less linear bias increase as a function of rainrate (up to ≈ 0.1 mm/min). This feature may be used fora correction scheme to correct for the ZDR bias.
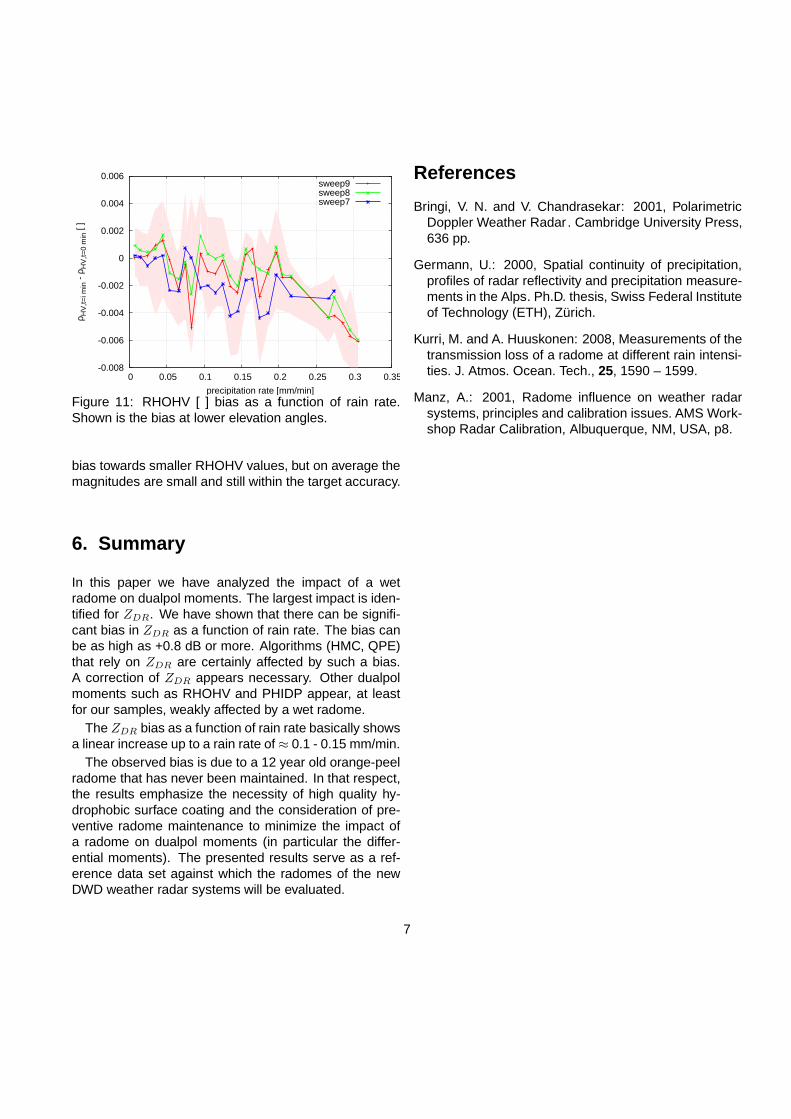
We also analyze the dependence of RHOHV on rainrate. The result is shown in Figure 11. There is no cleartrend visible. At large rain rates there appears to be a
-0.2
0
0.2
0.4
0.6
0.8
1
1.2
0 0.05 0.1 0.15 0.2 0.25 0.3 0.35Z
DR
,t=i m
in -
ZD
R,t=
0 m
in [d
B]
precipitation rate [mm/min]
sweep9sweep8sweep7
Figure 9: ZDR [dB] bias as a function of rain rate, in-cluding snow cases. Shown is the bias at lower elevationangles.
-0.2
0
0.2
0.4
0.6
0.8
1
1.2
0 0.05 0.1 0.15 0.2 0.25 0.3 0.35
ZD
R,t=
i min
- Z
DR
,t=0
min
[dB
]
precipitation rate [mm/min]
sweep9sweep8sweep7
Figure 10: ZDR [dB] bias as a function of rain rate, ex-cluding snow cases. Shown is the bias at lower elevationangles.
6
-0.008
-0.006
-0.004
-0.002
0
0.002
0.004
0.006
0 0.05 0.1 0.15 0.2 0.25 0.3 0.35
ρ HV
,t=i m
in -
ρH
V,t=
0 m
in [
]
precipitation rate [mm/min]
sweep9sweep8sweep7
Figure 11: RHOHV [ ] bias as a function of rain rate.Shown is the bias at lower elevation angles.
bias towards smaller RHOHV values, but on average themagnitudes are small and still within the target accuracy.
6. Summary
In this paper we have analyzed the impact of a wetradome on dualpol moments. The largest impact is iden-tified for ZDR. We have shown that there can be signifi-cant bias in ZDR as a function of rain rate. The bias canbe as high as +0.8 dB or more. Algorithms (HMC, QPE)that rely on ZDR are certainly affected by such a bias.A correction of ZDR appears necessary. Other dualpolmoments such as RHOHV and PHIDP appear, at leastfor our samples, weakly affected by a wet radome.
The ZDR bias as a function of rain rate basically showsa linear increase up to a rain rate of ≈ 0.1 - 0.15 mm/min.
The observed bias is due to a 12 year old orange-peelradome that has never been maintained. In that respect,the results emphasize the necessity of high quality hy-drophobic surface coating and the consideration of pre-ventive radome maintenance to minimize the impact ofa radome on dualpol moments (in particular the differ-ential moments). The presented results serve as a ref-erence data set against which the radomes of the newDWD weather radar systems will be evaluated.
References
Bringi, V. N. and V. Chandrasekar: 2001, PolarimetricDoppler Weather Radar . Cambridge University Press,636 pp.
Germann, U.: 2000, Spatial continuity of precipitation,profiles of radar reflectivity and precipitation measure-ments in the Alps. Ph.D. thesis, Swiss Federal Instituteof Technology (ETH), Zurich.
Kurri, M. and A. Huuskonen: 2008, Measurements of thetransmission loss of a radome at different rain intensi-ties. J. Atmos. Ocean. Tech., 25, 1590 – 1599.
Manz, A.: 2001, Radome influence on weather radarsystems, principles and calibration issues. AMS Work-shop Radar Calibration, Albuquerque, NM, USA, p8.
7