the effect of frequency in watching english- movie …
TRANSCRIPT
i
THE EFFECT OF FREQUENCY IN WATCHING ENGLISH-
MOVIE TOWARDS THE PRONUNCIATION OF EFL
LEARNERS AT IAIN PALANGKA RAYA
THESIS
BY
FEBBY FEBRINA AMBAR MAHARDHIKA
SRN. 1501121053
STATE ISLAMIC INSTITUTE OF PALANGKA RAYA
FACULTY OF TEACHER TRAINING AND EDUCATION
LANGUAGE EDUCATION DEPARTEMENT
STUDY PROGRAM OF ENGLISH EDUCATION
1441 H / 2019 M
ii
THE EFFECT OF FREQUENCY IN WATCHING ENGLISH-
MOVIE TOWARDS THE PRONUNCIATION OF EFL
LEARNERS AT IAIN PALANGKA RAYA
THESIS
Presented to
State Islamic Institute of Palangka Raya
in partial fulfillment of the requirements
for the degree of Sarjana in English Language Education
BY
FEBBY FEBRINA AMBAR MAHARDHIKA
SRN. 1501121054
STATE ISLAMIC INSTITUTE OF PALANGKA RAYA
FACULTY OF TEACHER TRAINING AND EDUCATION
LANGUAGE EDUCATION DEPARTEMENT STUDY PROGRAM OF
ENGLISH EDUCATION
1440 H / 2019 M
iii

iv

v

vi
vi
MOTTO AND DEDICATION
“If you are working on something that you
really care about, you don’t have to be
pushed. The vision pulls you”.
(steve jobs)
This Thesis is dedicated to:
My beloved Father Mr. Tafip Trenggono and my
Mother Mrs. Dahlina for their valuable endless
prayer, sacrifice, and support also for my sister Afrida
Respati Hayuningtyas and my young brother Tegar
Tri Mukti Aji. Then, for my beloved friends PBI‘15.

vii
vii

viii
viii
ABSTRACT
Mahardhika, Febby Febrina Ambar. 2019. The Effect of Frequncy In Watching
English-Movie Towards The Pronunciation of EFL Learners at IAIN
Palangka Raya, Thesis. Department of Language Education, Faculty of
Teacher Training and Education, State Islamic Institute of Palangka Raya.
Advisors: (I) Dr. Imam Qalyubi, M.Hum; (II) Zaitun Qamariah, M.Pd.
Key Words: Frequency Watching English-movie, Pronunciation
The aim of the research was to find out the effect of frequency in watching
English-movie towards the pronunciation of English education study program at
IAIN Palangka Raya on academic year 2018.
The type of the research is quantitative and uses ex post facto design. In
collecting data the researcher gives a questionnaire consisting of 15 questions. After
giving the questionnaire, the researcher conducted a pronunciation test using records
and the students' grades were obtained from these results. In analyzing the data, the
researcher used linear regression in SPSS 20.
The results of this study indicate that there is significant effect the frequency
in watching English-movie towards pronunciation. Based on the linear regression
calculation, that the obtained Fcount is 51.328 which means it is smaller than the
Ftable 3.11 or (51.328 < 3.11). Then, p value is 0.01 which is smaller than 0.05 or
(0.01 <0.05). Through this result, it can be concluded that Ho was rejected and Ha
was accepted. Which means it can be concluded that there is significant effect of
frequency in watching English-movie towards students' pronunciation. The
conclusion of this study is that students often watch English-movie have an influence
on the pronunciation.
ix
ix
ABSTRACT
Mahardhika, Febby Febrina Ambar. 2019. The Effect of Frequncy In Watching
English-Movie Towards The Pronunciation of EFL Learners at IAIN
Palangka Raya, Thesis. Department of Language Education, Faculty of
Teacher Training and Education, State Islamic Institute of Palangka Raya.
Advisors: (I) Dr. Imam Qalyubi, M.Hum; (II) Zaitun Qamariah, M.Pd.
Key Words: Frequency Watching English-movie, Pronunciation
The aim of the research was to find out the effect of frequency in watching
English-movie towards the pronunciation of English education study program at
IAIN Palangka Raya on academic year 2018.
The type of the research is quantitative and uses ex post facto design. In
collecting data the researcher gives a questionnaire consisting of 15 questions. After
giving the questionnaire, the researcher conducted a pronunciation test using records
and the students' grades were obtained from these results. In analyzing the data, the
researcher used linear regression in SPSS 20.
The results of this study indicate that there is significant effect the frequency
in watching English-movie towards pronunciation. Based on the linear regression
calculation, that the obtained Fcount is 51.328 which means it is smaller than the
Ftable 3.11 or (51.328 < 3.11). Then, p value is 0.01 which is smaller than 0.05 or
(0.01 <0.05). Through this result, it can be concluded that Ho was rejected and Ha
was accepted. Which means it can be concluded that there is significant effect of
frequency in watching English-movie towards students' pronunciation. The
conclusion of this study is that students often watch English-movie have an influence
on the pronunciation.
x
x
ABSTRAK
Mahardhika, Febby Febrina Ambar. 2019. Efek Dari Frekuensi Menonton Film
Bahasa Inggris Terhadap Pelafalan Pelajar Bahasa Inggris di IAIN Palangka
Raya, Skripsi. Jurusan Pendidikan Bahasa. Fakultas Tarbiyah dan Ilmu
Keguruan, Institut Agama Islam Negeri Palangka Raya. Pembimbing (I)
Dr.Imam Qalyubi, M.Hum; (II) Zaitun Qamariah, M.Pd.
Kata kunci: Frekuensi menonton film, Pelafalan.
Tujuan dari penelitian ini adalah untuk mengetahui pengaruh frekuensi
menonton film berbahasa Inggris terhadap pelafalan program studi pendidikan bahasa
Inggris di IAIN Palangka Raya pada tahun akademik 2018.
Jenis penelitian ini adalah kuantitatif dan menggunakan desain ex post facto.
Dalam mengumpulkan data, peneliti memberikan kuesioner yang terdiri dari 15
pertanyaan. Setelah memberikan kuesioner, peneliti melakukan tes pengucapan
menggunakan teks dan nilai siswa diperoleh dari hasil ini. Dalam menganalisis data,
peneliti menggunakan regresi linier dalam SPSS 20.
Hasil penelitian ini menunjukkan bahwa ada pengaruh yang signifikan
frekuensi dalam menonton film berbahasa Inggris terhadap pelafalan. Berdasarkan
perhitungan regresi linier, bahwa F hitung yang diperoleh adalah 51.328 yang berarti
lebih kecil dari Ftabel 3.11 atau (51.328 < 3.11). Kemudian, nilai p adalah 0.01 yang
lebih kecil dari 0.05 atau (0.01 <0.05). Melalui hasil ini, dapat disimpulkan bahwa Ho
ditolak dan Ha diterima. Yang berarti dapat disimpulkan bahwa ada pengaruh
frekuensi yang signifikan dalam menonton film berbahasa Inggris terhadap pelafalan
siswa. Kesimpulan dari penelitian ini adalah bahwa siswa yang sering menonton film
berbahasa Inggris memiliki pengaruh pada pelafalan.
xi
xi
ACKNOWLEDGEMENTS
The researcher would like to express her sincere gratitude to Allah SWT.
For the blessing bestowed in her whole life particularly during the thesis writing
without which this thesis would not have come to its final form. Sholawat and
salam always be bestowed to the last prophet Muhammad SAW., having shown
us the role of life to make our life true.
Her appreciation is addressed to:
1. Dean of Faculty of Teacher Training and Education of the State Islamic
Institute of Palangka Raya, Dr. Hj. Raudhatul Jennah, M.Pd., for her
invaluable assistance both in academic and administrative matters.
2. Vice Dean in Academic Affairs, Dr. Nurul Wahdah, M.Pd., for her
invaluable assistance both in academic and administrative matters.
3. Secretary of Department of Language Education, Akmad Ali Mirza, M.Pd.,
for his invaluable assistance both in academic and administrative matters.
4. Chair of Study Program of English Education, Zaitun Qamariah, M.Pd., for
her invaluable assistance both in academic and administrative matters.
5. Dr. Imam Qalyubi, M.Hum the first advisor and Zaitun Qamariah, M.Pd the
second advisor, for their valuable guidance, suggestion and encouragement.
6. Both the members of the board of examiners, for their corrections,
comments and suggestions which are profitable to the accomplishing of this
thesis.

xii
xii
7. All English lectures and staff of IAIN Palangka Raya for their help and
support.
8. All of English students generation 2015 who has given the writer support
and contribution.
9. All of students generation 2017 to 2018 at English Education Study
Program who helped the researcher in completing the research.
10. Her beloved parent, Tafip Trenggono and Dahlina. Her beloved sister,
Afrida Respati Hayuningtyas. And her beloved young brother, Tegar Tri
Mukti Aji who always support and pray for her.
11. Her special best friends, Khairul Kahfi, Wulan Sari, Anis Wahdati and
Sellawati Dewi who always support and a good listener in time begins to
feel down and best friends who never disappear when she need help.
Whatever it is they are very good friends.
12. Last, all of her friends who have helped the accomplishment of the thesis.
The researcher hopes that may Allah always keeps us on the straight path,
reward and blesses us for what we do and this writing can be useful for all
of us.
Palangkarayat, September 2019
The Researcher
Febby Febrina Ambar Mahardhika
NIM. 1501121053
xiii
xiii
TABLE OF CONTENT
Page
COVER i
COVER (Second Page) ....................................................................................................... ii
ADVISOR APPROVAL ..................................................................................................... iii
PERSETUJUAN PEMBIMBING ...................................................................................... iv
THESIS APPROVAL ......................................................................................................... v
OFFICIAL NOTE ............................................................................................................... vi
MOTTO AND DEDICATION ........................................................................................... vii
DECLARATION OF AUTHORSHIP ................................................................................ viii
ABSTRACT ........................................................................................................................ ix
ABSTRAK ......................................................................................................................... x
ACKNOWLEDGEMENTS ................................................................................................ xi
CONTENTS ........................................................................................................................ xiii
LIST OF TABLES .............................................................................................................. xvi
LIST OF FIGURES ............................................................................................................ xviii
LIST OF APPENDICES ..................................................................................................... xix
CHAPTER I INTRODUCTION ......................................................................................... 1
A. Background of the study ............................................................................................... 1
B. Research Problem.......................................................................................................... 6
C. Objective of the study ................................................................................................... 6
D. Hypothesis of the study ................................................................................................. 6
E. Assumption ................................................................................................................... 7
F. Scope and Limitation .................................................................................................... 7
xiv
xiv
G. Significance of the study ............................................................................................... 8
H. Definition of Key Terms ............................................................................................... 8
CHAPTER II REVIEW OF RELATED LITERATURE ................................................... 9
A. Related Studies .............................................................................................................. 9
B. Movie 13
1. Definition of movie ................................................................................................. 13
2. The Effect of English-Movie .................................................................................. 14
3. Frequency of Watching English-Movie .................................................................. 17
4. Watching English-Movie ........................................................................................ 17
C. Pronunciation ................................................................................................................ 13
1. Definition of Pronunciation..................................................................................... 18
2. The Goals of English Pronunciation ....................................................................... 19
3. Factors Affecting The Learning of Pronunciation .................................................. 20
4. The Indicators Pronunciation .................................................................................. 27
D. Theory Techniques For Teaching English Pronunciation ............................................. 28
CHAPTER III RESEARCH METHOD ............................................................................. 32
A. Research Design ............................................................................................................ 32
B. Population and Sample .................................................................................................. 33
C. Research Instrument ...................................................................................................... 35
1. Questionnaire .......................................................................................................... 35
2. Pronunciation Test .................................................................................................. 37
3. Instrument Validity ................................................................................................. 39
4. Instrument Reliability.............................................................................................. 41
D. Data Collection Procedure ............................................................................................ 42
E. Data Analysis Procedure ............................................................................................... 42
xv
xv
CHAPTER IV RESULT FINDINGS AND DISCUSSION ............................................... 45
A. Data Presentation .......................................................................................................... 45
B. Research Findings ......................................................................................................... 68
C. Discussion ..................................................................................................................... 74
CHAPTER V CONCLUSION AND SUGGESTIONS ...................................................... 77
A. Conclusion .................................................................................................................... 77
B. Suggestions ................................................................................................................... 78
REFERENCES .................................................................................................................... 80
APPENDICES
xvi
xvi
LIST OF TABLES
Page
1. Table 2.1 (indicators of pronunciation) ................................................................... 28
2. Table 3.1 (Scoring rubric of indicators pronunciation test) .................................... 38
3. Table 4.1 (The score of student‘s frequency in watching English-Movie) ............. 46
4. Table 4.2 (Scale students‘ frequency in watching English-Movie towards
pronunciation) ......................................................................................................... 49
5. Table 4.3 (item 1 questionnaire) ............................................................................. 50
6. Table 4.4 (item 2 questionnaire) ............................................................................. 51
7. Table 4.5 (item 3 questionnaire) ............................................................................. 51
8. Table 4.6 (item 4 questionnaire) ............................................................................. 51
9. Table 4.7 (item 5 questionnaire) ............................................................................. 52
10. Table 4.8 (Score of students attitude in watching English-movie towards
pronunciation) ......................................................................................................... 53
11. Table 4.9 (Scale students‘ attitude in watching English-Movie towards
pronunciation) ......................................................................................................... 56
12. Table 4.10 (item 6 questionnaire) ........................................................................... 57
13. Table 4.11 (item 7 questionnaire) ........................................................................... 57
14. Table 4.12 (item 8 questionnaire) ........................................................................... 58
15. Table 4.13 (item 9 questionnaire) ........................................................................... 58
16. Table 4.14 (item 10 questionnaire) ......................................................................... 59
17. Table 4.15 (item 11 questionnaire) ......................................................................... 59
18. Table 4.16 (item 12 questionnaire) ......................................................................... 60
19. Table 4.17 (item 13 questionnaire) ......................................................................... 61
20. Table 4.18 (item 14 questionnaire) ......................................................................... 61
21. Table 4.19 (item 15 questionnaire) ......................................................................... 62
22. Table 4.20 (The score of students pronunciation test) ............................................ 63
xvii
xvii
23. Table 4.21 (Relative frequency distribution of students pronunciation test) .......... 66
24. Table 4.22 (Normality Test) .................................................................................... 68
25. Table 4.23 (Homogeneity Test) .............................................................................. 69
26. Table 4.24 (Model Summary) ................................................................................. 70
27. Table 4.25 (ANOVA).............................................................................................. 71
28. Table 4.26 (Coefficients) ........................................................................................ 72
xviii
xviii
LIST OF FIGURES
Page
1. Figure 4.1 (Frequency distribution of student‘s watching English-movie) ............ 49
2. Figure 4.2 (Figure distribution of student‘s watching English-movie towards
pronunciation) ......................................................................................................... 55
3. Figure 4.3 (Frequency distribution of student‘s score pronunciation test) ............. 67
4. Figure 4.4 (Scatterplot of Hypothesis) .................................................................... 73

xix
xix
LIST OF APPENDICES
Appendix 1 Research Schedule
Appendix 2 Result Validity of Try Out Questionnaires using Microsoft Excel
2010
Appendix 3 Result Validity of Try Out Questionnaires using SPSS 20
Appendix 4 Result Reliability of Try Out Questionnaires using SPSS 20
Appendix 5 Data Participants
Appendix 6 Questionnaires & Test
Appendix 7 File of Record
Appendix 8 Curriculum Vitae
1
CHAPTER I
INTRODUCTION
This chapter provided the background of study that described the writer‘s
reason of choosing this study. It is consisted of background of the study, research
problem, and objective of the study, hypothesis of the study, scope and limitation of
the study, significance of the study and definition of key terms.
A. Background of the Study
Pronunciation is one of element of the language that has big
contribution for better English speaking (Allen, 1960 : 35). Pronunciation
have a great influence so that when speaking can be understood, on the other
hand pronunciation mistakes when speaking can cause misunderstandings
(Chiu, 2008; Harmer, 2007). Based on Hişmanoğlu (2006), Teaching and
learning pronunciation is very important for the step to speak directly well
because it is an important aspect of communicative that is easy to understand.
However, there are many barriers that hinder them to speak with good English
pronunciation. Based on Hişmanoğlu (2006), pronunciation has remained one
of the most difficult skills to teach and remained unknown in the classroom.
Although good pronunciation is not the same as good speech, it will provide a
channel for clarity of speech because the listener guarantees distinguished
vowels and consonants and appropriate intonation contours to understand the
speaker's speech (Brown, 1989; Munro
2
Derwing, 1997). Moreover from an inter linguistic point of view, EFL
language learners are likely to encounter difficulties when pronouncing
sounds that do not exist in their first language. A number of studies (Chang,
2001; Wolfram & Johnson, 1982) it has been proven that both innate and
systemic pronunciation difficulties are mainly the result of differences
between languages.
In the department of English education, State Islamic Institute of
Palangka Raya, pronunciation is in first semester courses, namely
Pronunciation Practice. Based on researcher experience, reading with good
pronunciation is very difficult. This problem can be seen from most students
still reading in their first language accent. This has a negative effect for EFL
learners, such as getting a low score when the pronunciation test, when the
discussion misinterprets the meaning of the other person's speech and also the
decrease in self-confidence in reading or representing in public. In an article
by M. Arif Rahman Hakim (2012, p.245), based on his research in teaching
Javanese students in the English Department at STAIN Bengkulu, he said that
most of them said the word with a very strong Javanese accent. They have
difficulty controlling and changing their pronunciation like British or
American accents because their accent is very thick. As a result, most students
there are still doing stress in phonetics. In University Sains Malaysia many
learners of English as a second language have ―major difficulties‖ with
English pronunciation even after years of learning the language. This often
3
3
results in them facing difficulties in areas such as finding employment
(Mohammad Reza Ahmadi, 2011 p.74). Hinofotis and Baily (1980, pp. 124-
125) notes that ―up to a certain proficiency standard, the fault which most
severely impairs the communication process in EFL/ESL learners is
pronunciation‖, not vocabulary or grammar.
Some researchers (e.g., Al-Seghayer, 2005; Brett, 1995; Egbert &
Jessup, 1996) have presented strong evidence that multimedia have useful
effects on language learning because of their rich and authentic
comprehensible input. One of them is Movie to improve pronunciation. Many
scholars have revealed that movies used in EFL classroom can become an
important part of the curriculum. This is based on the fact that movies provide
exposures to ―real language,‖ used in authentic settings and in the cultural
context which the foreign language is spoken (Merita Ismaili, 2013 p.121).
They also have found that movies catch the learners‘ interest and it can
positively affect their motivation to learn (Kusumarasdyati, 2004; Luo, 2004).
Moreover, Herron and Hanley (1992) concluded that using movies in EFL
classroom offers background information that activates prior knowledge,
which is essential in stimulating the four skills activities in the classroom.
Based on those explanations and theoretically, it probably has positive
effect of frequency in English-speaking movie watching towards the
pronunciation. But in Indonesia rarely research about it. Merita Ismaili (2013)
analyzes the effects of using movies in the EFL classroom. The study was
4
4
conducted on a sample of two groups: an experimental and a control group
taught conventionally. The results of the study have shown that significant
differences between experimental and control group of students on integrated
skills, using video incorporated in the teaching material.
Furthermore, Saparta Rasyid (2016) find out whether the use of
English cartoon movie can improve student‘s achievement. The researcher
utilized experimental design one group pre-test and post-test. The instrument
used was oral test. The speaking aspect covered in this study were grammar,
vocabulary, and pronunciation. The result shows that the students speaking
score increased in all aspects. However, Sue Ruey Shing & Lim Kun Yin
(2014), researched tried to investigates the effectiveness of using films as an
approach to teach English language speaking skills with specific focus on four
voice aspects - pronunciation, intonation, stress and pauses. The study was
conducted on twelve pre-selected form four students who were divided into
two groups namely control and experimental group. The result data reveals
that film only gives minor impact on the students‘ pronunciation.
Theoretically, there variables should have positive relationship so that the
writer needs to find out by herself what to improve in this research.
Furthermore, based on the above researchers who use movie to
improve pronunciation, achievement or motivation skills. The results of
researchers using experimental designs show significant results, can improve
all aspects and also have a small impact. But not necessarily the results
5
5
obtained because indeed students watch movies during treatment there may be
other factors that make students smart in pronunciation. Just like they are used
to watching movies.
In this research the researcher used the ex post facto design. Ex post
facto unlike experimental research, does not provide the safeguards that are
necessary for making strong inferences about causal relationships (Ary
Donald, chapter 12 p.333). According to Kerlinger (1973) ex post facto
research is a systematic empirical investigation in which the researcher does
not control the independent variables directly because the existence of the
variable has occurred, or because the variable cannot be manipulated
basically. Conclusions about the existence of a relationship between these
variables are made based on differences that accompany free variables and
dependent variables, without direct intervention. Thus this study determines
whether watching movies can cause good pronunciation without going
through treatment such as experiment.
Based on the explanation above, the researcher is interested to research
this problem by the title “The Effect Of Frequency In Watching English-
Movie Towards The Pronunciation Of EFL Learners At IAIN Palangka
Raya”.
The reason for choosing this topic are as follows; (1) Everyone has
their abilities and interests to learn the Pronunciation from English Movie.
Therefore, this study wants to find out the effect of frequency in watching
6
6
English-Movie. (2) There was some facts found that there are differences in
the results of the pronunciation of students who say they often watch English
Movie. (3) Based on the lesson, Pronunciation material has been learned in
the first semester. So students have got basic knowledge and learn the
pronunciation while in the first semester.
B. Research Problem
Based on the background of the study above, the problem of this study
formulate with the question "Is there any effect of frequency in watching
English-movie towards the pronunciation of EFL learners at IAIN Palangka
Raya?"
C. Objective of the Study
Based on the research problem of the study above, the objective of this
study is to find out the effect of frequency in watching English-Movie towards
Pronunciation of EFL learners at IAIN Palangka Raya.
D. Hypothesis of the Study
Based on the theories were explained above, it can be posed a
theoretical hypothesis as follows:
1. Alternative Hypothesis (Ha): there is significance effect of frequency in
watching English-Movie towards Pronunciation of EFL learners at IAIN
Palangka Raya.
7
7
2. Null Hypothesis (Ho): there is no significance effect of frequency in
watching English-Movie towards Pronunciation of EFL learners at IAIN
Palangka Raya.
E. Assumption
This study is conducted on the assumption that if students of the
English Language Study Program on academic year 2018 of IAIN Palangka
Raya have a good pronunciation then in addition to watching English-movie
they used other alternatives to improve the quality of their pronunciation.
F. Scope and Limitation
This research includes a quantitative approach, especially ex post facto
design. This study focuses on knowing the effects of frequency in watching
English-movie towards the Pronunciation. This research is limited to students
of the English Language Study Program at IAIN Palangka Raya have taken
the 'Pronunciation Practice' course in the first semester. Therefore, the sample
of this research was conducted on students of the English education study
program on academic year 2018 in the second semester and the researcher
choose students in the academic year 2018 because they had just completed
the 'Pronunciation Practice' course and were still a period of enthusiastic new
students. So the researcher used total sampling to take samples and the
researcher measured scores from the frequency of watching English-movie
students from the questionnaire. In addition, the researcher will measure score
8
8
of results from the students‘ pronunciation by conducting the pronunciation
test.
G. Significance Of The Study
The theoretical significance of this study is intended to determine the
effects of frequency in watching English-movie. So in this way, students can
emphasize their pronunciation skills and certain methods of learning English
as a foreign language.
The practical significance of this study, the results can contribute to
lecturers and students about students' pronunciation skills.
And the results of this research are sharing some of the contributions
as a source of information for further research to conduct a similar study and
library at the IAIN Palangka Raya.
H. Definition Of Key Terms
There are some key terms used in this proposal, so to make the readers
understand, the researcher tries to give the definition of key terms as follow:
1. Frequency of watching English-movie is how often English movie that
watched by students.
2. Watching English Movie is an audio visual communication media to
improve student pronunciation.
3. Pronunciation is the students‘ ability to sub-skill of speaking.
9
CHAPTER II
This chapter provided the review of related literature that discussed about
related literature according to the research‘s point of view. It is consisted of related
studies, movie, pronunciation, and theory techniques for teaching English
pronunciation.
A. Related Studies
There are some previous studies which have a correlation with this
study. The first is a study by Uswatun Hasanah & Akhmad Ali Mirza “The
Effectiveness of English Cartoon Movie Towards Vocabulary Score” The
study included in quantitative Approach with Quasi Experimental design,
especially non randomized control group, pre-test and post-test. It was
designed the Lesson Plan, conducted the treatment and observed the students‘
score by pre-test and posttest. The sample was determined using cluster
random sampling technique. It meant that teaching vocabulary using English
cartoon movie gave significant effect on vocabulary score at the seventh
graders of MTs Muslimat Nu Palangka Raya.
The similarities this study with the researcher is both also looking for
the effects of watching English movie. In addition, the differences in this
study are dependent and sample. Uswatun Hasanah and Akhmad Ali Mirza as
writers focus on seventh grade students in junior high school and vocabulary
10
10
score. Meanwhile, in this case, the researcher focused on the second semester
students in the English Education Study Program and Pronunciation.
Then the study by Nawal Aufa (2017) “Using Movie To Increase
Pronunciation” .This research applied a quantitative approach and used a pre
experimental research design including pretest and post-test. This research
took place in UIN Ar Raniry, at the second semester of English Department
students. The data were obtained from both tests and questionnaires to
measure the students‘ ability and perception. The result showed that movie is
effective in improving students‘ pronunciation ability.
The similarities this study with the researcher is both also looking for
the effect of watching English-movie towards pronunciation on students of
the second semester students of English education programs and using the
same test and questionnaire instruments. In addition, the difference in this
study is in the research design. Nawal Aufa as the author uses a pre-
experimental design. Meanwhile, in this case the researcher used an ex post
facto design.
The other research by Sue Ruey Shing & Lim Kun Yin (2014) “Using
Films to Teach Speaking in the ESL Classroom: A Case Study”. The present
study investigates the effectiveness of using films as an approach to teach
English language speaking skills with specific focus on four voice aspects -
pronunciation, intonation, stress and pauses. This study used a quasi-
experimental design where group was named the control group and group b
11
11
was named the experimental group. Thus, the use of English movie only gives
minor impact on students‘ pronunciation. In contrast, the data shows that the
students achieved significant improvement in the aspects of intonation, stress
and pauses after the treatment.
The similarities this research with the researchers is both also looking
for the effects of watching English movie. In addition, the difference in this
study is in the dependent and research design. Sue Ruey Shing & Lim Kun
Yin as the author focus on teach speaking and using quasi experimental
designs. Meanwhile, in this case the researcher focus on pronunciation and
using ex post facto design. And research from Sue Ruey Shing & Lim Kun
Yin states that English movie only have a small impact on students.
The next research by Merita Ismaili (2012) “The Effectiveness of
Using Movies in the EFL Classroom – A Study Conducted at South East
European University”. The study was conducted on a sample of two groups:
an experimental and a control group taught conventionally . The experimental
group watched a novel based movie in English before their reading class,
where they are going to read the same novel (after they had watched the
movie) on the graded reading Books (Oxford University Press). The control
group students were given the same readers, with the same question activities
but without the movie accompanying the books. The results of the study have
shown that significant differences between experimental and control grup of
students on integrated skills, using video incorporated in the teaching
12
12
material. As the main disadvantage in watching the movie is that a movie
must generally reduce events into two hours or so while there is no time
constraint on a novel. Another disadvantage is that movies do not allow
interacting with the plot or characters by imagining them in our minds.
The similarities this research with the researchers also sought the
effect of watching English movie in students. In addition, the difference in
this study is in the research design. Merita Ismaili as the author uses an
experimental design. Meanwhile, in this case the researcher using ex post
facto design. The research from Merita Ismaili found there were some
disadvantages from the results of research that had been done.
And also study by Mustika Ratna Pratiwi (2010) “Improving
Pronunciation Ability Using Cartoon Films”. In this research, the author uses
techniques of collecting the qualitative and quantitative data. The method used
in this research was a collaborative action research. The research data were
collected by using techniques of observation, interview, diary, document, and
test (pre-test and post-test). The data were analyzed through constant
comparative method and descriptive statistics. The research findings prove
that cartoon films could improve the students‘ pronunciation ability.
The similarities of this study with the researchers also sought the
effect of watching English movie towards pronunciation. In addition, the
difference this study is in sample and type of research design. Mustika Ratna
Pratiwi as the author focus on eighth grade students in junior high school and
13
13
uses techniques of collecting the qualitative and quantitative data. The method
used in this research was a collaborative action research. Meanwhile, in this
case the researcher focus on the second semester students and used the
quantitative type and ex post facto design.
Overall, with the previous studies discussed and described above,
there are some similarities and differences between these studies and previous
studies. It can be seen from the variables studied and the design used. Several
previous studies have focused on the effects of watching English-movie
towards Pronunciation which are similar to this study. While the difference
from this study is that researchers use ex post facto designs and researchers
only focus on frequency of watching English-movie towards pronunciation of
EFL learners.
B. Movie
1. Definition of Movie
Movie is a text that contains a series of photographic images that result in
the illusion of motion and action in real life (Marcel Danesi, 2010: 134).
Using videos or movie as a learning resource has received a great deal of
attention from researchers and has been successfully applied to various
educational applications (Yang et al., 2009). Furthermore, the movies have
the influence to have immense audience, in which it motivates the EFL
learners to learn new language easily and do matters so much to the
public. Movies are stories of a far or presently day-by-day survival. For
14
14
people good movies are a way, mainly for adults, movies are to know and
relate to the world in positive ways (Yaseen & Shakir, 2015 p.31).
2. The Effect of English-Movie
English movies are easily accessible to language learners and this activity
in fact is one of the most common activity the learners do during their free
time (Grover et al., 2014; Suh et al., 1999). The idea that leisure activities
can be used as language learning tools can be attributed to the fact that the
stress-free, autonomous environment is conducive for informal learning
and that implicit learning is involved.
Out-of-class learning is informal learning. Benson (2001) defined out-of-
class learning as learning activities that occur outside the classroom which
are self-instructed, naturalistic and self-directed. Chusanachoti (2009)
elaborated that out-of-class English activities or outside of classroom
English activities as non-assignment activities carried out in English
outside of formal classroom setting, academic or non-academic related
done with or without intention to learn English.
Ellis (1994) defined implicit learning as ―acquisition of knowledge about
the underlying structure of a complex stimulus environment by a process
which takes place naturally, simply and without conscious operation‖ (p.
1). Activities like watching movies provide opportunity for implicit
learning to occur. Learners are attracted to activities that involve
entertainment and watching movie is one of such activity (Hyland, 2004).
15
15
It has been observed in several studies that movies can improve learners‘
language skills and other aspects of language acquisition. A study in Japan
involving undergraduate students from five universities were conducted in
order to test the strategy of English learning through an English movie and
Reader‘s Theatre assignments (Inage et al., 2013). The study reveals that
the students‘ enjoyment of the movie increased their motivation to learn
the language. The participants of the study also reported that this activity
had helped improve their pronunciation and vocabulary. However, the
study did not provide data on whether the students‘ English proficiency
had increased or not.
A study conducted to examine students‘ English learning difficulties and
the ways they solved these difficulties also reveals the role of watching
movies as a learning tool (Nooreiny & Indira Malani, 2015). The study,
conducted in Universiti Kebangsaan Malaysia involving 30 undergraduate
students majoring in English Language Studies shows that one method the
students use to overcome their learning difficulties is through out-of-class
activities including watching western movies. Positive attitudes and high
motivation that comes with doing these activities were attributed as the
helping factors.
The roles of motivations and attitudes are also explored by Hussein and
Parilah (2014) in a study conducted in the same university involving 30
undergraduate students. It is discovered that a majority of the students
16
16
have positive attitudes regarding watching English movies for learning
English. It is explainedthat the students developed positive attitudes
because of their interest in the American culture and therefore are
motivated to learn the language for integrative purpose.
Meanwhile, a case study conducted among four English Education
students in Thailand to explore their engagement in English activities
outside of classroom has revealed that engagement in English movies is
beneficial for vocabulary acquisition as well as the learning of colloquial
expression and slang—the conversational aspect of English that is not
usually taught in a formal classroom setting (Chusanachoti, 2009).
Moreover, movies also helped learners to contextualize words because
characters in movies talk about various topics in various context. This
study also revealed that movies contribute to the learning of pronunciation
and different English accents.
Based on these studies, it could be observed that the studies on the use of
movies as a language learning tool, whether it is for in-class activities or
out-of-class activities, exist. Generally, movies are able to facilitate
language acquisition which supports Krashen‘s view exposure to the
language can help in the subconscious acquisition of the language
meaning. In addition, this study also attempts to address the lack of
research conducted in current research site.
3. Frequency of Watching English-Movie
17
17
The frequency of watching movies is how high or how often someone is
watching an English film. The frequency of watching this film will be
measured using a questionnaire. Questionnaires will contain questions
about how often subjects watch English films in a week. Subjects are
asked to choose one of the alternative answers provided. Each alternative
answer contains how often to watch the film and the perception of
watching to the influence of the pronunciation. The higher the number of
English language films chosen by the subject means the higher the
frequency of watching English films, and conversely the lower the number
of watching English films chosen by the subject means the lower the
frequency of watching movies.
4. Watching English-Movie
Watching movies are an enjoyable source of entertainment and language
acquisition. Watching movies may serve as a bridge between learning
skills and language objectives (output) (Merita Ismaili, 2013:122). In
addition, watching movies provide interesting and motivating clues to
accompany audio or written inputs, therefore it supports comprehension
and production of foreign language input/output (Hanley, et al., 1995;
Herron, et al., 1995; Wen, 1989; Weyers, 1999). Furthermore, watching
movies provide language learners with the opportunity to view the social
dynamics of communication as native speakers interact in authentic
settings (Herron, et al., 1995; Lonergan, 1992; Kerridge, 1982; Singer &
18
18
Singer, 1998; Swaffar & Vlatten, 1997; Wellman, Keniston & Westby,
1978; Coniam, 2001).
C. Pronunciation
1. Definition of Pronunciation
Pronunciation is viewed as a sub-skill of speaking. Generally, if we want
to change the way a learner pronounces words, we have to change the way
they think about the component sounds of those words. This goes not just
for individual sounds, but for bigger elements of speech, such as syllables,
stress patterns and rhythm. Despite this, the teaching of pronunciation
remains largely neglected in the field of English language teaching
(Mohammad Reza Ahmadi, 2011 p.74).
It is important at this point in time to make a distinction between
speaking and pronunciation as it is sometimes wrongly applied
interchangeably. Due to the time restrictions on most courses for EFL,
often the case of pronunciation teaching receives relatively the least
attention. Gilbert (1995) stated that the skills of listening comprehension
and pronunciation are interdependent, if people can‘t hear English well;
they are cut off from the language if they can‘t be understood easily, and
they are cut off from conversation with native speakers.
2. The Goals of English Pronunciation
Intelligibility is an ideal goal for many EFL learners and the
goal of these learners is to be understood in conversation but there are
19
19
other learners who wish to communicate with native speakers.
According to Fraser (2000), learners should be able to speak English
with their favorite accent which is easily understandable to an English
speaker. Jenkins (2002) stated that learners need to be intelligible to
both native speakers and non-native speakers. Teachers should help
learners become both intelligible and easy to understand.
EFL learners cannot completely pronounce English words
exactly like native speakers. Intelligibility is an ideal goal for most
learners although some of them like to pronounce more native-like
than others for specific reasons (Abercrombie, 1991).
Yates and Zielinski (2009) said that ‗intelligibility‘ itself is not
an ideal aim. What is intelligible is dependent on the listener. What
speakers interact is just as important as what they say and do.
Listeners have their own attitudes, skills, experience, and biases that
can impact their views about intelligibility. These involve familiarity
with the speaker‘s accent, ability in comprehending speakers from
various levels, and attitudes towards the speaker and the speaker‘s
racial group. Thus, every listener judges the understandability of the
same speaker differently due to some factors. These involve how kind
they are to the speaker and how familiar they are with the speaker.
How much they already know about what is being talked about is also
important.
20
20
James (2010) and Pourhosein Gilakjani (2012) stated that
speakers have understandable pronunciation when other persons can
understand what they say and the speaker‘s English is good to listen
to; that is, the speaker is ‗comfortably intelligible.‘ The researchers
continued that for some learners, the goal of learning pronunciation is
to speak like native speakers. This may be a valuable goal for learners,
it should not be the goal of teachers who want to improve their
learners‘ pronunciation and confidence. Therefore, acceptable
pronunciation is not to force learners to have an American or British
accent, but teachers should encourage their learners to speak English
clearly and understandably.
3. Factors Affecting The Learning of Pronunciation
a) Accent
An accent is ―the cumulative auditory effect of those
features of pronunciation that identify where a person is from,
regionally or socially‖ (Crystal, 2003, p. 3). Many adult
learners of English have foreign accents that identify them as
nonnative speakers. Some linguists support the idea, known as
the Critical Period Hypothesis, that a learner needs to begin
learning the language before age 7 to develop native-like
pronunciation (Lenneberg, 1967). However, more recent
research suggests that environment and motivation may be
21
21
more important factors in the development of native-like
pronunciation than is age at acquisition (Marinova-Todd,
Marshall, & Snow, 2000). An understanding of the features of
learner accents and their impact on intelligibility can help
teachers identify and address characteristics of learner
pronunciation (Derwing & Munro, 1997). The primary aim is
that students be understood. Good pronunciation is needed for
this, but a ―perfect accent‖ is not (Harmer, 1991).
b) Stress, Intonation and Rhytm
Munro and Derwing (1999) observed that even heavily
accented speech is sometimes intelligible and that prosodic
errors (i.e., errors in stress, intonation, and rhythm) appear to
affect intelligibility more than do phonetic errors (i.e., errors in
single sounds). For this reason, pronunciation research and
teaching focus both on the sounds of language (vowels and
consonants) and on supra-segmental features—that is, vocal
effects that extend over more than one sound—such as stress,
sentence and word intonation, and speech rhythm (Crystal,
2003; Low, 2006; Munro & Derwing, 1999). All syllables are
nearly equally stressed, vowel reduction does not occur, and all
syllables appear to take the same amount of time to utter.
22
22
A more accurate description is that they are stress based
or syllable based; that is, they are not completely in one
category or the other, but tend to have more stress-timed or
syllable-timed features (Low, 2006). Stress-based rhythm is
achieved through the presence of reduced vowels for
unstressed syllables in a sentence. Function words (e.g.,
articles, helping verbs, prepositions) typically have reduced
vowels instead of full ones, and the reduced vowel version is
known as a weak form. The distinction between stress- and
syllable-based languages is important, especially if an adult
English language learner speaks a first language that is
different rhythmically from stress-based British or American
English. An understanding of whether a learner‘s first language
is stress based or syllable based will help a teacher plan
appropriate pronunciation exercises. He determined that when
word stress is erroneously shifted to an unstressed syllable,
without a change in vowel quality, utterances are significantly
less intelligible than when only vowel quality is manipulated.
Native and nonnative English speakers responded similarly
when judging the intelligibility of words with misplaced word
stress. O‘Brien (2004) reported the results of research on the
importance of stress, intonation, and rhythm for a native-like
23
23
accent in German. It was found that the native speakers
focused more on stress, intonation, and rhythm than on
individual sounds when rating speech samples as native-like.
Implications of this research for classroom instruction are that
teachers need to spend time teaching learners the rules for
word stress, intonation, and rhythm in English, as well as
focusing on individual sounds that may be difficult for the
learners in their classes.
c) Motivation and Exposure
Along with age at the acquisition of a language, the
learner‘s motivation for learning the language and the cultural
group that the learner identifies and spends time determine
whether the learner will develop native-like pronunciation.
Research has found that having a personal or professional goal
for learning English can influence the need and desire for
native-like pronunciation (Bernaus, Masgoret, Gardner, &
Reyes, 2004; Gatbonton et al., 2005; Marinova-Todd et al.,
2000; Masgoret & Gardner, 2003). The review by Marinova-
Todd et al., (2000) of research on adult acquisition of English
concluded that adults can become highly proficient, even
native-like speakers of second languages, especially if
motivated to do so. Moyer (2007) found that experience with
24
24
and positive orientation to the language appears to be
important factors in developing native-like pronunciation.
Therefore, in addition to focusing on pronunciation and
accent in class, teachers should encourage learners to speak
English outside the classroom and provide them with
assignments that structure those interactions.
d) Attitude
In a study on pronunciation accuracy of university
students studying intermediate Spanish as a foreign language,
Elliot (1995) found that subjects‘ attitude toward acquiring
native or near-native pronunciation as measured by the
Pronunciation Attitude Inventory (PAI), was the principal
variable in relation to target language pronunciation. In other
words, if the students were more concerned about their
pronunciation of the target language, they tended to have better
pronunciation of the target allophones (Elliot, 1995). This
study echoed earlier research done by Suter (1976), which
found that students who were ―more concerned‖ about their
pronunciation (p. 249) had better pronunciation of English as a
Second Language (Elliot, 1995). When discussing the attitude
of the second language learners in relation to their
pronunciation and second language acquisition, it is necessary
25
25
to note the work done by Schumann (1986) on acculturation
and its role in the process of language learning.
e) Personality
Non-linguistic factors related to an individual‘s
personality and learning goals, attitude towards the target
language, culture, native speakers, and type of motivation
which are beyond the teacher‘s control (Miller, 2003), all have
their share in the development of pronunciation skills. In
addition, the degree of exposure to and use of the target
language can support or impede pronunciation skills
development. For example, learners who are out going and
confident and get involved in interactions with native speakers
are liable to practice their foreign language pronunciation
(Avery & Ehrlich, 1992).
Conversely, some learners feel uncomfortable trying
out new speech rhythm and melody patterns (Miller, 2003),
while others feel stupid pronouncing ―weird‖ sounds, and with
time, they decide that it is futile and impossible to learn
English pronunciation (Laroy, 1995). In this respect, Miller
(2003) believes that changing – and not changing – speech
patterns is affected by how much responsibility the student

26
26
takes, how much the student practices outside of class, and
how ready the student is.
f) Mother Tongue Influence
Avery and Ehrlich (1992) claim that the first language
becomes a second language and is likely to cause foreign
accents. Mispronounced words by native speakers reflect the
influence of the sounds, rules, emphasis, and intonation of their
native language.
These researchers concluded that the transfer from the
learners‘ native language influenced their production of
English-like stress alternation across a phrase. In this respect,
Avery and Ehrlich point out that the sound system of the native
language can influence the learners‘ pronunciation of a target
language in at least three ways.
First, when there is a sound in the target language
which is absent from the learners‘ native sound inventory, or
vice versa, learners may not be able to produce or even
perceive the sound(s). Second, when the rules of combining
sounds into words (i.e., phonotactic constraints/rules) are
different in the learners‘ mother tongue from those of the target
language, they cause problems for learners because these rules
are language specific as they vary from one language to
27
27
another. Thirdly, since the rhythm and melody of a language
determine its patterns of stress and intonation, learners may
transfer these patterns into the target language.
In summary, while there are other factors that influence
the learner‘s L2 pronunciation acquisition (Graham, 1994), the
factors reviewed above may help ESL/EFL teachers consider
what learners from different backgrounds are likely to face
when learning English as a second language. These factors
would enable the teachers to identify the difficulties in the
pronunciation of the target language experienced by non-native
speakers in order to help them overcome their foreign accent
and consequently improve their pronunciation. In addition,
they would also enable teachers to provide efficient
pronunciation instruction and design their teaching
methodology according to student‘s need.
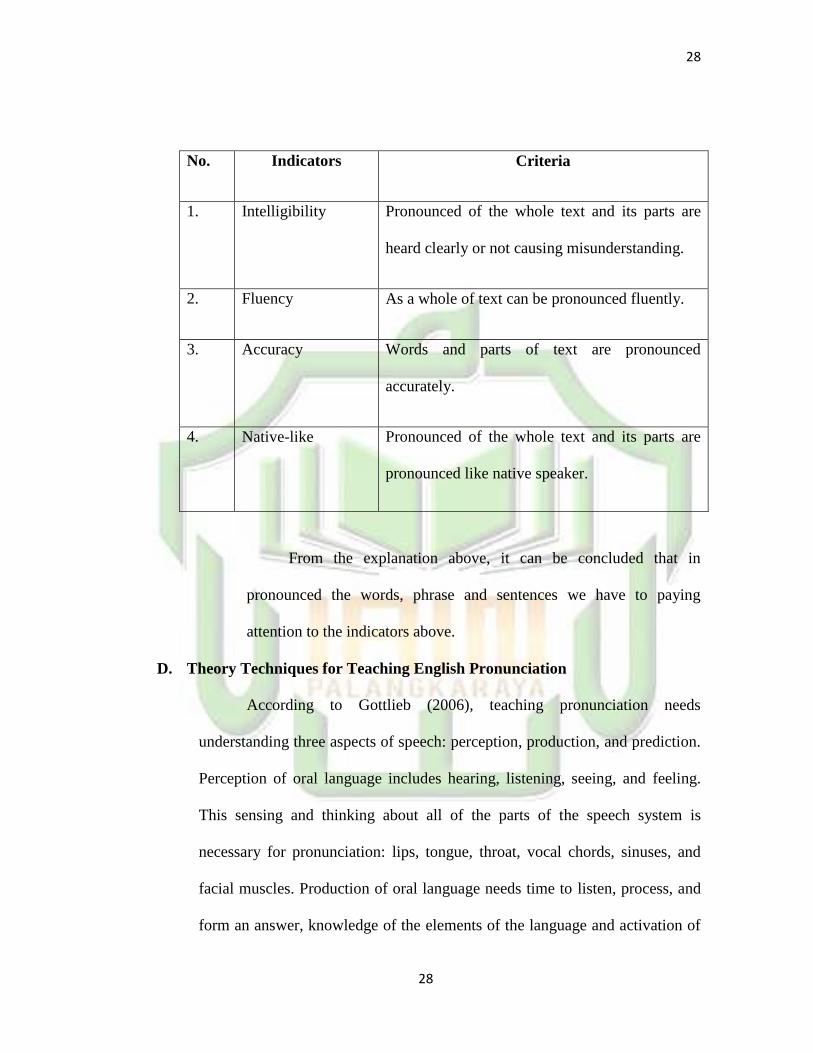
4. The Indicators Pronunciation
In pronunciation we have to paying attention to the indicators of
pronunciation. According to Djiwandono (2008, p. 124 - 125) There
are four indicators of pronunciation, there are; intelligibility, fluency,
accuracy and native-like.
Table 2.1 Indicators Pronunciation
28
28
No. Indicators Criteria
1. Intelligibility Pronounced of the whole text and its parts are
heard clearly or not causing misunderstanding.
2. Fluency As a whole of text can be pronounced fluently.
3. Accuracy Words and parts of text are pronounced
accurately.
4. Native-like Pronounced of the whole text and its parts are
pronounced like native speaker.
From the explanation above, it can be concluded that in
pronounced the words, phrase and sentences we have to paying
attention to the indicators above.
D. Theory Techniques for Teaching English Pronunciation
According to Gottlieb (2006), teaching pronunciation needs
understanding three aspects of speech: perception, production, and prediction.
Perception of oral language includes hearing, listening, seeing, and feeling.
This sensing and thinking about all of the parts of the speech system is
necessary for pronunciation: lips, tongue, throat, vocal chords, sinuses, and
facial muscles. Production of oral language needs time to listen, process, and
form an answer, knowledge of the elements of the language and activation of
29
29
background knowledge. Prediction of oral communication needs comes
through experience different contexts. Through teaching prediction strategies,
EFL learners progress rapidly to become independent learners.
The history of language teaching has limited the
speaking/pronunciation part to the drill or situational responsive answers.
New methods have focused on accurate speaking activities focused on doing
real-world speaking activities with attention to a single segmental or spelling,
phrasing, rhythm, or tone element of pronunciation (Gottlieb, 2006).
Cook (2001) suggested a number of techniques for teaching and
learning English pronunciation. They are use of phonetic transcript, imitation,
discrimination of sounds, and communication. Schmitt (2002) mentioned
some ways of learning English pronunciation like elicited mechanical
production, ear training for sound contrast, and sounds for meaning contrasts.
According to Penny Ur (1996), the goal of pronunciation is not to
obtain a complete mimicry of native accent but to make the learner to
pronounce correctly to be understandable to other speakers. She stated some
methods of pronunciation instruction. They are imitation of teachers or
recorded models of sounds, recording of learners‘ speech and contrast with
native model, systematic description and training, imitation exercises,
repetition of sounds, different repetition of drills, learning dialogues, rhythms,
tongue twisters, and self-correction by hearing to recordings of own speech.
30
30
According to Harmer (2006), learners should be given additional
information about spoken English and teachers should aid them to gain the
aim of comprehensibility. Harmer emphasizes intelligibility rather than
perfection as the main goal of pronunciation teaching. Harmer said that the
techniques of pronunciation instruction are focusing on individuals sound,
minimal pair drill, pronunciation games, sound waves practice, and learning
connected speech. Thorn bury (2008) demonstrated that intelligibility is vital
in English pronunciation. He offers some techniques of teaching
pronunciation such as preparing cards of rhyming words, telling story and
noticing learners‘ mistakes and improving them, and presenting speaking
exercises.
According to Cheng (1998), teachers can use the following strategies
to teach pronunciation:
a) Meaningful materials: Teachers can use real materials for
practicing linking, rhythm, stress, or intonation. Consequently,
learners become active persons in their team work.
b) Using movies or songs, games, and tongue twisters: These
activities can enhance learners‘ stimulation in pronunciation
classes because it is an important factor in pronunciation.
c) Evaluating learners‘ improvement: Evaluating advancement is a
significant factor in keeping learners‘ motivation.
31
31
Lin, Fan, and Chen (1995) indicated some strategies to teach
pronunciation. They are intonation, stress and rhythm, consonants, and
vowels. Noll and Collins (2002) mentioned certain strategies in pronunciation
instruction. They are finger correction strategies, mime, and gesture strategies.
32
CHAPTER III
RESEARCH METHOD
In this chapter, the researcher described; research design, variable of the
study, population and sample, research instrument, research instrument, instrument
reliability, instrument validity, techniques of data analysis, data collection procedure,
and data analysis procedure.
A. Research Design
The design of this study was Ex-post Facto Research. Ex-post facto
research is similar to an experiment, except the researcher did not manipulate
the independent variable, which has already occurred in the natural course of
events. The researcher simply compared groups differing on the pre-existing
independent variable to determine any relationship to the dependent variable.
Because there is no manipulation or control of the independent variable, one
must be very careful regarding the conclusions that are drawn about any
observed relationship (Ary Donald, chapter 12 p.332).
The study used quantitative approach. Related to this, Aliaga and
Gunderson in Daniel stated that ―quantitative research is explaining
phenomena by collecting numerical data that are analyses using
mathematically based methods‖. In quantitative research, the investigator
identifies a research problem based on trends in the field or on the need to
explain why something occurs (Creswell, chapter 1 p.13). Ex post facto
research is conducted after variation in the variable of interest has already
33
33
been determined in the natural course of events. This method is sometimes
called causal comparative because its purpose is to investigate cause-and-
effect relationships between independent and dependent variables. Researches
use it in situations that do not permit the randomization and manipulation of
variables characteristic of experimental research. Thus, much of the basic
rationale for experimental and ex post facto is the same. They both investigate
relationships among variables and test hypotheses (Ary Donald, chapter 12
p.332).
This study knows the effects of frequency in watching English-movie
towards the pronunciation of EFL learners at IAIN Palangka Raya on
academic year 2018.
B. Population and Sample
1. Population
Population is a group of individuals have the same characteristics
(Cresswell, p.142). The study population included all 2018 academic
English Education Study Program students had completed the
'Pronunciation Practice' course in the first semester. In addition, the
number of active students in the English Education Study Program 2018
academic year was 97 students.
2. Sample
Samples are subsets of the population that represent the entire
population. This means that it requires that all relevant population
34
34
characteristics must be known. Subgroups of the target population that
researchers plan to study to be generalized about the target population
(Creswell, 2012, p. 142).
The sample is the process of selecting a portion of the population to
represent the entire population known as the sample (Ary, Jacobs,
Razavieh & Sorenson, 2010, p.148). The sample of this study is the
second semester students of English language study programs at IAIN
Palangka Raya on academic year 2018. Arikunto said that, "if the total
population is more than 100, it is better to take 25% or more" (Arikunto,
2006, p.134). The sampling technique used in this study was random
sampling.
Based on the explanation above, the sample was taken as much as
85% of 97 students. Then a sample of 82 students consisted of
representatives of 4 classes. The steps in simple random sampling consist
of the following:
a.) Determine the population.
b.) List of all members of the population.
c.) Selecting samples using a procedure where there is a real
opportunity to determine the mines taken by the members in the
list for the sample (Ary, Jacobs, Razavieh & Sorenson, 2010,
p.150).
35
35
C. Research Instrument
In this study, data collection was conducted by questionnaire and
pronunciation test. Data needs to prove and support this study. By this
collecting data, the researcher found out the effect of frequency in watching
English-movie towards the pronunciation of EFL learners at IAIN Palangka
Raya. There are instruments used in this study, namely questionnaire and
pronunciation test.
1. Questionnaire
The researcher gave a questionnaire to the research sample which
is the second semester student of the English Education Study Program to
find out how often students watch English-movie and use movie to
practice pronunciation. A questionnaire is defined as a document
containing questions and other types of items designed to solicit
information appropriate to analysis (Babbie, 1990:377).
This study adapted the questionnaire from Merita Ismaili (2013)
and Nawal Aufa (2017) with some modifications to adjust to the
condition of the students in the study. Before distributing the
questionnaire to the study sample, the questionnaire was tested using
SPSS 20 software to check the validity and reliability of the
questionnaire.
In addition, the validity test is aimed to measure how far the
instrument is appropriate to test what will be tested. In consequences,
36
36
before distributing the questionnaire to sample of the study, researcher
has to test the validity to measure whether the instrument is appropriate
to be distributed. Besides, researcher also tests the reliability of
instrument. Reliability is aimed to measure the consistency of instrument
if it is conducted twice or more. It means that reliability test should be
conducted in order to make the instrument reliable and appropriate to be
distributed to the sample of the study.
To see the validity and reliability test of instrument, the researcher
has distributed questionnaire which consisted of 15 items to 23 students
of English Education Study Program on academic year 2018. The result
of questionnaires was calculated by using software of SPSS 20. The
researcher used the level of significance 0.05 to find the valid items.
Based on the results of validity test, the questionnaire consisted of
15 items. Questionnaire items can be considered valid if r- value is higher
than r-table. R table is 0.413. Therefore, the results show that 15 items
are valid. And the results of reliability test, researcher obtained
Cronbach's Alpha 0.945. Therefore the data criteria can be determined if
the reliability coefficient (r¹) > 0.6. The reliability test results are 0.945,
or (0.945 > 0.6) therefore, it can be concluded that the questionnaire is
reliable.
In addition, questionnaires have been distributed to research
samples in the second semester students of the English Education Study
37
37
Program on academic year 2018, IAIN Palangka Raya. The questionnaire
consisted of 15 items that described the characteristics of questions such
as how often to watch English-movie and practice pronunciation. The
questionnaire consisted of frequency and attitude in watching English-
movie. Because this questionnaire aims to test positive statements;
Therefore the answer can be printed on the Likert scale as follows:
a. Very Often/Strongly Agree = 4
b. Often/Agree = 3
c. Seldom/Disagree = 2
d. Never/Strongly Disagree = 1
Therefore, after distributing the questionnaire to the research
sample, the researcher calculated all student questionnaires using Excell
2010 and SPSS 20 to find out the total score of the questions as
frequency and attitude in watching British film students. Based on the
Likert scale above, it is possible that the highest score from the
acquisition of the questionnaire is divided into two namely 20 and 60.
Because the total questionnaire frequency is 5 items then 5 X 4 (highest
statement response) = 20 and the total attitude questionnaire is 10 items
then 10 X 4 ( highest statement response) = 40. The questionnaire
obtained will be added up based on their responses from scores 1, 2, 3
and 4 in each item.
38
38
2. Pronunciation test
The type of test used is a reading test to collect data, namely the
pronunciation test. The writer adopts from English Speeches about 'Start
Helping One Person' which the original speaker is Rihanna as a test they
will read and when they read the recorded voice to be measured. Many
researchers in previous research relied on recording as a tool to collect
their data for example (Ma; Lin, 1994)
This test is an individual test. By using individual tests, researcher
can obtain complete and accurate information about the grading system.
In this study, the main data was used to measure the English
pronunciation skills of students of the English language education study
program at IAIN Palangka Raya on academic year 2018. The assessment
rubric used by researcher is as follows, which contains four components
that such as intelligibility, fluency, accuracy and native like.
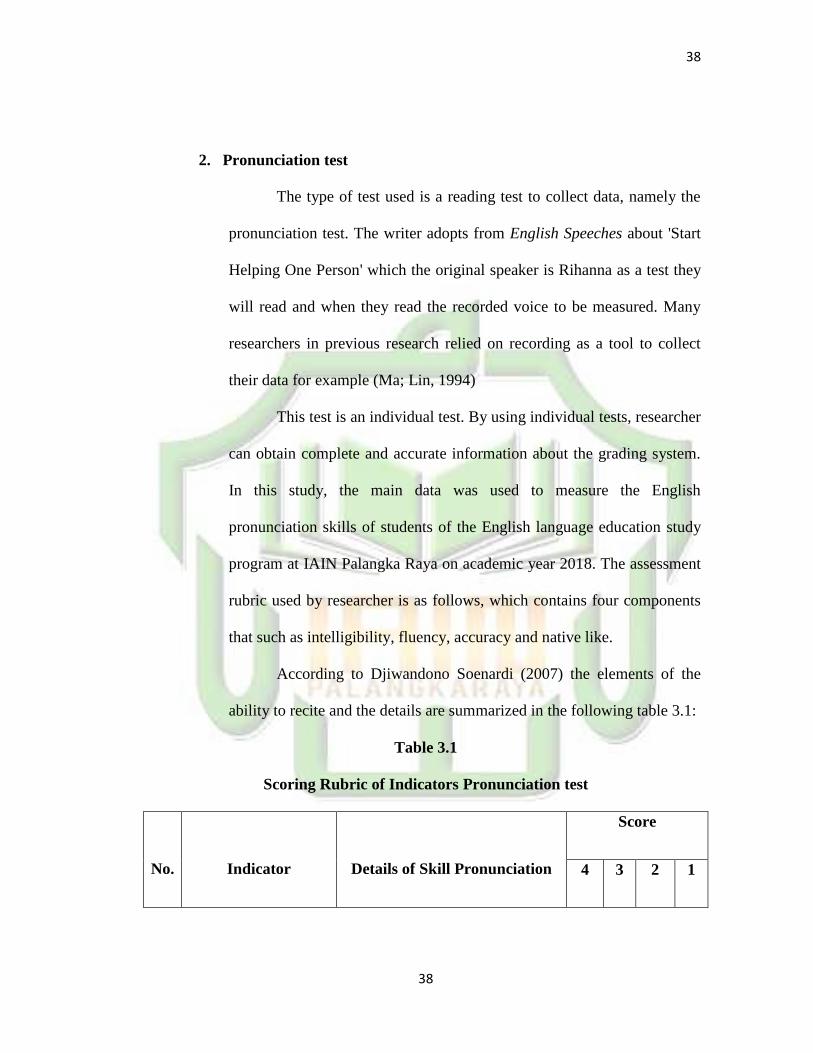
According to Djiwandono Soenardi (2007) the elements of the
ability to recite and the details are summarized in the following table 3.1:
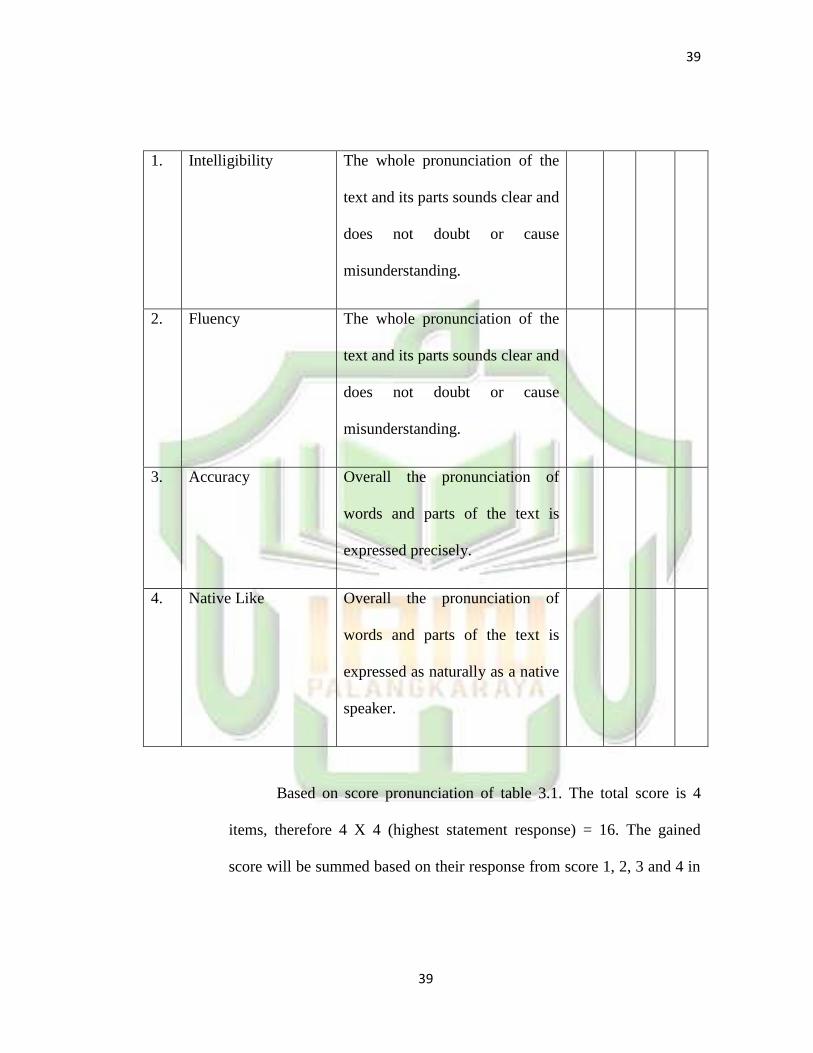
Table 3.1
Scoring Rubric of Indicators Pronunciation test
No.
Indicator
Details of Skill Pronunciation
Score
4 3 2 1
39
39
1. Intelligibility The whole pronunciation of the
text and its parts sounds clear and
does not doubt or cause
misunderstanding.
2. Fluency The whole pronunciation of the
text and its parts sounds clear and
does not doubt or cause
misunderstanding.
3. Accuracy Overall the pronunciation of
words and parts of the text is
expressed precisely.
4. Native Like Overall the pronunciation of
words and parts of the text is
expressed as naturally as a native
speaker.
Based on score pronunciation of table 3.1. The total score is 4
items, therefore 4 X 4 (highest statement response) = 16. The gained
score will be summed based on their response from score 1, 2, 3 and 4 in
40
40
each item. Will be calculated by the following formula
.
3. Instrument Validity
Validity is the most important consideration in developing and
evaluating measuring instruments. Historically, validity was defined as the
extent to which an instrument measured what it claimed to measure. The
focus of recent views of validity is not on the instrument itself but on the
interpretation and meaning of the scores derived from the instrument (Ary
Donald, p.225). Spolky states that there are several types of validity:
a. Content Validity
This kind of validity depends on a careful analysis of the
language being tested and of the particular course objectives. The test
should be so constructed as to contain a representative sample of the
course the relationship between the test items and the course
objectives always being apparent. There is a strong tendency
especially in multiple-choice testing to test only those areas of the
language which lend themselves readily to testing (Heaton, 1974:
p.160).
b. Face Validity

41
41
Face validity is a term sometimes used in connection with a
test‘s content. Face validity refers to the extent to which examinees
believe the instrument is measuring what it is supposed to measure.
The question is, ―on the face of it,‖ does the test appear to be valid?
Although it is not a technical form of validity, face validity can be
important to ensure acceptance of the test and cooperation on the part
of the examinees (Ary Donald, p.228).
c. Construct Validity
A test is said to have content validity if its content constitutes a
representative sample. It refers to the extent to which the instrument
represents the content of interest. In the other words, it is concerned
with the question how well does the content of the instrument
represent the entire universe of content which might be measured
(Ary, Jacobs, Razavieh & Sorenson, 2010, p.410-411).
4. Instrument Reliability
The reliability of a measuring instrument is the degree of
consistency with which it measures whatever it is measuring. This quality
is essential in any kind of measurement. People who use such measuring
instruments must identify and use techniques that will help them
determine to what extent their measuring instruments are consistent and
reliable (Ary Donald, p.236).
42
42
In this case, to score composition as fairly and consistently as
possible, the researcher uses inter-rater method (test of reliability). Inter-
rater reliability is a procedure used when making observations of behavior.
It involves observations made by two or more individuals of an
individual‘s or several individuals‘ behavior. The observers record their
scores of the behavior and then compare scores to see if their scores are
similar or different. Because this method obtains observational scores
from two or more individuals, it has the advantage of negating any bias
that any one individual might bring to scoring (Creswell, p.161).
D. Data Collection Procedure
The researcher used interval data. Interval data is a data of
measurement that orders objects or events and has points equidistant from
one another (Ary, Jacobs, Razavieh & Sorenson, 2010, p.102). To collect
the objective data the writer applied the steps as follows:
1. The researcher observes the class.
2. The researcher gave a questionnaire to students.
3. The researcher gave score to the students‘ answer
4. The researcher gave a pronunciation test to students.
5. The researcher analyzes the data obtained using linear regression.
6. The researcher interprets the results of the analysis.
43
43
7. The researcher concludes the ability of English student
pronunciation, whether there is influence from watching English
movies or not, it is based on the data obtained.
E. Data Analysis Procedure
This research used software of SPSS 20 to analyze the data. After
getting the data from questionnaire and pronunciation test, furthermore it
is important to analyze the data to examine the hypothesis. This research
used linear regression to investigate between the effect of frequency in
watching English-movie and students‘ pronunciation. Hence, linear
regression is regression analysis which is used to learn the functional
relationship between the variables. Therefore, linear regression is
appropriate to be used to test the causal relationship between two
variables. Basically, linear regression is different with linear correlation;
linear correlation is used to test between the relationship of two variables
and the degree of variable X and Y can be changed their position or it can
be said it is a vice versa relationship. While the linear regression, the
degree of the variables X and Y cannot be changed or it can be said it is a
causal relationship. Furthermore, this study used F-test to test the
hypothesis. F-test is used to examine the influence of independent variable
and dependent variable.
44
44
After obtaining the questionnaire and pronunciation test, then the
writer will analyze data of questionnaire score and result of pronunciation
test score into some steps:
1. Analyze the score of students‘ questionnaire frequency in watching
English-movie towards pronunciation and then input them in the
SPSS 20
2. Input the score of students‘ result pronunciation test into SPSS 20
3. Decide the Mean value from variable 1 (questionnaire frequency in
watching English-movie towards pronunciation)
4. Decide the Mean value from variable 2 (students‘ result of
pronunciation test).
5. Decide the maximum and minimum score of frequency in
watching English-movie towards pronunciation and result of
pronunciation test.
6. Decide the mode, median and the sum of frequency in watching
English-movie towards pronunciation and result of pronunciation
test.
7. Decide the interval, frequency, and percentage of students‘
frequency in watching English-movie towards pronunciation.
8. Decide the interval, frequency, and percentage of students‘ result
pronunciation test.
45
45
9. Examine the normality test of frequency in watching English-
movie towards pronunciation.
10. Examine the homogeneity of both variables: frequency in watching
English-movie towards pronunciation and result pronunciation
test
11. Examine linear regression to test the hypothesis at SPSS 20
46
46
CHAPTER IV
RESULT FINDINGS AND DISCUSSION
In this chapter, the researcher discusses the research findings about students‘
frequency in watching English-movie and students‘ pronunciation test. The first step,
the researcher discusses the description of students‘ questionnaires scores. Then the
researcher shows the students‘ score of pronunciation test. Hence researcher describes
the data analysis which consists of the normality and homogeneity test. Furthermore,
researcher reports the result of linear regression which examines the hypothesis of the
study.
A. Data Presentation
The research data consists of questioning as a frequency in watching
English-movie as an independent variable and Pronunciation as a dependent
variable. Data has been collected through a questionnaire to determine the
frequency in watching English-movie and the results of student recording
pronunciation tests obtained based on scores from inter-rater. The description
of the data shows the mean, median mode, minimum and maximum frequency
in watching English-movie and the results of student's recording
pronunciation test. All data descriptions will be discussed in the following
discussion comprehensively.
1. Questionnaires
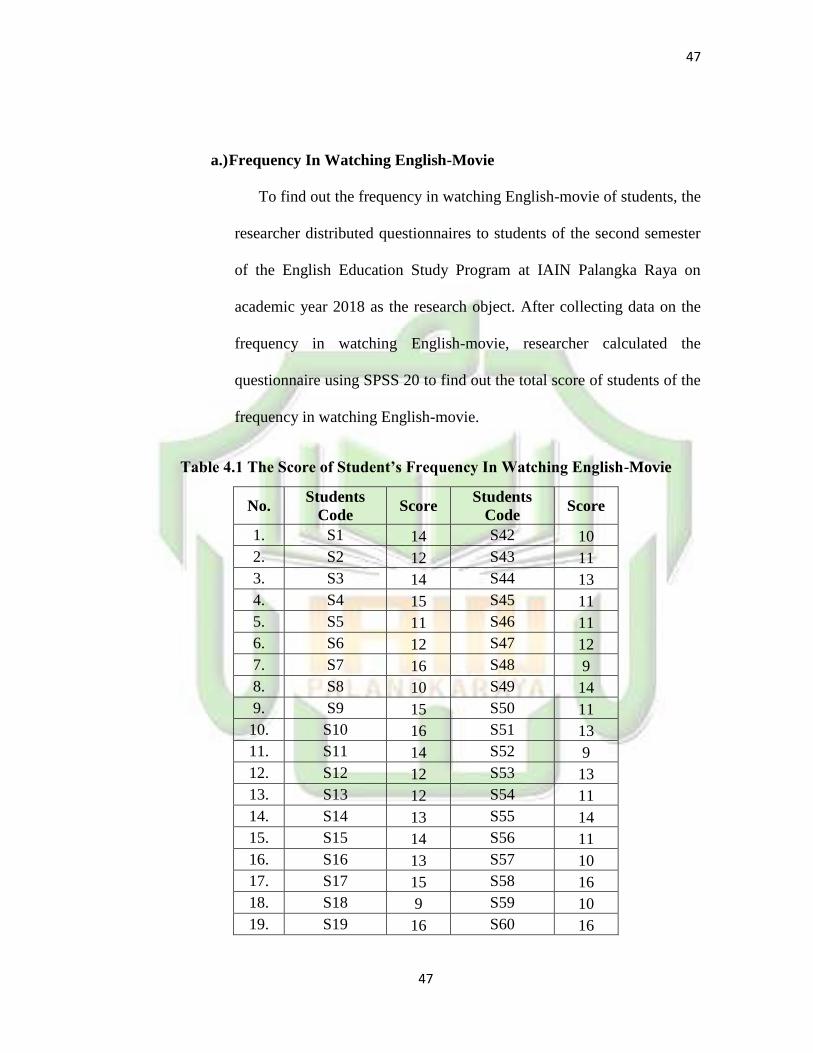
47
47
a.) Frequency In Watching English-Movie
To find out the frequency in watching English-movie of students, the
researcher distributed questionnaires to students of the second semester
of the English Education Study Program at IAIN Palangka Raya on
academic year 2018 as the research object. After collecting data on the
frequency in watching English-movie, researcher calculated the
questionnaire using SPSS 20 to find out the total score of students of the
frequency in watching English-movie.
Table 4.1 The Score of Student’s Frequency In Watching English-Movie
No. Students
Code Score
Students
Code Score
1. S1 14 S42 10
2. S2 12 S43 11
3. S3 14 S44 13
4. S4 15 S45 11
5. S5 11 S46 11
6. S6 12 S47 12
7. S7 16 S48 9
8. S8 10 S49 14
9. S9 15 S50 11
10. S10 16 S51 13
11. S11 14 S52 9
12. S12 12 S53 13
13. S13 12 S54 11
14. S14 13 S55 14
15. S15 14 S56 11
16. S16 13 S57 10
17. S17 15 S58 16
18. S18 9 S59 10
19. S19 16 S60 16
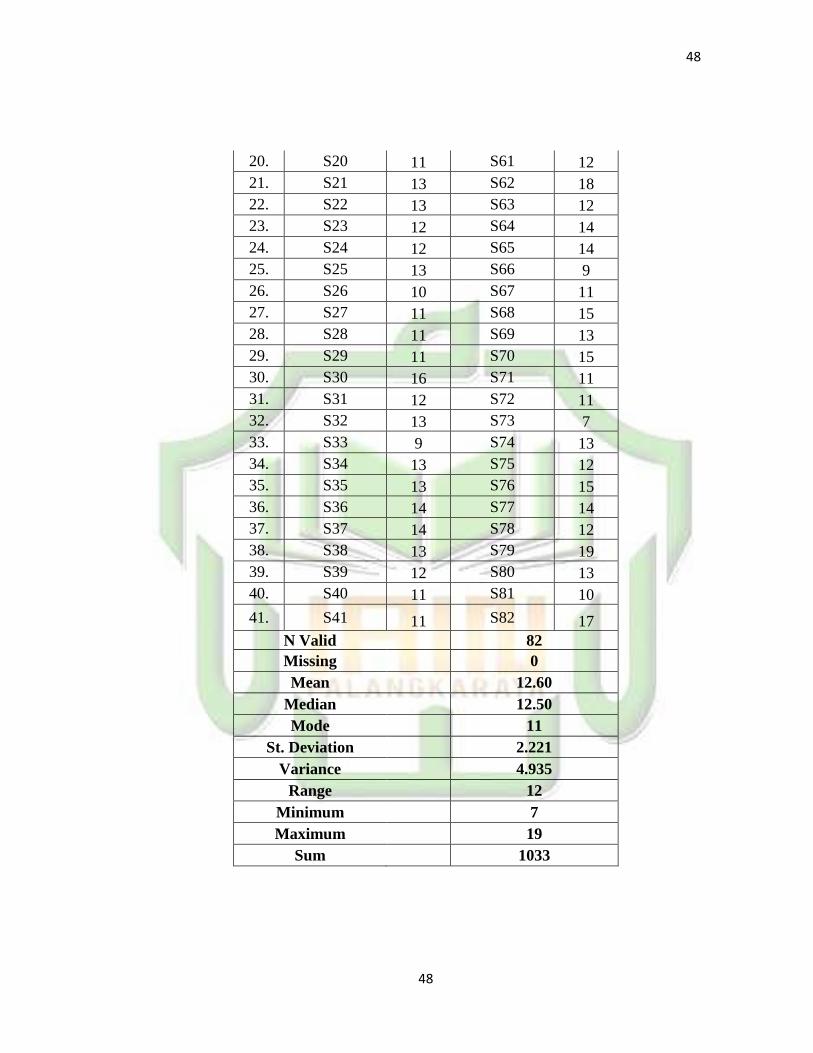
48
48
20. S20 11 S61 12
21. S21 13 S62 18
22. S22 13 S63 12
23. S23 12 S64 14
24. S24 12 S65 14
25. S25 13 S66 9
26. S26 10 S67 11
27. S27 11 S68 15
28. S28 11 S69 13
29. S29 11 S70 15
30. S30 16 S71 11
31. S31 12 S72 11
32. S32 13 S73 7
33. S33 9 S74 13
34. S34 13 S75 12
35. S35 13 S76 15
36. S36 14 S77 14
37. S37 14 S78 12
38. S38 13 S79 19
39. S39 12 S80 13
40. S40 11 S81 10
41. S41 11 S82 17
N Valid 82
Missing 0
Mean 12.60
Median 12.50
Mode 11
St. Deviation 2.221
Variance 4.935
Range 12
Minimum 7
Maximum 19
Sum 1033
49
49
Table 4.1 which represents the frequency in watching English-movie
of students show that the highest score is 19 and the lowest score of watching
English-movie is 7. It can be concluded that there is a significant difference
between the highest and lowest scores of watching English-movie with a
range of 12. Then the sum score of the frequency in watching English-movie
is 1033. Meanwhile the mean score of the frequency of watching English-
movie is 12.60, it means that the mean score frequency in watching English-
movie is enough. Table 4.1 also shows that the median score of watching
English-movie is 12.50. In addition, the mode score is 11. In the mode score,
most students get 11 scores; that means there are quite a lot of students often
watch English-movie and using to practice pronunciation. Then, the result of
standard deviation was 2.221. The result of variance was 4.935. All of the
above data descriptions are calculated using SPSS 20 descriptive statistics.
After calculating the descriptive data, the researcher shows the data
can be explained in detail in the chart below:
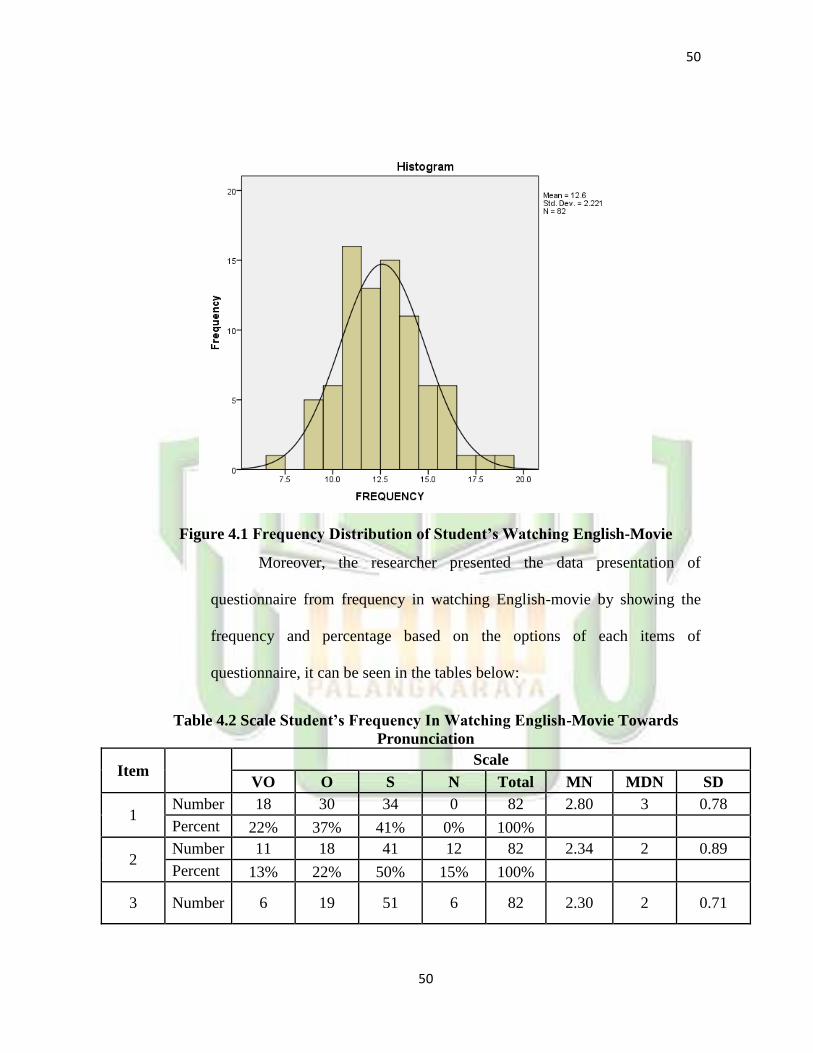
50
50
Figure 4.1 Frequency Distribution of Student’s Watching English-Movie
Moreover, the researcher presented the data presentation of
questionnaire from frequency in watching English-movie by showing the
frequency and percentage based on the options of each items of
questionnaire, it can be seen in the tables below:
Table 4.2 Scale Student’s Frequency In Watching English-Movie Towards
Pronunciation
Item Scale
VO O S N Total MN MDN SD
1 Number 18 30 34 0 82 2.80 3 0.78
Percent 22% 37% 41% 0% 100%
2 Number 11 18 41 12 82 2.34 2 0.89
Percent 13% 22% 50% 15% 100%
3 Number 6 19 51 6 82 2.30 2 0.71
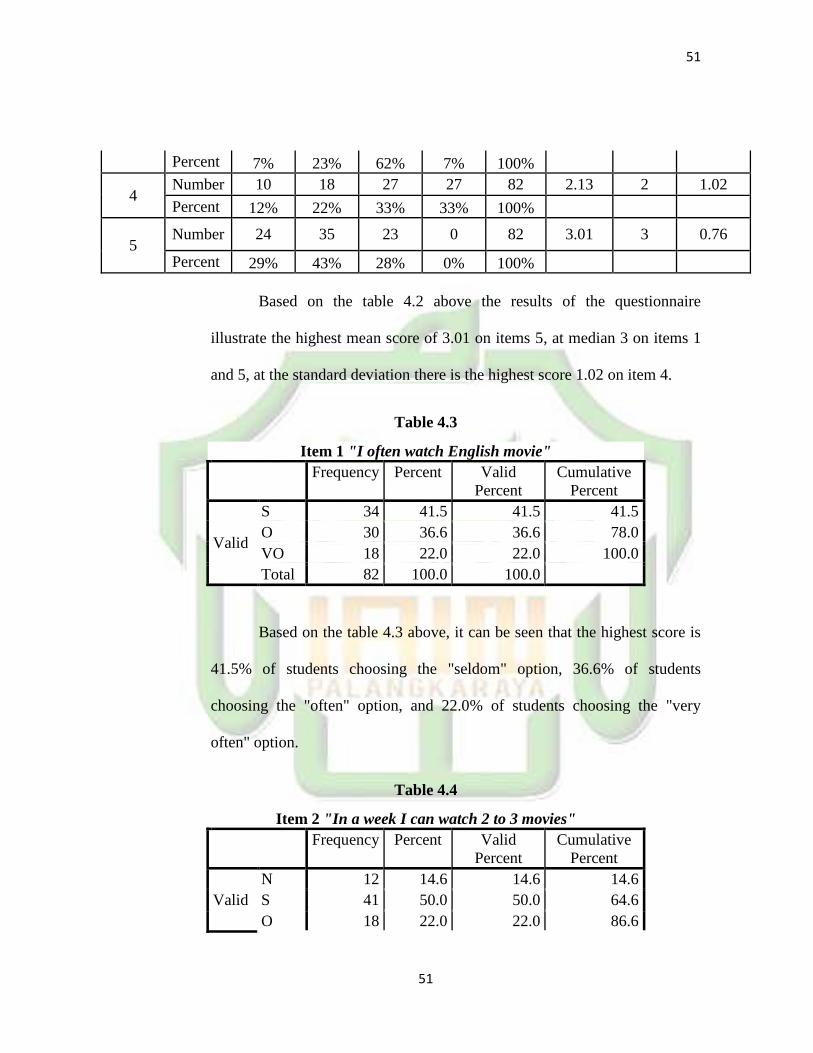
51
51
Percent 7% 23% 62% 7% 100%
4 Number 10 18 27 27 82 2.13 2 1.02
Percent 12% 22% 33% 33% 100%
5 Number 24 35 23 0 82 3.01 3 0.76
Percent 29% 43% 28% 0% 100%
Based on the table 4.2 above the results of the questionnaire
illustrate the highest mean score of 3.01 on items 5, at median 3 on items 1
and 5, at the standard deviation there is the highest score 1.02 on item 4.
Table 4.3
Item 1 "I often watch English movie"
Frequency Percent Valid
Percent
Cumulative
Percent
Valid
S 34 41.5 41.5 41.5
O 30 36.6 36.6 78.0
VO 18 22.0 22.0 100.0
Total 82 100.0 100.0
Based on the table 4.3 above, it can be seen that the highest score is
41.5% of students choosing the "seldom" option, 36.6% of students
choosing the "often" option, and 22.0% of students choosing the "very
often" option.
Table 4.4
Item 2 "In a week I can watch 2 to 3 movies"
Frequency Percent Valid
Percent
Cumulative
Percent
Valid
N 12 14.6 14.6 14.6
S 41 50.0 50.0 64.6
O 18 22.0 22.0 86.6
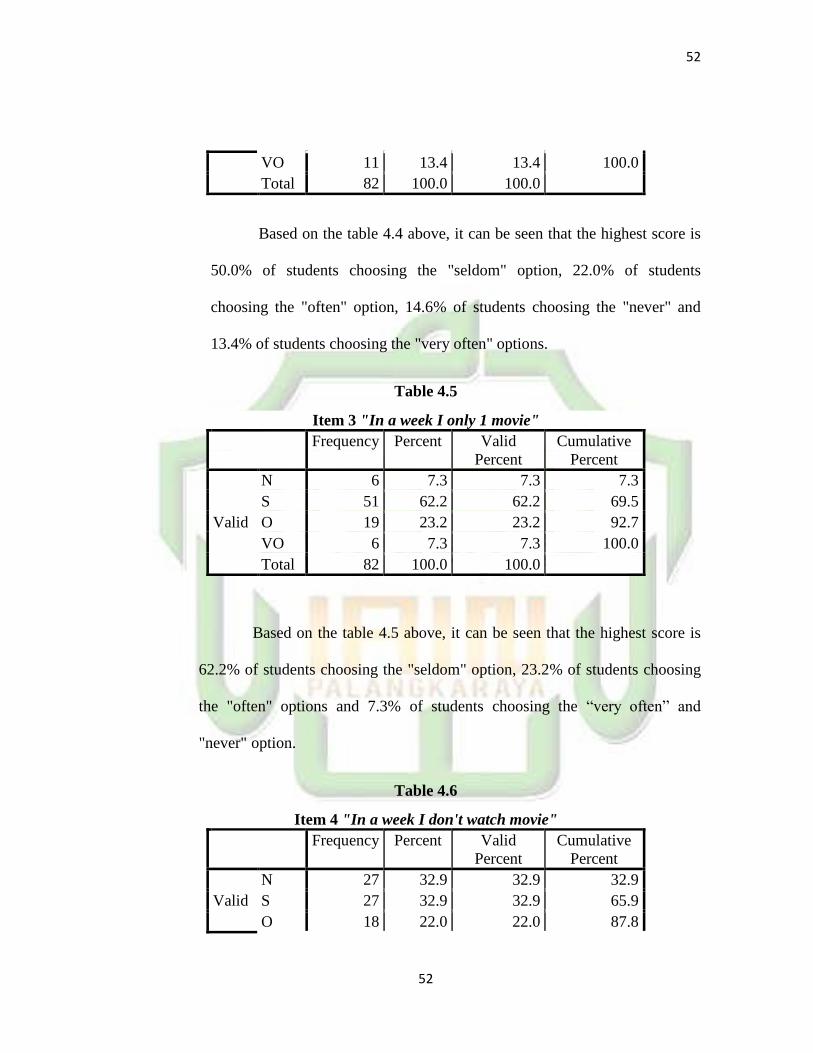
52
52
VO 11 13.4 13.4 100.0
Total 82 100.0 100.0
Based on the table 4.4 above, it can be seen that the highest score is
50.0% of students choosing the "seldom" option, 22.0% of students
choosing the "often" option, 14.6% of students choosing the "never" and
13.4% of students choosing the "very often" options.
Table 4.5
Item 3 "In a week I only 1 movie"
Frequency Percent Valid
Percent
Cumulative
Percent
Valid
N 6 7.3 7.3 7.3
S 51 62.2 62.2 69.5
O 19 23.2 23.2 92.7
VO 6 7.3 7.3 100.0
Total 82 100.0 100.0
Based on the table 4.5 above, it can be seen that the highest score is
62.2% of students choosing the "seldom" option, 23.2% of students choosing
the "often" options and 7.3% of students choosing the ―very often‖ and
"never" option.
Table 4.6
Item 4 "In a week I don't watch movie"
Frequency Percent Valid
Percent
Cumulative
Percent
Valid
N 27 32.9 32.9 32.9
S 27 32.9 32.9 65.9
O 18 22.0 22.0 87.8
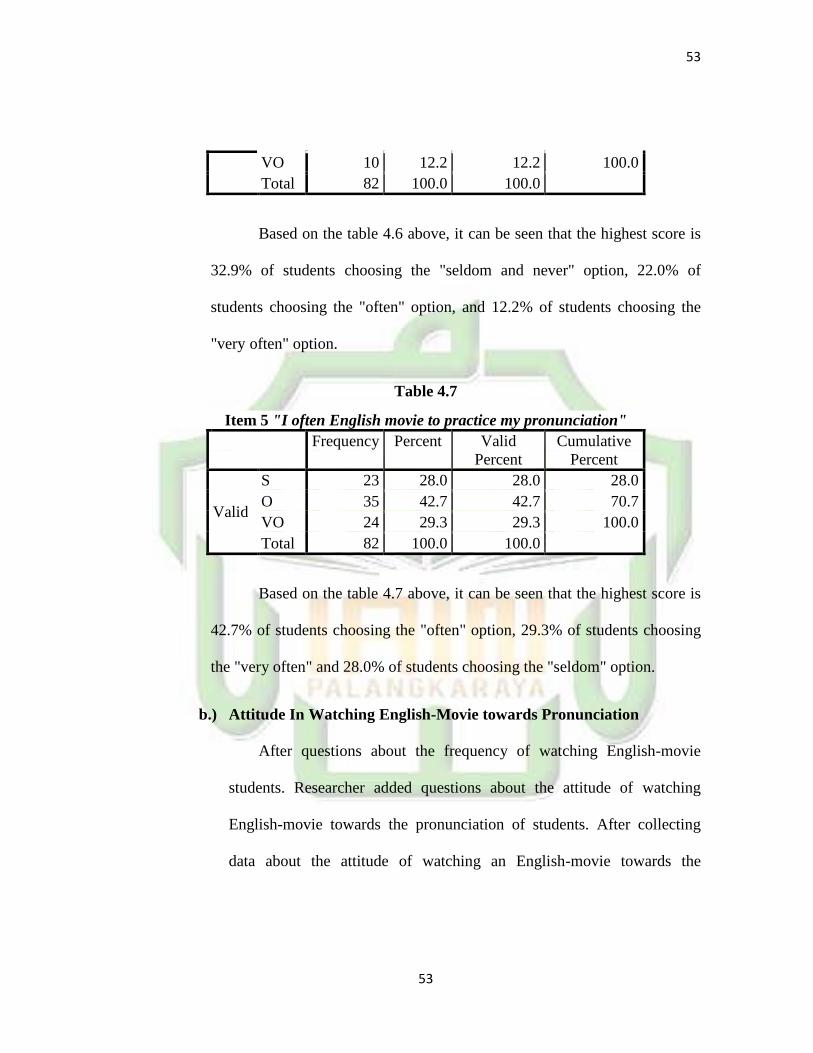
53
53
VO 10 12.2 12.2 100.0
Total 82 100.0 100.0
Based on the table 4.6 above, it can be seen that the highest score is
32.9% of students choosing the "seldom and never" option, 22.0% of
students choosing the "often" option, and 12.2% of students choosing the
"very often" option.
Table 4.7
Item 5 "I often English movie to practice my pronunciation"
Frequency Percent Valid
Percent
Cumulative
Percent
Valid
S 23 28.0 28.0 28.0
O 35 42.7 42.7 70.7
VO 24 29.3 29.3 100.0
Total 82 100.0 100.0
Based on the table 4.7 above, it can be seen that the highest score is
42.7% of students choosing the "often" option, 29.3% of students choosing
the "very often" and 28.0% of students choosing the "seldom" option.
b.) Attitude In Watching English-Movie towards Pronunciation
After questions about the frequency of watching English-movie
students. Researcher added questions about the attitude of watching
English-movie towards the pronunciation of students. After collecting
data about the attitude of watching an English-movie towards the
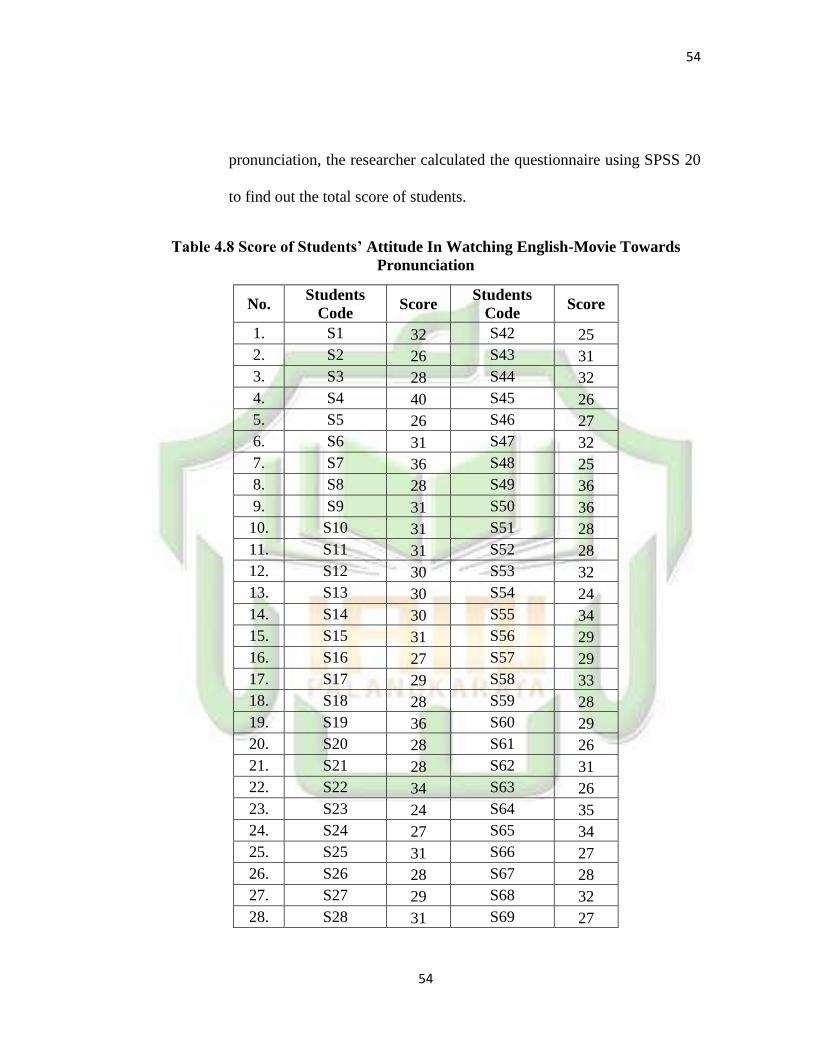
54
54
pronunciation, the researcher calculated the questionnaire using SPSS 20
to find out the total score of students.
Table 4.8 Score of Students’ Attitude In Watching English-Movie Towards
Pronunciation
No. Students
Code Score
Students
Code Score
1. S1 32 S42 25
2. S2 26 S43 31
3. S3 28 S44 32
4. S4 40 S45 26
5. S5 26 S46 27
6. S6 31 S47 32
7. S7 36 S48 25
8. S8 28 S49 36
9. S9 31 S50 36
10. S10 31 S51 28
11. S11 31 S52 28
12. S12 30 S53 32
13. S13 30 S54 24
14. S14 30 S55 34
15. S15 31 S56 29
16. S16 27 S57 29
17. S17 29 S58 33
18. S18 28 S59 28
19. S19 36 S60 29
20. S20 28 S61 26
21. S21 28 S62 31
22. S22 34 S63 26
23. S23 24 S64 35
24. S24 27 S65 34
25. S25 31 S66 27
26. S26 28 S67 28
27. S27 29 S68 32
28. S28 31 S69 27
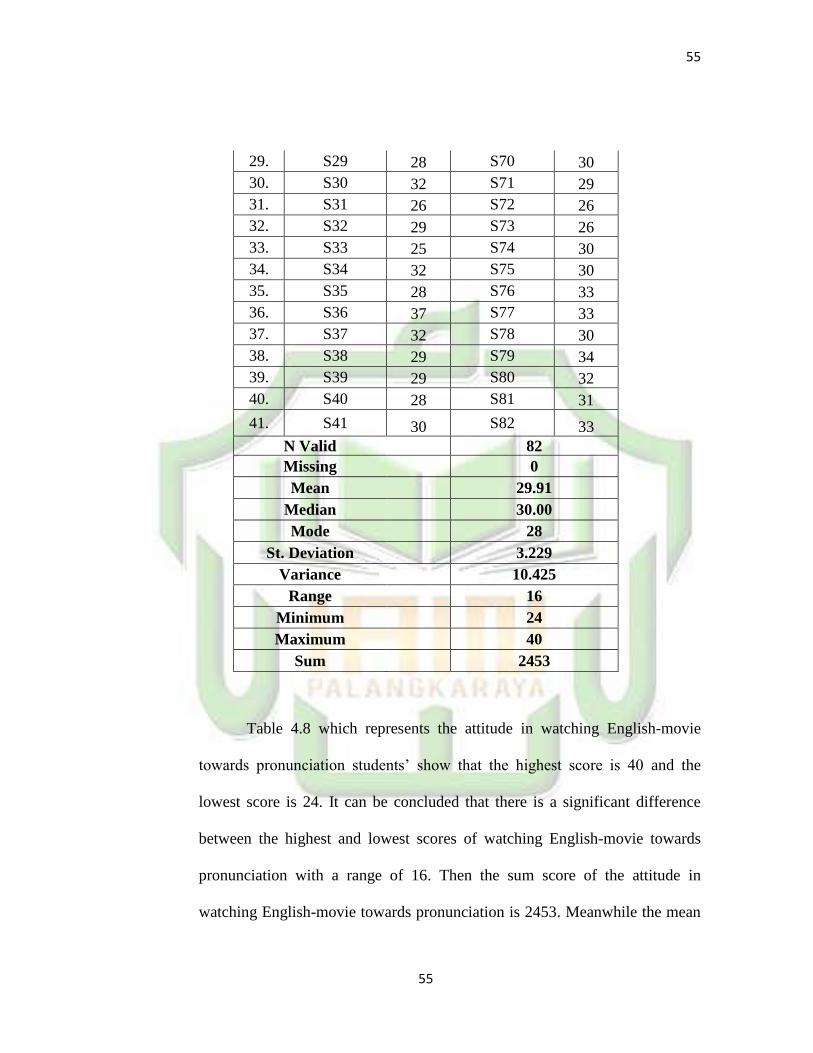
55
55
29. S29 28 S70 30
30. S30 32 S71 29
31. S31 26 S72 26
32. S32 29 S73 26
33. S33 25 S74 30
34. S34 32 S75 30
35. S35 28 S76 33
36. S36 37 S77 33
37. S37 32 S78 30
38. S38 29 S79 34
39. S39 29 S80 32
40. S40 28 S81 31
41. S41 30 S82 33
N Valid 82
Missing 0
Mean 29.91
Median 30.00
Mode 28
St. Deviation 3.229
Variance 10.425
Range 16
Minimum 24
Maximum 40
Sum 2453
Table 4.8 which represents the attitude in watching English-movie
towards pronunciation students‘ show that the highest score is 40 and the
lowest score is 24. It can be concluded that there is a significant difference
between the highest and lowest scores of watching English-movie towards
pronunciation with a range of 16. Then the sum score of the attitude in
watching English-movie towards pronunciation is 2453. Meanwhile the mean
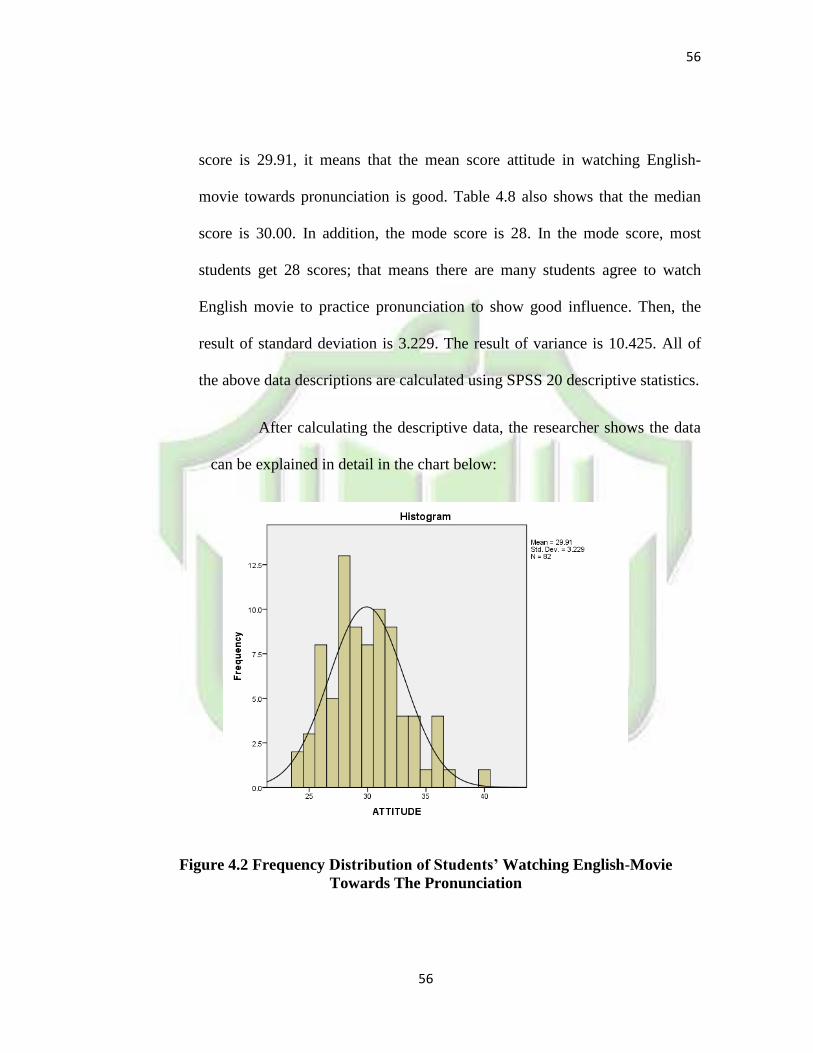
56
56
score is 29.91, it means that the mean score attitude in watching English-
movie towards pronunciation is good. Table 4.8 also shows that the median
score is 30.00. In addition, the mode score is 28. In the mode score, most
students get 28 scores; that means there are many students agree to watch
English movie to practice pronunciation to show good influence. Then, the
result of standard deviation is 3.229. The result of variance is 10.425. All of
the above data descriptions are calculated using SPSS 20 descriptive statistics.
After calculating the descriptive data, the researcher shows the data
can be explained in detail in the chart below:
Figure 4.2 Frequency Distribution of Students’ Watching English-Movie
Towards The Pronunciation
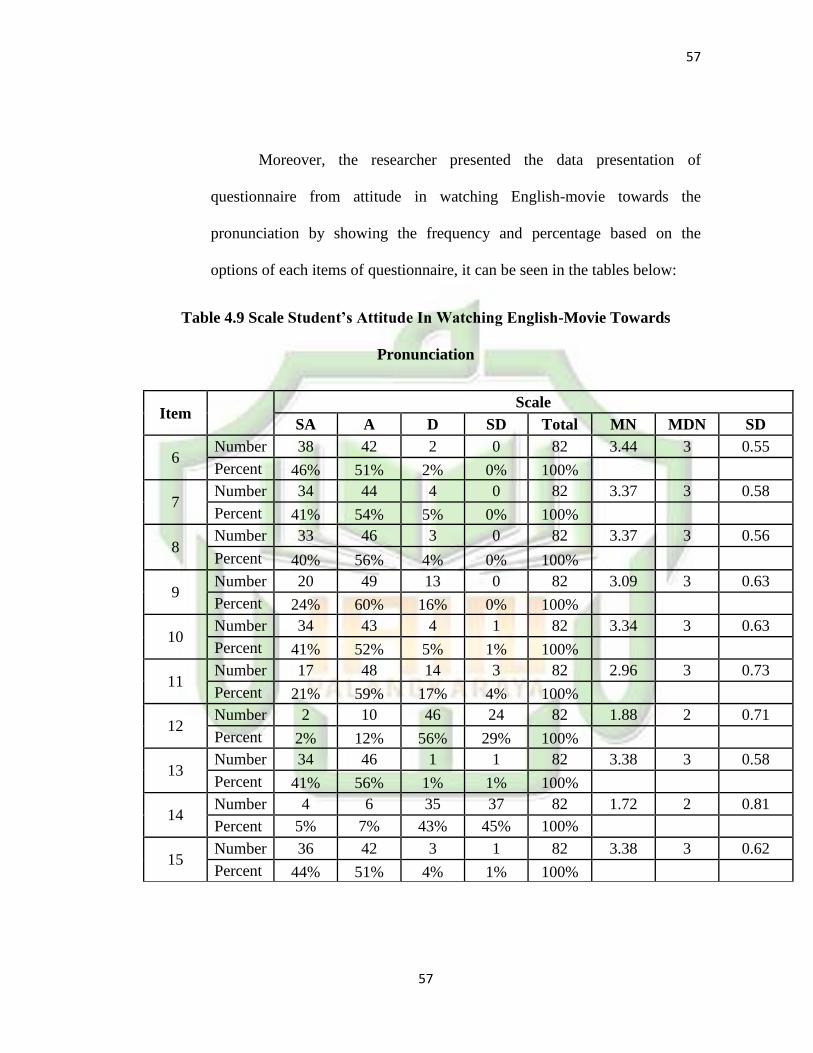
57
57
Moreover, the researcher presented the data presentation of
questionnaire from attitude in watching English-movie towards the
pronunciation by showing the frequency and percentage based on the
options of each items of questionnaire, it can be seen in the tables below:
Table 4.9 Scale Student’s Attitude In Watching English-Movie Towards
Pronunciation
Item Scale
SA A D SD Total MN MDN SD
6 Number 38 42 2 0 82 3.44 3 0.55
Percent 46% 51% 2% 0% 100%
7 Number 34 44 4 0 82 3.37 3 0.58
Percent 41% 54% 5% 0% 100%
8 Number 33 46 3 0 82 3.37 3 0.56
Percent 40% 56% 4% 0% 100%
9 Number 20 49 13 0 82 3.09 3 0.63
Percent 24% 60% 16% 0% 100%
10 Number 34 43 4 1 82 3.34 3 0.63
Percent 41% 52% 5% 1% 100%
11 Number 17 48 14 3 82 2.96 3 0.73
Percent 21% 59% 17% 4% 100%
12 Number 2 10 46 24 82 1.88 2 0.71
Percent 2% 12% 56% 29% 100%
13 Number 34 46 1 1 82 3.38 3 0.58
Percent 41% 56% 1% 1% 100%
14 Number 4 6 35 37 82 1.72 2 0.81
Percent 5% 7% 43% 45% 100%
15 Number 36 42 3 1 82 3.38 3 0.62
Percent 44% 51% 4% 1% 100%
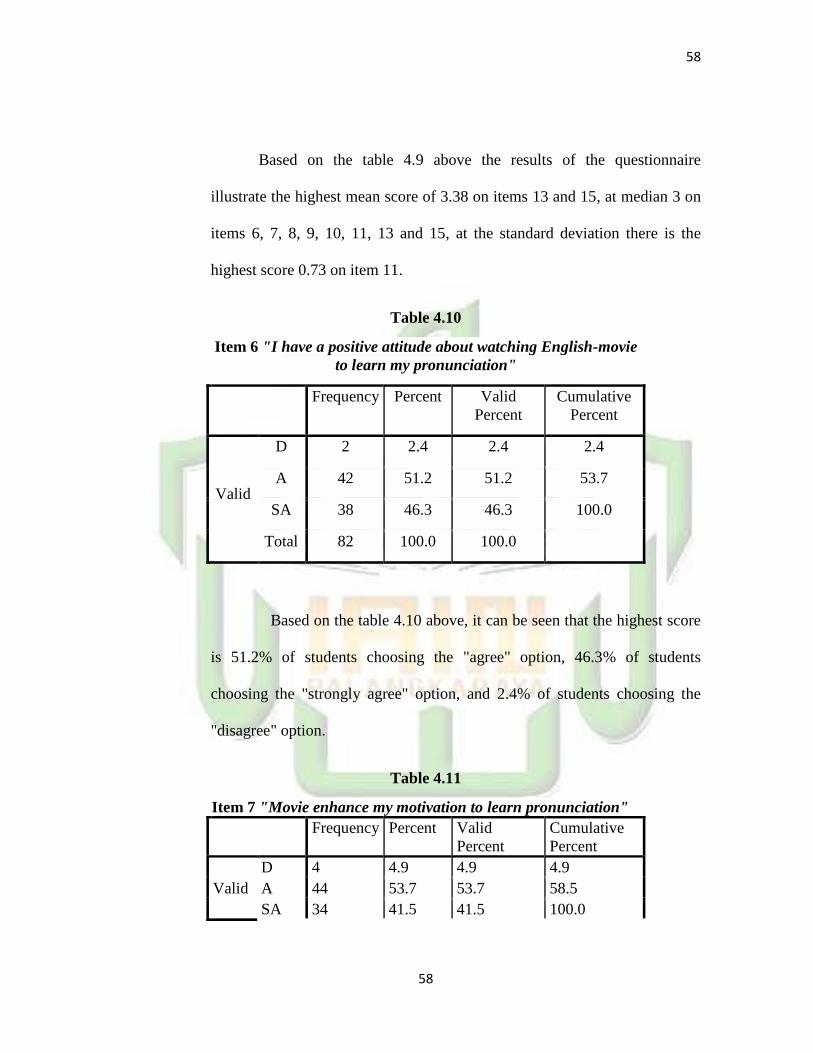
58
58
Based on the table 4.9 above the results of the questionnaire
illustrate the highest mean score of 3.38 on items 13 and 15, at median 3 on
items 6, 7, 8, 9, 10, 11, 13 and 15, at the standard deviation there is the
highest score 0.73 on item 11.
Table 4.10
Based on the table 4.10 above, it can be seen that the highest score
is 51.2% of students choosing the "agree" option, 46.3% of students
choosing the "strongly agree" option, and 2.4% of students choosing the
"disagree" option.
Table 4.11
Item 7 "Movie enhance my motivation to learn pronunciation"
Frequency Percent Valid
Percent
Cumulative
Percent
Valid
D 4 4.9 4.9 4.9
A 44 53.7 53.7 58.5
SA 34 41.5 41.5 100.0
Item 6 "I have a positive attitude about watching English-movie
to learn my pronunciation"
Frequency Percent Valid
Percent
Cumulative
Percent
Valid
D 2 2.4 2.4 2.4
A 42 51.2 51.2 53.7
SA 38 46.3 46.3 100.0
Total 82 100.0 100.0
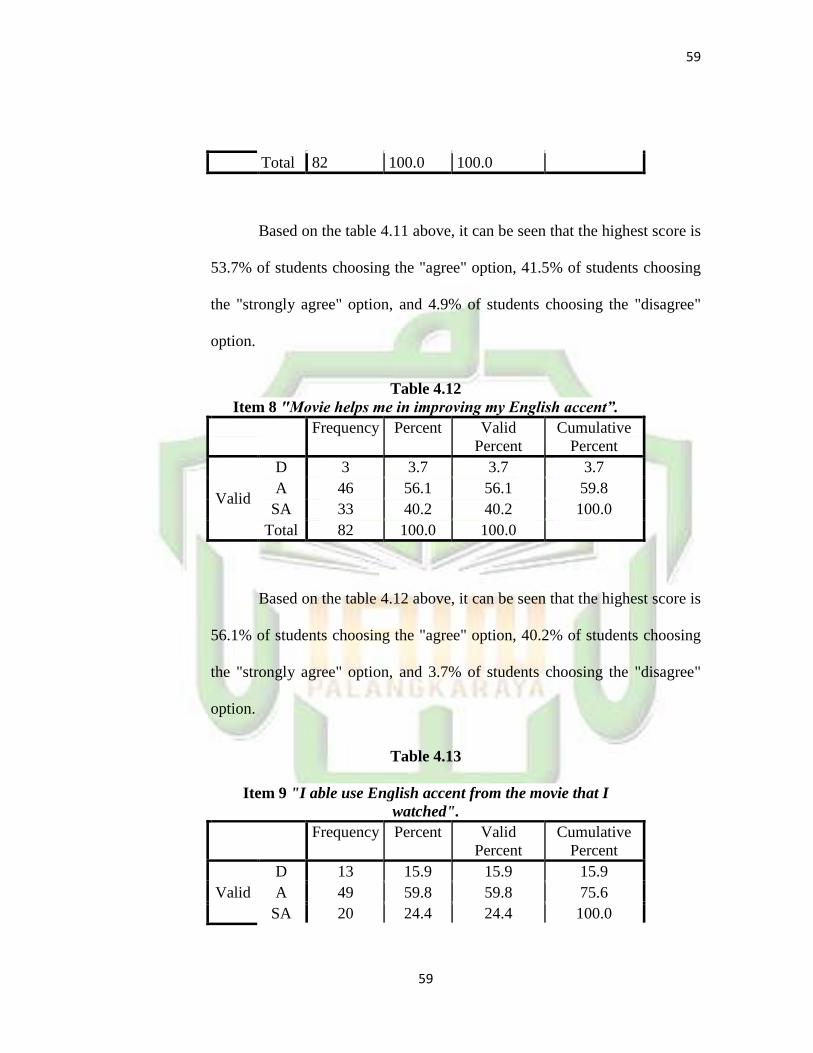
59
59
Total 82 100.0 100.0
Based on the table 4.11 above, it can be seen that the highest score is
53.7% of students choosing the "agree" option, 41.5% of students choosing
the "strongly agree" option, and 4.9% of students choosing the "disagree"
option.
Table 4.12
Item 8 "Movie helps me in improving my English accent”.
Frequency Percent Valid
Percent
Cumulative
Percent
Valid
D 3 3.7 3.7 3.7
A 46 56.1 56.1 59.8
SA 33 40.2 40.2 100.0
Total 82 100.0 100.0
Based on the table 4.12 above, it can be seen that the highest score is
56.1% of students choosing the "agree" option, 40.2% of students choosing
the "strongly agree" option, and 3.7% of students choosing the "disagree"
option.
Table 4.13
Item 9 "I able use English accent from the movie that I
watched".
Frequency Percent Valid
Percent
Cumulative
Percent
Valid
D 13 15.9 15.9 15.9
A 49 59.8 59.8 75.6
SA 20 24.4 24.4 100.0
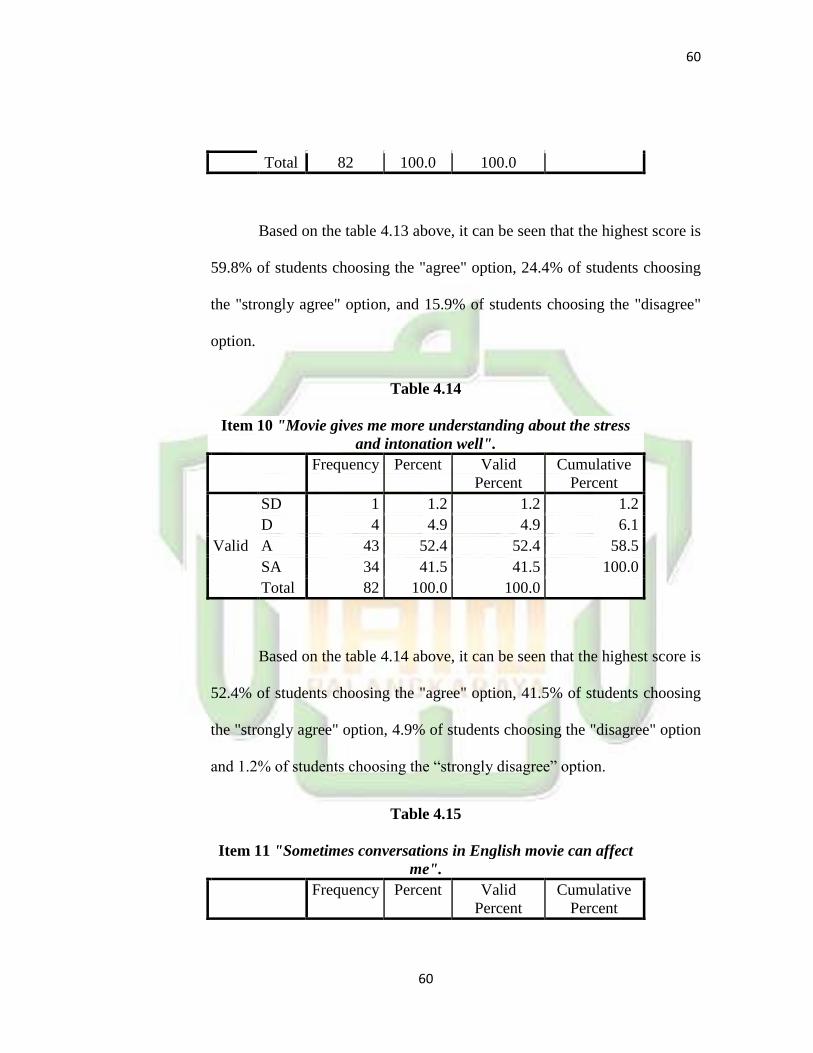
60
60
Total 82 100.0 100.0
Based on the table 4.13 above, it can be seen that the highest score is
59.8% of students choosing the "agree" option, 24.4% of students choosing
the "strongly agree" option, and 15.9% of students choosing the "disagree"
option.
Table 4.14
Item 10 "Movie gives me more understanding about the stress
and intonation well".
Frequency Percent Valid
Percent
Cumulative
Percent
Valid
SD 1 1.2 1.2 1.2
D 4 4.9 4.9 6.1
A 43 52.4 52.4 58.5
SA 34 41.5 41.5 100.0
Total 82 100.0 100.0
Based on the table 4.14 above, it can be seen that the highest score is
52.4% of students choosing the "agree" option, 41.5% of students choosing
the "strongly agree" option, 4.9% of students choosing the "disagree" option
and 1.2% of students choosing the ―strongly disagree‖ option.
Table 4.15
Item 11 "Sometimes conversations in English movie can affect
me".
Frequency Percent Valid
Percent
Cumulative
Percent
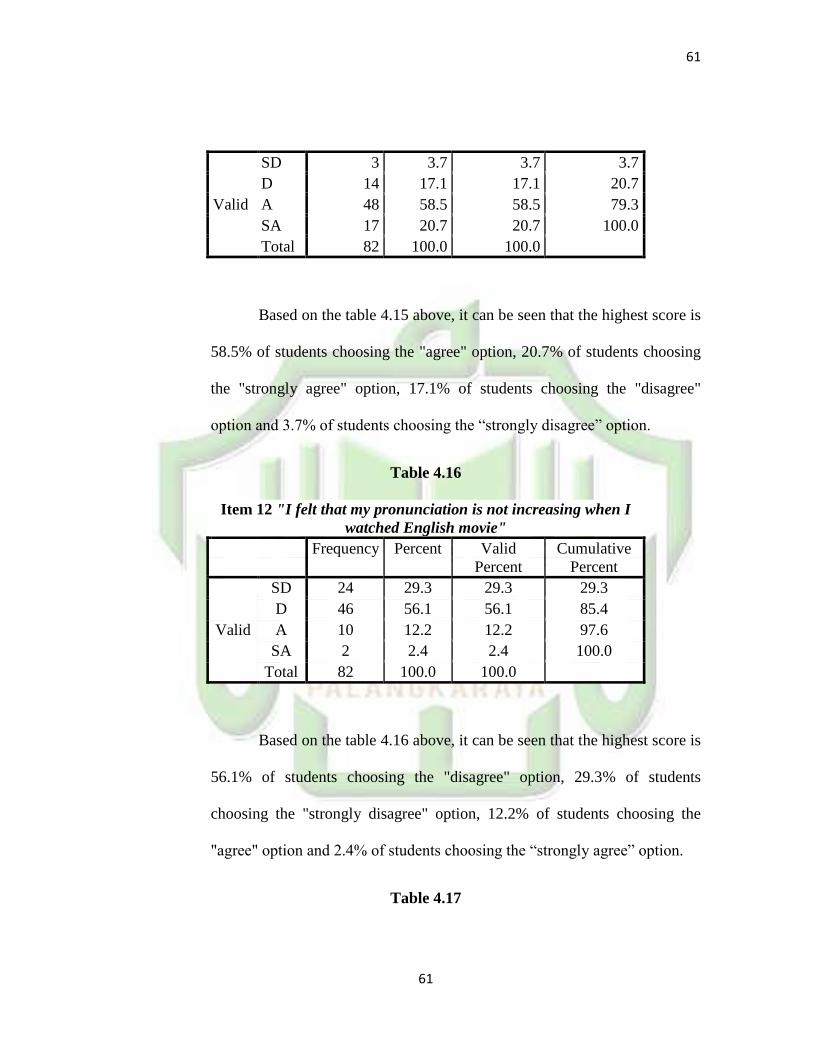
61
61
Valid
SD 3 3.7 3.7 3.7
D 14 17.1 17.1 20.7
A 48 58.5 58.5 79.3
SA 17 20.7 20.7 100.0
Total 82 100.0 100.0
Based on the table 4.15 above, it can be seen that the highest score is
58.5% of students choosing the "agree" option, 20.7% of students choosing
the "strongly agree" option, 17.1% of students choosing the "disagree"
option and 3.7% of students choosing the ―strongly disagree‖ option.
Table 4.16
Item 12 "I felt that my pronunciation is not increasing when I
watched English movie"
Frequency Percent Valid
Percent
Cumulative
Percent
Valid
SD 24 29.3 29.3 29.3
D 46 56.1 56.1 85.4
A 10 12.2 12.2 97.6
SA 2 2.4 2.4 100.0
Total 82 100.0 100.0
Based on the table 4.16 above, it can be seen that the highest score is
56.1% of students choosing the "disagree" option, 29.3% of students
choosing the "strongly disagree" option, 12.2% of students choosing the
"agree" option and 2.4% of students choosing the ―strongly agree‖ option.
Table 4.17
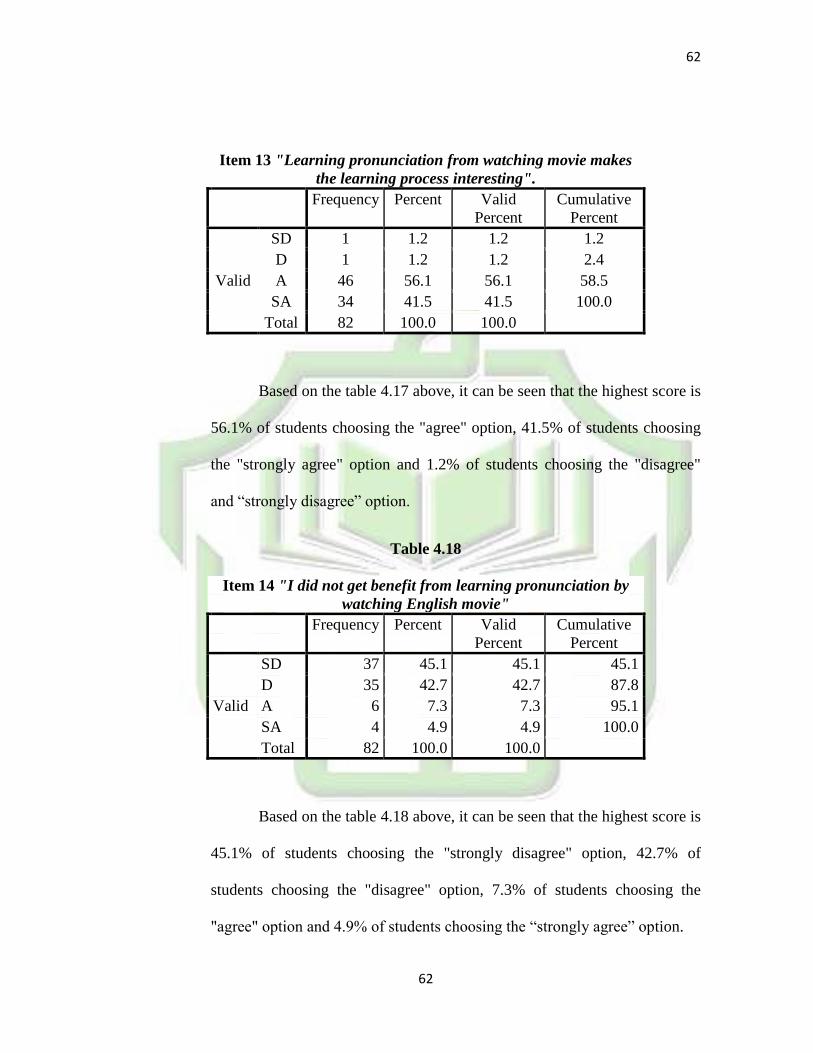
62
62
Item 13 "Learning pronunciation from watching movie makes
the learning process interesting".
Frequency Percent Valid
Percent
Cumulative
Percent
Valid
SD 1 1.2 1.2 1.2
D 1 1.2 1.2 2.4
A 46 56.1 56.1 58.5
SA 34 41.5 41.5 100.0
Total 82 100.0 100.0
Based on the table 4.17 above, it can be seen that the highest score is
56.1% of students choosing the "agree" option, 41.5% of students choosing
the "strongly agree" option and 1.2% of students choosing the "disagree"
and ―strongly disagree‖ option.
Table 4.18
Item 14 "I did not get benefit from learning pronunciation by
watching English movie"
Frequency Percent Valid
Percent
Cumulative
Percent
Valid
SD 37 45.1 45.1 45.1
D 35 42.7 42.7 87.8
A 6 7.3 7.3 95.1
SA 4 4.9 4.9 100.0
Total 82 100.0 100.0
Based on the table 4.18 above, it can be seen that the highest score is
45.1% of students choosing the "strongly disagree" option, 42.7% of
students choosing the "disagree" option, 7.3% of students choosing the
"agree" option and 4.9% of students choosing the ―strongly agree‖ option.
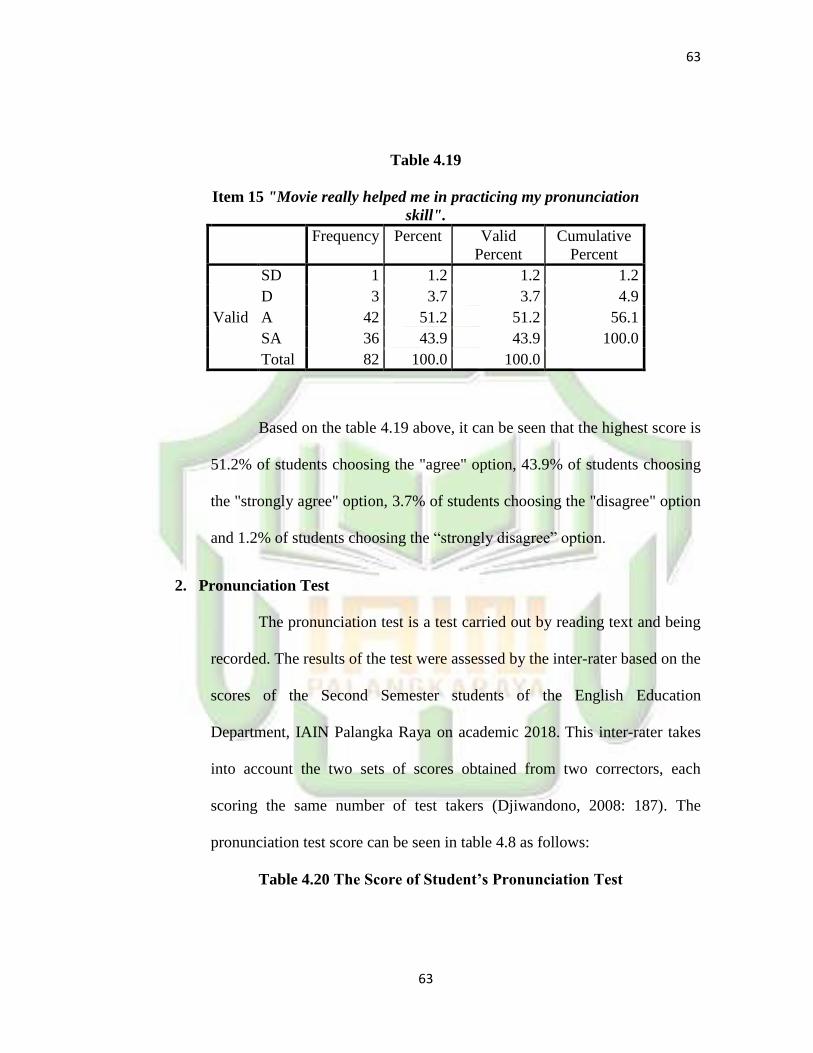
63
63
Table 4.19
Item 15 "Movie really helped me in practicing my pronunciation
skill".
Frequency Percent Valid
Percent
Cumulative
Percent
Valid
SD 1 1.2 1.2 1.2
D 3 3.7 3.7 4.9
A 42 51.2 51.2 56.1
SA 36 43.9 43.9 100.0
Total 82 100.0 100.0
Based on the table 4.19 above, it can be seen that the highest score is
51.2% of students choosing the "agree" option, 43.9% of students choosing
the "strongly agree" option, 3.7% of students choosing the "disagree" option
and 1.2% of students choosing the ―strongly disagree‖ option.
2. Pronunciation Test
The pronunciation test is a test carried out by reading text and being
recorded. The results of the test were assessed by the inter-rater based on the
scores of the Second Semester students of the English Education
Department, IAIN Palangka Raya on academic 2018. This inter-rater takes
into account the two sets of scores obtained from two correctors, each
scoring the same number of test takers (Djiwandono, 2008: 187). The
pronunciation test score can be seen in table 4.8 as follows:
Table 4.20 The Score of Student’s Pronunciation Test
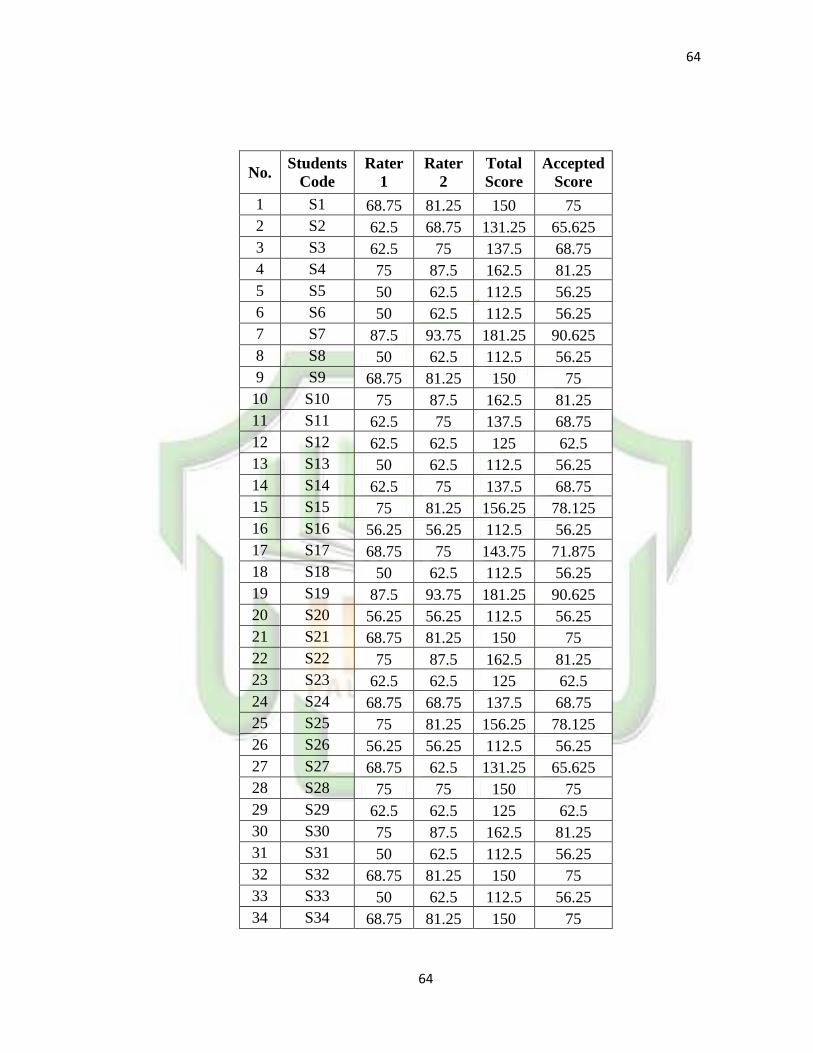
64
64
No. Students
Code
Rater
1
Rater
2
Total
Score
Accepted
Score
1 S1 68.75 81.25 150 75
2 S2 62.5 68.75 131.25 65.625
3 S3 62.5 75 137.5 68.75
4 S4 75 87.5 162.5 81.25
5 S5 50 62.5 112.5 56.25
6 S6 50 62.5 112.5 56.25
7 S7 87.5 93.75 181.25 90.625
8 S8 50 62.5 112.5 56.25
9 S9 68.75 81.25 150 75
10 S10 75 87.5 162.5 81.25
11 S11 62.5 75 137.5 68.75
12 S12 62.5 62.5 125 62.5
13 S13 50 62.5 112.5 56.25
14 S14 62.5 75 137.5 68.75
15 S15 75 81.25 156.25 78.125
16 S16 56.25 56.25 112.5 56.25
17 S17 68.75 75 143.75 71.875
18 S18 50 62.5 112.5 56.25
19 S19 87.5 93.75 181.25 90.625
20 S20 56.25 56.25 112.5 56.25
21 S21 68.75 81.25 150 75
22 S22 75 87.5 162.5 81.25
23 S23 62.5 62.5 125 62.5
24 S24 68.75 68.75 137.5 68.75
25 S25 75 81.25 156.25 78.125
26 S26 56.25 56.25 112.5 56.25
27 S27 68.75 62.5 131.25 65.625
28 S28 75 75 150 75
29 S29 62.5 62.5 125 62.5
30 S30 75 87.5 162.5 81.25
31 S31 50 62.5 112.5 56.25
32 S32 68.75 81.25 150 75
33 S33 50 62.5 112.5 56.25
34 S34 68.75 81.25 150 75
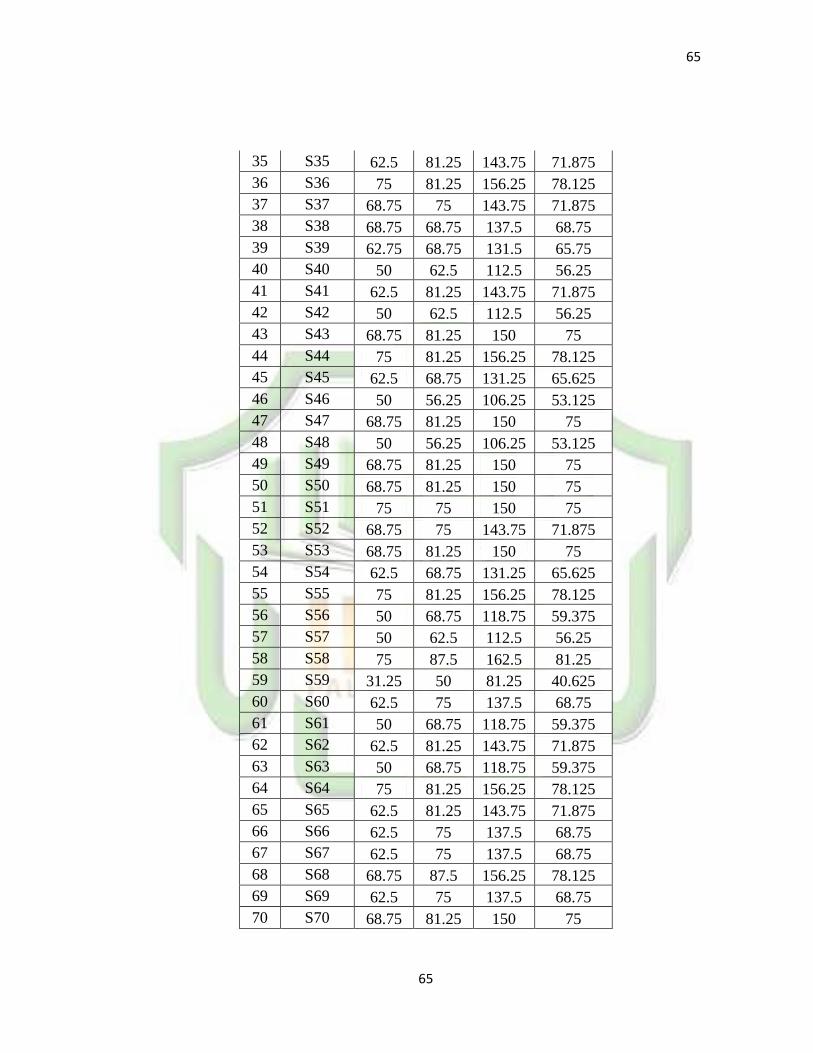
65
65
35 S35 62.5 81.25 143.75 71.875
36 S36 75 81.25 156.25 78.125
37 S37 68.75 75 143.75 71.875
38 S38 68.75 68.75 137.5 68.75
39 S39 62.75 68.75 131.5 65.75
40 S40 50 62.5 112.5 56.25
41 S41 62.5 81.25 143.75 71.875
42 S42 50 62.5 112.5 56.25
43 S43 68.75 81.25 150 75
44 S44 75 81.25 156.25 78.125
45 S45 62.5 68.75 131.25 65.625
46 S46 50 56.25 106.25 53.125
47 S47 68.75 81.25 150 75
48 S48 50 56.25 106.25 53.125
49 S49 68.75 81.25 150 75
50 S50 68.75 81.25 150 75
51 S51 75 75 150 75
52 S52 68.75 75 143.75 71.875
53 S53 68.75 81.25 150 75
54 S54 62.5 68.75 131.25 65.625
55 S55 75 81.25 156.25 78.125
56 S56 50 68.75 118.75 59.375
57 S57 50 62.5 112.5 56.25
58 S58 75 87.5 162.5 81.25
59 S59 31.25 50 81.25 40.625
60 S60 62.5 75 137.5 68.75
61 S61 50 68.75 118.75 59.375
62 S62 62.5 81.25 143.75 71.875
63 S63 50 68.75 118.75 59.375
64 S64 75 81.25 156.25 78.125
65 S65 62.5 81.25 143.75 71.875
66 S66 62.5 75 137.5 68.75
67 S67 62.5 75 137.5 68.75
68 S68 68.75 87.5 156.25 78.125
69 S69 62.5 75 137.5 68.75
70 S70 68.75 81.25 150 75
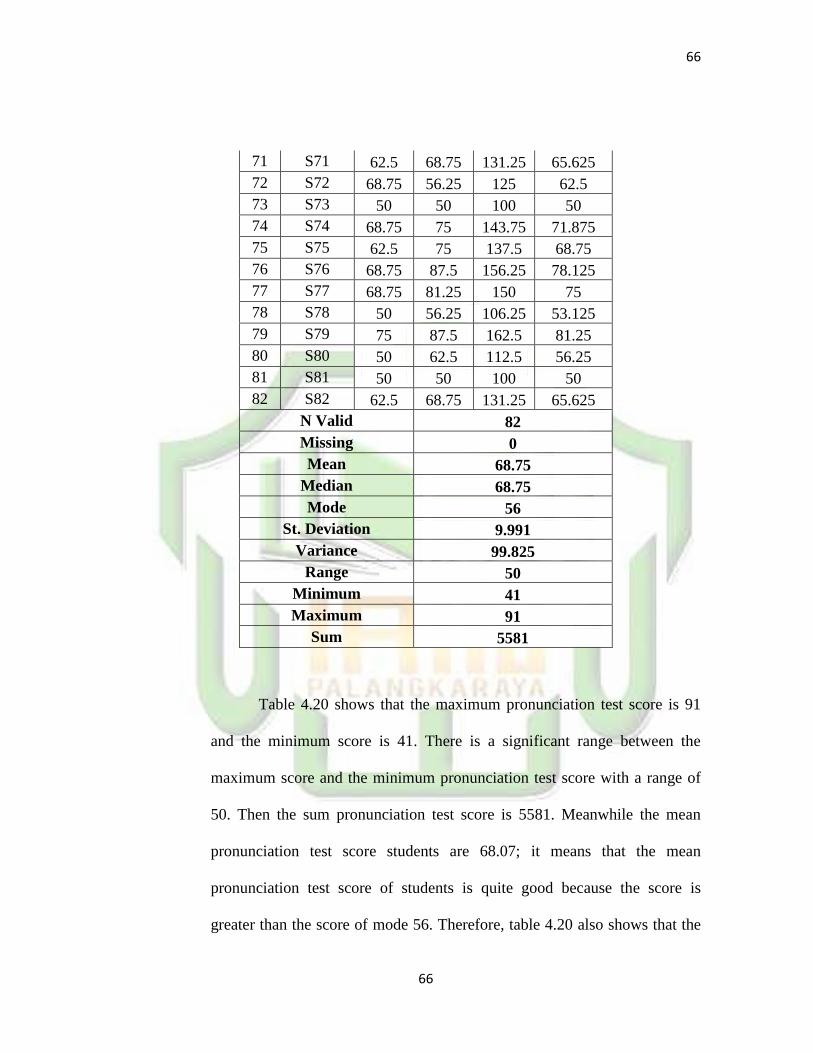
66
66
71 S71 62.5 68.75 131.25 65.625
72 S72 68.75 56.25 125 62.5
73 S73 50 50 100 50
74 S74 68.75 75 143.75 71.875
75 S75 62.5 75 137.5 68.75
76 S76 68.75 87.5 156.25 78.125
77 S77 68.75 81.25 150 75
78 S78 50 56.25 106.25 53.125
79 S79 75 87.5 162.5 81.25
80 S80 50 62.5 112.5 56.25
81 S81 50 50 100 50
82 S82 62.5 68.75 131.25 65.625
N Valid 82
Missing 0
Mean 68.75
Median 68.75
Mode 56
St. Deviation 9.991
Variance 99.825
Range 50
Minimum 41
Maximum 91
Sum 5581
Table 4.20 shows that the maximum pronunciation test score is 91
and the minimum score is 41. There is a significant range between the
maximum score and the minimum pronunciation test score with a range of
50. Then the sum pronunciation test score is 5581. Meanwhile the mean
pronunciation test score students are 68.07; it means that the mean
pronunciation test score of students is quite good because the score is
greater than the score of mode 56. Therefore, table 4.20 also shows that the
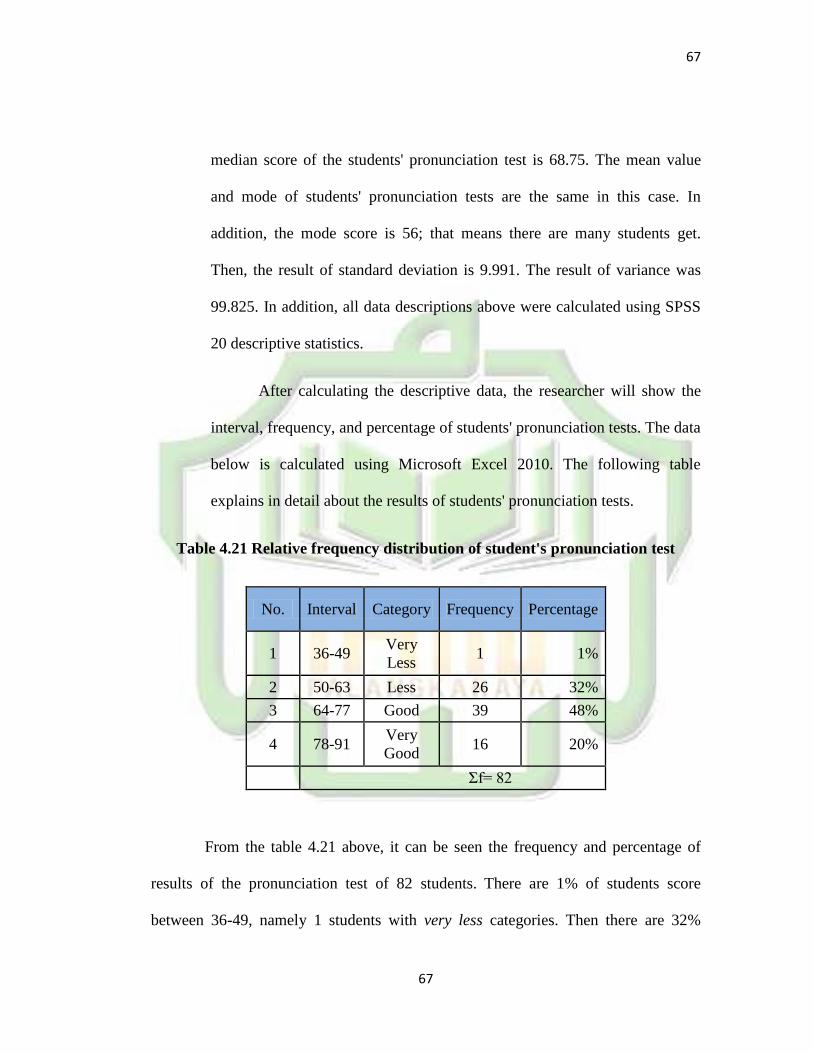
67
67
median score of the students' pronunciation test is 68.75. The mean value
and mode of students' pronunciation tests are the same in this case. In
addition, the mode score is 56; that means there are many students get.
Then, the result of standard deviation is 9.991. The result of variance was
99.825. In addition, all data descriptions above were calculated using SPSS
20 descriptive statistics.
After calculating the descriptive data, the researcher will show the
interval, frequency, and percentage of students' pronunciation tests. The data
below is calculated using Microsoft Excel 2010. The following table
explains in detail about the results of students' pronunciation tests.
Table 4.21 Relative frequency distribution of student's pronunciation test
No. Interval Category Frequency Percentage
1 36-49 Very
Less 1 1%
2 50-63 Less 26 32%
3 64-77 Good 39 48%
4 78-91 Very
Good 16 20%
Ʃf= 82
From the table 4.21 above, it can be seen the frequency and percentage of
results of the pronunciation test of 82 students. There are 1% of students score
between 36-49, namely 1 students with very less categories. Then there are 32%
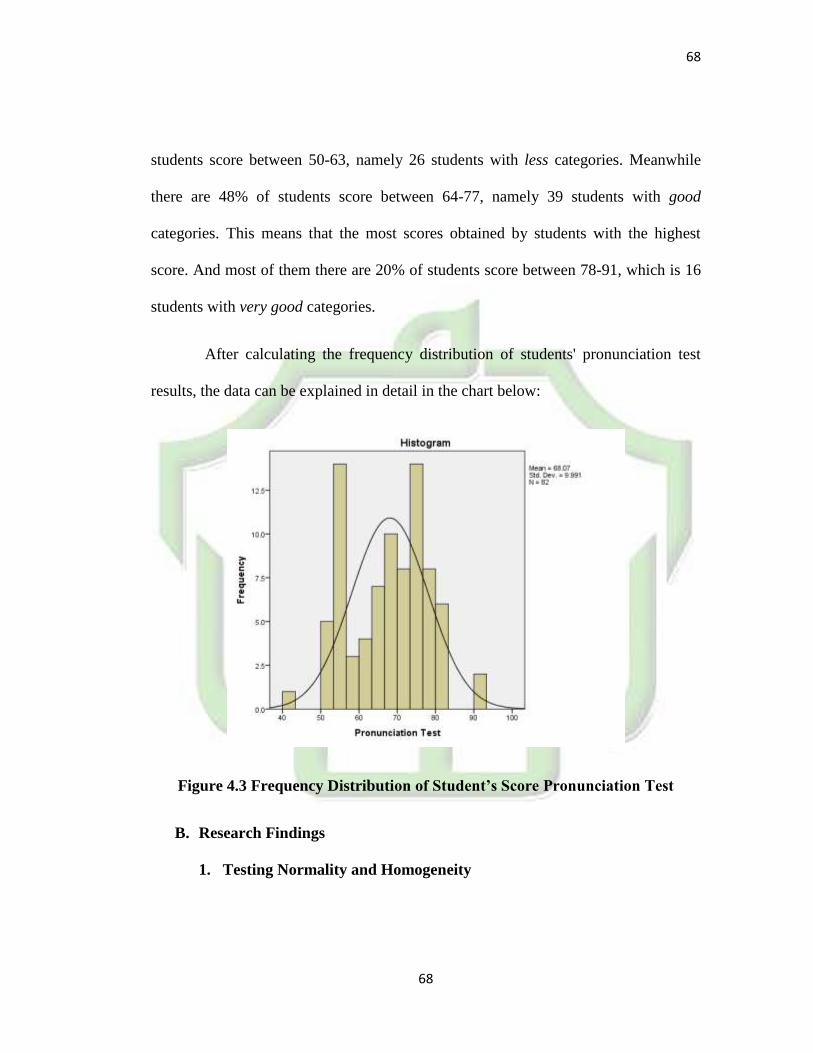
68
68
students score between 50-63, namely 26 students with less categories. Meanwhile
there are 48% of students score between 64-77, namely 39 students with good
categories. This means that the most scores obtained by students with the highest
score. And most of them there are 20% of students score between 78-91, which is 16
students with very good categories.
After calculating the frequency distribution of students' pronunciation test
results, the data can be explained in detail in the chart below:
Figure 4.3 Frequency Distribution of Student’s Score Pronunciation Test
B. Research Findings
1. Testing Normality and Homogeneity
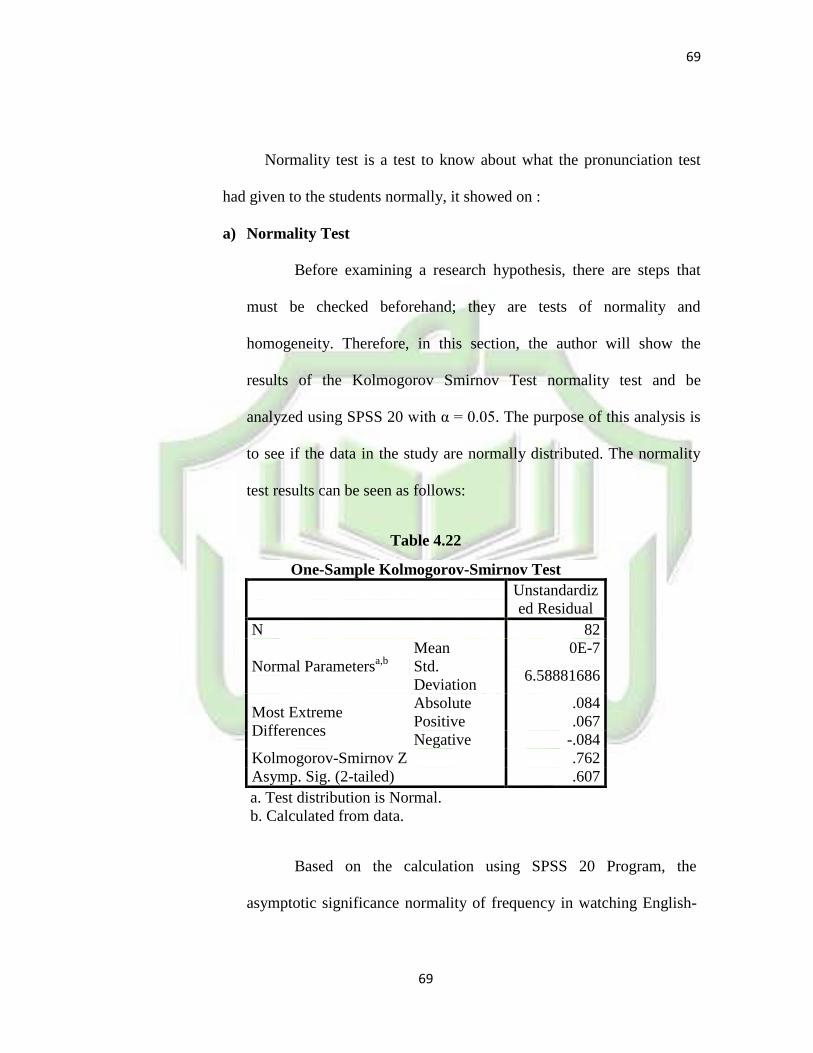
69
69
Normality test is a test to know about what the pronunciation test
had given to the students normally, it showed on :
a) Normality Test
Before examining a research hypothesis, there are steps that
must be checked beforehand; they are tests of normality and
homogeneity. Therefore, in this section, the author will show the
results of the Kolmogorov Smirnov Test normality test and be
analyzed using SPSS 20 with α = 0.05. The purpose of this analysis is
to see if the data in the study are normally distributed. The normality
test results can be seen as follows:
Table 4.22
One-Sample Kolmogorov-Smirnov Test
Unstandardiz
ed Residual
N 82
Normal Parametersa,b
Mean 0E-7
Std.
Deviation 6.58881686
Most Extreme
Differences
Absolute .084
Positive .067
Negative -.084
Kolmogorov-Smirnov Z .762
Asymp. Sig. (2-tailed) .607
a. Test distribution is Normal.
b. Calculated from data.
Based on the calculation using SPSS 20 Program, the
asymptotic significance normality of frequency in watching English-
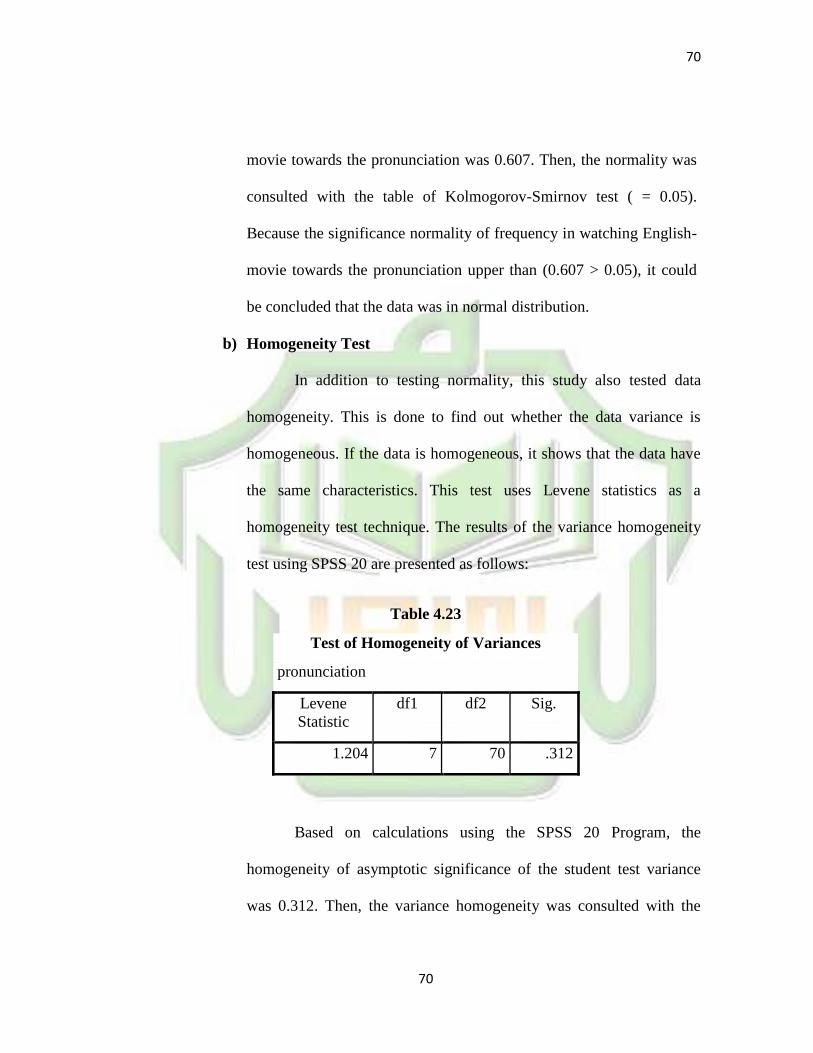
70
70
movie towards the pronunciation was 0.607. Then, the normality was
consulted with the table of Kolmogorov-Smirnov test ( = 0.05).
Because the significance normality of frequency in watching English-
movie towards the pronunciation upper than (0.607 > 0.05), it could
be concluded that the data was in normal distribution.
b) Homogeneity Test
In addition to testing normality, this study also tested data
homogeneity. This is done to find out whether the data variance is
homogeneous. If the data is homogeneous, it shows that the data have
the same characteristics. This test uses Levene statistics as a
homogeneity test technique. The results of the variance homogeneity
test using SPSS 20 are presented as follows:
Table 4.23
Test of Homogeneity of Variances
pronunciation
Levene
Statistic
df1 df2 Sig.
1.204 7 70 .312
Based on calculations using the SPSS 20 Program, the
homogeneity of asymptotic significance of the student test variance
was 0.312. Then, the variance homogeneity was consulted with the
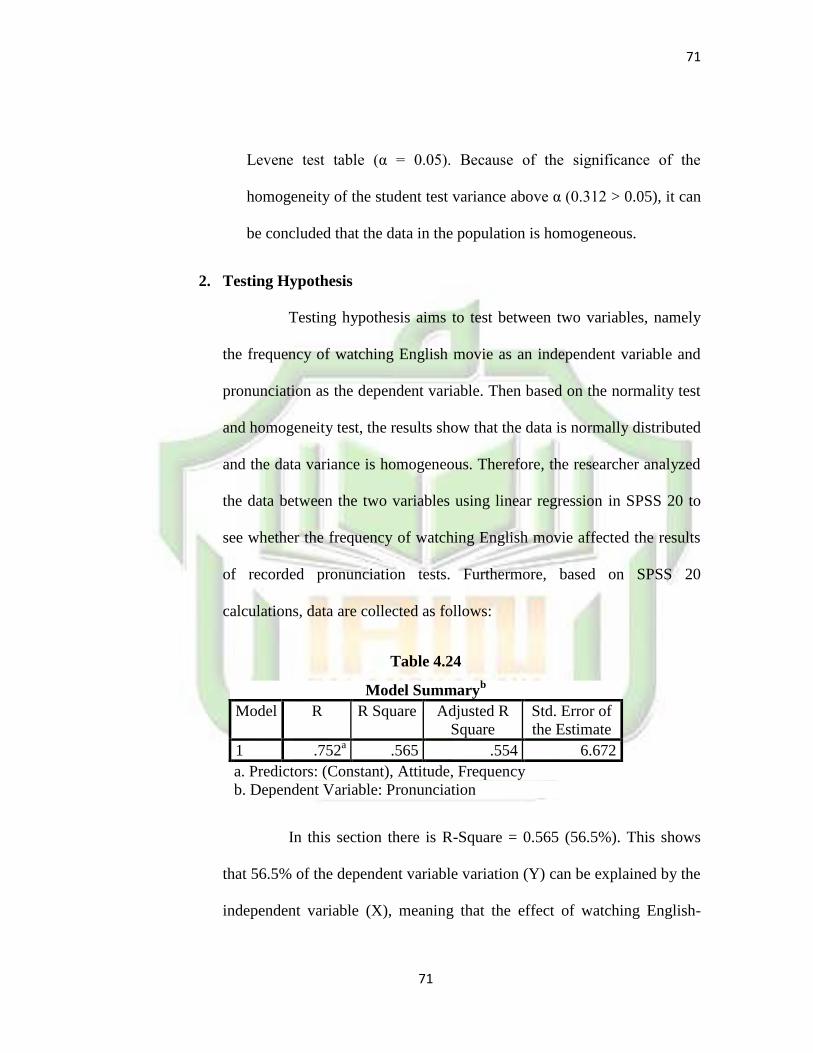
71
71
Levene test table (α = 0.05). Because of the significance of the
homogeneity of the student test variance above α (0.312 > 0.05), it can
be concluded that the data in the population is homogeneous.
2. Testing Hypothesis
Testing hypothesis aims to test between two variables, namely
the frequency of watching English movie as an independent variable and
pronunciation as the dependent variable. Then based on the normality test
and homogeneity test, the results show that the data is normally distributed
and the data variance is homogeneous. Therefore, the researcher analyzed
the data between the two variables using linear regression in SPSS 20 to
see whether the frequency of watching English movie affected the results
of recorded pronunciation tests. Furthermore, based on SPSS 20
calculations, data are collected as follows:
Table 4.24
Model Summaryb
Model R R Square Adjusted R
Square
Std. Error of
the Estimate
1 .752a .565 .554 6.672
a. Predictors: (Constant), Attitude, Frequency
b. Dependent Variable: Pronunciation
In this section there is R-Square = 0.565 (56.5%). This shows
that 56.5% of the dependent variable variation (Y) can be explained by the
independent variable (X), meaning that the effect of watching English-
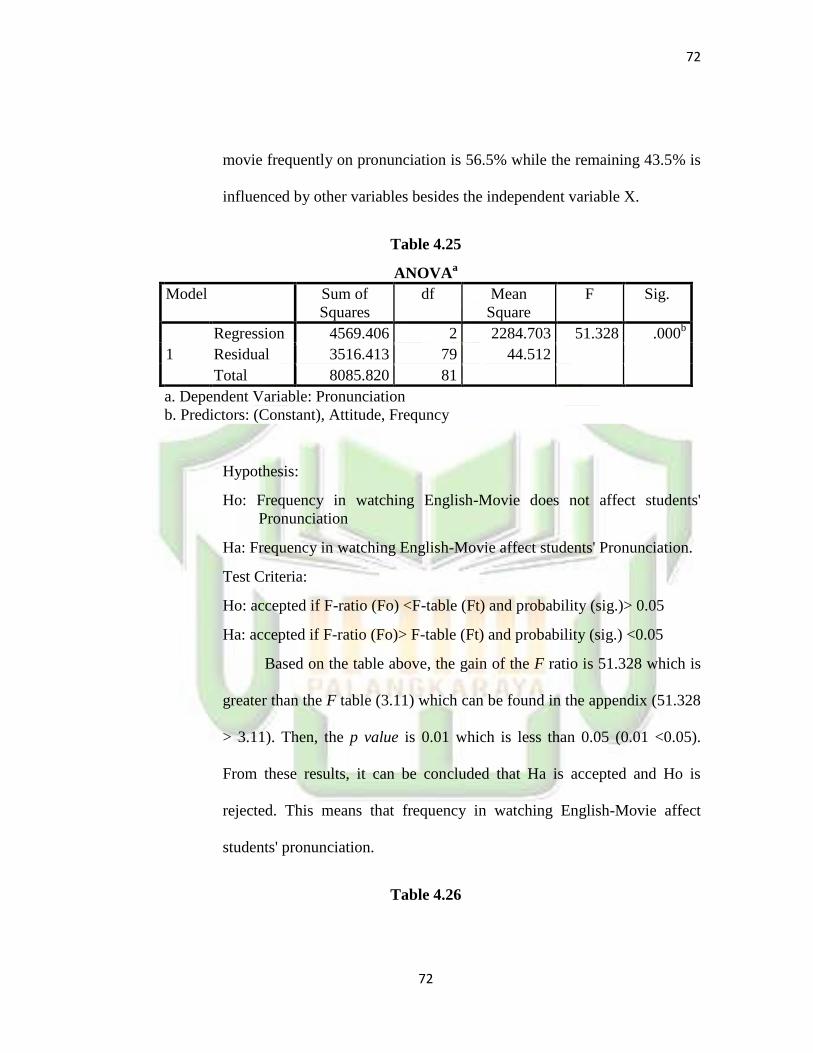
72
72
movie frequently on pronunciation is 56.5% while the remaining 43.5% is
influenced by other variables besides the independent variable X.
Table 4.25
ANOVAa
Model Sum of
Squares
df Mean
Square
F Sig.
1
Regression 4569.406 2 2284.703 51.328 .000b
Residual 3516.413 79 44.512
Total 8085.820 81
a. Dependent Variable: Pronunciation
b. Predictors: (Constant), Attitude, Frequncy
Hypothesis:
Ho: Frequency in watching English-Movie does not affect students'
Pronunciation
Ha: Frequency in watching English-Movie affect students' Pronunciation.
Test Criteria:
Ho: accepted if F-ratio (Fo) <F-table (Ft) and probability (sig.)> 0.05
Ha: accepted if F-ratio (Fo)> F-table (Ft) and probability (sig.) <0.05
Based on the table above, the gain of the F ratio is 51.328 which is
greater than the F table (3.11) which can be found in the appendix (51.328
> 3.11). Then, the p value is 0.01 which is less than 0.05 (0.01 <0.05).
From these results, it can be concluded that Ha is accepted and Ho is
rejected. This means that frequency in watching English-Movie affect
students' pronunciation.
Table 4.26
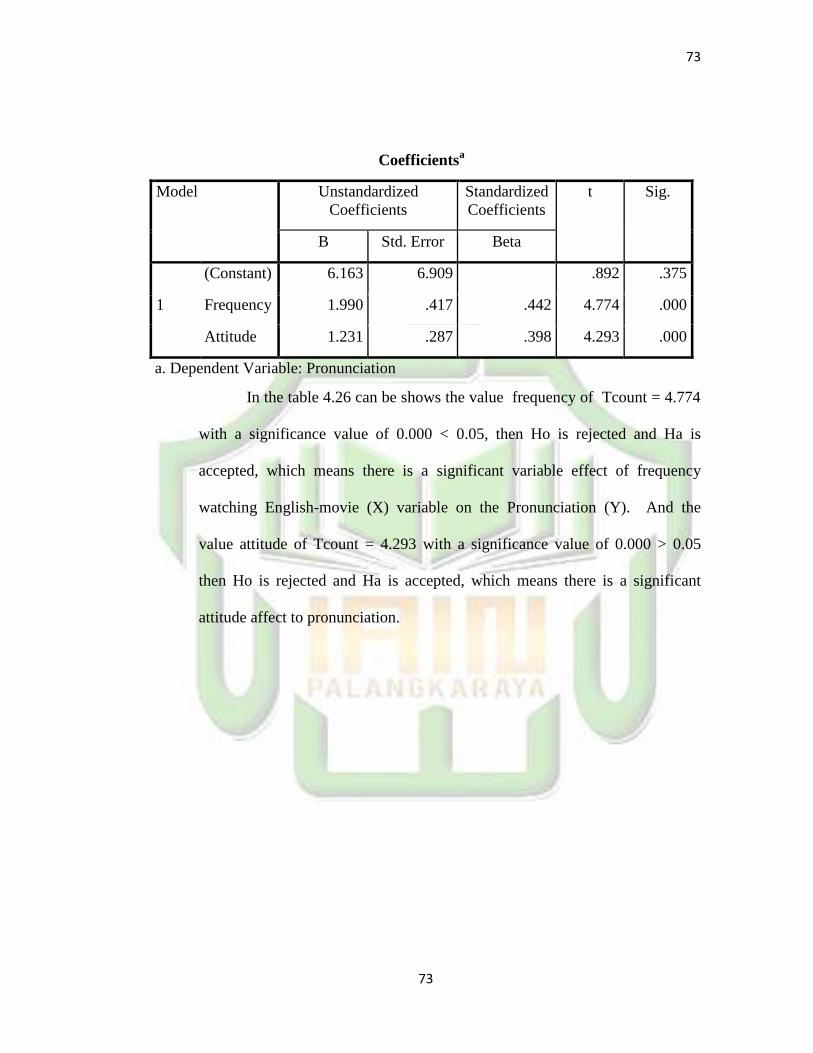
73
73
Coefficientsa
Model Unstandardized
Coefficients
Standardized
Coefficients
t Sig.
B Std. Error Beta
1
(Constant) 6.163 6.909 .892 .375
Frequency 1.990 .417 .442 4.774 .000
Attitude 1.231 .287 .398 4.293 .000
a. Dependent Variable: Pronunciation
In the table 4.26 can be shows the value frequency of Tcount = 4.774
with a significance value of 0.000 < 0.05, then Ho is rejected and Ha is
accepted, which means there is a significant variable effect of frequency
watching English-movie (X) variable on the Pronunciation (Y). And the
value attitude of Tcount = 4.293 with a significance value of 0.000 > 0.05
then Ho is rejected and Ha is accepted, which means there is a significant
attitude affect to pronunciation.
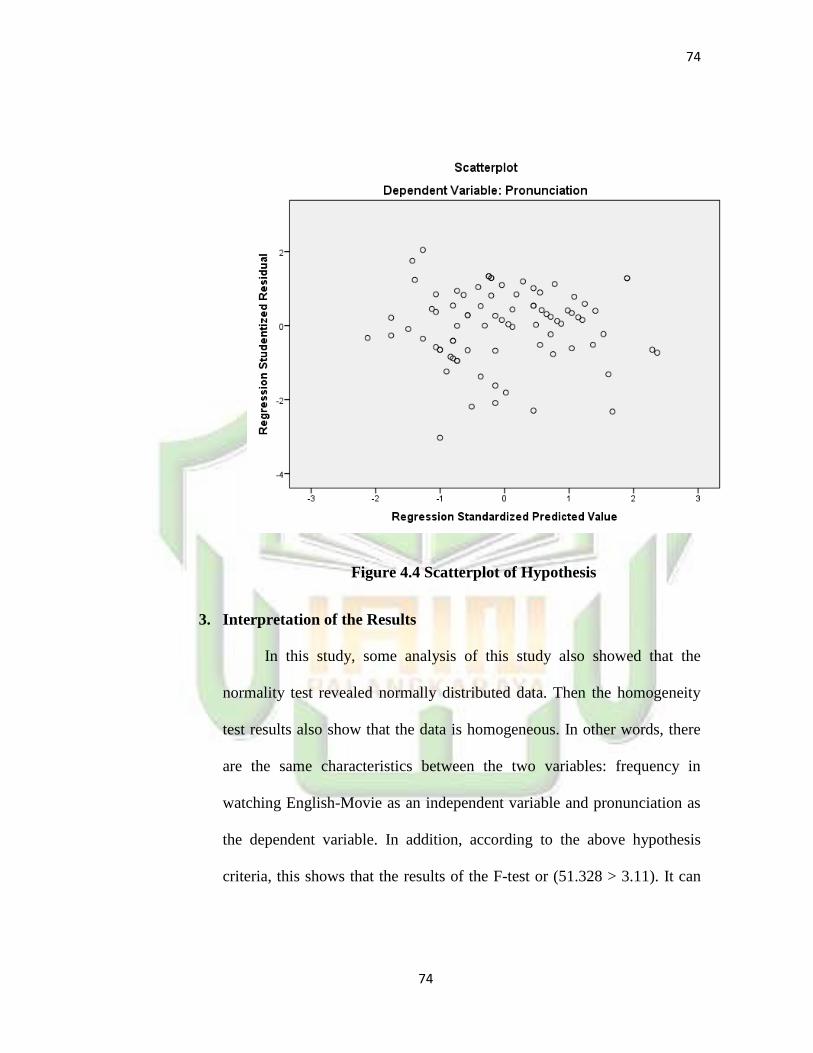
74
74
Figure 4.4 Scatterplot of Hypothesis
3. Interpretation of the Results
In this study, some analysis of this study also showed that the
normality test revealed normally distributed data. Then the homogeneity
test results also show that the data is homogeneous. In other words, there
are the same characteristics between the two variables: frequency in
watching English-Movie as an independent variable and pronunciation as
the dependent variable. In addition, according to the above hypothesis
criteria, this shows that the results of the F-test or (51.328 > 3.11). It can
75
75
be concluded that the frequency in watching English-movie affect the
pronunciation of students.
Based on the interpretation of the data above, it shows that the
frequency in watching English-movies affect students' pronunciation. In
other words, students who have the frequency of watching English-movies
affect their pronunciation.
In short, the results show that the hypothesis Ha is accepted and Ho
is rejected. It can be concluded that the frequency in watching English-
movie affect students' pronunciation.
C. Discussion
Based on description of this data it shows that there is a significant
effect of frequency in watching English-movie towards the pronunciation of
students. R-square value or the value of influence obtained is 56.5%, the
remaining 43.5% is influenced by other variables besides the independent
variable X which is not examined by researcher. And the Fcount value on
ANOVA is 51.328 greater than Ftable which is 3.11. Then the Tcount value is
4.774 with a significance value of 0.000 <0.05. Therefore, the alternative
hypothesis (Ha) is accepted and the null hypothesis (Ho) is rejected. Based on
this information it can be concluded that the frequency of watching English
films affects the pronunciation of students. The possible reason for this result
may be because there are other factors that affect students' pronunciation.
76
76
The same results were also found in a study from Nawal Aufa (2017),
finding that there was an effect of using English-movie to improve the
pronunciation skills of second semester English students at UIN Ar-Raniry
Darussalam Banda Aceh. In addition previous research by Mustika Ratna
Pratiwi (2010), this study also showed that there was a positive influence in
the use of English-movie to improve students' pronunciation, even though the
sample used was eighth grade junior high school students. And this research
focuses on English cartoon movies. In addition, a study conducted by Merita
Ismaili (2012), showed that the results significant or there was an influence on
the use of English-movie for teaching foreign languages that focused on
pronunciation, although in this study there was a slight disadvantage namely
that the movie did not allow interaction with a plot or character by imagining
it in their mind.
On the other hand, a study in Japan by Inage (2013) found that
learning pronunciation using English-movie increased their motivation for
learning languages. This study also reports that this activity has helped
improve students' pronunciation and vocabulary. However, this study does not
provide data on whether students' English proficiency is improved or not. In
addition, Bernaus, Masgoret, Gardner, & Reyes (2004) also found that
motivation, personality or professional learning English can influence the
need and desire for pronunciation like native people. This means that an
English movie is only a support for learning because the intention to be able
77
77
to pronounce is the main one. And the same case with Laroy and Miller
(2003) found that some students felt uncomfortable or unable to focus on
movies for pronunciation practice while others felt over time, they decided
that it was futile and impossible to learn English pronunciation using movie .
This researcher believes that changing and not changing speech patterns is
influenced by how much students are responsible, how much students practice
outside the classroom, and how ready students are.
Related to the theories above and related to research, researcher
conclude that using and watching English-movie frequently in students in
English education study programs plays a role in improving their
Pronunciation even at different levels, such as that of Avery & Ehrlich (1992)
also argues that often watching English movies and individual personalities in
many countries is one of the most important factors that can affect students
'pronunciation of foreign languages universally, and from this study can be
evidence that the frequency of watching English movie can affect students'
pronunciation.
78
CHAPTER V
CONCLUSION AND SUGGESTION
This chapter discusses the conclusion and suggestion of the study. The
researcher explains the conclusion of the study and some suggestions to the future
researcher.
A. Conclusion
Based on the calculation using SPSS 20 program with Linear
Regression. Then the result showed that the model summary R-Square =
0.565 (56.5%). It means that there is an influence of watching English-
movie frequently on students' pronunciation as much as 56.5%. Then, the
Fcount of ANOVA is 51.328 and Ftable is 3.11. It meant that Fcount
greater than F table or 51.328 > 3.11. And the Coefficient is Tcount =
7.989 with a significance value of 0.000 < 0.05. Meanwhile, 43.5% are
influenced by other variables, the possible reason why this study has an
effect is because there are other factors that the researcher is not careful
about. So there could be many factors that influence them for
pronunciation skills in every English course, even their skills or abilities
from their own personality. So that's why watching English-movies often
can affect students' pronunciation skills and sometimes not.
Moreover, the result of the calculation was counted by Linear
Regression and showed that Fcount is 51.328 which is greater than the
79
79
Ftable (3.11) which can be found in the appendix (51.328 > 3.11). Then,
the p value is 0.01 which is less than 0.05 (0.01 <0.05). From these results,
it can be concluded that Ha was accepted and Ho was rejected. This means
that frequency in watching English-Movie affect students' pronunciation.
B. Suggestion
Based on the research findings, the researcher wants to propose a
number of suggestions that may be useful and valuable for the second
semester students of the English study program at IAIN Palangka Raya
and the next lecturers and researchers:
1. For Students
It is recommended that students learn more aspects of the
pronunciation, because if you rely on watching English films without
continuing to practice and the strong intention has little effect. Because
the results in this study there is significant effect of frequency in
watching English movie towards pronunciation. So students must find
many suitable strategies to learn more about how to have a good
pronunciation and also their performance in understanding
pronunciation when speaking a foreign language.
2. For Lecturers
It was suggested the lecturer that to the students‘ understanding
level, problems in learning English, and students‘ strategy in learning
English. Especially, to study Pronunciation more seriously and place
80
80
the material in an understanding course using English-movie or other
alternatives.
3. For the Next Researchers
This study investigates the effect frequency in watching English-
movie towards pronunciation. This is quantitative research with ex post
facto design. It is also recommended to follow up these findings by
conducting similar research with further researcher might have another
research or another aspect of watching English-movie towards
pronunciation.
81
81
REFERENCES
Ary, Donald., Jacobs, L. S., & Sorensen, C. 2010. Introduction to Research In
Education (8th
ed.). New York: Wadsworth/Thomson Learning.
Brown, Kelly Shannon. 2010. Popular Films in The EFL Classroom: Study of
Methodology. Procedia – Social and Behavioral Sciences, 3 (2010): p.45-
46. (Online)¸ www.sciencedirect.com.
Cresswel, J. W. 2012. Educational research (4th
ed.). Boston: Pearson Edication.
Djiwandono, Soenardi. 2008. Tes Bahasa Pegangan Bagi Pengajar Bahasa. Jakarta:
Indeks
English Speeches. 2018. Rihanna, Start Helping One Person. Situs,
www.englishspeeches.com, https://www.youtube.com/watch?v=nlwU-
9ZTTJc
Gilakjani, Abbas. 2018. The Role of EFL Teachers in Improving EFL Learners‘
English Pronunciation. International Conference on Literature and
Linguistics, p.3-4.
Gilakjani, Abas. & Ahmadi, Reza Mohammad. 2011. Why is Pronunciation So
Difficult to Learn. English Language Teaching, 4(3): 75-78.
82
82
Haghverdi, Reza Hamid. 2015. The Effect Song and Movie on High School Students
Language Achievement in Dehdasht. Procedia – Social and Behavioral
Sciences, 192 (2015): p. 313-314. (Online)¸ www.sciencedirect.com.
Hakim, Rahman Arif M. 2012. An Analysis Phonetics b, d, g, j, ʤ and ð into English
Pronunciation for Java Students ( A Study On Java Students at English
Department on STAIN Bengkulu Academic Year 2011-2012). International
Journal of Humanities and Social Science, 2(20): 244-247.
Hasanah, Uswatun. & Mirza, Ali Akhmad. 2016. The Effectiveness of English
Cartoon Movie Towards Vocabulary Score. Kalimantan Tengah: IAIN
Palangka Raya.
Hidayati, Khusnul. 2014. The Influence Of Questioning Strategy On Students’
Achievement in Reading. Jakarta: UIN Syarif Hidayatullah.
Ismaili, Merita. 2013. The Effectiveness of Using Movies in the EFL Classroom - A
Study Conducted at South East European University. Academic Journal of
Interdisciplinary Studies, 2(4): 121-122.
Heaton, J. B. 1974. Writing English Language Test. England: New Edition Longman
Group.
Khaghaninejad, Saber Mohammad. & Maleki, Abolfazl. 2015. The Effect of Explicit
Pronunciation Instruction on Listening Comprehension: Evidence From
83
83
Iranian English Learners. Theory and Practice in Language Studies, 5(6):
1249-1256.
Mustika Ratna Pratiwi. 2010. Improving Pronunciation Ability Using Cartoon Films.
Surakarta: University Surakarta.
Nawal Aufa. 2017. Using Movie to Increase Students’ Pronunciation. Banda Aceh:
UIN Ar-Raniry.
Rasyid, Suparta. 2016. Using Cartoon Movie to Improve Speaking Skill. Research in
English and Education (READ), 1(2): 161-168.
Rokni, Abdolmanafi Jalal S. & Ataee, Jannati Azzam. 2014. Movies In EFL
Classroom: With Or Without Subtitles. The Dawn Journal, 3(1): 715-717.
Shing, Ruey Soo. & Yin, Kun Lim. 2014. Using Films to Teach Speaking in the ESL
Classroom: A Case Study. UNISEL Journal of Social and Humanities, 1(1):
50-56.
Smithikrai, Chucai. 2016. Effectiveness of Teaching with Movies to Promote
Possitive Characteristic and Behaviors. Procedia – Social and Behavioral
Sciences, 217 (2016): p.523. (Online)¸ www.sciencedirect.com.
Tim Penyusun Pedoman Penulisan Skripsi. 2017. Pedoman Penulisan Skripsi IAIN
Palangka Raya. Palangka Raya: IAIN Palangka Raya.