the effect of future climate change on aerosols: biogenic...
TRANSCRIPT

The Effect of Future ClimateChange on Aerosols:
Biogenic SOA and Inorganics
GCAP Phase 2 Science Team Meeting
October 12, 2007
Havala O. T. Pye1, Hong Liao2, John Seinfeld1,
Shiliang Wu3, Loretta Mickley3, Daniel Jacob3,
Athanasios Nenes4
1California Institute of Technology, 2Chinese Academy of Sciences,3Harvard University, 4Georgia Institute of Technology

How Will Changing Climate and EmissionsAffect Aerosols?
Gas Phase Chemistry
(T)
Inorganic Aerosols
(NH4+, NO3
-, SO42-,
seasalt, mineral dust)
Organic Aerosols (BC,
POA, SOA)
Lightning NOX
(T, cloud top height, etc.)
Seasalt (u) SO4
2-
Other Natural andAnthropogenicemissions:
NOX, SO2, NH3 …
Natural emissions:
DMS
Soil NOX
Biogenic HCs
(u, T, precip., …)BC
POA
SOA eqlb
partitioning
(T)
Inorganic
equilibrium
(T, RH)
Dry
deposition
(stability)
Wet
deposition
(precip.,…)
transport
SO42-
production
(clouds,…)

Outline
• Findings from the GISS GCMTropospheric Unified Simulation[Liao et al.]
• Comparison of GEOS-Chempredictions to observations
• The influence of climate onbiogenic SOA
• Implementation ofISORROPIAII for inorganicaerosols
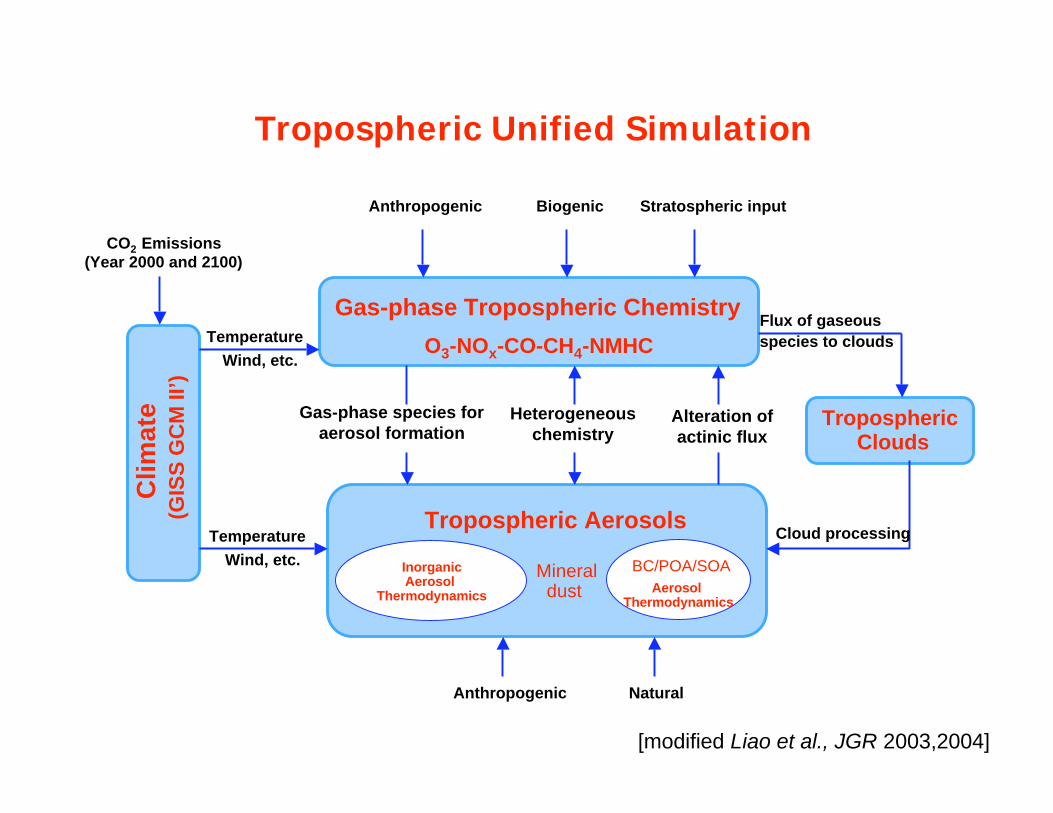
Cli
ma
te (
GIS
S G
CM
II’
)
Gas-phase Tropospheric Chemistry
O3-NOx-CO-CH4-NMHC
Tropospheric Clouds
Tropospheric Aerosols
Temperature
Wind, etc.
Temperature
Wind, etc.
Gas-phase species for
aerosol formationHeterogeneous
chemistryAlteration of
actinic flux
Anthropogenic Natural
Anthropogenic Biogenic Stratospheric input
Flux of gaseous
species to clouds
Cloud processing
Aerosol Thermodynamics
BC/POA/SOAMineral dust
InorganicAerosol
Thermodynamics
Tropospheric Unified Simulation
[modified Liao et al., JGR 2003,2004]
CO2 Emissions
(Year 2000 and 2100)
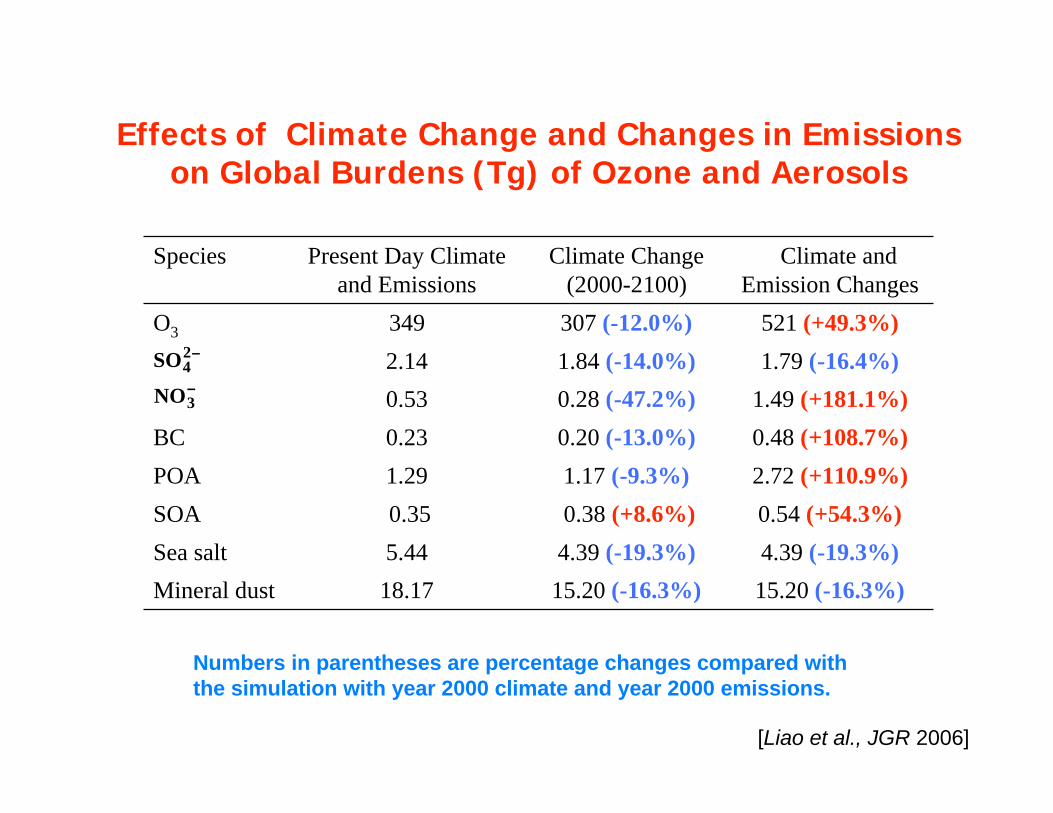
Numbers in parentheses are percentage changes compared with
the simulation with year 2000 climate and year 2000 emissions.
Effects of Climate Change and Changes in Emissionson Global Burdens (Tg) of Ozone and Aerosols
15.20 (-16.3%)
4.39 (-19.3%)
0.38 (+8.6%)
1.17 (-9.3%)
0.20 (-13.0%)
0.28 (-47.2%)
1.84 (-14.0%)
307 (-12.0%)
Climate Change
(2000-2100)
18.17
5.44
0.35
1.29
0.23
0.53
2.14
349
Present Day Climate
and Emissions
15.20 (-16.3%)Mineral dust
4.39 (-19.3%)Sea salt
0.54 (+54.3%)SOA
2.72 (+110.9%)POA
0.48 (+108.7%)BC
1.49 (+181.1%)
1.79 (-16.4%)
521 (+49.3%)O3
Climate and
Emission Changes
Species
2
4SO
3NO
[Liao et al., JGR 2006]

GEOS-Chem with GISS GCMMeteorology:Predictions
Compared to Observations

Sulfate Aerosol Predictions and Observations
GEOS-Chem IMPROVE
-0.49 μg/m3US
-0.90 μg/m3Eastern US
-0.33 μg/m3Western US
Mean bias* in 1.37 x [SO42-]
[Liao et al., 2007]
*
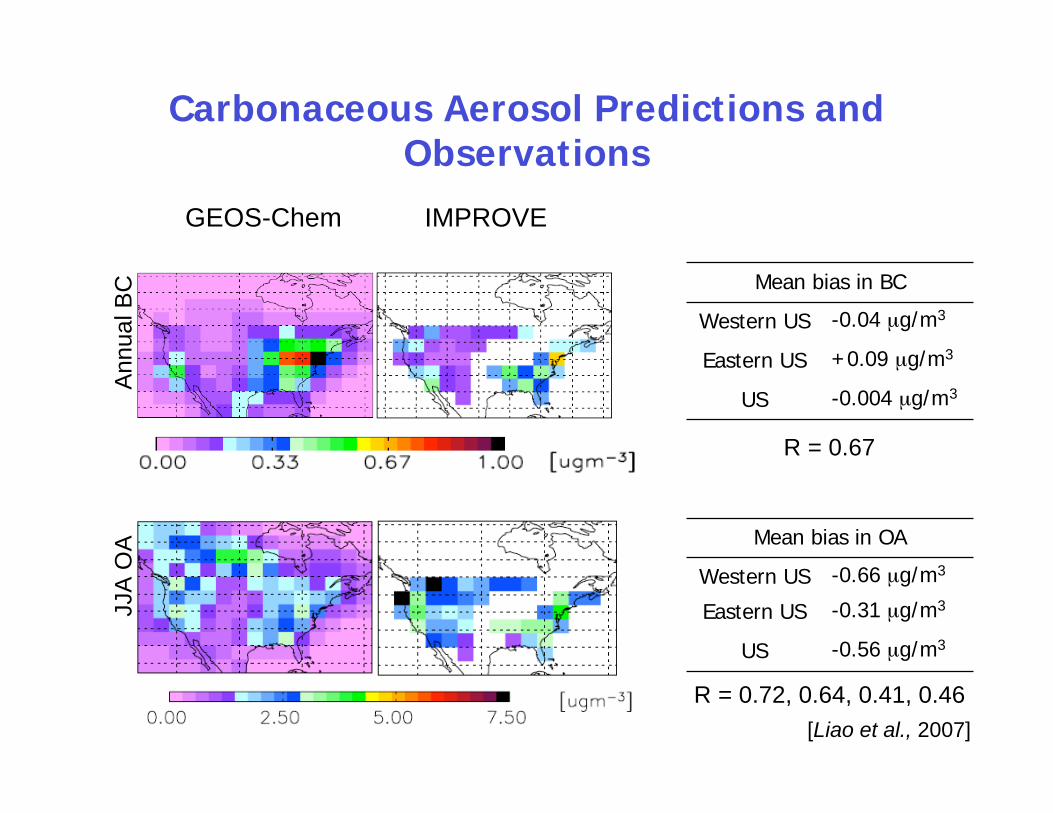
Carbonaceous Aerosol Predictions andObservations
[Liao et al., 2007]
Annual B
C
IMPROVEGEOS-Chem
JJA
OA
-0.004 μg/m3US
+0.09 μg/m3Eastern US
-0.04 μg/m3Western US
Mean bias in BC
-0.56 μg/m3US
-0.31 μg/m3Eastern US
-0.66 μg/m3Western US
Mean bias in OA
R = 0.67
R = 0.72, 0.64, 0.41, 0.46
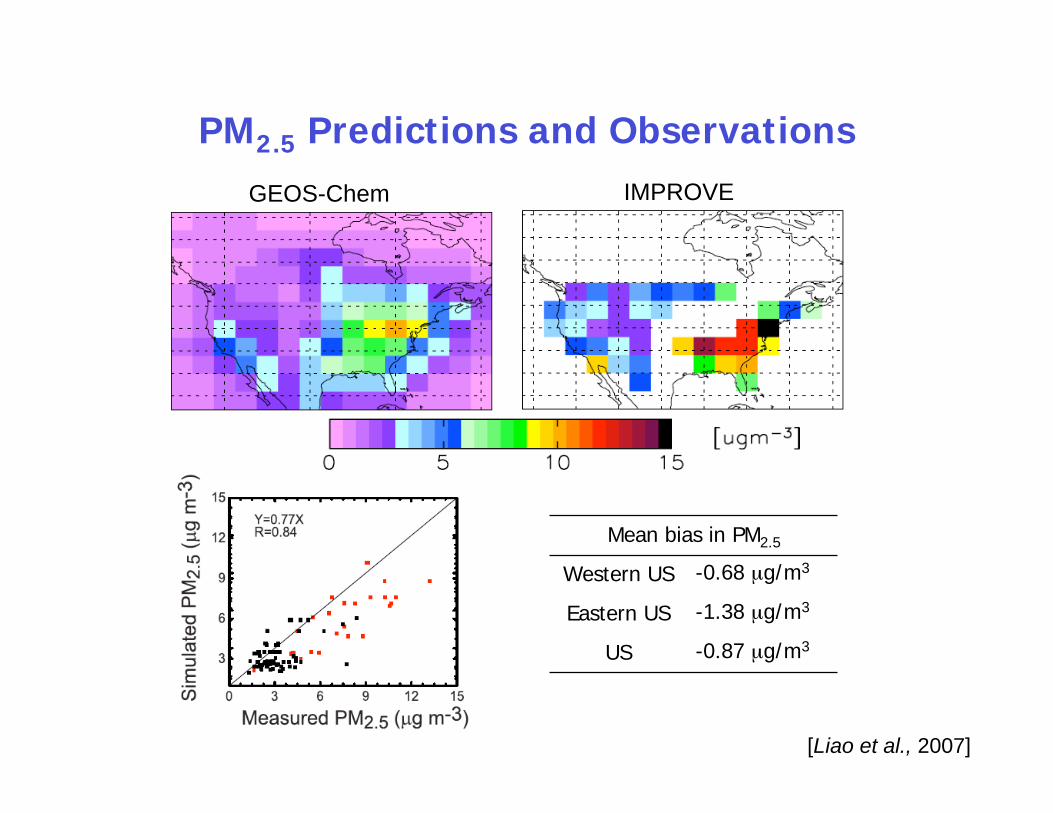
PM2.5 Predictions and Observations
GEOS-Chem IMPROVE
-0.87 μg/m3US
-1.38 μg/m3Eastern US
-0.68 μg/m3Western US
Mean bias in PM2.5
[Liao et al., 2007]

Biogenic SOAand Climate Change

Climate Change and Biogenic SOA
Objective: Determine the effect of climate change on SOA
Approach for examining the effect of climate change on SOA:
GEOS-Chem (v.7-04-05)
full chemistry simulation
GEOS-Chem (v.7-04-05)
full chemistry simulation
GISS GCM III meteorology
(1999-2001)
GISS GCM III meteorology
(2049-2051
AIB GHG driven climate)
Compare
predicted SOA
concentrations
(Anthropogenic emissions held constant)

SOA is represented using a
two (or one) product model:
Parameters obtained from laboratory experiments: i , K
OM,i
SOA Model
HC + Ox 1G1 + 2G2
A1 A2
Oi
i
iOM
MG
AK
][
][, =
=O
i
O
OiOMiOM
TTR
H
T
TTKTK
11exp)()( ,,
+=i
iOAPOAM ][][
[Chung and Seinfeld, 2002; Pankow, 1994]
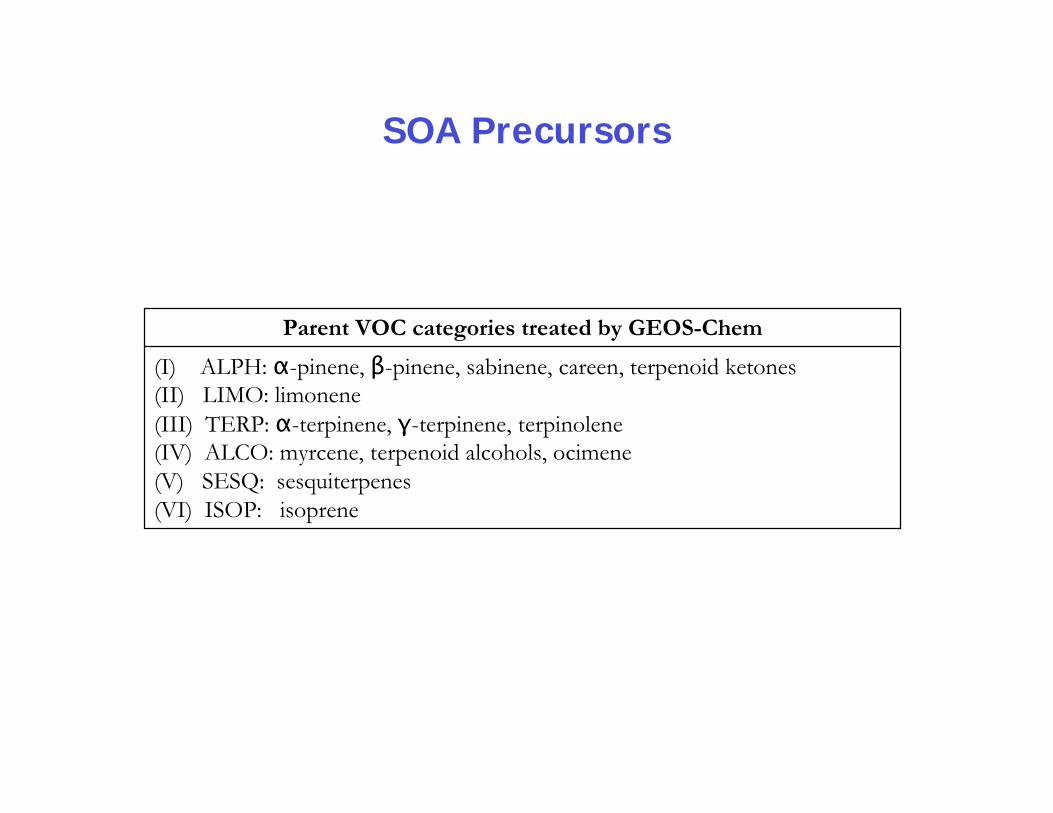
SOA Precursors
(I) ALPH: -pinene, -pinene, sabinene, careen, terpenoid ketones(II) LIMO: limonene
(III) TERP: -terpinene, -terpinene, terpinolene(IV) ALCO: myrcene, terpenoid alcohols, ocimene
(V) SESQ: sesquiterpenes
(VI) ISOP: isoprene
Parent VOC categories treated by GEOS-Chem
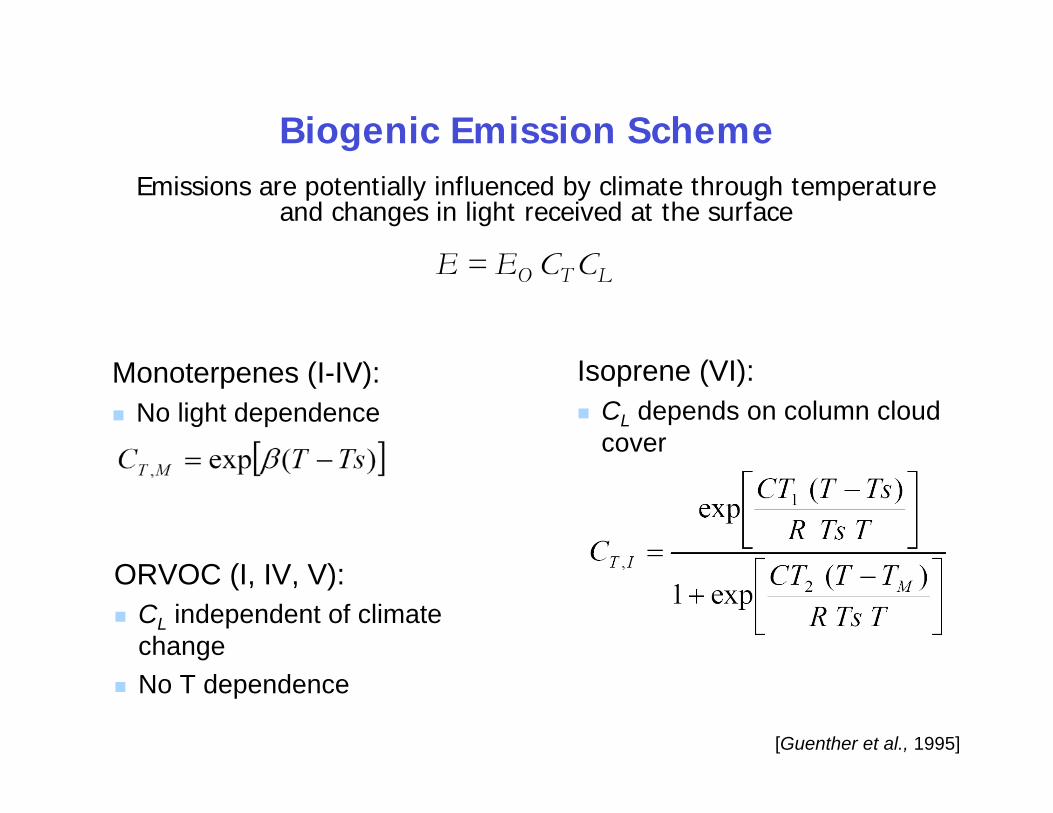
Biogenic Emission Scheme
Emissions are potentially influenced by climate through temperatureand changes in light received at the surface
Monoterpenes (I-IV):
No light dependence
ORVOC (I, IV, V):
CL independent of climate
change
No T dependence
Isoprene (VI):
CL depends on column cloud
cover
E = EO CT CL
[Guenther et al., 1995]

Predicted Present Day SOA Concentrations
DJF MAM
JJA SON

Predicted Present Day SOA Concentrations:The U. S.
DJF MAM
JJA SON
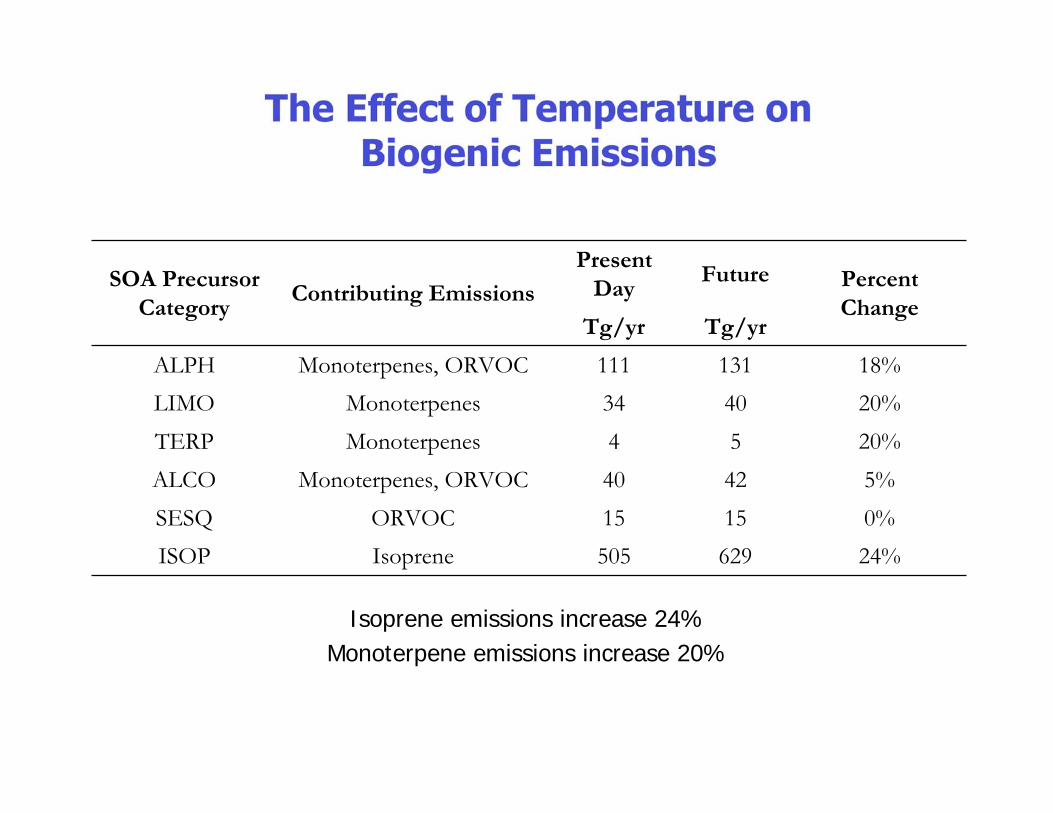
The Effect of Temperature onBiogenic Emissions
Isoprene emissions increase 24%
Monoterpene emissions increase 20%
24%629505IsopreneISOP
0%1515ORVOCSESQ
5%4240Monoterpenes, ORVOCALCO
20%54MonoterpenesTERP
20%4034MonoterpenesLIMO
18%131111Monoterpenes, ORVOCALPH
Tg/yrTg/yr
PercentChange
FuturePresent
DayContributing EmissionsSOA Precursor
Category

Changes in SOA Surface Concentrations
• SOA concentrations increase near source regions
• Decreases in SOA are related to strong increases in precipitation
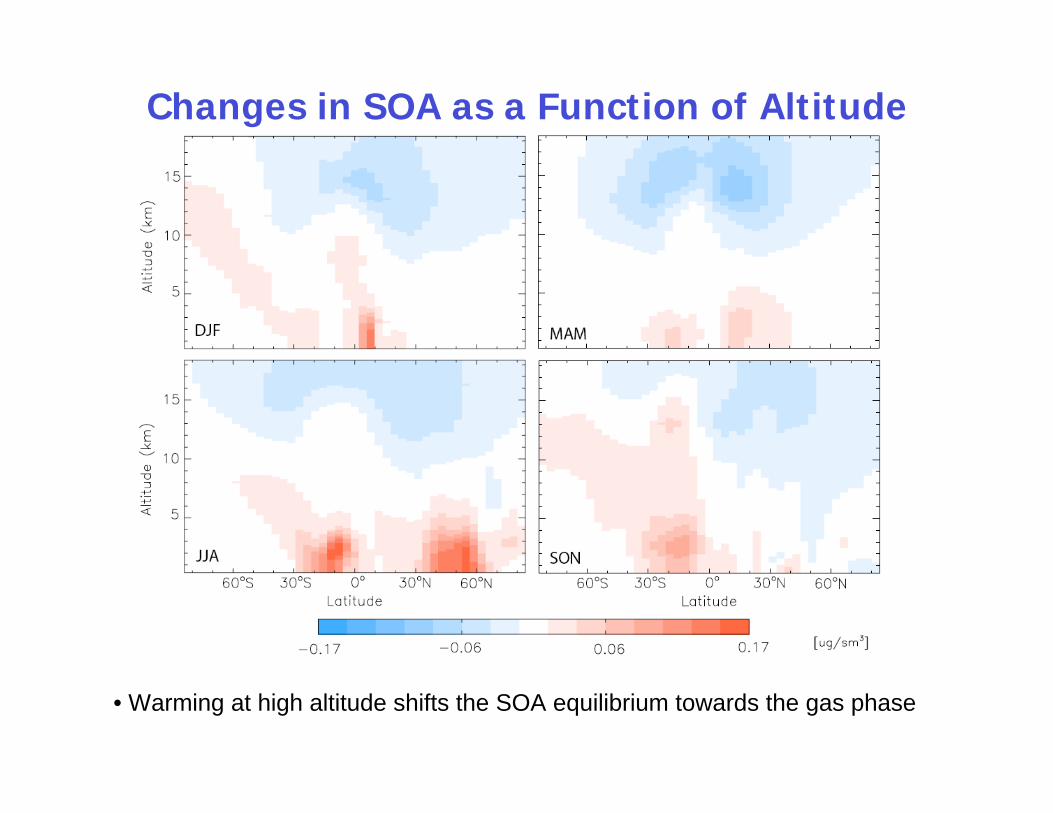
Changes in SOA as a Function of Altitude
• Warming at high altitude shifts the SOA equilibrium towards the gas phase
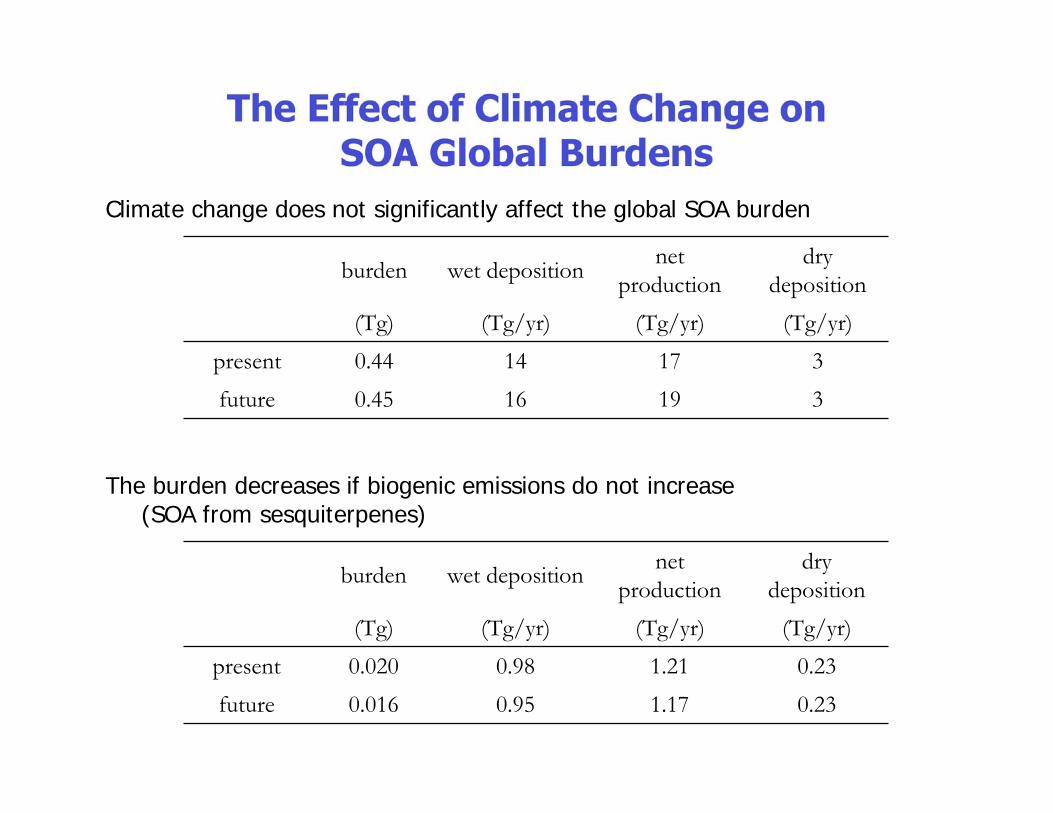
The Effect of Climate Change onSOA Global Burdens
Climate change does not significantly affect the global SOA burden
The burden decreases if biogenic emissions do not increase(SOA from sesquiterpenes)
319160.45future
317140.44present
(Tg/yr)(Tg/yr)(Tg/yr)(Tg)
dry
deposition
net
productionwet depositionburden
0.231.170.950.016future
0.231.210.980.020present
(Tg/yr)(Tg/yr)(Tg/yr)(Tg)
dry
deposition
net
productionwet depositionburden

Conclusions
• Higher temperatures in the future result in higherbiogenic emissions
• In general, surface SOA concentrations are elevatedin the future
• Concentrations of SOA in the upper troposphere aretypically lower in the future
• Despite changes in concentrations, the SOA globalburden remains constant with 2000—2050 climatechange
ISORROPIAII forInorganic Aerosols

Inorganic Aerosols
DMS gas
phase
chemistry
SO2 Chemistry
SO42-
Aerosol Phase in Thermodynamic Equilibrium
DMS emission
SO4 emission
SO2 emission
NH4+
water
NH3
NH3 emission
NO3-
HNO3
Na+ Cl-
Ca2+
Mg2+K+
NOX
chemistry
NOX emission
Seasalt
emission
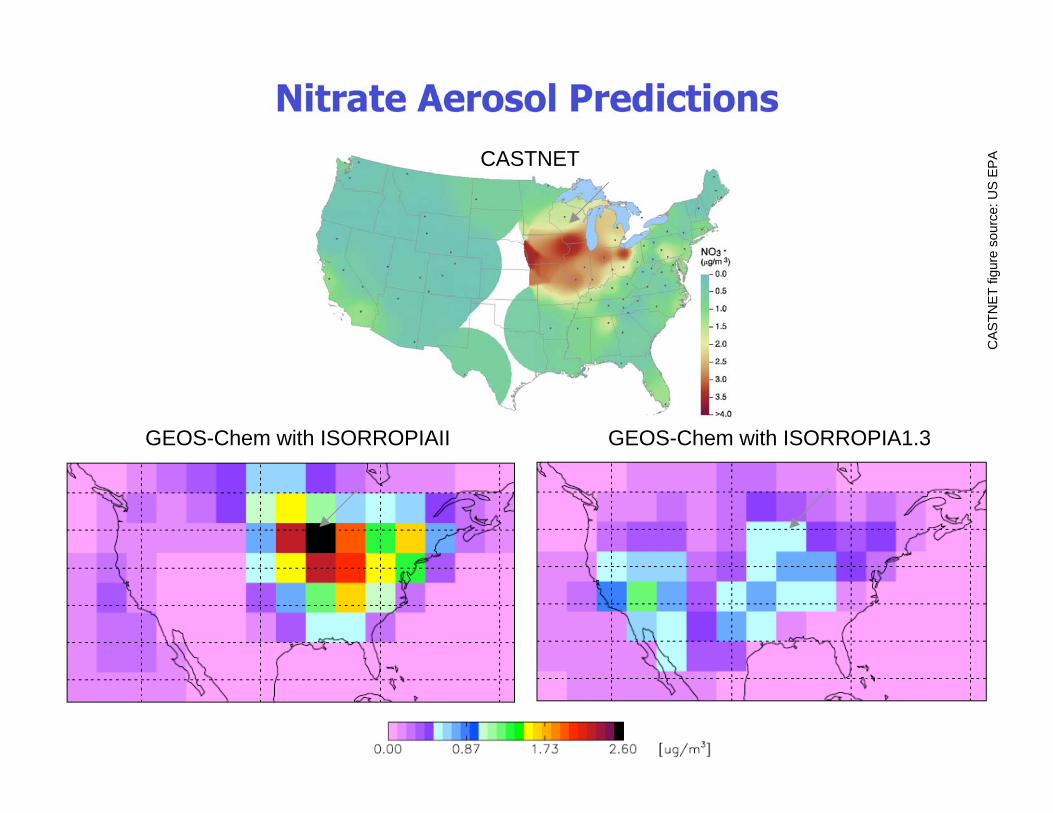
Nitrate Aerosol Predictions
CASTNET
GEOS-Chem with ISORROPIAII GEOS-Chem with ISORROPIA1.3
CA
ST
NE
T fig
ure
sourc
e: U
S E
PA

Seasonal Nitrate ConcentrationsGEOS-Chem with ISORROPIAII GEOS-Chem with ISORROPIA1.3
JAN
APR
JULY
OCT

Seasonal NIT Comparison to Observations
DJF MAM JJA SON
Units: ug/m3
Annual
Predictions
CASTNET IMPROVE
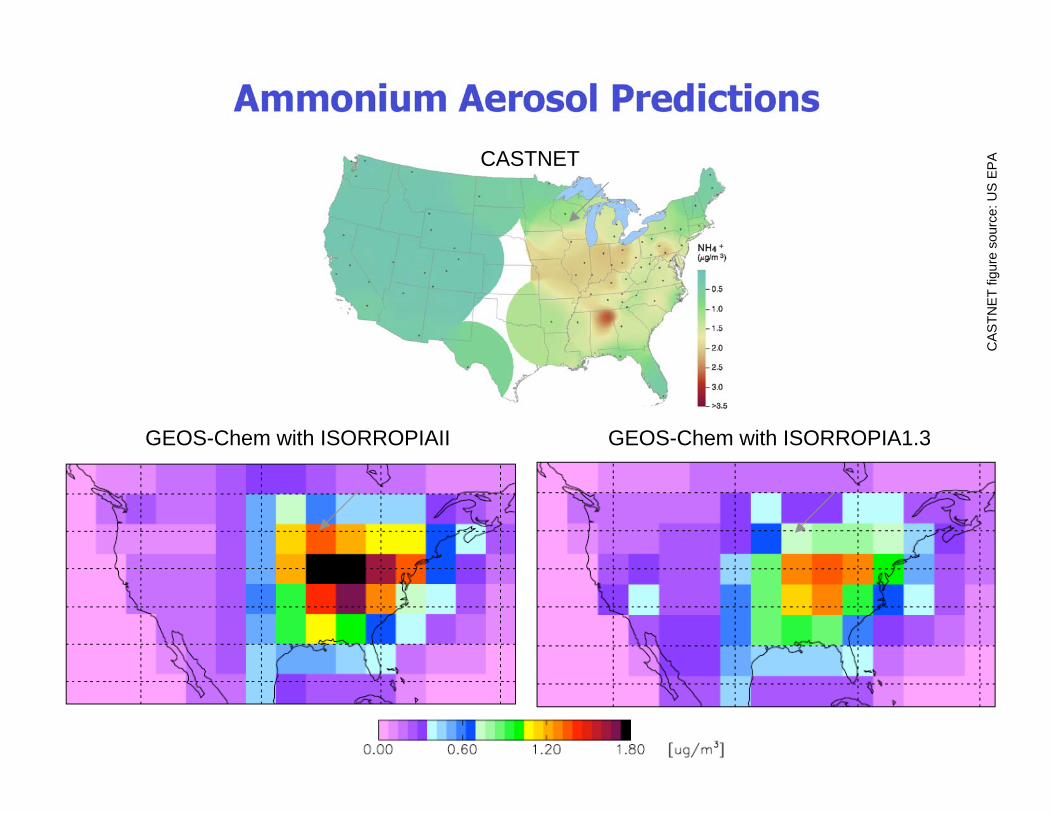
Ammonium Aerosol Predictions
CASTNET
GEOS-Chem with ISORROPIAII GEOS-Chem with ISORROPIA1.3
CA
ST
NE
T fig
ure
sourc
e: U
S E
PA

Seasonal Ammonium ConcentrationsGEOS-Chem with ISORROPIAII GEOS-Chem with ISORROPIA1.3
JAN
APR
JULY
OCT

Seasonal NH4+ Comparison to Observations
DJF MAM JJA SON
Units: ug/m3
Annual
Predictions
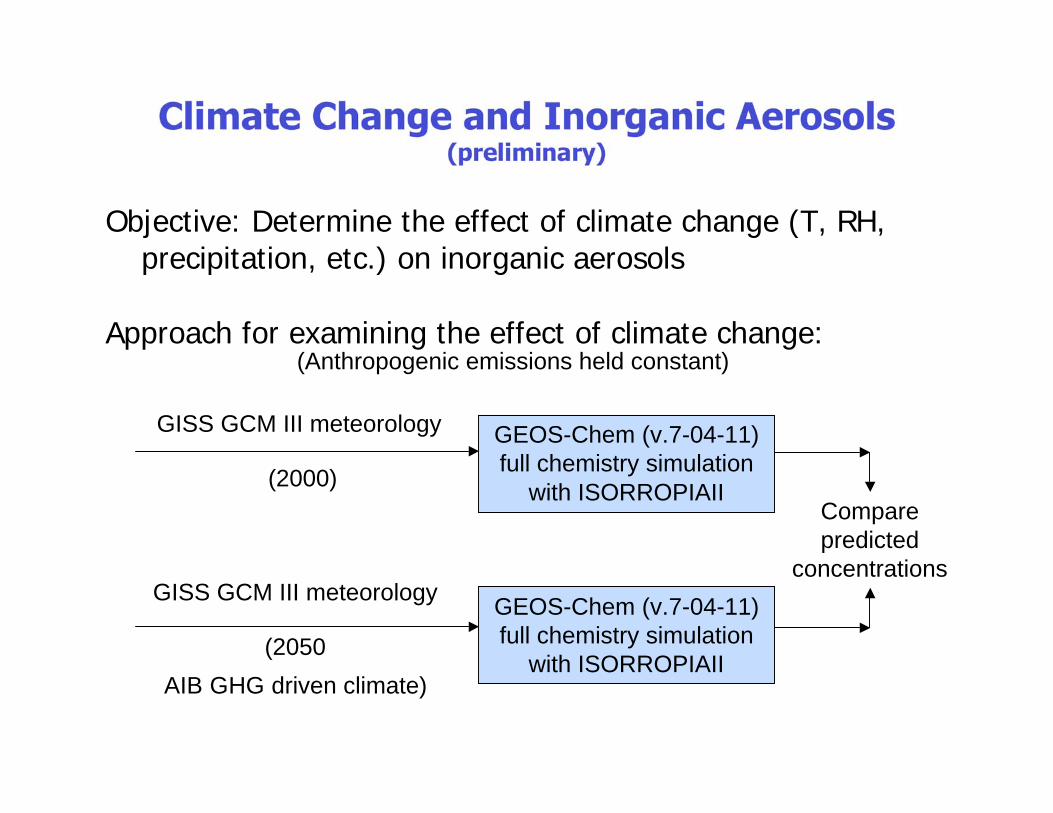
Climate Change and Inorganic Aerosols(preliminary)
Objective: Determine the effect of climate change (T, RH,precipitation, etc.) on inorganic aerosols
Approach for examining the effect of climate change:
GEOS-Chem (v.7-04-11)
full chemistry simulation
with ISORROPIAII
GEOS-Chem (v.7-04-11)
full chemistry simulation
with ISORROPIAII
GISS GCM III meteorology
(2000)
GISS GCM III meteorology
(2050
AIB GHG driven climate)
Compare
predicted
concentrations
(Anthropogenic emissions held constant)
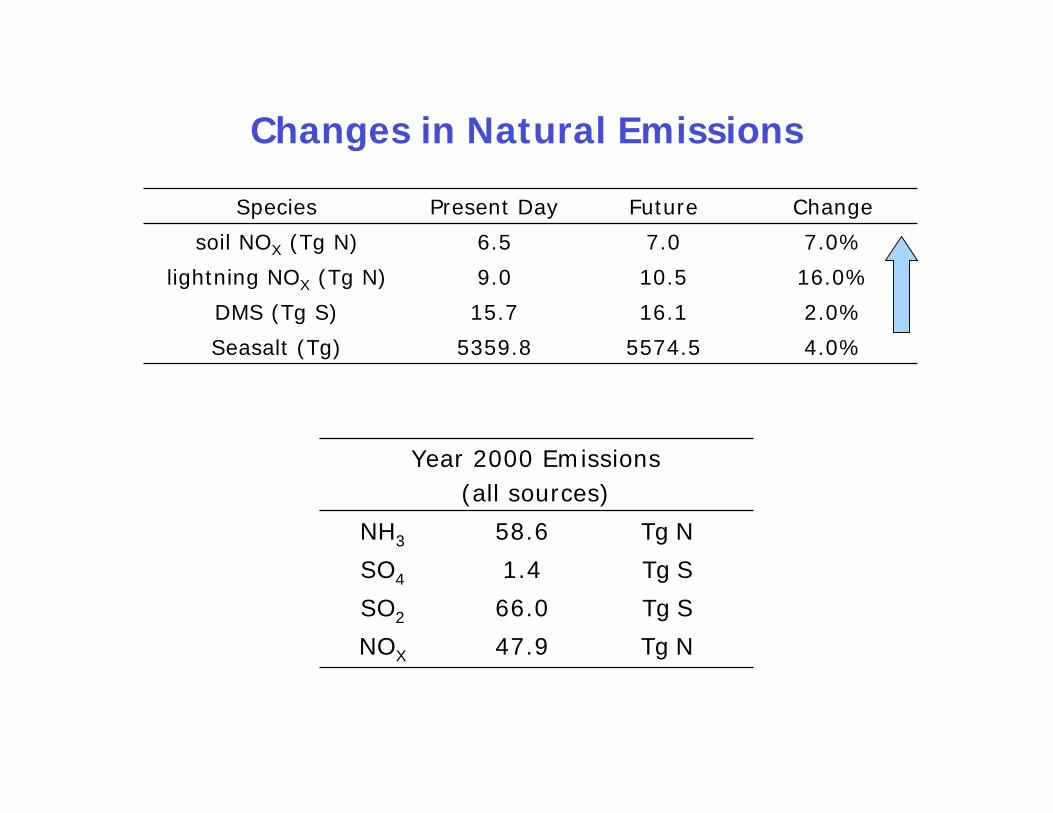
Changes in Natural Emissions
4.0%5574.55359.8Seasalt (Tg)
2.0%16.115.7DMS (Tg S)
16.0%10.59.0lightning NOX (Tg N)
7.0%7.06.5soil NOX (Tg N)
ChangeFuturePresent DaySpecies
47.9
66.0
1.4
58.6
NOX
SO2
SO4
NH3
Year 2000 Emissions
(all sources)
Tg N
Tg S
Tg S
Tg N

Changes in Sulfate
• No significant change in sulfate global burden (~0.85 Tg)
• MAM, JJA, SON surface concentration changes reflect changes in precipitation
• Jan concentration changes suggest an influence other than precipitation
MAMJan
JJA SON

Changes in Nitrate Concentrations
• Jan surface concentrations follow Temperature change trend (higher T=lower NIT)
• Precipitation plays a more minor role in controlling NIT concentrations
• ISORROPIA II predicts minor (<~0.08 μg/m3) evaporation of Nitrate (RPMARES does not
show the same trend) at higher altitudes (10-15 km)
MAMJan
JJA SON
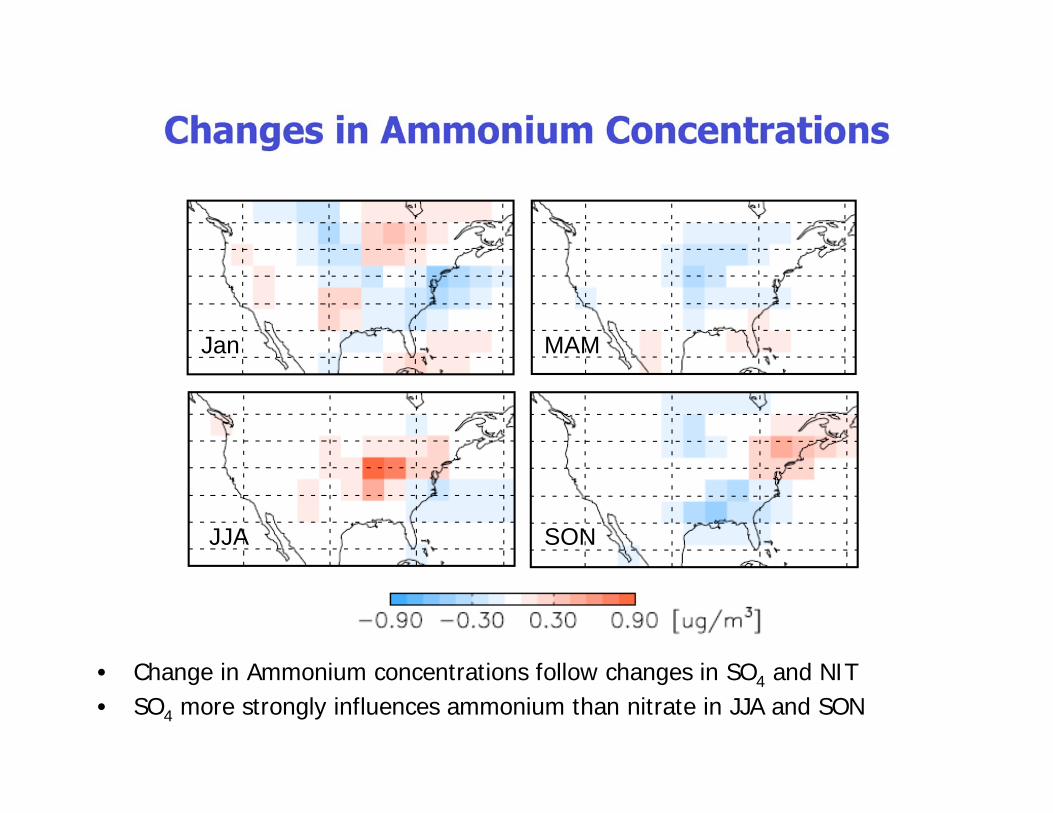
Changes in Ammonium Concentrations
• Change in Ammonium concentrations follow changes in SO4 and NIT
• SO4 more strongly influences ammonium than nitrate in JJA and SON
MAMJan
JJA SON
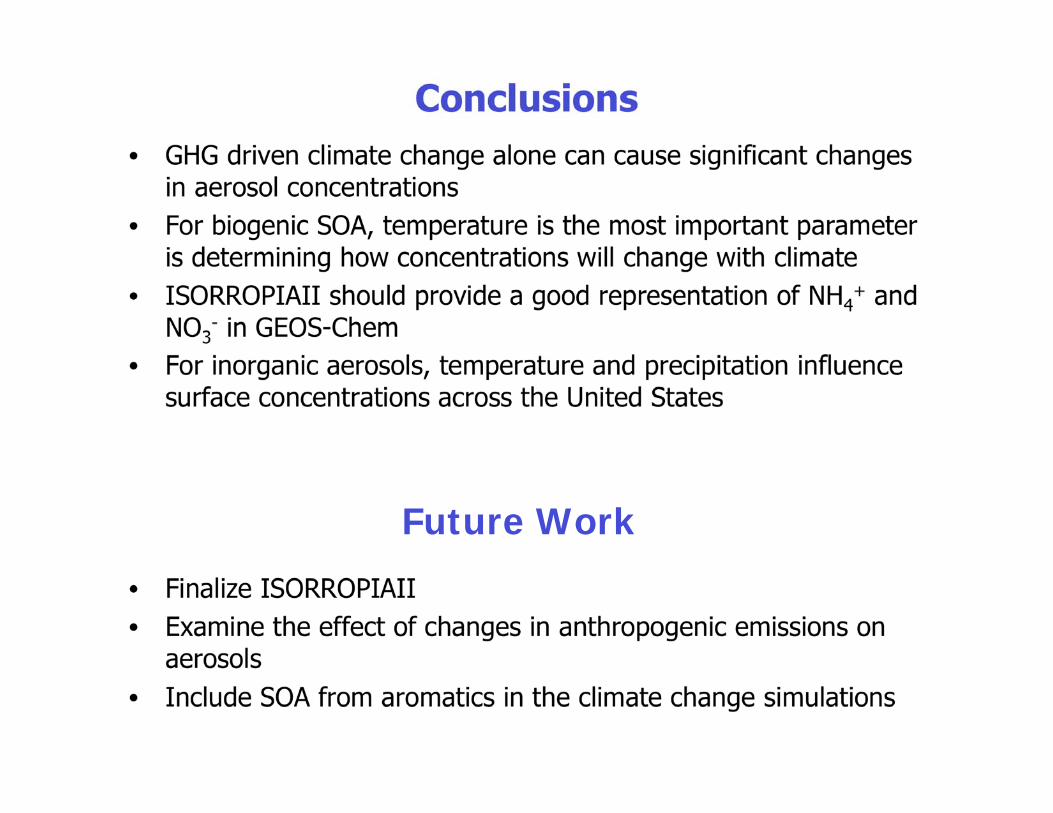
Conclusions
• GHG driven climate change alone can cause significant changesin aerosol concentrations
• For biogenic SOA, temperature is the most important parameteris determining how concentrations will change with climate
• ISORROPIAII should provide a good representation of NH4+ and
NO3- in GEOS-Chem
• For inorganic aerosols, temperature and precipitation influencesurface concentrations across the United States
• Finalize ISORROPIAII
• Examine the effect of changes in anthropogenic emissions onaerosols
• Include SOA from aromatics in the climate change simulations
Future Work

Acknowledgements This material is based upon work supported under a
National Science Foundation Graduate ResearchFellowship. Support from EPA is also appreciated.
References:
• Chung, S. H. and J. H. Seinfeld (2002), Global distribution and climateforcing of carbonaceous aerosols, J. Geophys. Res., 107, D19, 4407.
• Guenther, A., et al. (1995), A global model of natural volatile organiccompound emissions, J. Geophys. Res., 100, D5, 8873-8892.
• Pankow, J. F. (1994), An absorption model of gas/particle partitioning oforganic compounds in the atmosphere, Atmos. Environ., 28, 185-188.
• Wu, S., L. J. Mickley, D. J. Jacob, D. Rind, and D. G. Streets (2007), Effectof 2000-2050 global change on ozone air quality in the United States, inpreparation .
• Liao, H., et al. (2006), Role of climate change in global predictions of futuretropospheric ozone and aerosols, J. Geophys. Res., 111(D12).
• Liao, H., et al. (2007), Biogenic secondary organic aerosol over the UnitedStates: Comparison of climatological simulations with observations, J.Geophys. Res., 112(D6).
• Fountoukis, C., and A. Nenes (2007), ISORROPIA II: a computationallyefficient thermodynamic equilibrium model for K+-Ca2+-Mg2+-NH4+-Na+-SO42--NO3--Cl--H2O aerosols, Atmos. Chem. Phys. Discuss., 7.

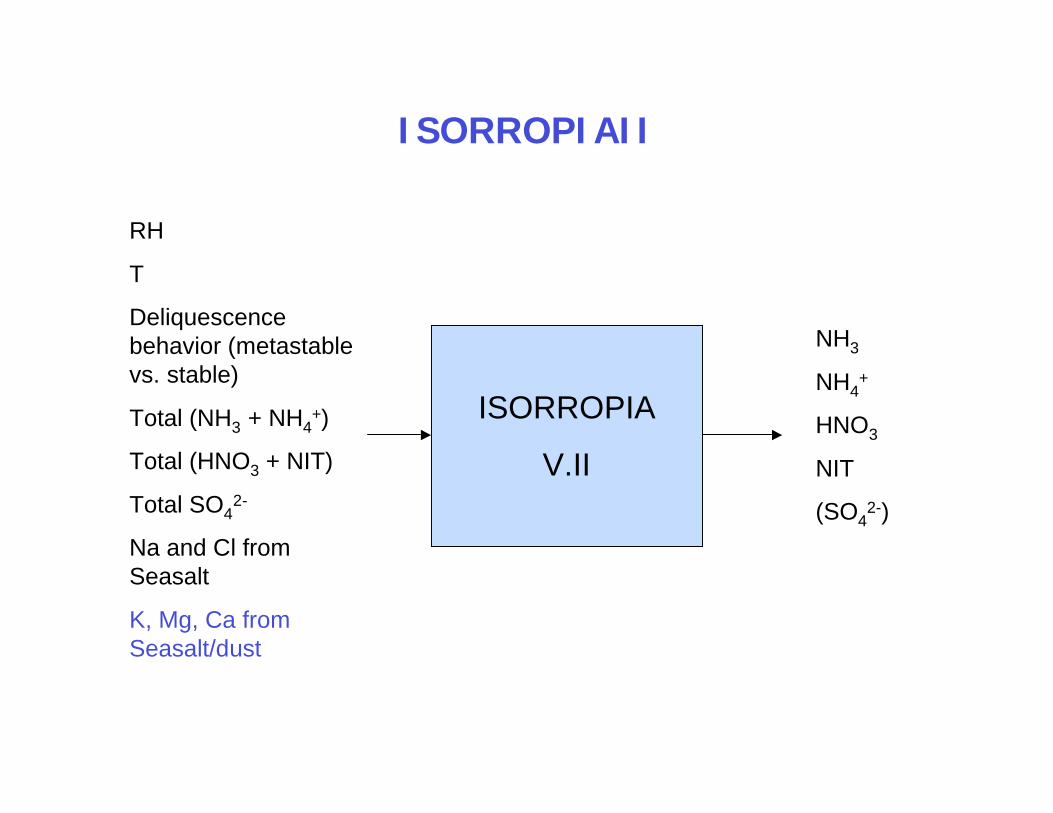
ISORROPIAII
ISORROPIA
V.II
RH
T
Deliquescence
behavior (metastable
vs. stable)
Total (NH3 + NH4+)
Total (HNO3 + NIT)
Total SO42-
Na and Cl from
Seasalt
K, Mg, Ca from
Seasalt/dust
NH3
NH4+
HNO3
NIT
(SO42-)