the environmental impact of mail: a baseline
TRANSCRIPT

The Environmental Impact of Mail: A Baseline, June 2008, ©2008 Pitney Bowes Inc. 1
The Environmental Impact of Mail: A Baseline

EXECUTIVE SUMMARY
Climate change, and its relationship to man-made carbon emissions, are significant global issues and the mailing and
postal industries recognize the importance of understanding and improving the environmental impact of mail. A key
component of analyzing, and then reducing, the carbon footprint of mail is understanding the CO2 emissions that are
generated throughout the life cycle of mail. However, there is currently no centralized and standardized set of data for
the life cycle activities and processes to be included in quantifying mail’s CO2 emissions.
In this paper, we examined available data sources that covered a wide range of studies with different goals, scopes,
assumptions and boundaries. We used these studies to determine the indicative range of CO2 emissions generated by
various stages throughout the life cycle of physical letter mail.1 Six life cycle stages of letter mail were identified:
(1) mail design; (2) manufacturing the writing paper and envelope; (3) production of the letter; (4) distribution of the
letter; (5) use; and, (6) disposal. The primary focus of the letter mail emissions in these studies were those associated
with stage 4: distribution of the letters, i.e., the sortation and transport within the postal operations. We hope to con-
tribute to the understanding of the footprint of the mail industry, and to stimulate continued research into the environ-
mental impact of mail.
We also examined some of the mail’s environmental impact beyond CO2 emissions, such as the actual rates of net forest
deforestation and the accumulation of waste mail pieces in landfills. Sustainable forestry practices have actually added
forest stock in North America and Europe. Sustainably managed forests are a renewable resource to the paper industry.
With respect to disposal, direct mail accounts for only about 2% of the total tonnage of the US municipal waste stream
and almost 39% of direct mail in the US was recycled in 2006. Consumers can recycle an even greater percentage of
direct mail using currently existing technology. Recycling not only reduces landfill waste, but to the upstream paper
manufacturing processes also reduces energy requirements and emissions at the paper mills.
Many Posts are beginning to track CO2 emissions associated with the power required to run their facilities and the
emissions from the transportation of the mail to the consumers. Based on these data, we found that the distribution
of letter mail by the Posts generates, on average, about 20 grams of CO2 per letter delivered. In addition, a survey of
more than a dozen studies shows that the indicative range of CO2 emissions associated with the upstream mail piece
creation process is about 0.9 – 1.3 grams of CO2 per gram of paper. The US Postal Service is planning an upcoming
Life Cycle Inventory which will shed significant light and introduce new data on the carbon footprint of mail. In addition,
the Universal Postal Union (UPU) is planning a survey of 191 countries on their use of postal facilities and vehicles.
Americans generate about 40% of the total US CO2 emissions through power used to operate their homes and fuel for
transportation activities. The carbon footprint of many household activities individually dwarfs the CO2 emissions
associated with the amount of mail received by the average American in a full year.
Because paper and electronic communications are intertwined in various stages of letter mail’s life cycle, an attempt to
eliminate mail and substitute electronic communications represents a redistribution of the total carbon footprint, rather
than its elimination. At the very least, several factors and statistics argue against the simplistic notion that physical mail
The Environmental Impact of Mail: A Baseline, June 2008, ©2008 Pitney Bowes Inc. 2
1 Letter mail is defined as transactional and advertising letter mail, i.e., First Class and third class letters as classified by the US Postal Service.
The Environmental Impact of Mail: A Baseline, June 2008, ©2008 Pitney Bowes Inc. 3
2 Royal Mail (the UK postal service) has established an environmental group to track, measure and report on sustainability issues; Post Danmark has developed an LCAusing EDIP methodology and tracking its environmental impact throughout the mailing process; TNT Post, Deutsche Post World Net, Swiss Post, and La Poste (France)are estimating and tracking CO2 emissions.
3 The USPS will be sharing the results of its LCA with the Greening of the Mail Task Force that was established Fall, 2007.
is always, and in every case, inferior to email in its environmental impact. It is impossible to make a broad-based
comparison of the carbon footprints of mail and email because determining the carbon footprint of both depends on
a specific set of variables across the life cycle of the communications process.
In a marketplace increasingly focused on the environment, the mailing industry is investing in programs and initiatives
to address, and further reduce, the environmental impact associated with all six life cycle stages of letter mail. The
information presented in this paper represents a starting point for additional research and monitoring in order to
continuously reduce the carbon footprint of the mailing industry. Organizations and companies across all stages of the
life cycle of mail must work together to accomplish this objective and to establish best practices that support the
environmental sustainability of mail. As additional information is developed on the environmental impact of mail we
will continue to update and refine this baseline.
To establish this process we recommend that the mailing industry:
• Develop a set of data for the life-cycle activities and processes to be included in estimating mail’s CO2 emissions.
• Foster more mail industry partnerships to further expand the environmental sustainability of mail and deliver
continuous improvement.
• Continue to study CO2 emissions and other environmental impacts of mail and communications to ensure that we
are not simply shifting the environmental burden.
• Identify opportunities to maximize the utilization of the vast infrastructure of the posts and private carriers and
suppliers to benefit the environment.
• Continue to educate mailers and consumers regarding the relative environmental impacts of mail versus
other activities, particularly other communications activities, and what they can do.
1. Introduction– Challenges to Measuring CO2 Emissions in the Mail Industry
As awareness and concern over global warming becomes an increasingly significant issue around the world, socially respon-sible industries are closely examining their environmental responsibilities across the life cycle of their products. The mailingand postal industries have recognized the importance of understanding the environmental impact of mail; whether it is as a primary communication and delivery medium, or as part of a multi-channel communication strategy that an organizationmight implement with its stakeholders. The mailing and postal community includes all the industries across the life phases of letter mail; namely, the industries responsible for harvesting the wood; transporting the wood to the paper mills; creatingthe paper; processing the addressing and content data; designing and printing the mail piece; processing the mail by thirdparties and the postal service; and finally, delivering the mail piece to the customer. This array of industries is workingtogether to define the industry’s environmental footprint and this paper aims to contribute to this knowledge base and stimulate future research.
Broad studies of CO2 emissions by source of fuel, human activity and country have been completed in various notable reports,such as Stern, Lehman Brothers, the United Nations and the Intergovernmental Panel on Climate Change (IPCC). In addition,many postal corporations are beginning to measure and track CO2 emissions at their facilities and transportation operationsand reporting these emissions in periodic Corporate Social Responsibility Reports.2 The US Postal Service is currently conducting a life cycle assessment to create an inventory of its carbon footprint throughout its operations.3

4The Environmental Impact of Mail: A Baseline, June 2008, ©2008 Pitney Bowes Inc.
4 EIA, 2007a. pg 73. These data are the official energy statistics for the US government.These data are presented in billion metric tons carbon dioxide equivalent. They canbe converted to carbon equivalents units by multiplying by 12/44.
5 Calculated using EIA, 2007 global CO2 emissions and global population data from the Demographic Yearbook, 2004, UN Statistics database. This estimate is similar to the2003 estimate (4.1 tons/person) provided in the GEO Yearbook, 2007.
6 Global Environment Outlook (GEO), 2007; GEO Indicators.
7 EIA, 2007a. pg 73.
8 The Stern Review, 2006, pg xi, IPCC, 2005, pg. 77; and EIA, 2007a, pg 73.
9 Economist Intelligence Unit and EIA country data on population, GDP, and CO2 emissions are for 2004 and obtained from subscriber databases. OECD countries are:Australia, Austria, Belgium, Canada, Czech Republic, Denmark, Finland, France, Germany, Greece, Hungary, Iceland, Ireland, Italy, Japan, Luxembourg, Mexico,Netherlands, New Zealand, Norway, Poland, Portugal, S. Korea, Spain, Sweden, Switzerland, Turkey, United Kingdom, and the United States.
However, a drawback of the existing body of Life Cycle Assessments (LCA) is that there is currently no centralized and stan-dardized set of data for the life-cycle activities and processes to be included in estimating mail’s CO2 emissions. More broad-ly still, other areas related to mail’s environmental impact beyond CO2 emissions suffer from uneven documentation and dis-semination of valuable studies. Among these areas we consider the actual rates of forest exploitation and the accumulationof mail in landfills.
The initial step in controlling carbon emissions is to measure them, as well as related industry statistics. In this paper weestablish a baseline of current worldwide CO2 emissions, worldwide forest loss, and the amount of mail in landfills. We alsoexamine available data on postal emissions and other relevant life cycle phases in order to identify areas in the letter mailvalue chain where estimates exist and/or additional data are required. Letter mail is defined as transactional and advertise-ment letters, i.e., First and third class letter mail. This initial baseline does not include catalogues, periodicals, books andparcels. In order to understand the relative environmental emissions of mail we compare it to the estimated CO2 emissionsfrom a variety of human activities and also examine the environmental impact of consumer electronics, a rapidly growingform of communication that has environmental implications that are often overlooked.
Worldwide economic growth and its increasing energy requirements has led to an increase in global CO2 emissions. Ourbaseline estimates focus on energy-related CO2 emissions, rather than total greenhouse gas (GHG) emissions, because CO2
is the main anthropogenic (human-caused) GHG that is produced by mail related activities, e.g., transportation, energy gen-eration, etc. In 2004, worldwide CO2 emissions were almost 27 billion metric tons.4 These emissions have remained relativelystable at about 4.2 tons per person per year,5 but vary significantly across countries and are strongly correlated to GDP.
Growing energy consumption has more than off-set any reduction in energy requirements from improvements in energy effi-ciency.6 The US generates the most CO2 emissions, accounting for more than 20% of global CO2 emissions. As shown inFigure 1 below, N. America and the other Organization for Economic Cooperation and Development (OECD) countriesaccount for about half of the global CO2 emissions. However, emissions are growing at a much faster rate in the non-OECDcountries (almost 10%) than in the OECD countries (less than 2%).7 As these emissions continue to increase with populationand economic growth, developing and emerging economies will contribute a much higher share of the total.8
Table 1. CO2 Emissions and GDP Comparison by Country.9

5The Environmental Impact of Mail: A Baseline, June 2008, ©2008 Pitney Bowes Inc.
10 UNEP, 2007, pg. 27; and, BBC News.
11 EIA, 2007a. pg 74; and, BBC News.
12 IPCC, 2005, pg. 77, estimates shares of CO2 emissions for various fuel types in 2000 and EIA, 2007a estimates coal’s share of CO2 emissions at 39% in 2004 (pg 73).IPCC data are shown because it represents a consistent source of global coal and nuclear shares.
13 IPCC, 2005, pg. 83.
14 EIA, 2007a, Table 11, pg 74; and IPCC, 2005, pg 83.
Currently, fossil fuels meet about 80% of worldwide energy demand10 and coal is expected to account for a growing share ofelectricity generation because it is the predominant fuel used to produce electricity in the US, China, and India.11 Coal cur-rently generates about 38% of global electricity while hydropower, natural gas, and nuclear energy each account for about17% electricity generation.12
Worldwide, electricity/heat production generates 36% of CO2 emissions.13 In addition to the power sector which producesenergy and thus emissions, other key sectors that generate CO2 emissions as consumers of energy include: manufacturingand construction, transportation, and residential. The transportation sector includes both residential and commercial transportation. These three sectors combined with the power sector account for 88% of global CO2 emissions.
Figure 1. Worldwide CO2 Emissions by Key Sectors and by Region.14
In the US, power sector emissions are allocated to the appropriate key end-use sectors, namely, industrial (29%), commercial(18%), transport (32%) and residential sectors (21%). Consumers generate CO2 emissions primarily in the Residential andTransport sectors by heating and cooling their homes, running appliances, preparing food, and travel/commuting. These two sectors combined account for more than half of the total US CO2 emissions. Home appliances and the electricity drawassociated with running these appliances account for a large share of the residential sector’s CO2 emissions. These emissionswill be discussed in greater detail in Section 5.
N. America26%
16%
OECD Asia8%
Non-OECD Europe/Eurasia
10%
Non-OECD Asia28%
* All Others includes Africa, the Middle East and Central & S. America.
Worldwide Key Regions
All Others *12%
Worldwide Key Sectors
* Manufacturing and Construction includes other energy industries, i.e.,oil refineries, coal mining, oil and gas extraction, and other energyproducing industries.
** Other includes commercial and public services.
Power36%
Manufacturing & Construction*
23%
Transport21%
Residential 8%
Other **12%
OECD Europe

6
The remainder of this paper will examine five areas in order to establish a fact-based baseline of the environmental emissionsof the mailing and postal industries: 1. the rate of change in the worldwide forest stock and the factors that are driving this change; 2. the composition of the waste stream and an assessment of mail’s impact on the waste stream and landfills; 3. a compilation of the estimates of the CO2 emissions that are generated across various life cycle, or value chain processes,
for letter mail with a primary focus on the emissions generated by the Posts; 4. a comparison of estimated CO2 emissions from a variety of human activities with the average baseline CO2 emissions
associated with the Posts’ handling and delivery of mail; and, 5. an examination of the environmental emissions from consumer electronics to provide perspective on the increasingly
intertwined communications that include both electronic and paper-based components.
2. The Impact of Mail on Forest AcreageGlobal warming and climate change are key reasons for the concern about the loss of forests to meet the world’s increasingdemand for paper products. The value of forest ecosystems extends beyond its timber resources to include biodiversity,wildlife habitats, protection against erosion, and carbon sequestration to help stabilize the climate. In terms of the role oftrees in reducing CO2 emissions, the age and rate of growth of trees also makes a difference, with younger, faster growingtrees having a greater role in reducing CO2 emissions. The optimal strategy for reducing carbon emissions is to harvest oldertrees at a stage in their life cycle when their effectiveness in reducing carbon emissions is declining and replace the harvestedtree with a young fast growing tree that absorbs CO2.
Since 2000, approximately 0.2% of worldwide forest acreage has been lost annually.15 Deforestation results when forest landis cleared and converted to another land use. Worldwide loss of forest since 2000 has been primarily to agricultural develop-ment in tropical areas. For example, from 2000–2005, South America annually converted approximately 10 million acres of forestland to agricultural use.16 Africa lost about the same amount of forest area as South America during this time periodbut almost 90% of its wood supply was used for fuel.17 There are many factors that influence the loss of forest area. Two keyfactors are population density and level of economic development. Poor countries rely on their land for agricultural develop-ment, crop yield, and wood as an energy source as the price of fossil fuels increase. About 40% of global wood production is for fuel.18
Regions where the forest stock has increased, since 2000, include N. America and many European countries. Sustainableforestry practices can often meet timber demand using less acreage and thus preserving more natural forests.19 A key factorto increasing sustainable forests is economic development. A recent study of 50 nations with extensive forests showed adirect correlation between a nation’s GDP and its forest growing stock. In countries where the per capita GDP was $4,600or higher, the growing stock increased from 1990– 2005.20 Key examples of current sustainable forest management are certification of forestland to prove its sustainability and increased plantation productivity.
Worldwide sustainable forest certification has increased by 12% from 2005–2006 and currently accounts for at least 7% ofthe global forest area.21 Most of these certified forests are in temperate and boreal regions in developed countries. Certificationprograms have evolved over the past decade. In 1999, the Programme for the Endorsement of Forest Certification schemes(PEFC) was established as the global umbrella organization to formally assess and promote national and international certifi-cation programs. There are currently several programs competing to gain share among the worldwide sustainable forestryindustry.22 Chain-of-custody certification programs that trace certified wood to its source is a growing practice that allowsthe upstream paper companies to vouch that their products are environmentally responsible.
The Environmental Impact of Mail: A Baseline, June 2008, ©2008 Pitney Bowes Inc.
15 UNEP, 2007, pg 88; FAO, 2007, pg 64; and Alvarez, 2007, pg 29. All reports use FAO 2005 data.
16 FAO, 2007, pg 37; and, Alvarez, 2007, pg 29.
17 FAO, 2007, pg. 98.
18 UNEP, 2007, pg. 89.
19 Kauppi, 2006, pg. 17577 and FAO, 2007, pg. viii. The high rate of investment in plantations in China has off-set lost forest acreage in other parts of Asia.
20 Kauppi, 2006.
21 Alvarez, 2007, pg 39. Some of the certification programs, notably FSC, SFI, and PEFC (see note 20 below) estimate that as much as 10% of forest land is certified. The certification programs were originally started to combat tropical forest deforestation but most of the certified forests are currently located in developed countries.
22 Some of the more prominent certification programs include: the Forest Stewardship Council (FSC), Canadian Standards Assoc. (CSA), the Sustainable Forestry Initiative(SFI), and the American Tree Farm System. Each program has somewhat different regulations although all of them set standards for managing forests sustainably and employing sustainable harvesting practices.
7
About 3–4% of forestland are considered to be plantations that account for at least 33% of global wood production.23 Theproductivity of these plantations reduces the amount of acreage required to meet demand for timber products. Economicgrowth in China and India have allowed these two countries to invest heavily in plantations.24 Critics of plantations cite theloss of biodiversity when forestland is converted to plantations. However, for economic reasons this forestland might havebeen converted to agricultural uses and biodiversity would have been lost in this case as well. It is also believed that planta-tions actually sequester more CO2 because younger, faster growing trees sequester more carbon than older trees.25
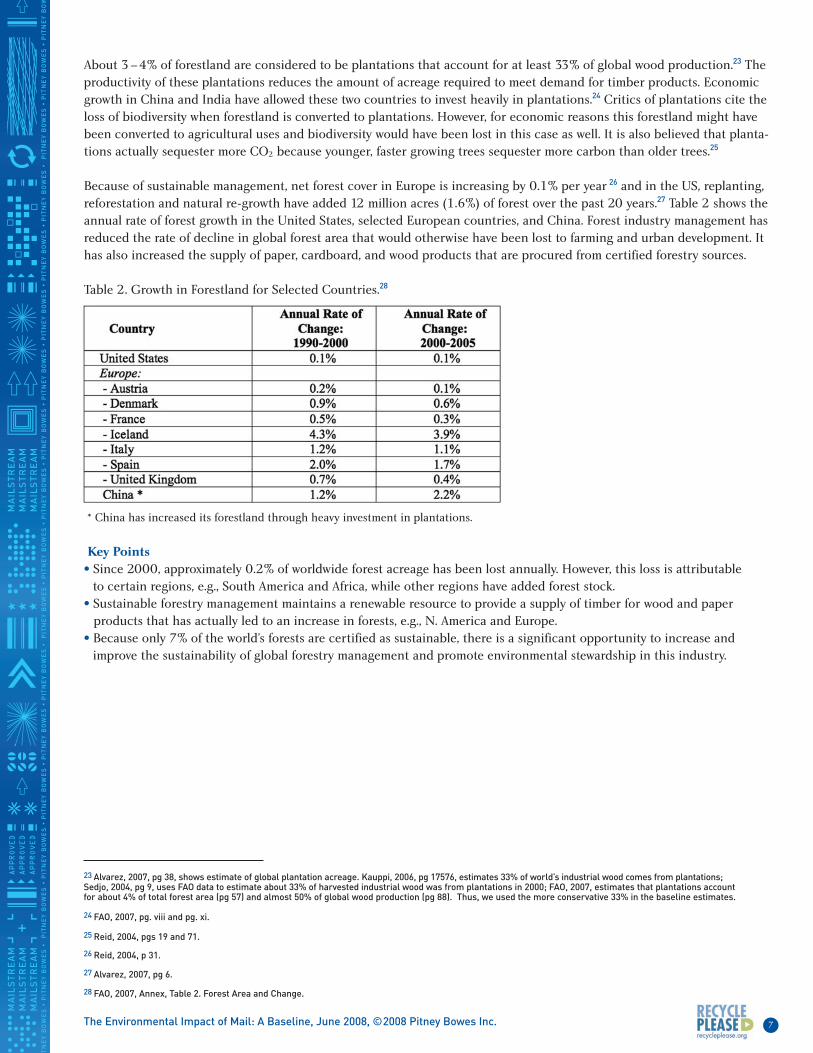
Because of sustainable management, net forest cover in Europe is increasing by 0.1% per year 26 and in the US, replanting,reforestation and natural re-growth have added 12 million acres (1.6%) of forest over the past 20 years.27 Table 2 shows theannual rate of forest growth in the United States, selected European countries, and China. Forest industry management hasreduced the rate of decline in global forest area that would otherwise have been lost to farming and urban development. Ithas also increased the supply of paper, cardboard, and wood products that are procured from certified forestry sources.
Table 2. Growth in Forestland for Selected Countries.28
* China has increased its forestland through heavy investment in plantations.
Key Points• Since 2000, approximately 0.2% of worldwide forest acreage has been lost annually. However, this loss is attributable
to certain regions, e.g., South America and Africa, while other regions have added forest stock.• Sustainable forestry management maintains a renewable resource to provide a supply of timber for wood and paper
products that has actually led to an increase in forests, e.g., N. America and Europe. • Because only 7% of the world’s forests are certified as sustainable, there is a significant opportunity to increase and
improve the sustainability of global forestry management and promote environmental stewardship in this industry.
The Environmental Impact of Mail: A Baseline, June 2008, ©2008 Pitney Bowes Inc.
23 Alvarez, 2007, pg 38, shows estimate of global plantation acreage. Kauppi, 2006, pg 17576, estimates 33% of world’s industrial wood comes from plantations;Sedjo, 2004, pg 9, uses FAO data to estimate about 33% of harvested industrial wood was from plantations in 2000; FAO, 2007, estimates that plantations account for about 4% of total forest area (pg 57) and almost 50% of global wood production (pg 88). Thus, we used the more conservative 33% in the baseline estimates.
24 FAO, 2007, pg. viii and pg. xi.
25 Reid, 2004, pgs 19 and 71.
26 Reid, 2004, p 31.
27 Alvarez, 2007, pg 6.
28 FAO, 2007, Annex, Table 2. Forest Area and Change.

8
3. The Impact of Mail on the Waste StreamThe disposal of direct mail is another environmental concern gaining public attention. In this section, the composition ofthe US waste stream will be examined in order to characterize the quantity of waste, the amount recycled, and the amountthat is ultimately sent to landfills. Data on the composition of the US waste stream are obtained from an annual report published by the EPA. In these reports, tonnage is reported for “standard” mail, e.g., third class mail, and hence the followingtables in this section refer to direct mail, rather than all letter mail.
Worldwide, about 355 million metric tons of paper and paperboard are produced each year.29 The US accounts for almost one-third of the world’s total paper and paperboard production and each American uses about 317 kg of paper products each year.30
Table 3 illustrates US consumption of various materials, including a detailed breakdown of paper and paperboard products.
Table 3. US kg per Person of Selected Materials Consumption, Waste and Discarded in 2005.31
In total, each person in the US generated about 830 kg of municipal solid waste (MSW) in 2005.32 This amount of MSW generatedper person has remained relatively flat since 1990. Some of the key components of the 830 kg are shown below in Table 4.
Table 4. Key 2005 US Waste Components: kg per Capita.33
The Environmental Impact of Mail: A Baseline, June 2008, ©2008 Pitney Bowes Inc.
29 Gielen, 2006, pg.2; EMA, 2007; and, www.Tappi.org each estimated about 300 million tons.
30 Tappi and EMA, 2007.
31 USGS, 2007; www.Tappi.org; www.plasticseurope.org.; Kinsella, 2007, pg. 11; USEPA, 2006a, pgs. 33, 35, 75-77; and, internal Pitney Bowes mail and subscriberpopulation databases.
32 USEPA, 2006a, pgs. 33,35, 72, 75-77; and, internal Pitney Bowes population database.
33 USEPA, 2006a; data compiled from tables 1-4, 12-17; and, internal Pitney Bowes population database.

9
The amount of waste that is not recovered (e.g., recycled, composted, or combusted) and discarded in landfills has decreasedover the past 5 years in both the US and the EU because of greater recycling efforts.34 In total, about 32% of the US wastestream is recycled. Direct mail accounts for 2% of the total municipal waste and about 2% of the total waste discarded. Asshown in Table 4, many types of paper are recycled at a relatively high rate. For example, in 2005, 89% of newspapers arerecycled; 59% of paper packaging/containers are recycled; and, 36% of direct mail was recycled. By 2006, almost 39% ofdirect mail was recycled. A much higher percentage of direct mail can be recycled using currently available technology thanthe current rate. The gap between actual and potential recycling of direct mail can be attributed to many causes; the mis-perception, based on limitations from the early days of recycling that colored, glossy, catalogs can not be recycled; the lackof state-of-the-art recycling capability in many municipalities; and, the misplaced fear of identity theft from discarding per-sonalized mail. Whatever the reason, more direct mail can be recycled and reduce the demands on forests as well reduce the amount of mail discarded in landfills. According to the EPA, every ton of mixed paper that is recycled saves the energyequivalent of 185 gallons of gasoline.35 In 2006, an estimated 44 million tons of paper and paperboard were recycled, the equivalent of saving 8.1 billion gallons of gasoline.
In the UK, direct mail accounted for 550,000 tons (2.1% of the MSW) of household waste. Of this total, about 33% isaddressed mail and the remaining 67% is unaddressed direct mail.36 Approximately 13% of direct mail is recycled and 41% ofmagazines are recycled in the UK.37
In addition to encouraging the recycling of waste that is generated, programs are underway in the U.S. and Europe to reducethe amount of waste created.38 Some areas of focus are:• Designing product packaging to use less material, or more materials that are easily recycled.• Developing refillable packaging systems and reusable envelopes.• Lengthening the life of products so fewer products are produced and disposed of in the MSW stream.• Targeting better by using increasingly sophisticated geographic and demographic methods to ensure that the direct mail,
or transpromotional mail, that is sent to each potential customer is relevant to their needs.
Key Points• Direct Mail accounts for about 2% of the total tonnage in the US municipal waste stream. • 36% of direct mail in the US was recycled in 2005 and it increased by about 8% in 2006 to 39%.39 Recycling not only
reduces landfill waste but also potentially reduces energy requirements and emissions at the paper mills. (as described below in Section 4, CO2 Emissions Associated with Creation of the Mail Piece)
• There is potential to continue to increase the percentage of direct mail that is recycled, as well as to reduce the amount of waste mail created.
4. Estimated CO2 Emissions Across the Letter Mail Value Chain
Many Posts are examining CO2 emissions from their operations in order to responsibly address corporate sustainabilityissues, reduce costs, and improve operating efficiencies. Bottom-up models of CO2 emissions within a post’s value chain areprincipally based on estimates of fuel consumption for air, rail, and road transportation activities and resultant emissions by type of vehicle and fuel (e.g., such as the tables in Vattenfall), coupled with estimates of energy use in postal facilities. A number of posts and integrators (e.g., TNT Post, Deutsche Poste World Net (DPWN), Royal Mail, UPS) have computed estimates of total CO2 emission and typically publish them in their corporate social responsibility reports.40 However, a
The Environmental Impact of Mail: A Baseline, June 2008, ©2008 Pitney Bowes Inc.
34 USEPA, 2007b, Table 3; and defra, 2007.
35 USEPA, 2007b, pages 2 and 3.
36 defra, 2007, Chapter 4, item #51.
37 defra, 2007.
38 USEPA, 2006a; and, defra, 2007.
39 USEPA, 2007b, Tables 15 and 17 show that about 38.7% of direct mail was recycled in 2006.
40 Many Posts are using the Greenhouse Gas Protocol to estimate and report their CO2 emissions in Sustainability or Environmental Reports. The different scopesthat are defined in the Greenhouse Gas Protocol are: Scope 1 – includes direct GHG emissions from owned sources and for aviation, only emissions from leased aircraft; Scope 2 – includes emissions from purchased electricity generation; and, Scope 3 – covers emissions resulting from the supply of energy (excluding elec-tricity) such as the emissions generated in the refining process, the transport of fuel, etc.

10The Environmental Impact of Mail: A Baseline, June 2008, ©2008 Pitney Bowes Inc.
41 The Aspen Institute formed an Initiative for the International Mailing Industry, composed of about 20 companies in all areas of the letter mailing industry. It hasbeen meeting periodically, since October 2006, to develop new initiatives, collaborations and/or new insights into the industry. Environmental issues have been a keytopic since the inception of the group and it has recently decided to fund an industry-wide LCA.
42 Post Danmark, 2006.
drawback of these past studies is that there are no centralized and standardized set of data for the life-cycle activities andprocesses to be included in estimating mail’s CO2 emissions. There exists a body of methodology, e.g., ISO LCA and GHGstandards, that does not specifically address mail methodology and specific mail data issues. An international consortium of mailing industry participants has recently commissioned a comprehensive Life Cycle Assessment (LCA) of letter mail inorder to improve upon and refine the current LCAs that exist among various companies along the letter mail value chain.41
More comprehensive studies that aim to use LCA, notably the work in Denmark,42 has been extended to model Europe-wideestimates that form the basis for PostEurop members’ Greenhouse Gas Reduction Programme. Building on the Danish model,the Aspen Institute has divided the life cycle of letter mail into six stages:
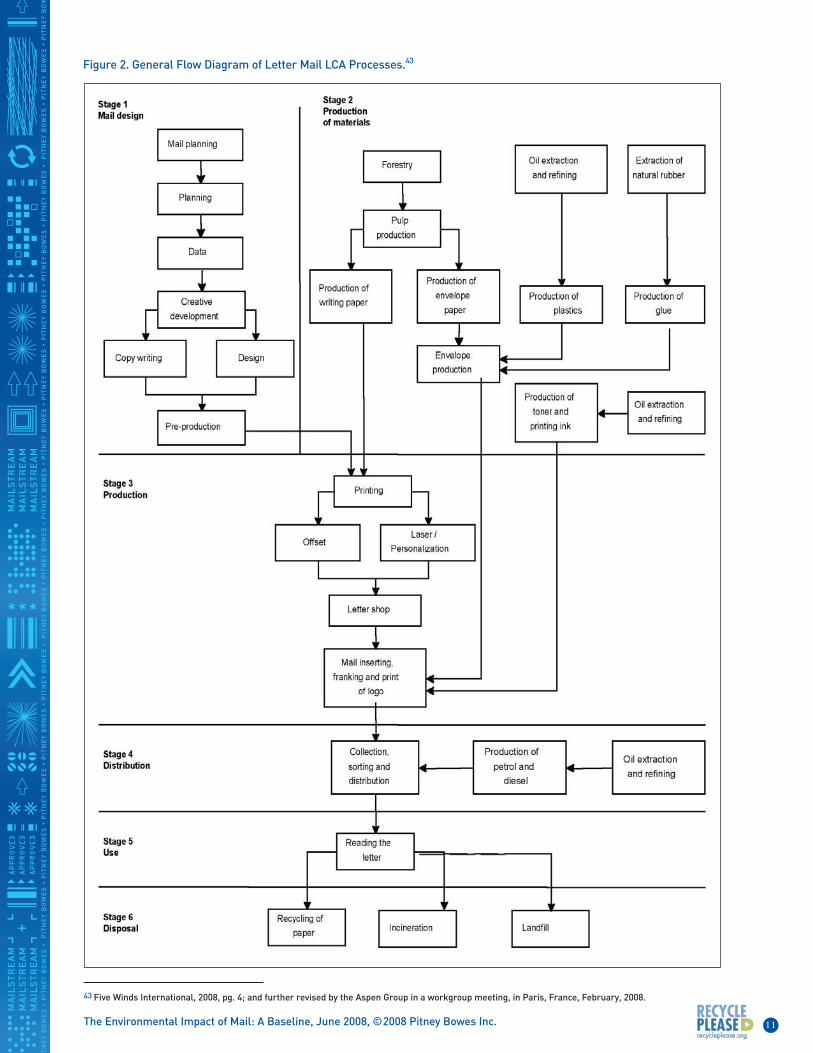
1. mail design, e.g., planning, data collection, copy writing, design, and pre-production.2. manufacturing the writing paper and envelope, e.g., harvesting the wood, pulp and paper production, and
envelope production; 3. production of the letter, e.g., the type of paper used, ink, writing and printing, the number of inserts, franking, etc.; 4. distribution of the letter, which is the primarily the responsibility of the Posts to sort and deliver mail to the customer; 5. use (this phase does not represent an environmental impact); and, 6. disposal of the letter, which includes recycling, incinerating, or disposing into a landfill.
The first 3 stages of the above life cycle involve the “upstream creation of the mail piece” in the letter value chain. The Postsare typically directly responsible for stage 4. This is the area where most Posts concentrate their measurements when start-ing to develop a carbon footprint of letter mail. Stages 5 and 6 are part of the “downstream (use and disposal) processes” inthe LCA of letter mail. All six of these stages should be included and measured in a “cradle-to-cradle” LCA of letter mail.However, the emissions associated with the disposal of the mail are beyond the scope of this paper. The primary focus of thispaper is on the CO2 emissions generated by the Posts’ handling of letter mail (stage 4 above). Figure 2 shows a more detailedflow diagram of these paper mail life cycle processes.
11
Figure 2. General Flow Diagram of Letter Mail LCA Processes.43
The Environmental Impact of Mail: A Baseline, June 2008, ©2008 Pitney Bowes Inc.
43 Five Winds International, 2008, pg. 4; and further revised by the Aspen Group in a workgroup meeting, in Paris, France, February, 2008.

12
In this baseline analysis, we examined the average CO2 emissions per letter handled by the Posts (only stage 4: distribution),rather than the marginal CO2 emissions generated by the addition of one more letter into the existing mail processingstream. The marginal emissions associated with adding one more letter to the existing facility, sorting, and transportationnetwork is negligible and for purposes of general comparison to everyday emissions it is more robust to examine the averageletter mail emissions.
CO2 Emissions Associated with Distribution of the Mail Piece
The Posts directly control the carbon emissions in Stage 4: distribution of the letter. There are two key components of thePosts’ CO2 emissions that they are beginning to measure in order to understand and quantify their carbon footprints: 1. Facility Resources: the emissions that are associated with the postal retail and mail handling facilities and sorting equip-ment, primarily the generation of heat and electricity. These processes are shown by the yellow chevrons in Figure 3. 2. Transportation Resources: the fuel emissions associated with transport between facilities, from either collection44 or thepoint of acceptance, to the destination postal facility, and from that facility to the customers. Transportation-relatedprocesses are depicted in green in Figure 3.
Figure 3. Value Chain for Stage 4: Distribution of the Mail Piece.
Data collected by an internal working group suggests that the indicative range of CO2 emissions per letter handled withinthe Posts appears to be 10 to 30 grams. The median of the 14 sources listed in Table 5. is 17.9 grams per letter. The US PostalService (USPS) is currently developing a Life Cycle Inventory (LCI ) and will report emissions along the entire value chain ofmail. The preliminary results for its operations are in this range as well. Posts generally estimate their CO2 footprint from thepoint of acceptance to final delivery to the customers. The upstream creation of the mail piece (i.e., harvesting wood, paperproduction, mail piece design, and printing the mail piece) has not been examined by most Posts and it is not included inthe range of estimates shown below.
Carbon dioxide emissions per letter handled by the Posts may decline if the Posts offer work-sharing discounts for automa-tion, postal code sortation, or downstream access. Across the complete life cycle, it is unclear if more, or less, CO2 emissionsare generated by the firms performing these tasks rather than the Posts.
The Environmental Impact of Mail: A Baseline, June 2008, ©2008 Pitney Bowes Inc.
44 The Posts' estimates in Table 5 include the portion of transportation that is undertaken by the mailer from the mail preparation site to the post's induction facility.In most European countries, a high proportion — from 50% to 75% — of mail volumes are workshared, i.e., mailers and third parties receive discounts in exchangefor presort and other mailer preparation work. In most cases, however, European Posts, unlike their US counterpart, don't grant "destination entry" discounts, i.e.,they don't reward the deeper transportation of mail by third parties to the destination sorting center or the office of delivery. As a result, given this lack of incentive,bulk mail is normally entered at a post office facility very near the mail preparation origin, or, for larger volumes, at the outbound sorting center. Because Europeanpost are typically much smaller than the US in volume, bulk mail doesn't travel long distances before being inducted into the postal network. Thus the posts' carbonemissions estimates already consider almost all transportation from the mailer to the post, which is often done by the post itself. In short, the environmental impactof consolidation activities is, therefore, very limited. In the past few years, however, some countries have introduced downstream access discounts (e.g., the UK) orconsolidation discounts (e.g., Germany) that involve induction of bulk volumes further down the postal processing chain, i.e, at the incoming sorting center level.However, all the estimates from the posts that we use in this study are from years that did not include these access and induction discounts.
Collection Transport toPostal Facility
In-comingSorting
Intra-PostalTransport
DestinationSorting
Delivery toCustomer

13
Table 5. Indicative Range of CO2 Emissions across the Value Chain for Internal Postal Processes for Letter Mail.45
Because most Posts are examining their emissions associated with electricity use and transportation, many are focusing onimproving the efficiency of their fleets and adopting “green” techniques to improve the efficiency of their buildings. Forexample, the Universal Postal Union (UPU) is planning a survey of 191 countries on their use of postal facilities and vehicles.La Poste (France) expects to save 10% on fuel consumption by transferring transportation to rails instead of aircraft andusing less polluting aircraft for longer hauls.46 Royal Mail has a Carbon Management Programme that is tasked with reducingCO2 in all areas of its operations. Initiatives underway include: 47
• Developing and promoting a carbon neutral mailing product with one of its key customers.• Identifying and quantifying indirect emissions.• Investigating renewable energy and alternative fuels.• Monitoring and managing energy usage across Royal Mail’s operations.
CO2 Emissions Associated with the Design and Creation of the Mail PieceA few LCA studies have been conducted of forestry products, paper and paperboard, catalogs, and magazines that examinedthe upstream CO2 emissions generated by the creation of the mail piece, i.e., harvesting the wood, producing and manufac-turing the paper at the paper mills, and printing the mail piece. We examined these studies to determine an indicative rangeof CO2 emissions, recognizing that each study is for different types of paper and across different aspects/boundaries of theupstream creation processes and, thus, not comparable. There are many transport-related processes along the upstreamvalue chain, i.e., transporting the wood to the pulp and paper mills; transporting the finished paper to the printer; and then,in some cases, to the inserter, presorter, and ultimately the postal service for distribution to customers. These upstreamtransportation-related processes are not discussed in detail in this section because most of the studies we examined did notspecifically include these processes. Likewise, study emissions data were unavailable for the inserting/presorting process.
Figure 4. Value Chain for Stages 1-3 (the Upstream Mail Piece Creation Processes).
The Environmental Impact of Mail: A Baseline, June 2008, ©2008 Pitney Bowes Inc.
45 Austria Post, Canada Post, Post Danmark, La Poste (France), DPWN, Swiss Post, and Post Europ provided per letter estimates via published reports, an internal e-mail survey, and numerous conversations with personnel in their respective environmental departments; Itella Post (Finland) estimate is provided in a pressrelease; Royal Mail’s estimate is based on data in its 2006 Social Responsibility Report and conversations with personnel in their environmental department; TNT’s estimate is based on data in TNT’s Social Responsibility Report, 2006; Quack (Oko Institute), 2005; and, a paper yet to be published of a postal case study using an EIO-LCA model.
46 Asia Pacific Mail & Express, 2007.
47 Royal Mail Annual Report, 2006, and presentation made at Post Expo, Oct. 2 – 4, 2007.
HarvestingWood
Transportto Mill
ManufacturingPaper (mill)
Transportto Printer
Printing &Creation ofMail Piece
Transport toInserter/
Presorter
Inserting/Presorting
Transport toPost
(drop-ship)

14
Harvesting WoodIn harvesting the wood, carbon sequestration is an important factor in determining the net carbon footprint of the forestryindustry that should be included in a LCA of letter mail. It’s been estimated that the global forest ecosystem, including deadwood and soil, contains 638 billion tons of carbon. Forests remove, or sequester, about 30 billion tons of available carbon from the atmosphere each year and the forest products industry accounts for 1.0% (0.3 – 0.35 billion tons) of thiscarbon.48 However, there are few data to support estimates of carbon stocks over time and there are many factors that influ-ence the amount of carbon sequestered by forests including the type of trees, the trees’ rate of growth, the age of the treestock, and the amount of dead and rotting brush. According to the Food and Agriculture Organization of the United Nations(FAO), carbon stocks in forest biomass decreased by about 5.5% at the global level from 1990 to 2005. However, regionaltrends indicate that carbon stocks are increasing in areas where the growing stock is increasing and vice versa.49
According to several LCA studies that included the tree harvesting process, the indicative range of CO2 emissions associatedwith harvesting timber are negligible (relative to the other life cycle stages of a mail piece) and may possibly be a net positiveeffect on the carbon footprint of the mail process, depending on the wood harvesting methods employed and the level ofsustainable forest management that is employed.50
Paper ProductionProduction of the paper appears to generate the largest amount of CO2 emissions in the upstream letter creation process.About 19% of the world’s total annual wood harvest is used to produce approximately 355 million tons of paper and paper-board products. Thus, about 33% is printing and writing paper.51 The environmental impact of the paper industry, related to energy usage and its CO2 emissions can be put in perspective when compared with other industries and areas of humanactivity. In addition to the carbon emissions that are discussed in this section, some other potential environmental issuesinclude the toxic chemicals and large quantity of water used by the paper mills.
In 2003, the pulp and paper industry accounted for about 6% of total industrial energy use.52 However, this industry sup-plies about 50% of its fuel through the biomass residues produced as a by-product of the milling process.53 This is one of the highest uses of renewable energy by any sector, industrial or otherwise. In 2002, paper production accounted for 2.4% of total US energy consumption54 and advertising mail is estimated to account for about 0.18% of this energy consumption.The US pulp and paper industry typically uses less energy than mills in other countries because a larger proportion of itspaper and paperboard are produced using the less energy-intensive chemical process.55
The Environmental Impact of Mail: A Baseline, June 2008, ©2008 Pitney Bowes Inc.
48 ncasi, 2007, pg 13.
49 FAO, 2007, pg 64. Also, according to ncasi, 2007, US carbon stocks on private timberland are increasing by 240 million tons of CO2 equivalents and about 60 milliontons are directly attributed to the forest products industry (pg 13). According to Reid, 2004, in many temperate countries the growth of plantations is a significant sink, of approximately 200 million tons of carbon. (pg. 14) and that forests are currently a net sink of CO2, absorbing up to 25% of global fossil fuel emissions (pg 15).
50 A recent LCA of magazines (Gower, 2006) assumed that harvesting the trees did not change the soil carbon content but did include emissions from site preparationand planting. In this LCA, only 2% of direct emissions were attributable to the harvesting process. Another study (ncasi, 2007) assumed a net benefit from carbonsequestration in the carbon footprint of the forest products industry, but acknowledged a large degree of uncertainty its estimation process. A European study (PostDanmark, 2006) that includes many environmental effects in its model did not include the wood harvesting process because more trees are planted than harvested intheir country and wood is a renewable resource and hence excluded from the weighted resource analysis. Environmental effects measured by Post Danmark include:global warming, ozone depletion, acidification, nutrient enrichment, bulk and hazardous waste. The EDIP-method is used to track and measure environmental andresource effects. These effects are reported in units of mPET (per thousand of the annual environmental effect of an average person) and mPR (per thousand of thepersonal resource reserve of an average citizen).
51 Abromovitz, J.N. 1999, pg 20; and, Gielen, D., 2006.
52 Gielen, D., 2006, pg 2.
53 ncasi, 2007, pg 18; and, Gielen, D., 2006, pg 2.
54 USPS, 2005, pg B-1. The paper industry estimate is derived from EIA 2002 data. Direct mail’s portion of energy consumption was estimated by this USPS study.
55 WBCSD, 2005, pg 3.

15
Figure 5. US CO2 Emissions by End-Use Sector.
As shown in figure 5, the Industrial sector accounts for about 29% of total US CO2 emissions. Key industries within this sectorare chemicals; petroleum extraction and refining; primary metals (e.g., iron and steel mills, foundries, and aluminum production);and, the paper industry. The paper industry accounted for about 1.8% of total US CO2 emissions in 2002.56
Other sources of environmental concern in the paper industry are the amount of water and chemicals used in the millingprocess. The EPA ranks the pulp and paper industry fourth among industrial sectors in its estimate of emissions of toxicschemicals to water and air.57 Mechanical pulping processes require large quantities of energy because no chemical by-prod-ucts are generated that can be used to make electricity. Advanced energy management techniques in the kraft, or chemical,pulping process uses the high-pressure steam that is produced in converting wood to pulp to make electricity and reducethe carbon footprint of the paper mills. The drawback to the kraft process compared to the mechanical process is that agreater amount of wood fiber is required to make the same amount of paper.58
Similar to in the forestry sector, certification programs59 have extended from the forest harvesting methods through the manu-facturing process and distribution to provide customers with the assurance that the paper they purchase is coming from companies that promote sustainable practices. Some of these practices include using soy-based inks andbiodegradable and compostable window film in the envelope manufacturing process.
The Environmental Impact of Mail: A Baseline, June 2008, ©2008 Pitney Bowes Inc.
56 EIA, 2002.
57 Kinsella, 2007, pg. 3 shows that paper is responsible for 12% of industry air emissions, and on pg 4 it shows the paper industry is responsible for 8% of the toxicemissions to water.
58 Gower, 2006, pgs. 57 & 58.
59 Most notably the Forest Stewardship Council (FSC).
18%Commercial
Residential21%
Transport32%
Primary Metals4%
Petroleum 5% Chemicals 5%
Paper 2%
All Other Industry 13%
Industrial Sector29%
Source: EIA, 2002.

16
Another method to reduce the energy requirements and emissions from the production of paper is to use recycled paperrather than virgin paper. In the US, about 53% of all types of paper is recovered for reuse. Some of this recovered paper isexported; however, recovered paper accounts for about 37% of the total fiber used to make paper in the US.60 The environ-mental benefits of using recycled fiber instead of virgin content are estimated to: 61
• Reduce total energy consumption by 44%• Reduce particulate emissions by 41%• Reduce wastewater by 50%, solid waste by 49%, and wood use by 100%
A number of studies have estimated that the paper manufacturing process generates between 0.4 grams and 2.0 grams of CO2
per gram of paper. Most estimates cluster around 1.0 gram of CO2 per gram of paper (see Table 6 below).
Table 6. Indicative Range of CO2 per gram of Paper Manufactured for Selected Studies.62
The Environmental Impact of Mail: A Baseline, June 2008, ©2008 Pitney Bowes Inc.
60 EMA, 2007; and data provided by the AF&PA.
61 Kinsella, 2006, pg. 14.
62 A global pulp and paper industry study (ncasi, 2007, pg 20 & 22) estimated that about 426 million tons of CO2 equivalents, including direct and indirect (purchasedelectricity); the transportation assumption in the study was split 50% to mill and 50% to the printer; printing is assumed to equal 10% of manufacturing (pg 3). A study by Gielen, 2006, for an IEA conference, estimated that the global production of 355 MT of paper and paperboard generated about 350 MT of CO2 in 2005. USproduction and CO2 emissions data (Pulp & Paper, 2005 and EIA, 2002) estimates that in 2002 the paper industry emitted 102.4 MT of CO2 and the US produced of 89.7MT of paper, which equals about 1.1 grams of CO2/gram of paper. Assuming that each sheet of paper weights 4.5 grams (.01 lbs) the US paper industry emits about 5 grams of CO2 per sheet of paper produced. (The average weight of 8.5X11 piece of paper is estimated from http://www.informedbanking.com/paper_weight.html). FEFCO, 2006, performed an LCA of corrugated board and measured the CO2 emissions at 5 paper mills; the average emissions of both fossil andbiomass CO2 emissions are included (pg 29). La Poste (France) recently conducted an LCA for a catalog mailing and estimated that paper production and ink and
printing accounted for 60% and 6%, respectively, of the CO2 emissions. An LCA study of two specific magazines (Gower [Heinz], 2006) found that the paper millingprocess was the largest source of emissions, averaging about 69% of the total emissions. Axel Springer, 1998, conducted a newspaper and a magazine LCA; it distinguished between CO2 emissions that result from burning fossil fuel and those from burning renewable fuels that were assumed to not affect the atmosphere;in Table 6 the net amounts are recorded for the fiber/paper manufacturing and printing processes. The Carbon Trust, 2006b, conducted a case study of TrinityMirror’s operations and found that over 70% of its .95 grams of emissions per gram of newspaper were attributable to manufacturing the paper and less than 20% were from the printing process. CEPI, 2007, estimates that Europe produces 102 MT of paper and emits 40 MT of CO2. In its LCA, Post Danmark estimated that manufacturing the paper and envelop generated 20.66 gr of CO2 and producing the paper including ink and printing logo generated 13.88 gr of CO2 for an 18 gram letter. USEPA, 2006b, exhibit 2-2. A European study (Quack [Oko Institute], 2005) estimated that the upstream process generated about 15 grams of CO2per 17 gram bill. The Oko study also found that each page weighed about 4.68 grams/piece. An internal Pitney Bowes analysis of drop-shipping concluded that 0.01-0.09 grams of CO2 are emitted by third parties’ transportation before the mail’s induction into the postal system.

17
Printing the Mail PieceAs shown in Table 6, printing the mail piece typically generates less CO2 emissions than producing the paper at the paper mills.According to most of these studies, printing accounted for, on average, 5%-30% as much emissions as the manufacturingprocess. In the Post Danmark LCA, the printing of the mail piece includes the oil extraction and refining required to producethe ink. The Axel Springer study includes the CO2 emissions generated by the waste paper created in the printing process.Because these assumptions and boundaries vary across the studies the indicative range of CO2 emissions from printing themail piece varies widely.
Key Points• Many Posts are beginning to track CO2 emissions associated with the power required to run their facilities and the emis
sions from the transportation of the mail to the consumers. Based on the 14 sources listed in Table 5, the median value of CO2 emissions per letter is 17.9 grams of CO2 per letter for processes within the postal operation’s control.
• The US paper industry accounts for about 2% of US CO2 emissions, and direct mail is estimated to account for 0.18% of US emissions. Other environmental concerns about the paper production process are the toxic chemicals that are used in the paper-making process and the large quantity of water that is required to produce paper.
• According to a review of more than a dozen studies, the indicative range of CO2 emissions associated with the upstream mail piece creation process (Stages 1-3, Design, Production of materials and Production of the mail piece) is about 0.9 – 1.3 grams of CO2 per gram of paper.
5. Carbon Footprint ComparisonsThe US generates 20.1 tons of CO2 emissions per capita. Consumers generate CO2 emissions in the Residential andTransport sectors, which comprise 21% and 32% of total US emissions, respectively. All of the Residential emissions can beattributed to household consumers whereas the Transport sector includes both private and public transportation so that onlya portion of this sector can be allocated to consumers. Assuming that 50-60% of the Transport sector emissions are generatedby consumers, the average American’s direct carbon footprint is about 7.5 to 8 tons per person. These emissions are generated by activities such as heating and cooling the home, using various household appliances, and travel/commuting.
In this section, the carbon footprints of several everyday activities are examined in order to put emissions from paper andmail into perspective. The data in the following tables are based on US appliances and household characteristics, although a comparison with UK data shows similar emission estimates. The boundaries of the carbon footprint in each case must beclearly defined. For these comparisons, the emissions from mail include those associated with the processes within thepostal operation’s control, i.e., facilities and transportation emissions. Although the median value of the CO2 emissions perletter based on the data provided in Table 5 is 17.9 grams of CO2, we have chosen to use a conservative estimate of 25 gramsof CO2 emissions per letter for the following comparisons. This internal postal boundary is established for mail because thecarbon footprints of the comparative activities consist of the emissions related to the electricity (kWh) and the amount oftime each appliance is used (Table 7), and the emissions from fuel consumed for transportation-related activities, not theproduction of the appliance, or car, or plane (Table 8). Even if we assumed a worst case scenario for mail emissions and doubled the CO2 emissions (50 grams of CO2 per letter) to account for upstream processes’ emissions, mail would continueto favorably compare with most household activities. The USPS delivers about 515 letters per capita per year. Using a generalestimate of 25 grams of CO2 per letter generated within the postal value chain and the worst case scenario of 50 grams ofCO2 per letter, the distribution of these letters generates 13 –26 kg of CO2 per capita.
Table 7 shows the CO2 emissions generated per capita by the use of common appliances. These emission estimates are providedon a per use basis and a per year basis, e.g., the number of times a dishwasher is used per year times the per use emissions.
The Environmental Impact of Mail: A Baseline, June 2008, ©2008 Pitney Bowes Inc.

18
Table 7. CO2 Emissions Generated in the US by Selected Household Activities.63
* annual per capita emissions have been adjusted to account for the total number of households that own the particular appliance. Note: all of the appliance shown in Table 7 are standard appliances. Energy-efficient models are typically 30% more efficient than the older models.
As shown in Table 7, an electric water heater annually generates about 514 kg of CO2 per capita. A refrigerator generatesanother 127 kg of CO2 per capita. Each time a dishwasher is used, 1.04 kg of CO2 are generated. Over the course of a year, 43 kg of CO2 per capita are generated by using this one appliance. The annual equivalent number of letters is shown foreach activity in the two far right-hand columns using 25 grams and 50 grams of CO2 per letter, respectively.
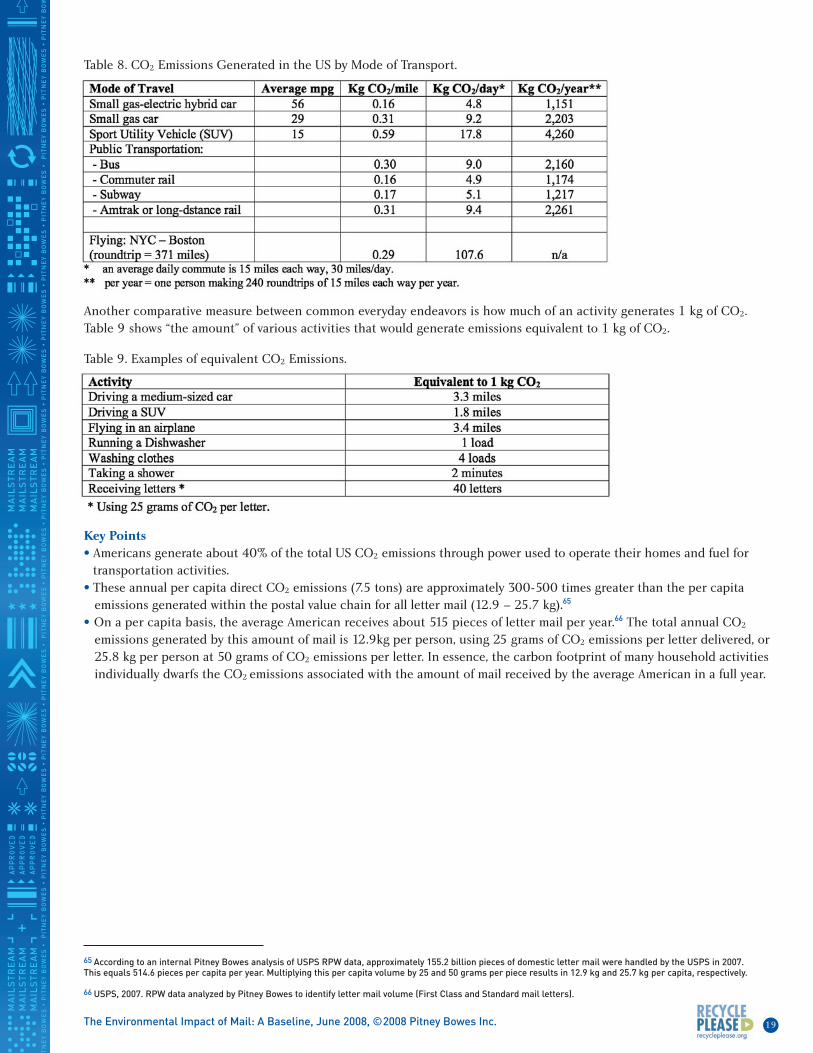
Table 8 shows the other major component of individual direct emissions, those associated with travel, primarily commutingto work. The average American commutes 15 miles each way to work. Approximately 8.8 kg of CO2 are generated per gallonof gasoline. Variations in the CO2 emissions occur depending upon the fuel efficiency of the vehicle. For example, commutingto work 15 miles each way in an SUV generates almost four times as much CO2 as a small hybrid car that averages 56 miles pergallon and twice as much CO2 as a small gas-powered car.
Flying generates the most CO2 emissions, on average between 0.177 kg/mile for a long haul flight (more than 2,575 miles)up to 0.29 kg of CO2 per mile for shorter flights (less than 727 miles).64
The Environmental Impact of Mail: A Baseline, June 2008, ©2008 Pitney Bowes Inc.
63 Primary sources are: 2006 estimate of .576 kg/kWh from "CO2 Emissions from Fuel Combustion (2006 Edition)". Sourced from the Greenhouse Gas ProtocolInitiative, 2008. US population in 2007 is 301.6 million and 110.8 million households (PB internal database). Estimates on household appliances wattage use standardmodels; energy efficient models typically use 30% less energy than standard models. Emissions are calculated by multiplying kg of CO2 generated per kWh by thenumber of kWh used. Average wattage for standard appliances source: US Department of Energy: A Consumer’s Guide to Energy Efficiency and Renewable Energy.Available at: http://www.eere.energy.gov/consumer/your_home/appliances/index.cfm/mytopic=10040. To convert watts to kWh: (Wattage x hours of use per day)/1000 = daily kWh; General formula is kWh/year x number of times used per year x .576 = kg CO2/use. Annual per capita = (per use x 2007 HH x % of US HH owningappliance (source: USEPA, 2001)/2007 population).
64 Greenhouse Gas Protocol Initiatives, 2005 and 2006.
19
Table 8. CO2 Emissions Generated in the US by Mode of Transport.
Another comparative measure between common everyday endeavors is how much of an activity generates 1 kg of CO2.Table 9 shows “the amount” of various activities that would generate emissions equivalent to 1 kg of CO2.
Table 9. Examples of equivalent CO2 Emissions.
Key Points• Americans generate about 40% of the total US CO2 emissions through power used to operate their homes and fuel for
transportation activities.• These annual per capita direct CO2 emissions (7.5 tons) are approximately 300-500 times greater than the per capita
emissions generated within the postal value chain for all letter mail (12.9 – 25.7 kg).65
• On a per capita basis, the average American receives about 515 pieces of letter mail per year.66 The total annual CO2
emissions generated by this amount of mail is 12.9kg per person, using 25 grams of CO2 emissions per letter delivered, or 25.8 kg per person at 50 grams of CO2 emissions per letter. In essence, the carbon footprint of many household activities individually dwarfs the CO2 emissions associated with the amount of mail received by the average American in a full year.
The Environmental Impact of Mail: A Baseline, June 2008, ©2008 Pitney Bowes Inc.
65 According to an internal Pitney Bowes analysis of USPS RPW data, approximately 155.2 billion pieces of domestic letter mail were handled by the USPS in 2007.This equals 514.6 pieces per capita per year. Multiplying this per capita volume by 25 and 50 grams per piece results in 12.9 kg and 25.7 kg per capita, respectively.
66 USPS, 2007. RPW data analyzed by Pitney Bowes to identify letter mail volume (First Class and Standard mail letters).

20
6. The Environmental Implications of Electronic Communications In this section, electronic communications are examined because mail as a communication medium is an alternative to emailand other forms of electronic communications. It is also integrally intertwined with electronic communications.
For example, a mail piece is often generated from a pre-existing computer file (e.g., a billing file from a mailer’s customerdatabase) that has been transmitted electronically to a print station. In addition, a mail piece might be created specificallyfor transmission to the consumer (e.g., a piece of correspondence created on a word processing program). Thus, a paper-based communication has had part of its carbon footprint generated by an electronic format before it is converted to themail piece.
Alternatively, the recipient of an electronic communication often finds it convenient to print the electronic document andeither read it or transmit it further in paper form. Many documents transmitted electronically as emails, or attachments toemails, are printed by the recipient. Some estimates are that the average office worker in the US prints more than 1,000pages a month.67
Emerging trends in multi-channel marketing further complicate the analysis. A letter, or catalog, is often sent to a prospect/customer and then followed up by an email or telephone call. This contact may result in either an on-line visit to a marketer’sweb site, or an invitation by the marketer to visit a local retail store. Trying to compare the total carbon footprint of mail vs.electronic communications in this environment is virtually impossible.
Thus, our comparative work is really designed to help analyze different components of either a single communication process,or of an integrated multi-channel set of communications processes, that are part of an overall marketing campaign. An attemptto eliminate mail and substitute electronic communications is more of a redistribution of the total carbon footprint than itselimination. The carbon footprint of a mail piece is more easily understood because its components are more visible to the recipient. However, the exercise of determining the carbon footprint of the electronic pieces of a communications processneed to be done to provide a complete picture of an end-to-end communications or marketing process.
At the very least, several factors and statistics argue against the simplistic notion that physical mail is always, and in every case,inferior to email in its environmental impact. The amount of energy that is involved in the manufacture of the electronic devicesand the energy that is consumed to power the computers contribute to the carbon footprint of electronic communications.
The Information and Communications Technology (ICT) sector is estimated to represent about 2% of all energy use.68 Thissector’s energy requirements are similar to the energy requirements of the paper industry, as illustrated previously in Section 4(Figure 5). These energy requirements will continue to increase. The power needed by Internet servers, a major componentof the ICT infrastructure, appears to be doubling approximately every five years.69
More than 11 million servers are required to power the Internet infrastructure in the US, and as of the end of 2007, the totalpower consumption of this infrastructure was about 70 billion kWh. This estimate includes direct energy use of the equipmentas well as the energy to cool the servers, and storage and network components that make up the Internet.70 Using the samemethodology employed in the previous section to compute the CO2 emissions of appliances, these 11 million servers generatedabout 40 million tons of CO2 in 2007.
The Environmental Impact of Mail: A Baseline, June 2008, ©2008 Pitney Bowes Inc.
67 Jimenez, 2004, cites a Boston Consulting Group study and Dalal, 2007, undertook a survey at Xerox PARC in Palo Alto, CA and concluded that 1,200 pages per monthare printed from computer files and emails.
68 USEPA, 2007d; Koomey, 2004; and, RAND, 2002. The documented estimates that are most often quoted today range as high as 3%. The highest numbers include thepower used by ancillary office equipment, such as faxes and telecommunications equipment. The 2% is, in our view, a solid estimate for PCs, LANs, printers and theInternet infrastructure of servers, data centers, storage devices and network equipment. USEPA, 2007d, contains the most recent and comprehensive estimates, includingprojected data for 2006, and updates pioneering work done by Kawamoto et al, 2002, and extensive work done by Jonathan Koomey’s team at Lawrence BerkeleyNational Laboratory, including Koomey, 2007, which, contains data up to 2005. Prior work by RAND, 2002, uses many of the same early sources. Koomey, 2004, providesa good summary of the history of documented estimates. Kawamoto et al., 2001, state that direct power use by office and network equipment at the end of 1999 wasabout 2% of total electricity use in the US. Work by Arthur D Little (Roth et al, 2002) estimated that commercial sector office equipment consumes 3% of all electricpower use. Gartner, 2007, puts the share of ICT at 2% of global CO2 emissions. Global Action Plan, 2007, attributes 3-4% of global emissions to ICT equipment. TheUSEPA, 2007d, report to the US Congress and Koomey, 2007, estimate that US electricity demand from servers and data centers alone is 1.5% and 1.2%, respectively.
69 USEPA, 2007d, computes a CAGR of 17% for server growth from 2000 to 2006. Koomey, 2007, shows a doubling of the power used by servers globally from 2000 to 2005.
70 USEPA, 2007d, quotes 11 million servers in the US for 2006 and estimates that servers will use 70 billion kWh in 2007 (pg 50). Gartner, 2007, estimates 34 millionservers globally.

21
The other key energy component of electronic communications is the power required to operate the approximately 248 millionpersonal computers used in the United States (118 million in offices, 130 million in homes).71 Compre-hensive and broadlyapplicable surveys are not available on the total power consumption of PCs. This is because data have not been collectedsystematically on the actual hours that PCs are turned on and the mode in which they are running (e.g., active use or underpower management) while they are switched on.72 Computers are often used inefficiently, and are left on for hours at a timeor continuously, even though the time they are actually used can be far less than that. Estimates for the annual power usefor an individual PC range between 100-600 kWh across studies.73 The actual power draw of the PC is dependent on manyfactor including the type of PC, laptop or desktop; the age of the PC (many newer computers have energy star requirements);and, the amount of time and applications used (business or home).
Another environmental implication of electronic communications is that the growing use of electronics is generating anincreasingly large amount of waste. The United Nations estimates that the world generates 20-50 million metric tons of e-waste per year.74 By comparison, annual worldwide mail volume weighs approximately 13.5 million metric tons.
The reason to cite these factors is not to compare a single physical letter to a single physical email. The CO2 emissions ofcomponents of particular electronic communications are often poorly understood or underemphasized. We do not mean to suggest that these components generate more CO2 emissions than an end-to-end process for a physical mail piece. Thereason is that a broad-based comparison is impossible. As Zurkirch and Reichart point out, such comparisons can only bemade in specific scenarios, and the answers tip one way or the other depending on the conditions outlined.75 Rather, thereason is to assert that the simple notion – email is good, physical mail is bad – does not stand up to even a cursory reviewof all the life cycle impacts of electronic communications.
Key Points• ICT contributes a carbon footprint that is about 2% of the nation’s total energy use. This is similar to the CO2 emissions
generated by the paper industry.• Key components of the carbon footprint of electronic communications are the energy requirements for servers and PCs.
There are about 11 million servers and 248 million PCs in the US. • Many documents transmitted electronically as emails, or attachments to emails, are printed by the recipient. It is estimated
that US office workers print about 1.5 times more pages of messages, documents, WebPages, emails, and attachments than the total mail received by these office workers both at home and at the office.
• The annual worldwide weight of e-waste is at least 1.5 times greater than the total weight of global mail. • A broad-based comparison of the carbon footprints of mail and email is impossible. Such comparisons can only be made
for specific scenarios and the answers depend on the specific, defined parameters among the various components of multi-channel communications.
The Environmental Impact of Mail: A Baseline, June 2008, ©2008 Pitney Bowes Inc.
71 The 1 billion worldwide PCs is cited in Global Action Plan, 2007, after data obtained from Richard Barrington, head of Public Policy for Sun Microsystems in the UK and Ireland and a UK government advisor. The UK number of 10 million is from the National Energy Foundation, 2007. The US PC population comes from GartnerForecasts, 2007 installed base.
72 The absence of comprehensive survey data on computer use has led some authors to rely on assumptions. Williams, 2004 assumed every home computer isswitched on 3 hrs per day. Gartner, 2007 assumed 8 hours, 7 days a week worldwide. The National Energy Foundation and 1E, 2007 in the UK conducted consumerresearch and showed that office computers in the UK are on about 11.5 hrs per day on average and that, when on, only a small fraction (6%) use power management.When laptops are operating on their batteries, they are consuming stored power that later has to be restored from the grid at a greater rate than if they wereplugged into an outlet. This is because of power conversion losses while charging the battery, power consumed by the charging circuitry, and battery storage losses(Webber et al, 2007). The total loss is estimated at 20% by NRDC, 2003.
73 Estimates for annual power use by computers vary widely. Just a few examples: Koomey, 1999, uses ranges from 73-250 watts for a home PC and 728 watts for anoffice PC. RAND, 2002, estimated 100 watts for home computers and 600 watts for office computers with a weighted average of 347 watts per computer. NRDC, 2003estimated a range of 100 - 570 watts with a weighted average of 425 watts. Williams, 2004 ( Table 3) makes reference only to home users and estimates 140 watts.
74 Grossman, 2006. E-waste is the waste created by old, obsolete consumer electronics, e.g., computers, cell phones, servers, network equipment, etc.
75 Zurkirch, M. and Reichart, I., 2000.

22The Environmental Impact of Mail: A Baseline, June 2008, ©2008 Pitney Bowes Inc.
7. Mailing Industry Sustainability InitiativesThe mailing industry is an important driver to the national economy because millions of jobs and businesses depend on it as a unique communications channel. In a marketplace increasingly focused on the environment, the mailing industryunderstands its responsibility to reduce its carbon footprint continuously, even when it is relatively low in comparison withother industries and human activities. The mailing industry is making an investment in several programs and initiatives toaddress, and further improve, the environmental challenges associated with the production and delivery of mail.
The Direct Marketing Association is leading an industry-wide initiative, the “Green 15”, which mandates 15 baseline businesspractices in five areas of the life cycle of mail. These areas are intended to improve mailers’ environmental performance: (1) Paper Procurement & Use; (2) List Hygiene & Data Management; (3) Mail Design & Production; (4) Packaging; and, (5) Recycling & Pollution Reduction. The DMA’s Commitment to the Consumer Choice (CCC) program also offers a MailPreference Service (MPS) through which consumers can select or stop (opt in or out) receiving promotional prospectingmail at home. This service provides consumers with an effective way to receive more of the mail that really matters to themand less of the mail they do not want.
Individual initiatives to improve environmental performance are also being led by organizations within the industry. A numberof companies are working with customers to provide address cleansing services and software to reduce overall waste from paper,energy and emissions associated with producing and delivering mail that has incorrect addresses. Double-sided printingand new paper transport technologies for printing and mail finishing systems are also reducing paper consumption.Collaborative efforts are underway to certify envelope/packages to the Cradle-to-Cradle certification (taking into consider-ing paper, adhesives, toxics, etc.). Initiatives to reduce transportation emissions include: double-deck trailers; delivering to centralized depots where customers can pick up parcels at their own convenience; the use of new technologies to optimizeroutes on a daily basis; and, fleet sharing.
Mailing products and equipment are being optimized to reduce their energy impact, e.g., sorting machines that switch offunused parts during the sorting process. The envelope industry uses a vacuum to move paper around in the folding processand incorporates technology to extract inks from waste water and recycle the ink while maintaining a closed-loop water system.Energy Star certification for equipment specific to the mailing industry was proposed and approved.
The USPS has also implemented several environmentally responsible programs, such as sourcing packaging materials thatare 100% recyclable and re-establishing the Greening of the Mail Task Force. The International Post Corporation has underdevelopment an Environmental Measurement System for management and reporting of carbon emissions improvements.TNT launched its Planet Me program to reduce its CO2 emissions. La Poste has a goal of reducing emissions by fifteen percentover the next four years. Swiss Post has invested in a number of environmental initiatives including, natural gas-poweredvehicles, optimizing rail transport and a Postbus fleet that meets the Enhanced Environmentally Friendly Vehicle standards.These are just a few examples of individual initiatives that are occurring throughout the industry and help mailers and theircustomers operate in a more sustainable manner.
The mailing industry is implementing these myriad array of initiatives in order to maintain the critical services it provideswhile conserving and preserving the natural resources it needs to conduct business.

23The Environmental Impact of Mail: A Baseline, June 2008, ©2008 Pitney Bowes Inc.
8. Next Steps/RecommendationsThe mailing industry’s focus on achieving the highest environmental standards has propelled its success in several areas. The industry plans to continuously expand its environmental stewardship activities for long-term growth in a dynamic marketplace. Organizations and companies all along the life cycle of mail must work together to accomplish this objectiveand establish best practices that support the environmental sustainability of mail.
This review of existing data provides a baseline for the mailing industry to undertake additional efforts to improve the envi-ronmentally responsible behavior within the industry. As additional information is developed on the environmental impactof mail we will continue to update and refine this baseline. To meet this objective the following activities are recommended:
• Establish a set of data for the life cycle activities and processes to be included in estimating mail’s CO2 emissions. • Develop and create additional mail industry partnerships to further expand the environmental sustainability of mail and
deliver continuous improvement. • Establish mechanisms to share best practices and establish standards for the industry. • Continue to study CO2 emissions and other environmental impacts of mail and communications to ensure that we are not
simply shifting the environmental burden. • Identify opportunities to maximize the utilization of the vast infrastructure of the posts and private carriers and suppliers
to benefit the environment. • Address consumer behavior as a research need to improve recycling and the understanding of sustainable forestry. • Further educate mailers and consumers regarding the relative environmental impacts of mail (versus other activities) and
what they can do to help reduce emissions.

24The Environmental Impact of Mail: A Baseline, June 2008, ©2008 Pitney Bowes Inc.
Bibliography
Abramovitz, J.N. and A.T. Mattoon. 1999. Worldwatch Paper #149: Paper cuts: recovering the paper landscape, Washington, DC: Worldwatch Institute. 1999.
Alvarez, M. 2007. The State of America’s Forests. Bethesda, MD: Society of American Foresters (SAF). May, 2007.
American Forest & Paper Association (AF&PA). 2007. Data provided through interviews and written response papers.
Asia Pacific Mail & Express. 2007. “Sustainable Development, a powerful lever to strengthen La Poste’s economical efficiency”, Singapore. September 17-19, 2007.
Axel Springer Verlag AG., Stora, and Canfor. 1998. A Life Cycle Assessment of the Production of a Daily Newspaper and a Weekly Magazine. Short version of the Study. Zurich, Switzerland: prepared by INFRAS (a scientific consultant). 1998.
BBC News. 2007. Firms need clear climate policies. Viewpoint by Smith, James. http:/news.bbc.co.uk/2/hi/science/nature/7028214.stm, last updated October 8, 2007.
Binder, M. 2008. Author’s conversation with PE consulting principal during the Aspen Institute’s LCA Workshop for the International Mailing Industry Initiative, Paris, France. February 25-26, 2008.
Carbon Trust, 2006a. The carbon emissions generated in all that we consume. Center for Environmental Strategy, University of Surrey for The Carbon Trust.January 30, 2006.
Carbon Trust, 2006b. Carbon Footprints in the Supply Chain: The Next Step for Business. United Kingdom. November, 2006.
Commtouch. 2008. “Q4 2007 Spam Reached 96 Percent Of Email,” by David Utter, at http://www.securitypronews.com/news/securitynews/spn-45-20080115Q42007SpamReached96PercentOfEmail.html, January 15, accessed March, 2008.
Confederation of European Paper Industries (CEPI). 2007. Sustainability Report, 2007.
Dalal, Brinda. 2007. Why Disappearing Ink isn’t Just for Spies. Xerox PARC, Palo Alto, CA, at http://resources.zdnet.co.uk/articles/features/ 0,1000002000,39290738,00.html
defra. 2007a. Waste Strategy for England 2007. Presented to Parliament by the Secretary of State for Environment, Food and Rural Affairs by Command of Her Majesty. May, 2007.
_______. 2007b. The Open University Household Waste Study, Key Findings from 2006. defra. 4/3/07.
Doherty, Sean. 2007. World Economic Forum. Presentation at PostExpo Business Forum. Barcelona, Spain. October 2, 2007.
Deutsche Post World Net. 2006. Corporate Social Responsibility Report. DPWN, 2006.
Economist Intelligence Unit, accessed through Pitney Bowes subscriber database.
EEM, Inc. 2007. A Paper Buyer’s Guide to Forest Certification Schemes. Markets Initiative, Resource Guide. February, 2007.
Envelope Manufacturers Association (EMA). 2007. The Future of Recovered Paper. Envelope Manufacturers Assoc. Meeting. June 20, 2007.
FedEx. FedEx home page. FedEx environment responsibility: http://www.fedex.com/us/about/responsibility/environment.html
FEFCO (European Federation of Corrugated Board Manufacturers), 2006. European Database for Corrugated Board Life Cycle Studies. FEFCO Groupement Ondule and European Containerboard Organization (ECO). 2006. Note: FEFCO is an association of associations estab lished in 1952 to represent the interests of all European Corrugated Board Manufacturers. http://www.fefco.org/fileadmin/Fefco/pdfs—words/Publications/lca2006.pdf.
Five Winds International. 2008. Paper Mail Life Cycle Goal & Scope Definition. Preliminary Draft, prepared in association with PE Americas for the Aspen Institute, Paris, France. March 28, 2008.
Food and Agriculture Organization (FAO). 2007. The State of the World’s Forests, 2007. Food and Agriculture Organization of the United Nations.Rome, Italy. 2007.
GaBi Database. 2008. LAC/LCE software and database at gabi-software.com
Gartner. 2007. IT Vendors, Service Providers and Users Can Lighten IT’s Environmental Footprint. Research Report G00153634. December 5, 2007.

25The Environmental Impact of Mail: A Baseline, June 2008, ©2008 Pitney Bowes Inc.
Bibliography (continued)
Gielen, D. and Cecilia Tam. 2006. Energy Use, Technologies and CO2 Emissions in the Pulp and Paper Industry. Energy Technology Policy Division, International Energy Agency (IEA), a discussion paper prepared for the IEA workshop: Energy Efficient Technologies and CO2 Reduction Potential in the Pulp and Paper Industry, Paris, France.10/2006. Draft version: June 10, 2006.http://www.iea.org/Textbase/work/2006/pulppaper/discussion_paper.pdf.
Global Action Plan. 2007. An Inefficient Truth. London, England: Global Action Plan. December 2007. www.globalactionplan.org.uk/upload/resource/full_report.pdf.
Global Environment Outlook (GEO). 2007. GEO Indicators and GEO Yearbook, 2007. United Nations Environment Programme. Nairobi, Kenya, 2007.
Goodall, C., 2007. How to live a low-carbon life: the individual’s guide to stopping climate change. London, UK and Sterling, VA, USA: Earthscan. 2007.
Gower, S.T., A. McKeon-Ruediger, A. Reitter, M. Bradley, D. Refkin, T. Tollefson, F.J. Suba, A. Taup, L. Embury-Williams, S. Schiavone, J. Weinbauer, A.C. Janetos, and R. Jarvis. 2006. Following the paper trail - the impact of magazine and dimensional lumber production on greenhouse gas emissions: A case study. Published by the H. John Heinz III Center for Science, Washington D.C. 2006.
Greenhouse Gas Protocol Initiative. 2005. CO2 Emissions from Transport or Mobile Sources. Version 1.3. January, 2005. Accessed January 26, 2008 at http://www.ghgprotocol.org/calculation-tools/all-tools.
_______. 2006. Emissions from Employee Commuting. June, 2006. Accessed January 26, 2008 at http://www.ghgprotocol.org/calculation-tools/all-tools.
_______. 2008. Indirect Emissions, Emissions from use of purchased electricity, heat or steam. Version 2.0. March, 2008. Available at http://www.ghgprotocol.org/calculation-tools/refrigeration.
Green Grid. 2008. The Green Grid is a global consortium dedicated to advancing energy efficiency in data centers and business computing ecosystems. A members roster is at http://www.thegreengrid.org/member_roster/
Grossman, E. 2006. High tech trash: digital devices, hidden toxics, and human health. Washington: Island Press/Shearwater Books. 2006.
International Data Corporation (IDC). 2004. Levitt, Mark and Robert P. Mahowald. Worldwide Email Usage 2004-2008 Forecast: Spam Today, Other Content Tomorrow. Framingham, MA. August, 2004.
________. 2006. Levitt, Mark and Robert P. Mahowald. Worldwide Email Usage 2005-2009 Forecast: Email’s Future Depends on Keeping Its Value High and Its Cost Low. Framingham, MA. December, 2006.
________. 2007. Levitt, Mark. Worldwide Email Usage 2007-2011 Forecast: Resurgence of Spam Takes Its Toll. Framingham, MA. March, 2007.
International Energy Agency (IEA). 2006. CO2 Emissions from Fuel Combustion (2006 Edition). The IEA is an energy policy advisor to its 27 member countries. Sourced from the Greenhouse Gas Protocol Initiative, Indirect Emissions, Emissions from use of purchased electricity, heat or steam. Available from http://www.ghgprotocol.org/calculation-tools/refrigeration. (new 2/26 deleted other IEA 2006 citation)
Intergovernmental Panel on Climate Change (IPCC). 2005. IPCC Special Report on Carbon Dioxide Capture and Storage. Prepared by Working Group III of the Intergovernmental Panel on Climate Change [Metz, B., O. Davidson, H.C. de Coninck, M. Loos, and L.A. Meyer (eds.)]. Cambridge University Press, Cambridge, United Kingdom and New York, NY, USA. 2005.
International Association of Electronics Recyclers (IAER), 2006. IAER Electronics Recycling Industry Report, 2006. Albany, NY. 2006.
Jimenez, L. 2004. Electronic Substitution for Mail: Models and Results; Myths and Realities. Presented at the 12th Conference on Postal Delivery and Economics, Rutgers University, Center for Research in Regulated Industries, Cork, Ireland. June 3, 2004.
Kauppi, P.E., J. Ausubel, J. Fang, A. Mather, R. Sedjo, and P. Waggoner. 2006. Returning Forests Analyzed with the Forest Identity. Proceedings of the National Academy of Sciences of the United States of America. Nov. 14, 2006, vol. 103, no. 46.
Kawamoto, Kaoru, Jonathan Koomey, Bruce Nrodman, Richard E. Brown, Maryann Piette, Michael Ting, and Alan Meier. 2002. Electricity Used by Office Equipment and Network Equipment in the U.S. Energy – The International Journal, vol. 27, no. 3. pp. 255-269 (also LBNL-45917) March, 2002.
Kinsella, S., G. Gleason, V. Mills, N. Rycroft, J. Ford, K. Sheehan, J. Martin. 2007. The State of the Paper Industry. Prepared for the Environmental Paper Network. 2007.
Koomey, J. 1999. “Recreating and correcting the calculations in The Internet Begins with Coal, by Mark Mills”. December 9, 1999. Accessed March 21, 2008 at http://enduse.lbl.gov/Info/internetelectpublic.xls.

26The Environmental Impact of Mail: A Baseline, June 2008, ©2008 Pitney Bowes Inc.
Bibliography (continued)
Koomey, J. ed. 2004. Information Technology and Resource Use. at Energy End-use Forecasting. Last updated 8/19/2004, and accessed 3/3/2008 at http://enduse.lbl.gov/Projects/InfoTech.html.
Koomey, J. 2007. Estimating Total Power Consumption by Servers in the US and the World. February 15, 2007.
Lehman Brothers. 2007. The Business of Climate Change. February, 2007.
Mangmeechai, Aweewan and H. Scott Matthews. 2007. Life Cycle Analysis of energy and Greenhouse Gas Emissions of Ground Shipping in the United States:Case Study of the U.S. Postal Service. Draft: March 20, 2007.
National Council for Air and Stream Improvement (ncasi). 2007. The Greenhouse Gas and Carbon Profile of the Global Forest Products Industry,Special Report no. 07-02, February, 2007.
National Energy Foundation and 1E. 2007. The PC Energy Report. June 19, 2007. http://www.1e.com/energycampaign/downloads/1E_reportFINAL.pdf.
National Geographic. 2007. The Green Guide, “A Calculated Loss: How to Reduce Your Global Warming Emissions”. October 8, 2007.
National Geographic. 2008. High Tech Trash: Will your discarded TV or computer end up in a ditch in Ghana? by Chris Carroll. January, 2008.
National Resource Defense Council (NRDC) and Ecos Consulting. 2003. Laptop Computers: How Much energy Do They Use and How Much Can We Save? September, 2003. http://www.efficientpowersupplies.org/pages/SeptNRDCLaptopSummary_digital.pdf, accessed March 17, 2008.
New Scientist. 2008. Can we Stop the Internet Destroying our Planet? January 5, 2008.
Post Danmark. 2006. Environmental Report, 2006. and a white paper supplement Life Cycle Assessment of a Letter. Prepared in cooperation with COWI Consulting Engineers and Planners. 2006.
Post Europe. 2005. Greenhouse Gas Reduction Program a challenge for European Postal Operators. Brussels: Post Europe. 2005.
Post Expo. 2007. Various papers presented by La Poste (France), Royal Mail, TNT, and the Fifth Annual World Postal Survey results conducted by E-BISS International. Barcelona, Spain: Post Expo Business Forum. October 2 – 4, 2007.
Press Release, “Itella to Reduce Carbon Dioxide Emissions by 10 Percent by 2012”. June 15, 2007.
Pulp & Paper. 2005. U.S. paper/board production rises in 2004 to 91.47 million tons. Industry Review. http://findarticles.com/p/articles/ mi/qa3636/is_200504/ai_nl3634551/print, accessed 1/7/2008.
Quack, Dr. Dietlinde. 2005. Okobilanzielle Analyse von Rechnung Online Im Vergleich zu Rechnung per Brief. Technischer Bericht Im Auftrag der Deutschen Telekom AG T-Com, Zentrale, Freiburg. Prepared by the Oko-Institut e.V. Institut e.V. for Applied Ecology. July, 28, 2005.
RAND Science and Technology. 2002. Electricity Requirements for a Digital Society, by Walter Baer, Scott Hassell and Ben Vollaard. Prepared for the US Department of Energy, Santa Monica, CA. 2002.
Reid, H., S. Huq, A. Inkinen, J. MacGregor, D. Macqueen, J. Mayers, L. Murray, and R. Tipper. 2004. Using Wood Products to Mitigate Climate Change: A Review of Evidence and Key Issues for Sustainable Development. Prepared for the International Institute for Environment and Development (IIEE)and The Edinburgh Centre for Carbon Management, London, United Kingdom and Edinburgh, Scotland. January, 2004.
Roth, K., Goldstein, F., Kleinman, J. 2002. Energy Consumption by Office and Telecommunications Equipment in Commercial Buildings – Volume I: Energy Combustion Baseline, Cambridge, MA: Arthur D. Little. January, 2002.
Royal Mail. 2006. Talking, Listening, Improving: Passionate about Progress, Corporate Social Responsibility Report. 2006.
Sedjo, Roger A. 2004. Genetically Engineered Trees: Promise and Concerns, Washington, DC: Resources for the Future. November, 2004.
Stern Review, 2006. The Economics of Climate Change. The Office of Climate Change in support of the UK Government. October, 2006.
Szeto, C. and Jimenez, L. 2005. “Consumer Preferences for Communications Media,” Pitney Bowes paper for the study on Electronic Substitution: Models and Results, Myths and Reality. 2005.
Tang, Kenny. 2007. “Sustainable Computing: Sun Microsystems’ Three-Step Eco Strategy of Innovate, Act and Share,” in Cut Carbon, Grow Profits,ed. by Kenny Tang and Ruth Yeoh, Middlesex University Press, London. 2007.

27The Environmental Impact of Mail: A Baseline, June 2008, ©2008 Pitney Bowes Inc.
Bibliography (continued)
Tappi. 2007. Tappi is a technical association for the worldwide pulp, paper and converting industries. www.tappi.org.
Terrapass.com. TerraPass is the brainchild of Dr. Karl Ulrich at the University of Pennsylvania. Along with 41 of his students, Karl launched TerraPassin October, 2004.
TNT. 2006. Social Responsibility Report. TNT. 2006.
United Nations Environment Programme (UNEP). 2007. Global Environmental Outlook: environment for development (GEO-4). Progress Press LTD,Malta, United Nations Environment Programme. 2007.
United Nations Statistics Division. 2007. Demographic Yearbook, 2004. United Nations, New York, United States. http://unstats.un.org/unsd/demographic/products/dyb/dybsets/2004%20DYB.pdf, accessed January 8, 2008.
United States Commerce Dept., US Census Bureau. 2006. Current Industrial Reports. Glass Containers: 2005. Washington DC: United States CommerceDepartment. June, 2006.
United States Department of Energy (USDOE). 2002. Carbon Dioxide Emissions from the Generation of Electric Power in the United States. Available at: http:/www.eia.doe.gov/cneaf/electricity/page/co2_report/co2report.html.
________. 2007a. Energy Star Residential Water Heaters: Second Draft Criteria Analysis and Proposal, P. 9. Available at: http://www.energystar.gov/index.cfm?c=new_specs.water_heaters.
________. 2007b. Transportation Energy Data Book: Edition 26. Tennessee: prepared by Oak Ridge National Laboratory for the United States Departmentof Energy’s Office of Energy Efficiency and Renewable Energy. 2007.
United States Department of Energy’s Energy Information Administration (EIA). 2002. Special Topic: Energy-Related Carbon Dioxide Emissions in US Manufacturing. Washington DC: Department of Energy. 2002.
________. 2007a. International Energy Outlook, 2007. Washington DC: Department of Energy. 2007.
________. 2007b. Official Energy Statistics from the U.S. Government, Voluntary Reporting of Greenhouse Gases Program (Fuel and Energy Source Codes and Emission Coefficients). www.eia.doe.gov/oiaf/1605/coefficients.html accessed 9/28/07.
United States Department of Transportation (USDOT). 2003. OmniStats 3(4), Washington DC: United States Department of Transportation’s Research and Innovative Technology Administration, Bureau of Transportation Statistics. 2003. http://www.bts.gov/publications/omnistats/volume_03_issue_04/html/entire.html.
United States Environmental Protection Agency (USEPA). 2001. End-Use Consumption of Electricity, 2001. Washington DC: United States EnvironmentalProtection Agency. 2001. http://www.eia.doe.gov/emeu/recs/recs2001/enduse2001/enduse2001.html.
________. 2006a. Municipal Solid Waste in the United States: 2005 Facts and Figures. Washington DC: United States Environmental Protection Agency. October, 2006.
________. 2006b. Solid Waste Management and Greenhouse Gases: a Life-Cycle Assessment of Emissions and Sinks, 3rd edition. Washington DC: United StatesEnvironmental Protection Agency. September, 2006.
________. 2007a. Inventory of US Greenhouse Gas Emissions and Sinks: 1990-2005. Washington DC: United States Environmental Protection Agency. April 15, 2007.
________. 2007b. Municipal Solid Waste Generation, Recycling, and Disposal in the United States: Facts and Figures for 2006. Washington DC: United StatesEnvironmental Protection Agency. November, 2007.
________. 2007c. Next Generation of Energy Star Computers Offers Over $1 Billion in Energy Savings. EPA Newsroom. Release date: 11/06/2007.
________. 2007d. Report to Congress on Server and Data Center Energy Efficiency: Public Law 109-431. Washington DC: United States Environmental Protection Agency, ENERGY STAR Program. Aug 2, 2007.
________. 2008. Inventory of US Greenhouse Gas Emissions and Sinks: 1990-2006, Draft Report. Washington DC: United States Environmental Protection Agency. February, 2008. http://www.epa.gov/climatechange/emissions/usinventoryreport.html.
United Parcel Service (UPS). UPS Sustainability Statement. UPS home page: http://www.sustainability.ups.com/overview/statement.html
United States Geologic Survey (USGS). 2001. US Department of the Interior. Obsolete Computers, ‘Gold Mine,’ or High-Tech Trash? Resource Recovery from Recycling, Fact Sheet. Washington DC: US Department of the Interior. July, 2001.

28The Environmental Impact of Mail: A Baseline, June 2008, ©2008 Pitney Bowes Inc.
Bibliography (continued)________. 2006. US Department of the Interior. Recycled Cell Phones – A Treasure Trove of Valuable Metals, Fact Sheet. Washington DC: US Department
of the Interior. July, 2006.
________. 2007. US Department of the Interior. 2005 Minerals Yearbook, Recycling – Metals. Washington DC: US Department of the Interior. February, 2007.
United States Postal Service (USPS). 2005. Environmental Impact of Advertising Mail, Washington DC: United States Postal Service. September, 2005.
________. 2007. Revenue, Pieces and Weights data for 2005, 2006, and 2007.
Vattenfall. 2005. Life Cycle Assessment Vattenfall’s Electricity in Sweden. Vattenfall, 2005.
Webber, C., Korn, D. and Sanchez, M. 2007. Savings Potential of ENERGY STAR External Power Adapters and Battery Chargers. Lawrence Berkeley NationalLaboratory, LBNL-62399, Berkeley, CA. February, 2007.
Wenzel, T.P., Koomey, J.G., Rosenquist, G.J., Sanchez, M. and Hanford, J.W. 1997. Energy Data Sourcebook for the US Residential Sector. Energy Analysis Program, University of California. California: Berkeley. September, 1997.
Williams, Eric. 2004. Energy Intensity of Computer Manufacturing: Hybrid Assessment Combining Process and Economic Input-Output Methods. United Nations, University of Tokyo. Published in Environmental Science and Technology, Vol. 38, No. 22, pp 6166-6174.
World Business Council for Sustainable Development (WBCSD). 2005. The sustainable forest products industry, carbon and climate change. Geneva: World Business Council for Sustainable Development. http://www.wbcsd.org/web/publications/sfpi-cop11.pdf accessed January 9, 2008.
________. 2007. The sustainable forest products industry, carbon and climate change: Key messages for Policy-makers (2007 Update). World Business Council for Sustainable Development, technical content developed by NCASI. September 18, 2007.
www.greenpressinitiative.org. The data source for paper recovery rates is the American Forest and Paper Assoc. recovery data that is based on a 2001 progress report.
www.plasticnews.com. FYI…Per capita plastics consumption.
YouGov Plc. 2007. Online Survey of 2,011 adults for Fujitsu Siemens Computer.
Zurkirch, Manfred and Reichart, Inge. 2000. Environmental Impact of Telecommunications Services: Two Life-Cycle Studies. Joint project between Swisscomand the Swiss Federal Laboratories for Materials Testing and Research (EMPA). 2000.

29The Environmental Impact of Mail: A Baseline, June 2008, ©2008 Pitney Bowes Inc.
PRINCIPAL AUTHORDenice Koljonen, Independent Consultant, Needham, MA
EDITORPaul Robbertz, Vice President, Environment Health and Safety, Pitney Bowes Inc.
ACKNOWLEDGEMENTSWe would like to thank Luis Jimenez, former VP and Chief Industry Policy Officer at Pitney Bowes for initiating and drivingthis project. We are grateful for the support of our colleagues at Pitney Bowes, especially members of the Global IndustryDevelopment Group, Environmental Health and Safety and Corporate Communications. The following contributed research,analysis, advice, suggestions, review and editing: Thomas Abraham, Matthew Broder, Mike Critelli, Pradeep Das, Jean-PhilippeDucasse, Stefano Gori, Alex Fu, Ellen Huang, David Jefferies, Michael Lintell, Doug Quine, Mark Pettegrew, John Thaler,Bradley Tisdahl, Tamara Titre, Leigh Walton, Howard Wright and Jackie Wyatt.
Colleagues outside of Pitney Bowes that also contributed were: David Bonistall, Vice President, Environmental, Health & Safety, New Page Corporation, Serenity Edwards, Director, Corporate Responsibility, Direct Marketing Association, Jim Fava, Managing Director, Five Winds International, John Fittipaldi, CEP Senior Fellow, Army Environmental PolicyInstitute, David Refkin, Director of Sustainable Development, Time Inc., and Terry F. Yosie, President & CEO WorldEnvironment Center.
We also thank the many researchers cited in this report for their past pioneering work in this area. We especially thank thosewho contributed their time to speak or correspond with us and who forwarded their work and many useful references. A numberwished to remain anonymous. Among those who gave us permission to mention their names, we are grateful to those listedbelow. None of the conclusions of this report, however, are to be attributed to any one other than its principal author.
Marc Binder, PE Americas, Boston, MA
Martin Blake, Royal Mail Group, London, UK
Soren Boas, Post Danmark, Copenhagen, Denmark
Eugene Columbo, Senior Advisor, Aspen Institute, Washington, DC
Brinda Dalal, Palo Alto Research Center, Palo Alto, CA
James Fava, Managing Drector, Five Winds International, West Chester, PA
Simon Francis, Royal Mail Group, London, UK
Beat Friedli, Swiss Post, Bern, Switzerland
Andreas Furler, Swiss Post, Bern, Switzerland
Julia Haake, La Poste, Paris, France
Peter Koppe, Austria Post, Vienna, Austria
Franz Krug, KEBA, Vienna, Austria
H. Scott Matthews, Green Design Institute, Carnegie Mellon University
Aweewan Mangmeechai, Green Design Institute, Carnegie Mellon University
Rosalie McGovern, Canada Post Corporation, Toronto, Canada
Bill Mckee, Xerox Corporation, Rochester, NY
Simon Mingay, Gartner, London, UK
Duncan Noble, Five Winds International, Ottawa, Canada
Sophie-Noelle Nemo, Mediapost, La Poste, Paris, France
Allan Robinson, Australia Post, Melbourne, Australia
Eric Shrader, Palo Alto Research Center, Palo Alto, CA
Nuno da Silva, PE Americas, Boston, MA
Barbara Wallner, Austria Post, Vienna, Austria

30
For more information call toll-free: 1-800 MR BOWES (800-672-6937)www.pb.com
©2008 Pitney Bowes Inc. All Rights Reserved An Equal Opportunity Employer. Printed in U.S.A.
World HeadquartersStamford, CT 06926-0700