the evolution of jumpinpin inlet - ozcoasts · 4.0 coastal processes ... this coastal engineering...
TRANSCRIPT

Cooperative Research Centre for Coastal Zone, Estuary & Waterway Management
Technical Report 62
The evolution of
Jumpinpin Inlet
Emma McCauley
Rodger Tomlinson


The evolution of Jumpinpin Inlet
Emma McCauley
Rodger Tomlinson

ii
The evolution of Jumpinpin Inlet
Copyright © 2006:
Cooperative Research Centre for Coastal Zone, Estuary and Waterway Management
Written by:
Emma McCauley
Rodger Tomlinson
Published by the Cooperative Research Centre for Coastal Zone, Estuary
and Waterway Management (Coastal CRC)
Indooroopilly Sciences Centre
80 Meiers Road
Indooroopilly Qld 4068
Australia
www.coastal.crc.org.au
The text of this publication may be copied and distributed for research and educational purposes with proper
acknowledgment. Photos cannot be reproduced without permission of the copyright holder.
Disclaimer: The information in this report was current at the time of publication. While the report was prepared with care by
the authors, the Coastal CRC and its partner organisations accept no liability for any matters arising from its contents.
National Library of Australia Cataloguing-in-Publication data
The evolution of Jumpinpin Inlet
QNRM06090 ISBN 1 921017 08 2 (print) ISBN 1 921017 09 0 (online)
iii
Table of contents 1.0 Introduction ..........................................................................................................................1
1.1 General ......................................................................................................... 1 1.2 Aim ............................................................................................................... 1 1.3 Objectives ..................................................................................................... 2 1.4 Report structure ............................................................................................. 2
2.0 Methodology and study limitations .......................................................................................3 2.1 Methodology.................................................................................................. 3 2.2 Study limitations............................................................................................. 4
3.0 Site description.....................................................................................................................5 4.0 Coastal processes................................................................................................................9
4.1 Short-term coastal processes .......................................................................... 9 4.1.1 Beach and bar destruction – storm phase...............................................................9 4.1.2 Beach and bar building – fair weather phase ........................................................11 4.1.3 Littoral transport and sand trapping.......................................................................11 4.1.4 Inlet migration and spit breaching .........................................................................12 4.1.5 Sand bypassing ....................................................................................................12 4.1.6 Inlet stability and closure.......................................................................................14
4.2 Long-term coastal processes ........................................................................ 15 4.2.1 Long-term shoreline movement.............................................................................15 4.2.2 Sea level and climate change ...............................................................................16
5.0 Inlet morphology.................................................................................................................17 5.1 Inlet origin ................................................................................................... 17 5.2 Inlet classification ......................................................................................... 17 5.3 Inlet geometry.............................................................................................. 18 5.4 Channel size and delta formations ................................................................. 19 5.5 Sedimentary units ........................................................................................ 21
6.0 Geological history...............................................................................................................22 6.1 North Stradbroke Island ................................................................................ 22 6.2 South Stradbroke Island ............................................................................... 23 6.3 Jumpinpin.................................................................................................... 23 6.4 Bay islands.................................................................................................. 23
7.0 European history ................................................................................................................24 7.1 Early history................................................................................................. 24 7.2 Post 1890s .................................................................................................. 30 7.3 Summary..................................................................................................... 37
8.0 Summary of aerial observations.........................................................................................38 8.1 Period changes............................................................................................ 38
8.1.1 1904 to 1917 .........................................................................................................38 8.1.2 1917 to 1944 .........................................................................................................38 8.1.3 1944 to 1955 .........................................................................................................38 8.1.4 1955 to 1965 .........................................................................................................38 8.1.5 1965 to 1970 .........................................................................................................39 8.1.6 1970 to 1978 .........................................................................................................39 8.1.7 1978 to circa 1980 satellite image.........................................................................40 8.1.8 1980 to 1983 .........................................................................................................40 8.1.9 1983 to 1987 .........................................................................................................40
iv
8.1.10 1987 to 1993.........................................................................................................40 8.1.11 1993 to 1997.........................................................................................................41
8.2 Net changes ................................................................................................ 41 8.3 Cyclic changes............................................................................................. 42
8.3.1 Comparison of 1944 to 1978.................................................................................42 8.3.2 Comparison of 1955 to 1993.................................................................................43
8.4 Summary ..................................................................................................... 45 9.0 Weather data .....................................................................................................................46 10.0 Controlling processes ........................................................................................................49 11.0 The seaway........................................................................................................................53 12.0 Prediction of future trends..................................................................................................55 13.0 Conclusions and recommendations ...................................................................................56
13.1 Conclusions ................................................................................................. 56 13.2 Recommendations........................................................................................ 56
References......................................................................................................................................57 Further reading ...............................................................................................................................59 Appendixes .....................................................................................................................................62
Appendix A. Glossary of terms ......................................................................................... 63 Appendix B. Aerial photographs and other photographs ..................................................... 68 Appendix C. Aerial photography analysis........................................................................... 80 Appendix D. Major storm events ....................................................................................... 84 Appendix E. COPE data .................................................................................................. 88
List of tables Table 9.1. Storm surge, wave and flood data, 1893 to 1996 .........................................................46 List of plates Plate 1. Photograph of Jumpinpin taken just prior to the breakthrough, dated 1896. .......................31 Plate 2. Photograph of Jumpinpin following the breakthrough looking north, dated 1896. ...............33 Plate 3. Photograph 1 of Jumpinpin following the breakthrough looking north, dated 1898. ............33 Plate 4. Photograph 2 of Jumpinpin following the breakthrough looking north, dated 1898. ............34 Plate 5. Photograph of Jumpinpin looking south from Main Beach, dated 1917. .............................34 Plate 6. Inside Jumpinpin looking north, 1917..................................................................................36

v
List of figures Figure 3.1. Location map of Moreton Bay. ........................................................................................ 6 Figure 3.2. Plan showing Jumpinpin and surrounds.......................................................................... 7 Figure 3.3. Detailed plan of Jumpinpin Inlet ...................................................................................... 8 Figure 4.1. Schematic diagram of storm wave attack on beach and dune. .................................... 10 Figure 4.2. Possible configuration of equilibrium flow curves for two-inlet bay systems.................. 15 Figure 5.1. The four shapes of barrier island inlets ......................................................................... 19 Figure 5.2. Typical ebb-tidal delta morphology................................................................................ 20 Figure 7.1. Captain Cook’s chart of the coastline from Mt Warning to Wide Bay, 1770. ................. 25 Figure 7.2. Matthew Flinders’ chart of Moreton Bay, 1799 .............................................................. 27 Figure 7.3. Oxley’s plan of Moreton Bay, 1825. .............................................................................. 28 Figure 7.4. Oyster Fisheries map of Jumpinpin, circa 1890. ........................................................... 29 Figure 7.5. Brisbane Board of Waterworks Stradbroke Island survey feature map, 1904. .............. 35 Figure 8.1. Diagrammatic representations of shoreline changes from aerial photographs.............. 39 Figure 8.2. Net shoreline changes, 1944 to 1993............................................................................ 41 Figure 8.3. Shoreline comparison, 1944 to 1978............................................................................. 43 Figure 8.4. Shoreline comparison, 1955 to 1993............................................................................. 44 Figure 9.1. Summary of storm attack and fair weather on the southern Queensland coast. ........... 47 Figure 10.1. Conceptual model of shoreline change at Jumpinpin. ................................................. 50 Figure A.1. Visual definition of terms describing a typical beach profile. ......................................... 66 Figure A.2. Visual definition of the morphological components of a typical tidal inlet ...................... 66 Figure A.3. Visual definition of terms describing an ebb-tidal delta ................................................. 67 Figure B.1. 1944 Aerial photograph of Jumpinpin inlet.................................................................... 69 Figure B.2. 1955 Aerial photograph of Jumpinpin Inlet.................................................................... 70 Figure B.3. 1965 Aerial photograph of Jumpinpin inlet.................................................................... 71 Figure B.4. 1970 Aerial photograph of Jumpinpin Inlet.................................................................... 72 Figure B.5. 1978 Aerial photograph of Jumpinpin inlet.................................................................... 73 Figure B.6. Circa 1980 satellite image of the southern end of North Stradbroke Island. ................. 74 Figure B.7. 1983 Aerial photograph of Jumpinpin inlet.................................................................... 75 Figure B.8. 1987 Aerial photograph of Jumpinpin inlet.................................................................... 76 Figure B.9. 1993 Aerial photograph of Jumpinpin inlet.................................................................... 77 Figure B.10a. Jumpinpin inlet 1997, looking south at South Stradbroke Island............................... 78 Figure B.10b. Jumpinpin inlet 1997, looking south.......................................................................... 78 Figure B.10c. Jumpinpin inlet throat 1997, looking south. ............................................................... 79 Figure B.10d. Jumpinpin downdrift bank 1997, looking west – evidence of erosion........................ 79
vi
Abstract
Jumpinpin is an example of a tidal inlet, which is periodically reopened by storms and
partially sealed by littoral drift transported by normal wave action. This coastal
engineering investigation shows that shoreline changes at Jumpinpin are cyclical,
resulting from natural coastal processes and not engineered changes at the seaway
some fifteen kilometres updrift. A review of existing information and analysis of aerial
photographs over a 100 year period has revealed two dominant coastal processes. In
the period 1898 to 1936 the inlet was influenced by the process of inlet migration and
spit breaching. Two cycles were completed. After 1936 Jumpinpin began to behave in
a unique and unexpected manner whereby the inlet comprised two channels in
dynamic equilibrium. The northern channel is relatively stable and remains open while
a second smaller channel is periodically breached approximately two kilometres
updrift. This southern channel breaches as a response to storm and flood activity and
is sealed by littoral drift within non-flood years. The presence of the southern channel
plus composition of the downdrift bank (Kalinga Banks) has retarded migration of the
northern channel and prevented its closure.

The evolution of Jumpinpin Inlet
1
1.0 Introduction
1.1 General
This report presents the results of a conceptual coastal engineering study into the
evolution of Jumpinpin. Jumpinpin or “the ‘pin” is a tidal inlet located on the southern
Queensland coast. The inlet is just one of five that exchange water between the
Pacific Ocean and Moreton Bay–Broadwater intracoastal system. Shorelines in the
vicinity of tidal inlets are subject to considerable change, more so than typical
shorelines remote from inlets. Many shorelines undergo little change prior to inlet
breaching, after which change is rapid and significant. When historical records are
examined, it is clear that tidal inlets undergo quite spectacular change over a period
of 100 years. Short-term changes can be no less dramatic.
Jumpinpin opened some time late in the 19th century, breaching over a narrow
section of the then Isle of Stradbroke. The exact date of breaching is unknown due to
the isolation of the site. Since its formation, the inlet and nearby coastline have been
highly dynamic, undergoing rapid and significant changes. The actual sequence of
coastal events goes unrecorded and the changes are little understood. Areas
especially deficient in information are: (1) the geological and early European history
of Jumpinpin; (2) detailed changes to the shoreline configuration since opening;
(3) the coastal processes controlling this change; and (4) the impact these changes
have had, and will have, on the intracoastal system.
Of particular concern is the potential instability of the Gold Coast Seaway. Since
construction of this $100 million trained inlet in 1986, tidal flow rate has increased
around 70%. The result has been severe erosion which, if allowed to continue at its
present rate, may lead to collapse of the trained walls. It is postulated that shoreline
changes at Jumpinpin may be affecting tidal prism capture and thus the rate of flow at
the seaway. This study aims to prove or disprove this theory and hopefully provide
insight into an appropriate management strategy for the seaway.
1.2 Aim
The aim of this study is to produce a preliminary model of coastal processes affecting
Jumpinpin Inlet over the last century. From this a determination can be made as to
the role of Jumpinpin in relation to events at the Gold Coast seaway. It is hoped that
the information proves useful in providing a solid basis for further investigations and
for management of the intra-coastal system.
The evolution of Jumpinpin Inlet
2
1.3 Objectives
The objectives of the study are:
1. To compile a comprehensive historic background for the study site;
2. To determine, by analysis of existing information and aerial photography,
the pattern of change undergone by the Jumpinpin Inlet over the past 100
years;
3. To deduce the controlling processes of change; and
4. To predict, based on these past patterns and processes and the
engineering changes that have been imposed at the seaway, the patterns
of change that may be expected in the future.
1.4 Report structure
The report comprises four parts which reflect the stages of investigation.
Part 1 (Chapters 2–7) is a review of literature pertaining to the subject. The study
begins with an introduction to generic coastal processes that affect southeast
Queensland. This is followed by a description of Jumpinpin’s coastal morphology,
geological history and European history from the first explorers up to the end of the
20th century. The intention is to provide the reader with a thorough background to the
environment of Jumpinpin.
Part 2 (Chapters 8–9) presents an analysis of the data gathered from aerial
photographs and severe weather recordings. This analysis is then used in conjunction
with theory discussed in Part 1 to build a conceptual model of coastal processes.
The conceptual model is presented in Part 3 (Chapters 10–12) and includes
predictions of future shoreline change plus a discussion on the seaway.
A summary of major findings is given in Part 4 (Chapter 13) along with
recommendations for coastal management.

The evolution of Jumpinpin Inlet
3
2.0 Methodology and study limitations
2.1 Methodology
The study covers a time period of 200 years, beginning with Captain Cook’s chart in
1770 and ending in 1993 with a recent aerial photograph. Geological information was
gathered from previous studies (Kelley, 1984; Ward, 1977; Maxwell, 1970). Sources
of historical data include: early charts, voyage journal entries, personal accounts,
historical papers and newspaper articles. Some information is hearsay and all lack
continuity through time.
Aerial photography analysis of the inlet was conducted for the period 1944 to 1993.
Aerial photography provides a preliminary interpretation of littoral processes and
estimates of coastal erosion. Used in conjunction with charts and topographic maps,
they can provide a fairly accurate qualitative estimate of shoreline movement. The
method involved:
1. Obtaining sequential aerial photographs of the region;
2. Measuring points of stable reference in order to adjust aerials to the same
scale (1: 25 000);
3. Analysing aerials for evidence of tidal flow movement, shoreline accretion and
erosion, severe storm events, patterns of change, coastal processes, delta
configuration and coastal morphology; and
4. Overlaying consecutive aerials to obtain a time sequence of shoreline
change, providing information on inlet migration and inlet, channel and delta
configuration over a fifty-year period.
Any previous analysis of aerial photographs in the study area is unknown to the
authors.
Severe weather, cyclone, wind and storm surge data for the region was collected. The
data spans over 100 years and was analysed to determine the most likely time of inlet
breaching, beach destruction and beach accretion.
Finally, information gathered from several authors on coastal processes and from
similar studies conducted elsewhere was used to describe the coastal processes that
are affecting southeast Queensland, and later, to determine specific processes
controlling shoreline changes identified in the aerials.

The evolution of Jumpinpin Inlet
4
2.2 Study limitations
Before using this report the reader should be aware of its limitations, namely the
period of study. Some cyclic coastal changes may take several hundreds of years or
even longer to become evident. As such, the reader must be wary of assuming
patterns of change. Essentially, the study is biased toward short-term effects of
storms.
With regard to aerial analysis, the reference points used to re-scale the aerials were
quite a distance from the inlet. As such, it is conceivable that a relatively large error
could occur. Thus, when quantifying shoreline movement, only very rough
approximations can be achieved. Parallax error adds to the uncertainty of
measurements.

The evolution of Jumpinpin Inlet
5
3.0 Site description The study area is located within the Moreton Bay–Broadwater system on the
subtropical coast of southern Queensland, Australia. Moreton Bay is roughly wedge-
shaped, extending from the Nerang River in the south at latitude 27o56'S to
Pumicestone Passage in the north at latitude 27o6'S. Figure 3.1 is a locality plan of
the study area. Moreton Bay is bordered on the west by the Brisbane coast and to the
east by Moreton and the Stradbroke barrier islands, then the Pacific Ocean. Towards
the south the bay shallows and narrows, becoming a complex of low deltaic islands
and channels.
There are five tidal entrances to the bay. At the northern extremity is Pumicestone
Passage and then the main navigation entrance between Bribie and Moreton islands.
The latter is by far the widest at 6 kilometres. Southward, between Moreton and North
Stradbroke islands is South Passage, then Jumpinpin separating North and South
Stradbroke islands, and finally Southport Bar at the southern extremity. The most
recent and ever-changing of these inlets is Jumpinpin. Figures 3.2 and 3.3 show
Jumpinpin and surrounding islands in increasing detail.

The evolution of Jumpinpin Inlet
6
Figure 3.1. Location map of Moreton Bay (Source: Unknown)

The evolution of Jumpinpin Inlet
7
Figure 3.2. Plan showing Jumpinpin and surrounds (Source: Queensland Transport, June 1986)
Jumpinpin Inlet is classified as microtidal, experiencing a maximum tidal range of
2 metres. Flow velocities are high at around 4.5 knots as recorded by the Department
of Harbours and Marine (Maxwell, 1970). Such high flows are due to the small width
to volume ratio at the entrance. It is believed that the waters of the Albert, Logan,
Pimpama and Coomera rivers and tidal waters of the southern bay drain through the
inlet. As Maxwell (1970) notes, tide flow direction is varied although it appears to be
predominantly from the north.
The prevailing wind over Moreton Bay is the South-East Trade Wind which blows with
remarkable persistence for almost nine months of the year. The wind is responsible
for a predominantly southeast wave pattern. The swell is moderate to high energy
and approaches the coast at an angle. This generates longshore drift of sand in a

The evolution of Jumpinpin Inlet
8
net northerly direction (COPE, 1985). Delft Hydraulics estimate that the net annual
transport of sand with allowance for 50% variation at Southport Bar is large at
500 000 m3 (Polglase, 1987). This figure could reasonably be applied to Jumpinpin.
Figure 3.3. Detailed plan of Jumpinpin Inlet (Source: Queensland Transport, December 1981)
The evolution of Jumpinpin Inlet
9
4.0 Coastal processes An understanding of Jumpinpin requires a generic awareness of the coastal
processes that act upon a coastline and the terminology involved. Coastal processes
are important as they dictate the formation of an inlet and largely govern its
morphology. This chapter presents information on processes that influence southeast
Queensland with special reference to tidal inlets. A glossary of the terms used in this
chapter is provided in Appendix A. The reader is also referred to Figures A.1 and A.2
(Appendix A) as they provide visual definitions of a typical beach profile and the
morphological components of a tidal inlet.
Total changes to the shoreline are the product of both short- and long-term coastal
processes. Short-term changes are due to seasonal variations in wave conditions and
to the occurrence of intermittent storms separated by intervals of low waves. Long-
term changes result from sea-level changes or an overall imbalance between added
and eroded sand.
4.1 Short-term coastal processes
Short-term changes result in accretion and erosion of sand in the order of hundred(s)
of metres per year. Short-term processes have been grouped as follows:
• Beach and bar destruction during storms
• Beach and bar building during fair weather
• Littoral transport and sand trapping
• Inlet migration and spit breaching
• Sand bypassing
• Inlet stability and closure.
4.1.1 Beach and bar destruction – storm phase
During storms, strong winds generate high, steep waves that are shorter in period. In
addition, these winds often create a storm surge which raises the water level and
exposes parts of the beach not usually vulnerable to waves. The storm surge allows
waves to pass over offshore bars without breaking. When the waves finally break, the
remaining width of surf zone is not sufficient to dissipate the increased energy
contained in the storm waves. The remaining energy throws more sand into
suspension, thus eroding the beach, berm and sometimes the dunes.
In severe storms, such as tropical cyclones, the higher water levels resulting from
storm surges allow waves to erode parts of the dune. The Shore Protection Manual
The evolution of Jumpinpin Inlet
10
(SPM, 1984) states that it is not unusual for 18–30 metre dunes to disappear in a few
hours. Some sand is driven across the back beach and over the dunes in the form of
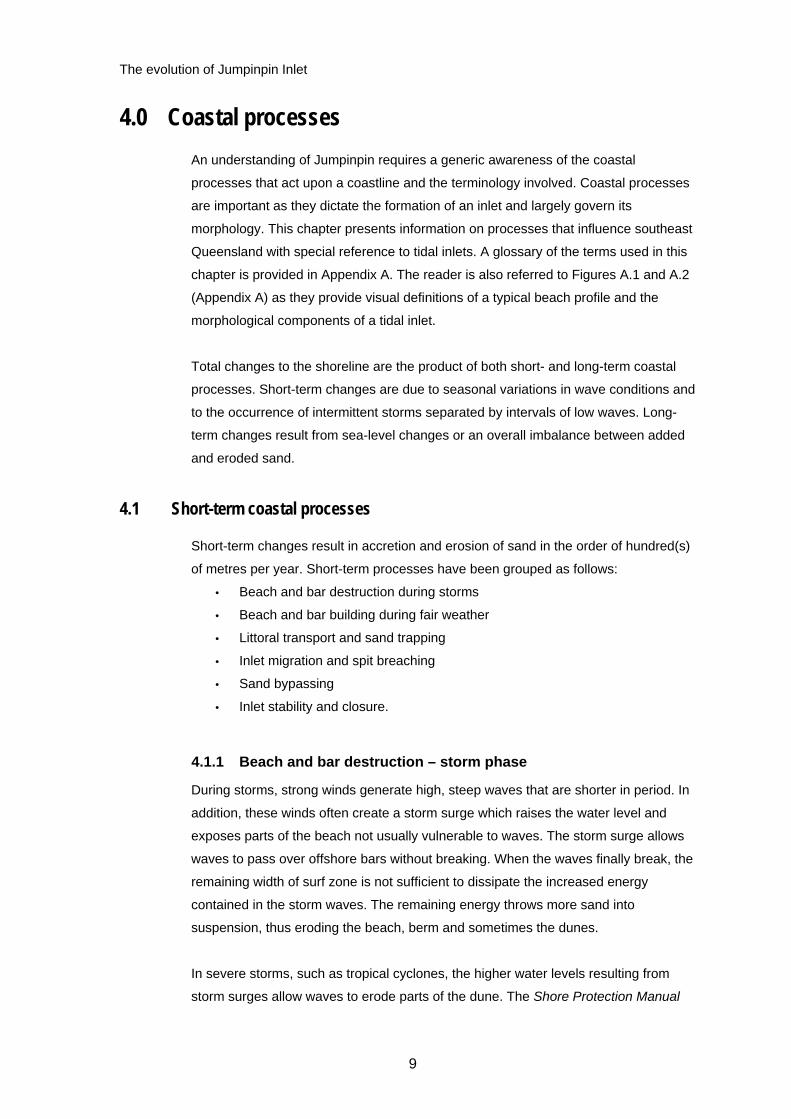
washover fans. Figure 4.1 illustrates storm wave attack on the beach and dune.
The storm surge is especially damaging if it occurs concurrently with high
astronomical tides. At locations where there are low sections of protective dunes, the
storm surge and wave action can succeed in completely overtopping the dunes. The
storm overwash and storm flooding return may erode enough sand to cut a new tidal
inlet through a barrier island. This is the mechanism by which many new inlets are
formed. However, as Hayes (1991) notes, most inlets formed in this way are closed
off by swash-transported and wind-blown sand within weeks of the storm.
Extra tropical cyclones (ETC) can be equally as damaging as tropical cyclones. ETC
have larger areas of gales and storm-forced winds, and generate large swells. They
are generally longer in duration and thus the exaggerated swell has more time to
attack the coast.
Figure 4.1. Schematic diagram of storm wave attack on beach and dune (Source: Shore Protection Manual, 1984)

The evolution of Jumpinpin Inlet
11
Extreme storm events play an important role in not only forming new inlets but also
changing the configuration of existing inlets. In particular, the cross-sectional area of
an inlet channel will increase or decrease during a storm depending on the relative
magnitude of sediment transported into it. Size of the gorge cross-sectional area
directly relates to the stability of an inlet. After a sudden increase or decrease,
provided the area remains above a critical value, the cross-section will return to its
equilibrium flow area. When reduced below the critical value, the inlet will close (Van
De Kreeke, 1985). The concept of inlet stability is discussed in Section 4.1.6.
4.1.2 Beach and bar building – fair weather phase
The short-term cycle of beach and bar building is controlled by the wave regime and
the net circulation pattern driven by it. During fair weather, waves tend to be far
travelled swells of low amplitude and long period. These swells tend to result in
relatively weak nearshore circulation pattern (Stanley & Swift, 1974). The two
mechanisms cooperate to widen the beach berm and beach and to form foredunes
and allow stabilisation by plant colonisation.
These mechanisms also allow the formation of offshore bars and shoals, which act as
natural breakwaters. The bars cause ocean waves to break and expend energy
before reaching the shore, thus sheltering beaches in the lee from erosion.
Irregularities in the offshore shoals, however, can change the direction of incoming
waves through refraction (Kana, 1989). Ironically, by this process wave energy can be
focused on a section of beach, causing rapid erosion.
4.1.3 Littoral transport and sand trapping
Littoral transport is a dynamic feature of the nearshore physical system that affects
beach and inlet configuration. Because most wave energy is dissipated in the littoral
zone, this zone is where changes are most rapid. Littoral transport can be both
onshore–offshore and longshore. On the coast of southeast Queensland the latter is
more dominant and as such is the focus of this section.
Longshore transport results from the stirring up of sediments by obliquely breaking
waves, and the movement of this sediment by both the component of the wave
energy in an alongshore direction and the longshore current generated by the
breaking wave. The direction of transport is directly related to the direction of wave
approach. Thus, due to variability in wave approach, longshore transport direction can
vary from season to season or even day to day. Reversals of transport direction are
not uncommon. What is important is the net direction of drift. The coast of Jumpinpin
is influenced by a remarkably persistent southeasterly wave approach. This

The evolution of Jumpinpin Inlet
12
consistency results in a net northerly littoral transport, the rate of which varies with
wave duration and energy from 0.25 m/s to 0.5 m/s (COPE, 1985).
Inlets may have significant impacts on adjacent shores by interrupting the longshore
transport and trapping onshore–offshore moving sand. During flood tide, sand in the
inlet is carried a short distance into the bay and deposited as middle ground shoals.
The rate at which an inlet traps sand is higher immediately after the inlet opens. The
next ebb tide may return some of this material to the ocean in the form of ebb delta,
but some is always lost from the littoral system toward the downdrift side (SPM, 1984)
(loss in this manner is also considered a long-term change). Starvation of the
downdrift side combined with accretion on the updrift side can cause inlet migration or
even closure in the direction of transport.
4.1.4 Inlet migration and spit breaching
Normal spit accretion on the updrift side of a littoral drift tidal inlet (the recurved spit)
commonly induces longshore migration of the inlet mouth. As the updrift spit grows
the inlet narrows and current velocity in the throat increases. The opposite shore
preferentially scours to maintain the channel cross-sectional area. Spit growth and
downdrift bank retreat produces a net migration of the inlet in the direction of littoral
transport. The composition of the channel banks is an important parameter in inlet
migration. If the inlet becomes entrenched in resistant sediments further migration
may be impeded (FitzGerald et al., 1978).
Eventually, inlets may become overextended and recruit a new, more direct course to
the sea across the spit. In most circumstance the new inlet provides a more efficient
exchange with the ocean and will remain open, while the older, less efficient inlet
closes. The new inlet throat commences migration and the cycle begins again.
Spit breaching is facilitated when erosion has lowered and/or narrowed the barrier.
The end product of this process is bypassing of large quantities of sand from the
updrift side of the inlet to the downdrift shoreline.
4.1.5 Sand bypassing
Loss of sand to the system can be naturally or artificially prevented by the process of
sand bypassing. Natural inlets such as Jumpinpin have a well defined bar formation
on the seaward side. A part of the sediment transported alongshore moves across the
inlet mouth by way of this bar. Four methods of natural sand bypassing are: (i) ebb
delta breaching and bar migration; (ii) spit breaching; (iii) stable inlet processes; and
(iv) tidal current bypassing.
The evolution of Jumpinpin Inlet
13
(i) Ebb delta breaching and bar migration Longshore littoral drift causes an accumulation of sand on the updrift side of the ebb
delta which results in deflection of the main ebb channel toward the direction of drift.
Migration of the ebb channel may continue until it impinges on the downdrift shoreline,
where it erodes the adjacent beach. As the channel lengthens it becomes increasingly
hydraulically inefficient, and the channel will breach a more direct route across the
ebb delta. Once the breach is complete, most water entering and leaving the inlet will
flow through the new channel. The result is consumption of sediment by infilling of the
old channel and bypassing of a large portion of the ebb delta sand bodies by
formation and migration of offshore bars. The process can occur rapidly during a
single storm, or more gradually over 6 to 12 months (FitzGerald, 1988).
However, the bypassing quality of the process of ebb delta breaching is challenged.
Evidence exists to show ebb delta breaching causing downdrift erosion. For example,
the shoreline downdrift of North Edisto Inlet, South Carolina retreated around 1.5 km
over a period of several decades as a result of sand being trapped on the updrift side
of the ebb tidal delta. This resulted from a shift in the main ebb channel of about 1 km
in the updrift direction (Hayes, 1991).
(ii) Spit breaching As mentioned in Section 4.1.4, the end product of spit breaching is the bypassing of
large quantities of sand from the updrift side of the inlet to the downdrift shoreline.
Large volumes of sand are stored in recurved spits and upon spit breaching a new
inlet is located updrift of the old inlet. If the old inlet closes, the sand body between
the two is effectively relocated to the downdrift side.
(iii) Stable inlet processes Sand bypassing at stable inlets occurs through the formation, landward migration and
welding of large bar complexes to the downdrift shoreline (FitzGerald, 1988).
Development of bar complexes results from the stacking and coalescing of wave-built
swash bars on the ebb delta. Waves breaking on the ebb delta augment flood-tidal
flow but retard ebb flow, thus there exists a net landward movement across the swash
platform. The swash bars move onshore due to this dominance of landward flow.
(iv) Tidal current bypassing Tidal current bypassing occurs when flood currents deposit material in the inlet to be
pushed out again by ebb currents. If the material delivered back to the ocean is jetted
far enough out it may be lost from the shore or it may be transferred to the downdrift
side by longshore processes (Bruun & Gerritsen, 1960).

The evolution of Jumpinpin Inlet
14
4.1.6 Inlet stability and closure
Some inlets are comparatively permanent features being maintained by tidal
exchange supplemented by storm generated currents, whereas other inlets tend to
close. The tendency toward closure is related to the ratio between littoral drift and
tidal flow bypassing of sand past the inlet (Stanley & Swift, 1974). When, as the result
of a storm the cross-sectional area of an inlet is reduced below a certain value, the
tidal currents could become too small to flush the sediment coming into the inlet by
the longshore current. Longshore processes will dominate over tidal flow and the inlet
will close. The importance of inlet width has been explored by Van De Kreeke (1985;
1990a,b) and is described in terms of stability analysis and closure curves.
Stability of single inlets deals with the equilibrium between gorge cross-sectional area
and inlet hydrodynamics. From Van De Kreeke (1990a), the parameters of stability
are actual tidal maximum of the bottom shear stress and the equilibrium shear stress.
The equilibrium shear stress is defined as the bottom stress induced by tidal currents
that is required to flush sediments carried into the inlet by longshore currents.
When actual shear stress equals the equilibrium shear stress, the inlet is in
equilibrium with the hydraulic environment. If the actual shear stress becomes larger,
the inlet goes into scouring mode. If equilibrium shear stress is larger the inlet is in
shoaling mode. The equilibrium is considered stable if, after changes such as storms,
the inlet cross-sectional area unconditionally returns to its equilibrium value.
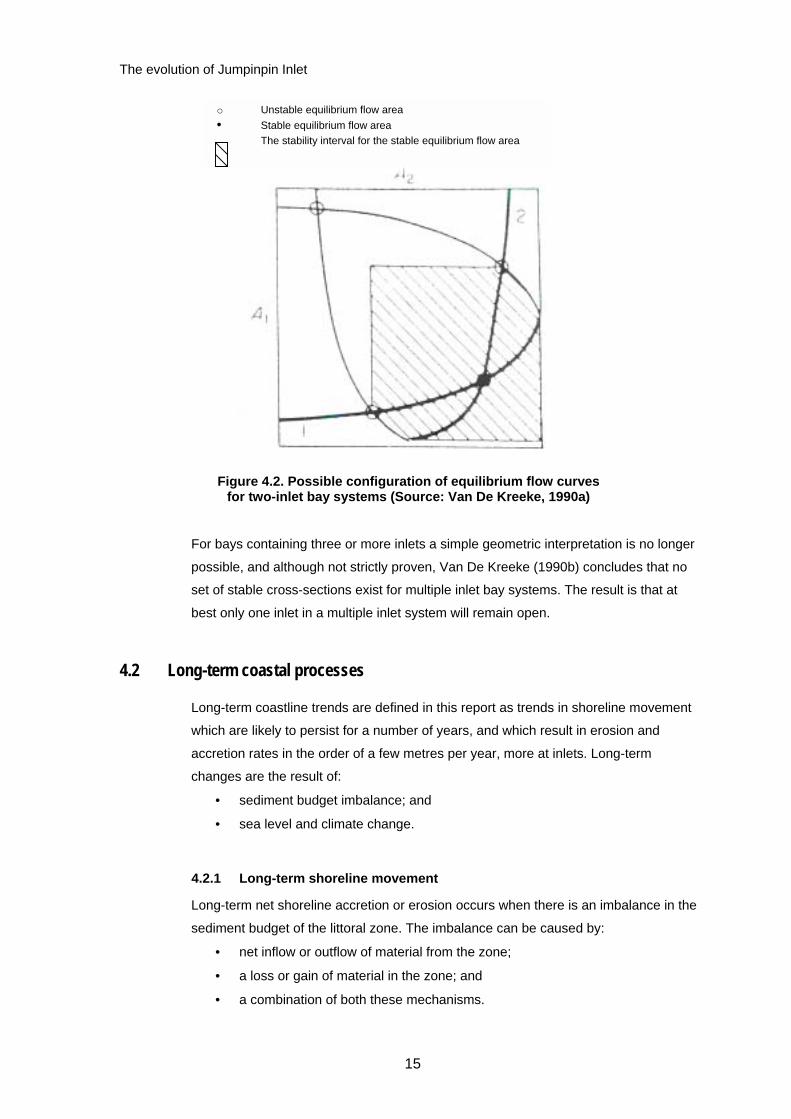
For two-inlet bay systems Van De Kreeke (1990a) provides a possible configuration
for equilibrium flow curves (see Figure 4.2). The open and closed circles imply four
sets of values for which both inlets have cross-sectional areas that are in equilibrium
with the hydraulic environment. Results of a stability analysis on a two-inlet bay
system conducted by Van De Kreeke (1985) showed that at best two sets of
equilibrium flow area can exist. Based on these results, a set of stable cross-sectional
areas cannot exist and ultimately one or both the inlets will close.
The evolution of Jumpinpin Inlet
15
Figure 4.2. Possible configuration of equilibrium flow curves for two-inlet bay systems (Source: Van De Kreeke, 1990a)
For bays containing three or more inlets a simple geometric interpretation is no longer
possible, and although not strictly proven, Van De Kreeke (1990b) concludes that no
set of stable cross-sections exist for multiple inlet bay systems. The result is that at
best only one inlet in a multiple inlet system will remain open.
4.2 Long-term coastal processes
Long-term coastline trends are defined in this report as trends in shoreline movement
which are likely to persist for a number of years, and which result in erosion and
accretion rates in the order of a few metres per year, more at inlets. Long-term
changes are the result of:
• sediment budget imbalance; and
• sea level and climate change.
4.2.1 Long-term shoreline movement
Long-term net shoreline accretion or erosion occurs when there is an imbalance in the
sediment budget of the littoral zone. The imbalance can be caused by:
• net inflow or outflow of material from the zone;
• a loss or gain of material in the zone; and
• a combination of both these mechanisms.
o Unstable equilibrium flow area • Stable equilibrium flow area
The stability interval for the stable equilibrium flow area

The evolution of Jumpinpin Inlet
16
The extent of sediment budget imbalance can be assessed by considering sources
and sinks of sediment and movement of sediment along the coast.
The major original source of sand along the southeast Queensland coast is material
released from old back-beach dune and barrier deposits that were laid down in New
South Wales during previous geological epochs (Gordon, 1987). Supply of this
material largely ceased many thousands of years ago. Present-day coastal processes
rely on sediment sources such as deltas and shoals in the littoral zone that already
exist in the system. The volume of sediment moved from one coastal compartment to
the next is a product of both the driving mechanisms and availability of these sand
sources.
The two major sink mechanisms are offshore losses and onshore losses. Offshore
loss results from current/wave interaction which under particular conditions may
cause movement of nearshore sediments to deep water from which they cannot be
readily returned (for example, the loss of sand from an inlet to deep water due to a
flood event). Onshore sinks involve landward movement of sediment due to wind,
waves and currents into areas from which sediments can only be released by
intervention, such as dredging. Examples of onshore sinks are trapping of sand by
vegetation causing landward dune movement, sediment movement into an inlet and
sand topdressing of back beach due to overwash.
Total long-term shoreline migration is a complicated relationship between the location
and extent of sand sources and sinks and the mechanisms driving movement along
the coast.
4.2.2 Sea level and climate change
The worldwide trend toward an increase in sea level due to greenhouse effects may
result in sea level rise of between 0.2 and 1.4 metres in the next 30 to 50 years
(Gordon, 1987). This could translate into a long-term shoreline recession.
A second issue related to the greenhouse effect is climate change associated with the
shift of weather patterns. Although not fully understood, climate change is predicted to
include movement of cyclones further south than previously. The combined effect of
sea-level rise and cyclones could result in shoreline retreat and inlet instability.
The evolution of Jumpinpin Inlet
17
5.0 Inlet morphology Coastal morphology refers to the physical form of the coast. This chapter discusses
the rather unique morphology of Jumpinpin Inlet.
The coastal morphology of an area is the product of both evolutionary processes
within a geological time scale and the present-day averaged response of beach
systems to the interactive forces of wind, waves and currents. Evolutionary processes
are described in Chapter 6. They are responsible for the coast-wide distribution of
sediments, the formation of barrier deposits, location and size of headlands and thus
overall coastal configuration. Present-day processes determine morphological factors
such as beach and inlet geometry, inlet size, redistribution of sediments in delta and
bar formations, sedimentary units and trends in change in shoreline location.
5.1 Inlet origin
Inlets can be described on the basis of their origin. Bruun and Gerritsen (1960)
define three main groups of inlets: (1) those with geological origin; (2) those with a
hydrological origin; and (3) those with a littoral drift origin.
Inlets with geological background have rocky gorges and do not follow the laws for
tidal inlets in alluvial material. Inlets with a predominantly hydrological origin are
formed where rivers enter the sea. Most inlets on sea coasts, including Jumpinpin,
have a littoral drift origin. It is difficult to indicate a single explanation for why littoral
drift inlets came into existence, but in the case of Jumpinpin and many other inlets,
they result from breakthroughs.
5.2 Inlet classification
Most littoral drift inlets are scoured in granular material and as a result their
morphology is subject to continuous change. FitzGerald et al. (1978) classify inlets
into three categories based on the processes of change by which they are most
influenced. The categories are: (1) migrating inlets;( 2) stable inlets; and (3) inlets
whose main ebb-channels breach new positions through the ebb-tidal delta. These
categories have been adopted here to help describe the unique morphology of
Jumpinpin.
Jumpinpin lies on a high-energy littoral drift coast typical of the Australian east coast.
COPE (1985) data presented in Appendix E shows the mean direction of drift is
northerly. The inlet is cut through a sandy barrier island into a large bay system.

The evolution of Jumpinpin Inlet
18
Based on this, a preliminary study of the inlet would immediately suggest a migrating
inlet. In fact, Jumpinpin tries very hard to migrate, with repeated growth of an updrift
recurved spit. However, scouring of the downdrift bank is small and the throat remains
relatively stable. The spit periodically breaches and protrudes to roughly the same
position.
The inlet cannot quite be classified as stable either. Stable inlets are defined by
FitzGerald (1988) as having stable inlet throat position and a main ebb channel that
does not migrate. Though small, the inlet throat is seen to migrate over the study
period and the main ebb channel shifts position. Furthermore, analysis of aerial
photographs shows that a second channel is periodically breached updrift of the main
one creating unstable conditions in the system (behaviour of this channel is discussed
in greater detail in Chapters 8 and 10).
The third classification is inlets that bypass sand through the process of ebb-tidal
delta breaching. By definition these inlets have a stable inlet throat position but their
main ebb channel migrates. Again, Jumpinpin exhibits characteristics of this
classification. The 1993 aerial photograph (Appendix B, Figure B.9) clearly shows the
main ebb channel in the process of ebb delta breaching. The fact that Jumpinpin can
be described in terms of all three classifications adds to its unique morphology.
An alternate method of classifying tidal inlet morphology has been presented by
Nummedal (1983) and is based on tidal range and wave dominance. The
classifications are as follows:
• Microtidal (tidal range < 2 m), wave-dominated coast;
• Mesotidal (tidal range 2–4 m), mixed tide/wave-dominated; and
• Macrotidal (tidal range > 4 m), tide-dominated coast.
Jumpinpin falls into the microtidal wave dominated category.
5.3 Inlet geometry
The geometry or pattern of sand storage of coastal inlets depends on the relative
strengths of the inlet jet, the wave-driven littoral drift and the tidal and wave-driven
components of the shelf flow field (Stanley & Swift, 1974). From detailed study of
inlets through barrier islands in the United States, the pattern of sand storage at tidal
inlets tends toward one of three basic patterns: overlap, symmetrical or offset inlets
(Stanley & Swift, 1974), as shown in Figure 5.1.

The evolution of Jumpinpin Inlet
19
Figure 5.1. The four shapes of barrier island inlets (Source: SPM, 1984)
Jumpinpin is seen to exhibit characteristics of a slight to negligible downdrift offset
which would result from equal wave approach on both sides (SPM, 1984). Yet, where
moderate gross rates of littoral drift are associated with a strong rate of net drift, as is
the case at Jumpinpin (C.O.P.E, 1985), the situation favours an updrift offset. The
lack of such an offset must be due to local processes which this study aims to identify.
5.4 Channel size and delta formations
The main channel at Jumpinpin had a width of around 775 metres at its widest
point in 1993. The throat at this time was about 1.5 km long and discharged in a
northeasterly direction. When newly breached, the smaller channel (to the south
of the main channel) averaged a width and throat length of 900 and 1500 metres,
respectively.
On microtidal, wave-dominated coasts, Hayes (1991) has found that inlets are widely
spaced and have large flood-tidal deltas. Much like a river delta, tidal deltas are
simply deposits of sediment that have been flushed into or out of an inlet (Kana,
1989). A tidal delta comprises a network of sand shoals and channels constantly
undergoing change. The inlets of Moreton Bay are widely spaced; however, there
is a distinct lack of flood delta formation at Jumpinpin. This may indicate either:
The evolution of Jumpinpin Inlet
20
(a) domination of tidal flow outward of the inlet, sufficient to counteract wave-induced
onshore sediment movement; and/or (b) that efficient natural sand bypassing is
occurring.
The ebb-tidal delta at Jumpinpin is offset, protruding farther seaward on the downdrift
side than the updrift side of the inlet. Along wave-dominated coasts the longshore
currents dominate the sediment dispersal pattern. Consequently, the barrier islands
flanking Jumpinpin have become long and continuous while the ebb delta remains
small because of rapid dispersal of its sediment by waves.
Three major forms of sediment accumulation are associated with the ebb-tidal delta at
Jumpinpin: (1) Asymmetrical swash bars oriented landward and forming a broken
semicircle around the perimeter of the delta; (2) channel margin linear sand bars that
trend perpendicular to shore and parallel to the main channel; and (3) a subaqueous
terminal lobe deposited seaward of the main channel ebb currents. These
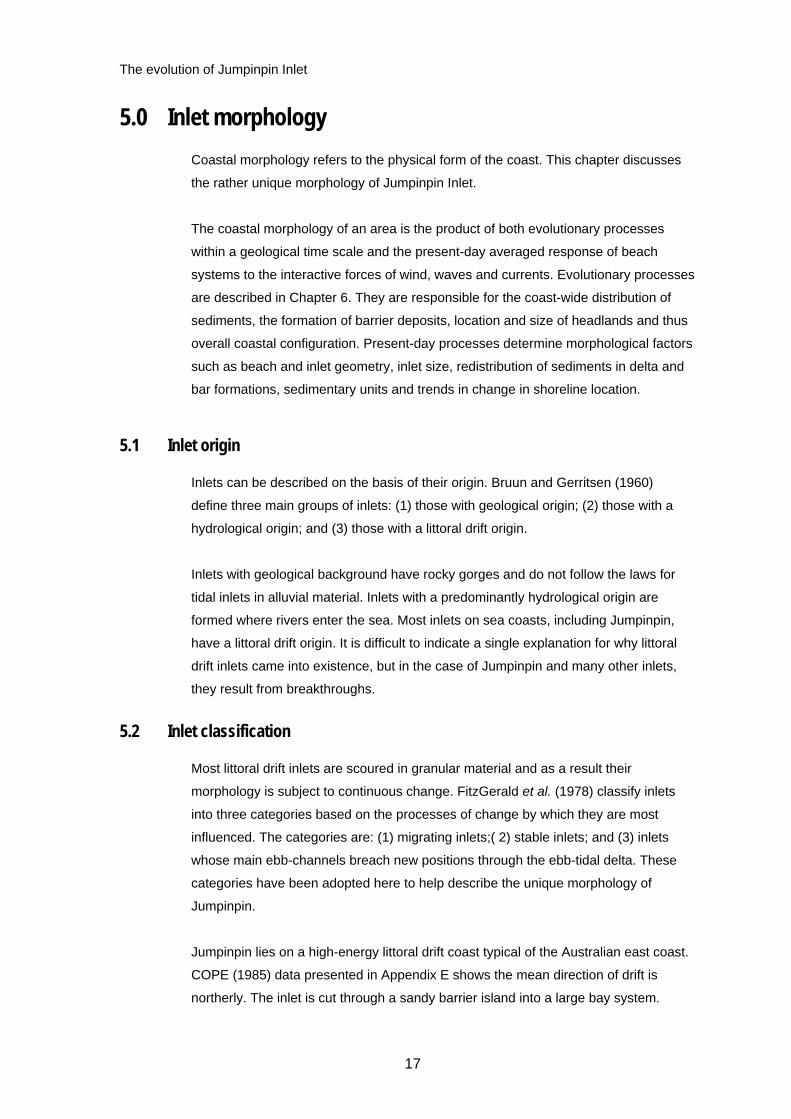
characteristics are shown in the diagram below (Figure 5.2) and are best seen in the
1965 aerial photograph (see Appendix B, Figure B.3).
Figure 5.2. Typical ebb-tidal delta morphology (Source: Adapted from Hayes, 1991)
A common feature of ebb-tidal deltas shown in the 1965 aerial is the segregation of
ebb and flood flow. The primary channel at Jumpinpin has a main channel oriented
perpendicular to the shoreline which carries a large portion of the ebb flow. The flood
flow tends to be distributed as a sheet, with a number of flood channels. These
channels hug both beaches.

The evolution of Jumpinpin Inlet
21
5.5 Sedimentary units
In Stephens’ (1982) work on surficial sediment in southern Queensland, three main
sediment units in the vicinity of Jumpinpin were recognised. They are: (1) nearshore
sands comprising of inner nearshore and outer nearshore sand; (2) inner shelf sand;
and (3) mid-shelf sand. The nearshore sands form the marine part of the active
coastal system and are thought to have formed by modern processes of wave
transport, corresponding with a littoral drift origin for the inlet.
The evolution of Jumpinpin Inlet
22
6.0 Geological history The land forms of Jumpinpin were developed at several stages throughout the
Quaternary period as a result of sea level changes. This chapter discusses the
geologic and geomorphic history of the area. For simplicity the study area has been
categorised into four sections: (1) North Stradbroke Island; (2) South Stradbroke
Island; (3) Jumpinpin; and (4) Bay islands.
6.1 North Stradbroke Island
North Stradbroke Island is described by Kelley and Baker (1984) as a dune-island
barrier that consists largely of transgressive parabolic dunes. That is to say the
island’s origin was not controlled by the marine environment, as a barrier island is, but
rather by aeolian processes. Observation from aerial photography shows the dune
system to be aligned about a northwesterly axis away from the present coastline,
indicating a relationship between dune building and the ancient southeasterly wind.
The fact that quartz sands extend beneath sea level (Kelley, 1984) suggests these
windblown dunes are associated with times of lower sea level. Ward (1977) links
periods of dune building with glacial ages. Ward believes the islands (North
Stradbroke, Moreton and Fraser) were formed when the coastline was far out on the
present continental shelf. Sands were moved by the ancient southeasterly winds from
the coast as it was then.
By the time wind activity ceased, the sea had risen to the position of today’s shore.
Subsequent interglacial ages forced the sea to rise around the sand masses, forming
these islands. Technically, North Stradbroke is not a barrier island but rather the
result of drowned coastal ridges.
Bird (1973) echoes Ward’s theory of North Stradbroke’s genesis. Bird (1973) admits
the possibility of bar emergence as the form of genesis, but is doubtful this is the
case. He believes, rather, that the islands were developed by breaching of spits or
partial submergence of coastal ridges during sea level rise. Bird (1973 p. 420) states:
“the islands represent a long-term accumulation of quartzose sand that has been
carried northward along the east coast of Australia from deposits delivered to the
coast by the rivers of Northern New South Wales.”

The evolution of Jumpinpin Inlet
23
6.2 South Stradbroke Island
South Stradbroke is a long and narrow true barrier island which encloses southern
Moreton Bay. Unlike North Stradbroke, it is wholly a Holocene feature composed of
vegetated beach ridges with a height of no greater than several metres above sea
level (Kelley & Baker, 1984). It is believed South Stradbroke migrated westward
across the middle and centre continental shelf during the post glacial sea level rise
(Baker, 1984), settling roughly in its current position around 6500 years before
present (BP) (Kelley & Baker, 1984). It is believed that the island moved slightly
eastward during the late Holocene period when sand supply was copiously available.
6.3 Jumpinpin
Kelley and Baker (1984) found that throughout the Pleistocene and late Holocene
periods, tidal inlets have been active at Jumpinpin. Evidence of this is found in the
work of Stephens (1982). Sampling and echo-sounding in Jumpinpin showed that
nearshore sands extend offshore to greater than normal depths. This would result
from large scale seaward flows which could only be explained by flows generated
when an inlet breaks through. This implies periodic closure and catastrophic break-
through at Jumpinpin.
From 6000 to 4000 years BP there is evidence suggesting Jumpinpin remained open.
During this time, good circulation in the bay supported extensive coral growth which
halted about 4000 BP when the sea fell back to its present level (Kelley & Baker,
1984). This regression in the sea level sealed Jumpinpin inlet and allowed the
development of the low deltaic islands. The new hydrodynamic regime established
from the closure of this ancestral inlet caused migration of the Bay channels and
erosion of the Islands from the west (Kelley & Baker, 1984). It is believed the next
breach was not until the late 1800s by which time erosion had significantly narrowed
the Islands.
6.4 Bay islands
The deltaic islands to the west of Jumpinpin are probably the alluvial remnants of the
older coastal plain (Maxwell, 1970). These islands colonised mid-Holocene flood-tidal
delta shoals that were formed when the inlet was active. Field observation by the
Gold Coast City Council (Frank Goetsch, surveyor, pers. comm., 1997) has found
Kalinga banks are comprised of indurated sand or coffee rock which indicates
consolidation of the sandy islands. If a similar soil profile can be attached to the other
islands in the area it would be reasonable to assume the lower bay Islands have
remained relatively stable from 4000 years BP up until a new hydraulic regime was
initiated with the next inlet breach.
The evolution of Jumpinpin Inlet
24
7.0 European history Before European influence, the island of Stradbroke was known by the Indigenous
people as Minjirimba. Jumpinpin was given its title by the local Indigenous tribes but is
sometimes referred to as Tuleen. The true meaning of Jumpinpin is uncertain.
Thomas Welsby, a lover of Moreton Bay and friend to the Indigenous peoples,
believed Jumpinpin to mean “big fellow wave” (Welsby, 1921). A Telegraph article
dated June 1973 claims Jumpinpin to mean “the sweetened root of the wynnum tree,
for the area of Jumpinpin was once a meeting ground for tribes to feast on the roots”
(Telegraph, 1973). The island was later named “The Isle of Stradbroke” in 1827 by
Governor Darling. This was in honour of Captain Rous, the second son of the Earl of
Stradbroke, who was then visiting the colony (Salter, 1985).
At some time in the late 1800s the isle was divided into two islands by a breach at
Jumpinpin. The date of breakthrough is uncertain, mostly due to the fact that the area
is unpopulated and in the 1800s was only frequented by the occasional fishing vessel.
The knowledge of the crews on board these vessels goes unrecorded. It is also
uncertain if this was the first time the sea ‘recently’ broke through at Jumpinpin or
even if indeed the last. Some evidence has been found implying that Jumpinpin was
closed by 1917 and reopened again in 1936.
This chapter aims to reduce some of the ambiguity surrounding the history of
Jumpinpin.
7.1 Early history
Welsby (in Thomson, 1967b) wrote that on 16 May 1770, Captain Cook sailed past
Point Lookout on Stradbroke Island and named the point but not the island. The chart
accompanying his voyages (Figure 7.1) shows no islands along the coast, and from
his journal and diaries it is quite easy to perceive that Cook did not know of the
present-day Islands (Moreton and Stradbroke), implying that the south channel did
not exist. Furthermore, Cook was unaware of the opening at Southport, if in fact it
existed at that time.
The evolution of Jumpinpin Inlet
25
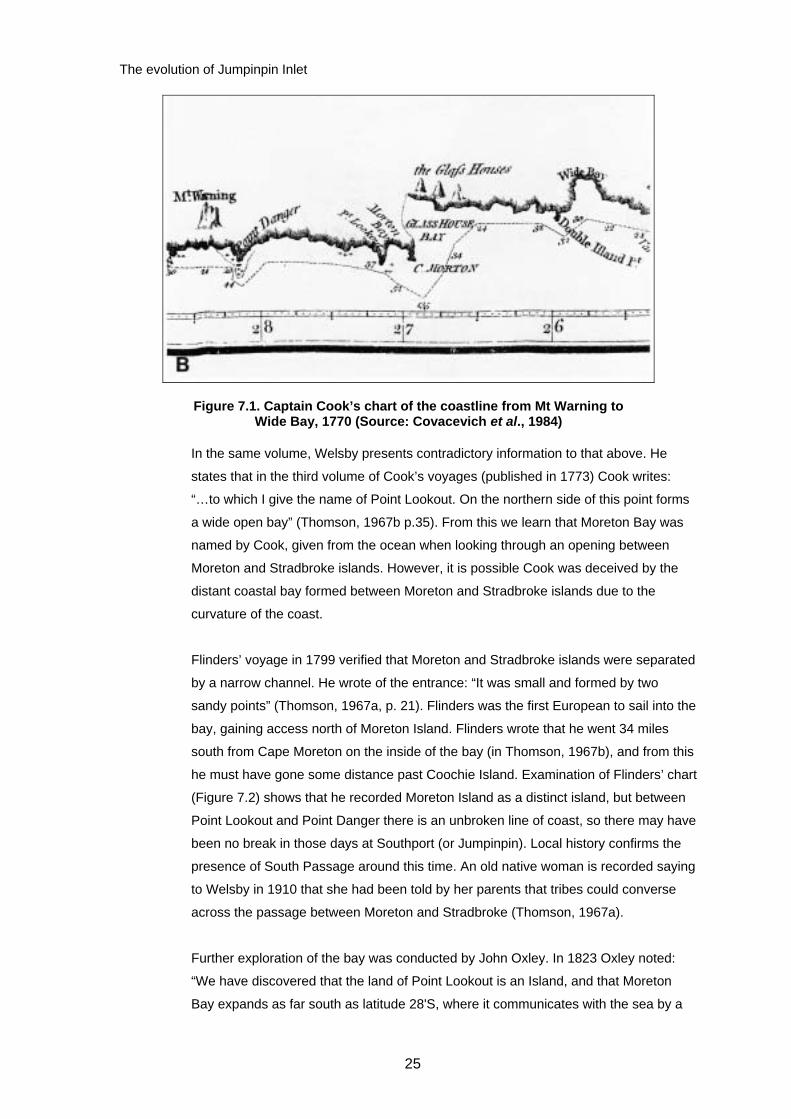
Figure 7.1. Captain Cook’s chart of the coastline from Mt Warning to Wide Bay, 1770 (Source: Covacevich et al., 1984)
In the same volume, Welsby presents contradictory information to that above. He
states that in the third volume of Cook’s voyages (published in 1773) Cook writes:
“…to which I give the name of Point Lookout. On the northern side of this point forms
a wide open bay” (Thomson, 1967b p.35). From this we learn that Moreton Bay was
named by Cook, given from the ocean when looking through an opening between
Moreton and Stradbroke islands. However, it is possible Cook was deceived by the
distant coastal bay formed between Moreton and Stradbroke islands due to the
curvature of the coast.
Flinders’ voyage in 1799 verified that Moreton and Stradbroke islands were separated
by a narrow channel. He wrote of the entrance: “It was small and formed by two
sandy points” (Thomson, 1967a, p. 21). Flinders was the first European to sail into the
bay, gaining access north of Moreton Island. Flinders wrote that he went 34 miles
south from Cape Moreton on the inside of the bay (in Thomson, 1967b), and from this
he must have gone some distance past Coochie Island. Examination of Flinders’ chart
(Figure 7.2) shows that he recorded Moreton Island as a distinct island, but between
Point Lookout and Point Danger there is an unbroken line of coast, so there may have
been no break in those days at Southport (or Jumpinpin). Local history confirms the
presence of South Passage around this time. An old native woman is recorded saying
to Welsby in 1910 that she had been told by her parents that tribes could converse
across the passage between Moreton and Stradbroke (Thomson, 1967a).
Further exploration of the bay was conducted by John Oxley. In 1823 Oxley noted:
“We have discovered that the land of Point Lookout is an Island, and that Moreton
Bay expands as far south as latitude 28'S, where it communicates with the sea by a
The evolution of Jumpinpin Inlet
26
shoal channel through a sandy beach navigable by boats” (Salter, 1985 p. 3). This
latitude corresponds with slightly south of the present-day Southport entrance, giving
the first evidence of an inlet at Southport. Figure 7.3 shows Oxley’s chart.
The last know map to be drawn prior to breaching was developed in circa 1890 by
the Oyster Fisheries (Figure 7.4). Ironically, the plan shows the narrow spit joining
North and South Stradbroke Islands as a reserve for recreation. From this map,
pre-breakthrough conditions can be observed. The main channel of 1890 flowed
west and south of Kangaroo Island, curving south past Woogoompah Island and into
the broadwater. Today, this channel is less dominant with larger quantities of flow
moving in Canaipa Passage. In 1890 the majority of tidal water entered the northern
inlets of the bay on the flood tide, and prior to the breaching at Jumpinpin in 1896, the
entire outflow was through the mouth of the Nerang River (Beckmann, 1975).

The evolution of Jumpinpin Inlet
27
Figure 7.2. Matthew Flinders’ chart of Moreton Bay, 1799 (Source: Covacevich et al., 1984)

The evolution of Jumpinpin Inlet
28
Figure 7.3. Oxley’s plan of Moreton Bay, 1825 (Source: Thomson, 1967b)

The evolution of Jumpinpin Inlet
29
Figure 7.4. Oyster Fisheries map of Jumpinpin, circa 1890
(Source: Covacevich et al., 1984)
North Stradbroke Island
South Stradbroke Island
The evolution of Jumpinpin Inlet
30
7.2 Post 1890s
Throughout the 1890s the coast of the Isle of Stradbroke was affected by a number of
severe storm events (1890, 1893, 1894, 1896, 1897 and 1898). During the storms of
1894 the sailing ship Cambus Wallace came to grief 200 metres off the coast at
Jumpinpin. Among other things, the ship was carrying a cargo of dynamite which was
later detonated on the beach (Thomson, 1967a). Welsby wrote of the Cambus
Wallace: “On Sunday, 2nd of September, 1894, when Stradbroke Island was
unbroken at Swan Bay, the “Cambus Wallace” was wrecked on the ocean side of
what is known as Jumping Pin, now gone, but at the time one of the narrowest parts
of Stradbroke” (Thomson, 1967a, p. 365). There was a large quantity of dynamite
aboard. “For a week or more heaps of cases [of dynamite] were piled together and
destroyed by electricity that not only left gaping wounds in the sandy beach, but
echoed and re-echoed for miles” (Thomson, 1967a, pp. 371–372).
An account by Archibald Meston (reported in Salter, 1985, p. 4) shows the Isle was
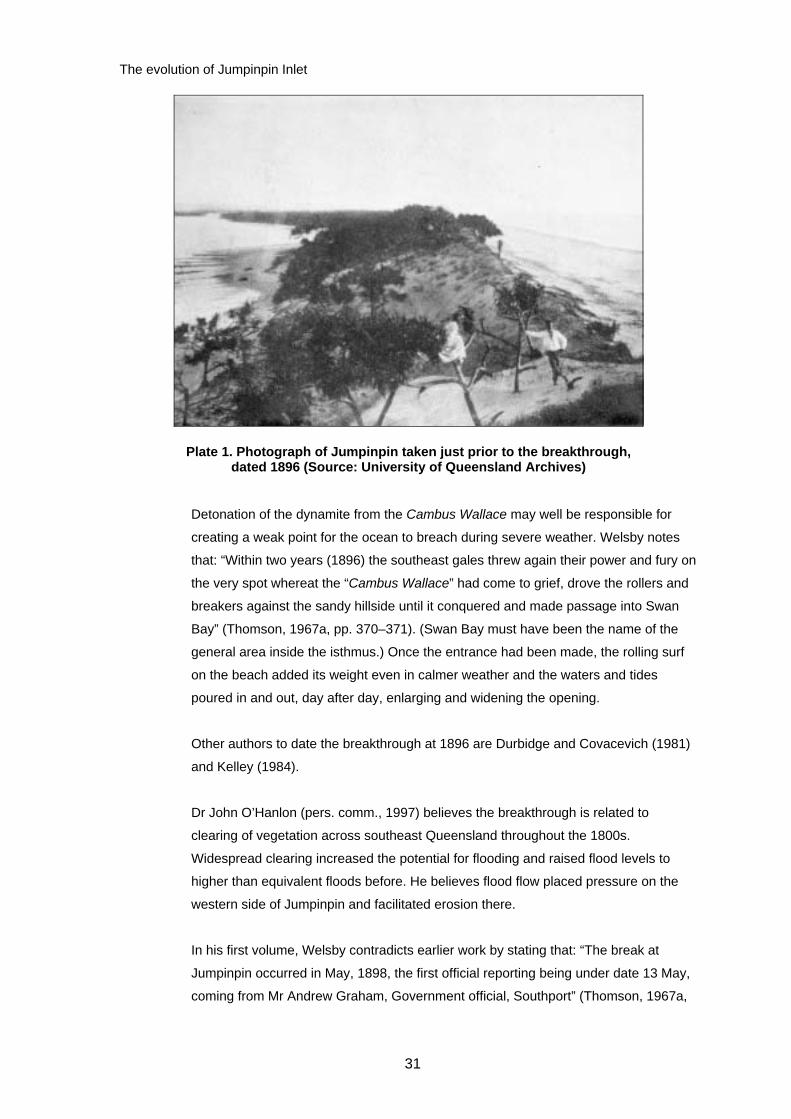
still intact a year later. Meston described the island in 1895 as: “35 miles long and
varies greatly in width, pinching near the centre of Swan Bay to a quarter of a mile
thence to the south it resembles a giant ichthyosaurus—the tail ending where Nerang
Creek enters the sea”. However, the isthmus was rapidly narrowing. Welsby observed
that the erosion of Stradbroke on the eastern shore was taking place rapidly
(Thomson, 1967a). In 1921 in a letter to the Brisbane Courier Mail, Welsby
reminisced that a fortnight prior to the break “a strong cricketer could have thrown a
ball from the bay over to the outside sandy beach” (Welsby, 1921). Plate 1 shows
how narrow the isthmus had been in 1896.
An interesting piece of local history was provided by Mr Greg Litherland, a local
fisherman. Mr Litherland (pers. comm., 1997) recalls being told that the first teacher at
Amity Point arrived from Southport by horse and dray. The teacher and his family
caught a boat to Currigee then travelled by horse and dray all the way along the
beach to Point Lookout then Amity. This would have been in the late 1800s.
The evolution of Jumpinpin Inlet
31
Plate 1. Photograph of Jumpinpin taken just prior to the breakthrough, dated 1896 (Source: University of Queensland Archives)
Detonation of the dynamite from the Cambus Wallace may well be responsible for
creating a weak point for the ocean to breach during severe weather. Welsby notes
that: “Within two years (1896) the southeast gales threw again their power and fury on
the very spot whereat the “Cambus Wallace” had come to grief, drove the rollers and
breakers against the sandy hillside until it conquered and made passage into Swan
Bay” (Thomson, 1967a, pp. 370–371). (Swan Bay must have been the name of the
general area inside the isthmus.) Once the entrance had been made, the rolling surf
on the beach added its weight even in calmer weather and the waters and tides
poured in and out, day after day, enlarging and widening the opening.
Other authors to date the breakthrough at 1896 are Durbidge and Covacevich (1981)
and Kelley (1984).
Dr John O’Hanlon (pers. comm., 1997) believes the breakthrough is related to
clearing of vegetation across southeast Queensland throughout the 1800s.
Widespread clearing increased the potential for flooding and raised flood levels to
higher than equivalent floods before. He believes flood flow placed pressure on the
western side of Jumpinpin and facilitated erosion there.
In his first volume, Welsby contradicts earlier work by stating that: “The break at
Jumpinpin occurred in May, 1898, the first official reporting being under date 13 May,
coming from Mr Andrew Graham, Government official, Southport” (Thomson, 1967a,
The evolution of Jumpinpin Inlet
32
p. 22). This is confirmed in a Courier Mail article dated 18 May, 1898 which reads:
“During the recent gales which were experienced off the coast between Cape
Moreton and Sydney, considerable changes were effected. A channel has been cut
right through Stradbroke Island at Jumpinpin, a place about one mile south of Swan
Bay. The break is about 700 yards wide”. Salter (1985, p. 2) endorses this date by
saying: “This opening did not appear until 1898. Prior to this, Stradbroke had been
one long island with a narrow sand isthmus at this point”.
In a paper read to the Historical Society of Queensland in 1934, Mr W.E. Hanlon
wrote of witnessing this breakthrough. Sadly Mr Hanlon did not indicate the date of
this event. He said: “The ever-encroaching seas seemed to melt the sand, with
standing scrub on it, as though it were sugar—large areas collapsing in one sweeping
surge” (Hanlon, 1935, p. 226). Mr Hanlon added that the actual incidence of the break
was a result of a continuance of heavy gales banking up a mountainous sea,
culminating on the top of a king tide, and from a difference in levels of the ocean and
bay water. The gale first drove a small trickle of water across the dividing neck, and
this was quickly and incessantly followed by others, each widening the gap (Hanlon,
1935). Hanlon (1935 p. 226) goes on to describe that “the waters pouring down the
precipitous inner bank in a cataract soon made a channel for the sea to cascade into
the bay, and once started, nothing could retard its destructive process”. Mr Hanlon is
the only known witness to this breach.
Mr Hanlon believes that as a result of the 1890s breakthrough the southern channels
silted up (Hanlon, 1935). He says: “Before this rupture took place all the waters
discharging from the Albert and Logan rivers, the Pimpama Creek, the Coomera and
all other little streams of that part, found their outlet at Southport, where they met the
discharge from the Nerang. The volume and great force and impetuosity of the major
currents kept the southern channel scoured out to its rocky bottom. Now these
northern waters find their outlet at Jumpinpin, consequently the Nerang currents
preponderate, and are incessantly carrying and depositing silt in the old deep
channels and foreshore” (Hanlon, 1935, p .225). Unfortunately it is unknown when
Mr Hanlon made this observation, possibly before the 1920s.
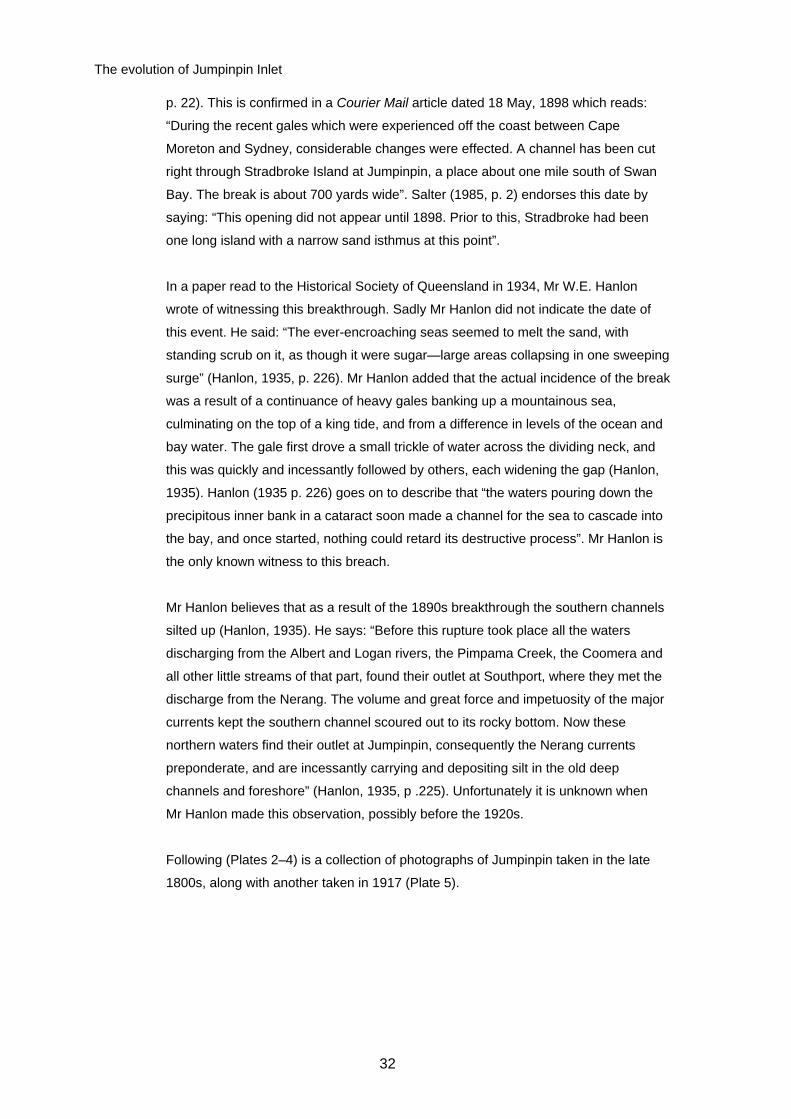
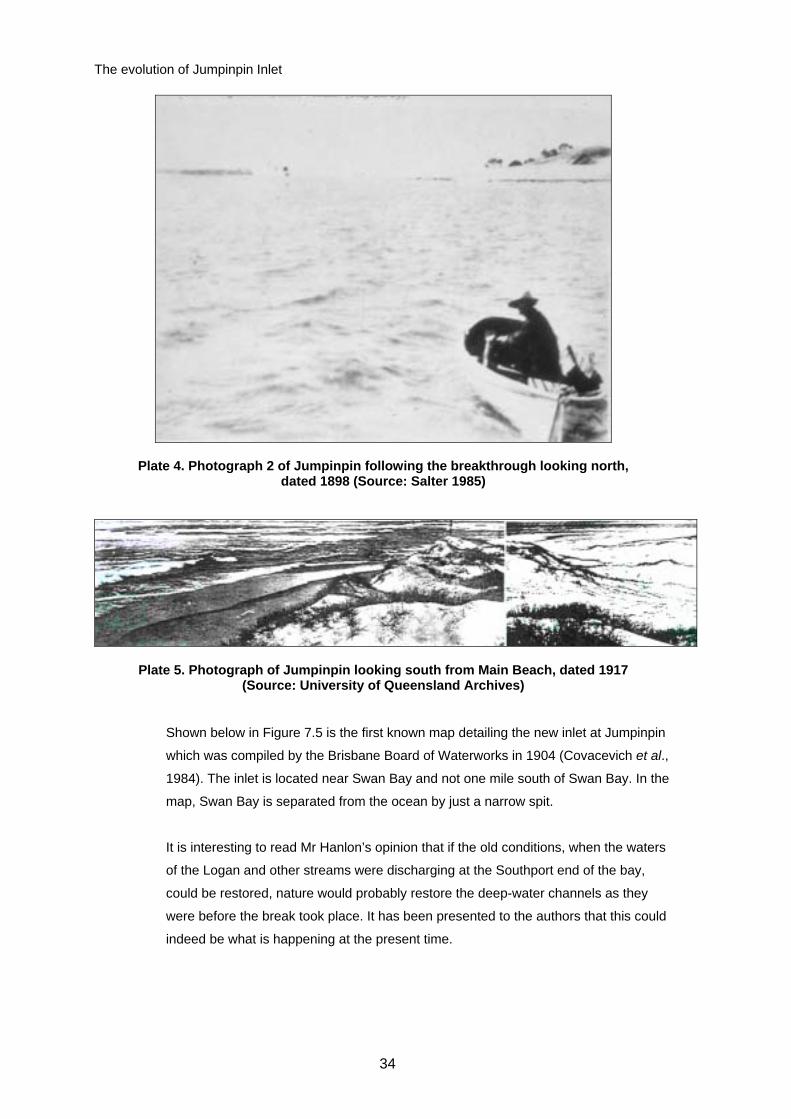
Following (Plates 2–4) is a collection of photographs of Jumpinpin taken in the late
1800s, along with another taken in 1917 (Plate 5).

The evolution of Jumpinpin Inlet
33
Plate 2. Photograph of Jumpinpin following the breakthrough looking north, dated 1896 (Source: Thomson, 1967a)
Plate 3. Photograph 1 of Jumpinpin following the breakthrough looking north, dated 1898 (Source: Salter 1985)
The evolution of Jumpinpin Inlet
34
Plate 4. Photograph 2 of Jumpinpin following the breakthrough looking north, dated 1898 (Source: Salter 1985)
Plate 5. Photograph of Jumpinpin looking south from Main Beach, dated 1917 (Source: University of Queensland Archives)
Shown below in Figure 7.5 is the first known map detailing the new inlet at Jumpinpin
which was compiled by the Brisbane Board of Waterworks in 1904 (Covacevich et al.,
1984). The inlet is located near Swan Bay and not one mile south of Swan Bay. In the
map, Swan Bay is separated from the ocean by just a narrow spit.
It is interesting to read Mr Hanlon’s opinion that if the old conditions, when the waters
of the Logan and other streams were discharging at the Southport end of the bay,
could be restored, nature would probably restore the deep-water channels as they
were before the break took place. It has been presented to the authors that this could
indeed be what is happening at the present time.

The evolution of Jumpinpin Inlet
35
Figure 7.5. Brisbane Board of Waterworks Stradbroke Island survey feature map, 1904 (Source: Covacevich et al., 1984)
By 1917 a new stage in the history of Jumpinpin began. Previously unpublished notes
on the breakthrough (Kelley, 1984) provided photographic evidence that Jumpinpin
did recover from the 1890s event. Original notes accompanying the photographs
taken by E.F. D’Arcy in 1917 reported that the inlet closed within 21 years (by 1917)
only to reopen again during a cyclone in 1936. Below is a photograph (Plate 6) taken

The evolution of Jumpinpin Inlet
36
by D’Arcy from inside Jumpinpin looking north towards Swan Bay entrance (behind
the small boat in the centre).
However, Plate 5 was also taken by D’Arcy in 1917 and clearly depicts coastal forms
that strongly suggest a channel exchanging water between the ocean and the Bay at
Jumpinpin. It is postulated that an inlet did exist to the south of the standpoint of the
photographer in Plate 6.
Further proof that Jumpinpin was open around 1917 is provided by Salter (1984).
Salter (1984) records that between 1898 and 1936, local oyster fishermen backed by
the Southport Chamber of Commerce repeatedly petitioned the government to close
off the entrance by dumping derelict boats or by building barrages. The Department of
Harbours and Marine considered the proposal but eventually rejected the idea. The
fact that the fishermen petitioned for so long suggests the inlet was stable during this
time. In addition, a local fisherman, Mr Greg Litherland, said that within his knowledge
and those he knows “the ‘pin has never closed” (Litherland, pers comm., 1997).
After the breach, the nature of the bay changed in its struggle to achieve equilibrium.
Beckmann (1975) recorded that since the opening (and before construction of the
seaway), deflection of flow through Jumpinpin resulted in the build-up of sand from
the ocean in the Southport Broadwater from which currents and tides within the bay
have been unable to remove. The break in the 1890s also resulted in rapid erosion of
the muddy sediments constituting the deltaic islands (Kelley et al., 1984) which
originally developed in a low energy regime.
Plate 6. Inside Jumpinpin looking north, 1917 (Source: University of Queensland Archives)

The evolution of Jumpinpin Inlet
37
Salter (1985) adds that alteration to currents and tides also resulted in erosion of the
southern end of South Stradbroke. The author states that the greatest washout
occurred in 1938, when the sea broke through at the southern point of South
Stradbroke, creating an island the locals called “Tragedy Island”. In 1952 a further
episode of accelerated beach erosion was observed at South Stradbroke. As reported
in the Courier Mail (13.9.1952), 200 yards eroded in one month.
With the onset of World War II the military began photographing the coast. Aerial
photographs of Jumpinpin were found from 1944 onwards. More recent changes to
Jumpinpin have been analysed from these aerials and are summarised in Chapter 8.
7.3 Summary
• South Passage, Southport and Jumpinpin were probably closed in 1770 as
recorded by Captain Cook.
• South Passage was observed open in 1799 by Flinders.
• Southport observed open in 1823 by Oxley.
• Jumpinpin opened either 1896 or 1898. The break divided the Isle of
Stradbroke into North Stradbroke (68 000 acres) and South Stradbroke
(5 200 acres) islands.
• Opening of Jumpinpin in the 1890s noticeably impacted the intra coastal
system. Redirection of tidal flow towards Jumpinpin in the early 1900s
resulted in silting of the broadwater, and erosion of the bay islands and the
southern extremity of South Stradbroke Island.
• It was initially thought that Jumpinpin had closed by 1917 and reopened in
1936. It is concluded that an inlet did exist in 1917 to the south of the original
one. The implication is that the original inlet migrated northward and closed
after the second (southern) inlet breached.

The evolution of Jumpinpin Inlet
38
8.0 Summary of aerial observations This chapter summarises the most significant changes to shoreline configuration
observed from early maps and aerial photographs. The information is
diagrammatically represented in Figure 8.1. The reader is referred to Appendix B for
aerials and Appendix C for a detailed account of shoreline changes.
8.1 Period changes
8.1.1 1904 to 1917
We have seen that in the 1890s the sea broke through the narrow isthmus joining
South and North Stradbroke islands close to where the Cambus Wallace came to
grief. In 1904 the inlet was located just south of the entrance to Swan Bay. In 1917,
a channel may have existed again close to where the Cambus Wallace sank.
8.1.2 1917 to 1944
Between 1917 and 1944 a second channel formed in the inlet. This is believed to
have occurred due to the catastrophic cyclone of 1936. Presumably, the inlet of 1917
migrated north to the location of the northern channel in 1944 (Figure B.1). The 1936
cyclone probably breached the recurved spit of South Stradbroke, thus creating the
southern channel seen in the 1944 aerial photograph.
8.1.3 1944 to 1955
In the eleven-year period between 1944 and 1955, significant changes occurred at
Jumpinpin. Most obvious is the rapid movement of South Stradbroke Island to join
with the sand island located between the two channels of 1944, effectively closing
the southern channel (Figure 8.1; Figures B.1 and B.2). Such a configuration
compares with that of 1904. The geometry of the northern channel has responded
to the southern one’s closing by widening by up to 70% to carry the extra flow.
Corresponding to higher flow rates, the ebb-tidal delta has markedly increased in size
while the inner shoals have reduced.
8.1.4 1955 to 1965
In 1965 the inlet was located about 100 metres north of its 1955 location. The channel
has much the same width and was slightly longer, creating a small downdrift offset
(Figure 8.1; Figure B.3). South Stradbroke Island has narrowed significantly, both
from the west near the curve in Tipplers Passage, and from the east.

The evolution of Jumpinpin Inlet
39
Figure 8.1. Diagrammatic representations of shoreline changes from aerial photographs
8.1.5 1965 to 1970
Between 1965 and 1970, the inlet migrated to the north perhaps 75 metres and
narrowed (Figure 8.1; Figure B.4). North Stradbroke offset increased. South
Stradbroke spit narrowed even further with only about 275 metres of sand separating
Tipplers Passage from the sea. These conditions may be similar to those prior to the
1936 cyclone.

The evolution of Jumpinpin Inlet
40
8.1.6 1970 to 1978
Massive changes took place between 1970 and 1978 (Figure 8.1; Figure B.5).
Namely, a second channel breached in a location very close to the 1944 southern
channel and where the 1890s original inlet breached. The conditions of 1978 appear
very similar to the conditions of 1944. The southern channel is about the same width
as the northern one, although its ebb-tidal delta is smaller. The northern channel has
widened since 1970, eroding its northern bank. The downdrift offset has also receded.
8.1.7 1978 to circa 1980 satellite image
Despite the large-scale satellite imagery, it is possible to see that the northern
channel at Jumpinpin came close to sealing around 1980 (Figure 8.1; Figure B.6).
The southern channel remained open while the northern channel became increasingly
constricted from growth of the sand body separating the two channels. Heavy
shoaling between this body and Crusoe Island formed a barrier practically
segregating the two channels and forcing them to behave separately. The bottom of
North Stradbroke is straight east–west and squared.
8.1.8 1980 to 1983
From 1980 to 1983 the central sand island reduced in size (Figure 8.1; Figure B.7).
Thus, the northern channel regained its width and the southern channel widened
further. Both channels appear to be conducting similar amounts of water. Shoaling
previously separating the entrances has been removed by high ebb-tidal flow rates.
In the period of 1978 to 1983 the downdrift bank remained mostly stable, rounding to
the east. South Stradbroke moved north and west.
8.1.9 1983 to 1987
The central sand island migrated westward between 1983 and 1987 (Figure 8.1;
Figure B.8). The recurved spit off South Stradbroke has moved north to just 100
metres from the central sand island. The majority of flow now moves through the
northern inlet which is wider than it has been since aerial photography started in
1944. The downdrift bank has remained stable.
8.1.10 1987 to 1993
By 1993 the second channel was completely closed (Figure 8.1; Figure B.9). The
width of the primary (northern) inlet has remained stable while it migrated north
approximately 50 metres. The entrance to Swan Bay is becoming choked with
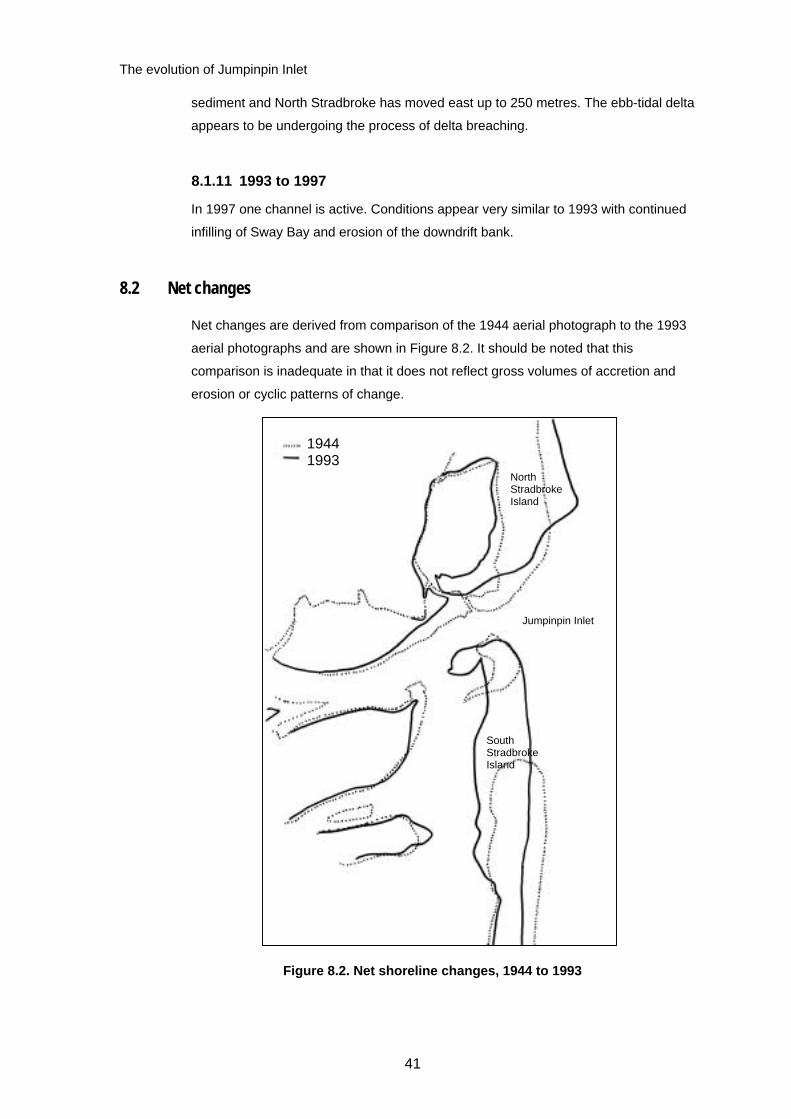
The evolution of Jumpinpin Inlet
41
sediment and North Stradbroke has moved east up to 250 metres. The ebb-tidal delta
appears to be undergoing the process of delta breaching.
8.1.11 1993 to 1997
In 1997 one channel is active. Conditions appear very similar to 1993 with continued
infilling of Sway Bay and erosion of the downdrift bank.
8.2 Net changes
Net changes are derived from comparison of the 1944 aerial photograph to the 1993
aerial photographs and are shown in Figure 8.2. It should be noted that this
comparison is inadequate in that it does not reflect gross volumes of accretion and
erosion or cyclic patterns of change.
Figure 8.2. Net shoreline changes, 1944 to 1993
1944 1993
North Stradbroke Island
South Stradbroke Island
Jumpinpin Inlet
The evolution of Jumpinpin Inlet
42
Overall:
• The primary channel has widened by about 350 metres. Of this, 75 metres is
a result of erosion on the updrift bank and the
remaining 275 metres is from retreat of the downdrift bank. From
this comparison, the channel has widened and not migrated.
• The southern channel present in 1944 is closed in 1993.
• North Stradbroke Island has moved east, South Stradbroke spit
has shifted west. The result is an obvious downdrift offset.
• Swan Bay has reduced in size due to widening of the northern channel,
aeolian influence from the east and tidal infilling from
the south.
• Short Island retreated westward.
8.3 Cyclic changes
8.3.1 Comparison of 1944 to 1978
The aerial photograph of 1944 has been compared to 1978 (Figure 8.3) as they show
Jumpinpin in similar stages of evolution. So similar are they that taken on face value it
is hard to believe Jumpinpin experienced some of the dramatic changes shown in
Figure 8.1. In 1944 and again in 1978, two channels were active at Jumpinpin. At both
times the channels show similar widths.
The most noted changes observed between the 1944 and 1978 aerial photographs
are:
• The northern channel is located about 275 metres north in 1978.
• North Stradbroke has moved to the east.
• The recurved spit of South Stradbroke has shifted west.
• The entrance to Swan Bay has moved north and west. The eastern rim infilled.

The evolution of Jumpinpin Inlet
43
Figure 8.3. Shoreline comparison, 1944 to 1978
8.3.2 Comparison of 1955 to 1993
The aerial photograph of 1955 has been compared to 1993 (Figure 8.4) as they show
Jumpinpin in similar stages of evolution. This time only the northern channel is active.
1944
1978 North StradbrokeIsland
South Stradbroke Island
Jumpinpin Inlet

The evolution of Jumpinpin Inlet
44
Figure 8.4. Shoreline comparison, 1955 to 1993 Major differences between 1955 and 1993 are:
• The channel is about 425 metres wider in 1993. Of this, 100 metres has
consumed the updrift side of 1955, and 325 metres the downdrift side.
• North Stradbroke has moved to the east.
• The recurved spit of South Stradbroke has shifted west.
• The entrance to Swan Bay has moved north and west. The eastern rim has
slightly infilled.
• The bend in Tipplers Passage, which was obvious in 1955, has straightened
due to sand deposition by 1993.
1955 1993
South Stradbroke Island
Jumpinpin Inlet
The evolution of Jumpinpin Inlet
45
8.4 Summary
• The northern channel remained open at all times. Its width varied significantly
over the years in response to the position/occurrence of the second channel,
but its location remained relatively stable. The downdrift bank scoured as the
channel widened, resulting in a northerly migration of the northern channel of
around 350 metres over the past 50 years.
• A second channel is observed to breach through the recurved spit of South
Stradbroke Island approximately every 20 to 35 years (breaching took place
between 1917 and 1944, and 1970 and 1978). Each time, the sea breached
South Stradbroke close to the site of the Cambus Wallace grounding.
• South Stradbroke spit grew northwards very rapidly between 1944 and 1955
as opposed to between 1978 and 1993.
• The northern channel came close to closing circa 1980.
• The deltaic islands remain relatively stable with the exception of Short Island
which retreated westward.
• The southern tip of North Stradbroke Island has moved to the east by up to
400 metres.
• South Stradbroke recurved spit shifted to the west by about 225 metres.
• Swan Bay has infilled significantly from both the east and south. The entrance
to Swan Bay shifted north with downdrift bank migration and west in response
to the location of South Stradbroke Island’s recurved spit.

The evolution of Jumpinpin Inlet
46
9.0 Weather data A comprehensive account of severe weather events over the last century has been
provided by the Bureau of Meteorology and is presented in Appendix D. It can be
seen from this information that the coast of Queensland is repeatedly affected by
severe storms. Figure 9.1 summarises these periods of storm attack with special
reference to the Gold and Sunshine coasts. The length of each bar is a rough
indication of the magnitude of storm effects. Those periods where severe storms are
not recorded are assumed to be fair weather phases.
Known storm surge, wave and flood data that were recorded in the vicinity of
Jumpinpin are summarised in Table 9.1. Storm surge was measured on the Moreton
Bay tide gauge at the Brisbane River mouth, wave data at either the Gold Coast or
Brisbane wave recording station, and flood levels in Brisbane. It was hoped that when
used in conjunction with Figure 9.1 the information in this table would pinpoint times
when the spit at Jumpinpin was under threat of breaching. Unfortunately there are
large gaps in the data.
Table 9.1. Storm surge, wave and flood data, 1893 to 1996
Date Storm surge (m)
Sig. wave height (m)
Peak wave height (m)
Flood level (m)
1893 0.58 9.25 1894 0.58 1931 0.76 >9.25 1934 1.16 1947 0.55 1948 0.46* 1950 0.58 2.0 1954 0.64 2.0 1963 0.76 1967 <16 1972 8.3
Jan 1974 4.5 Feb 1974 0.68+ 3.8 Mar 1974 3.8
1976~ 5.8 9.2 1980 4.0 6.3 1981 0.70 4.3 0.2 1984 5.1 8.8 1993 0.74 7.5 13.2
* 1.5 m on the open coast + Combined with king tide to give peak height of 3.1 m (a record) ~ Readings taken at Double Island Point
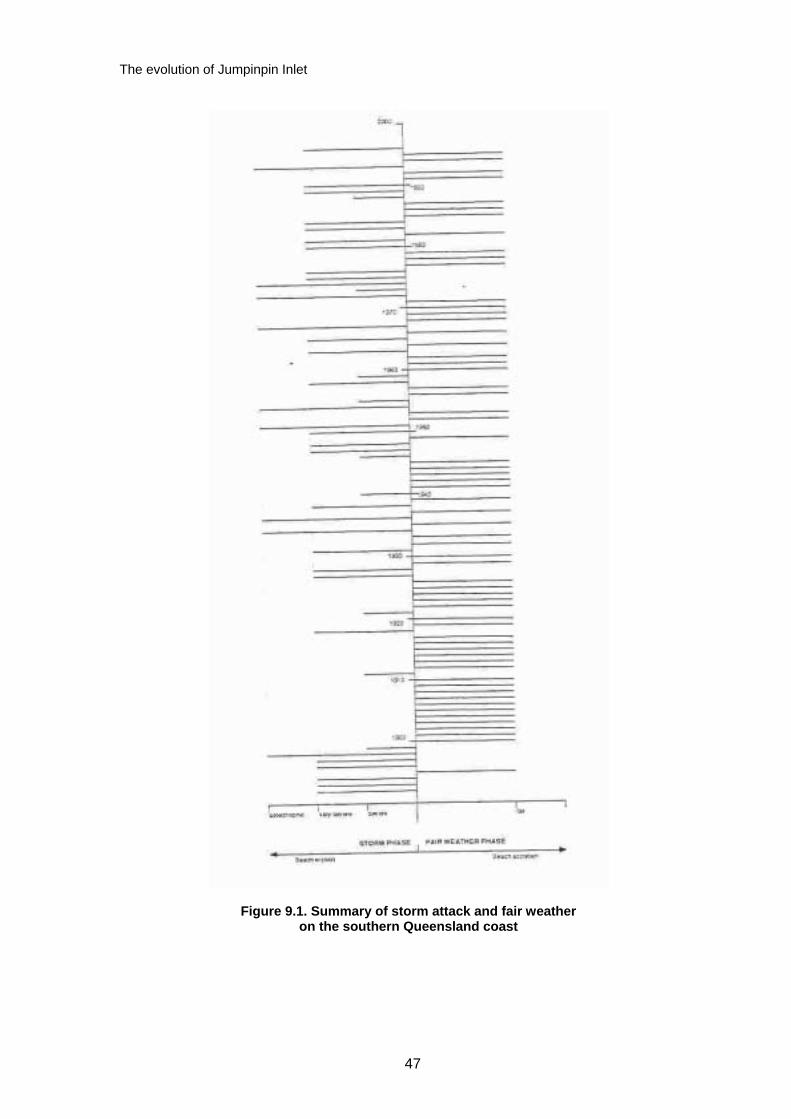
The evolution of Jumpinpin Inlet
47
Figure 9.1. Summary of storm attack and fair weather on the southern Queensland coast

The evolution of Jumpinpin Inlet
48
Figure 9.1 is useful in highlighting times of expected beach erosion or accretion. It can
be seen that Jumpinpin experienced several periods of varying weather patterns:
(1) severe or very severe weather; (2) isolated incidents of catastrophic weather;
(3) incidents of catastrophic weather on top of severe weather; and (4) stages of fair
weather. Other factors in determining extent of damage are important, for example
the direction of cyclone approach. However, the most damaging weather occurs when
a catastrophic event manifests before and/or after a series of severe events.
This type of weather was seen in the 1890s. Four cyclones passed close to the area
in five years, only to be followed by three cyclones within the first three months of
1898 and severe weather in 1899. It is still difficult to determine when the spit at
Jumpinpin was first breached. In any case, the channel was given little reprieve to
repair the damage and close off.
The next catastrophic weather did not occur until the 1930s when a number of
cyclones affected the coast in quick succession: one severe cyclone in 1934 (when
the largest storm surge on record was measured), a catastrophic cyclone in 1936
responsible for breaching the Southport spit, followed by two very severe cyclones in
1938. It is believed that the 1936 storm was also responsible for creation of the
second channel at Jumpinpin.
In the late 1940s and 1950s the coast was once again battered. Very severe weather
preceded the catastrophic storms of 1951 and 1953. A reasonably isolated but
disastrous cyclone impacted the coast in 1967 to be followed by the great floods and
cyclones of 1972 through to 1976. Nineteen seventy-four was a significant year with
the largest peak wave height on record being taken. Several severe cyclones passed
in the early 1980s, followed by an isolated catastrophic cyclone in 1993 that closed
the Port of Brisbane.
From the data, a pattern of disastrous weather is observed roughly every
20–30 years. Analysis of the storm information provides likely dates for channel
breaching at 1898, 1911, 1936 and 1974.
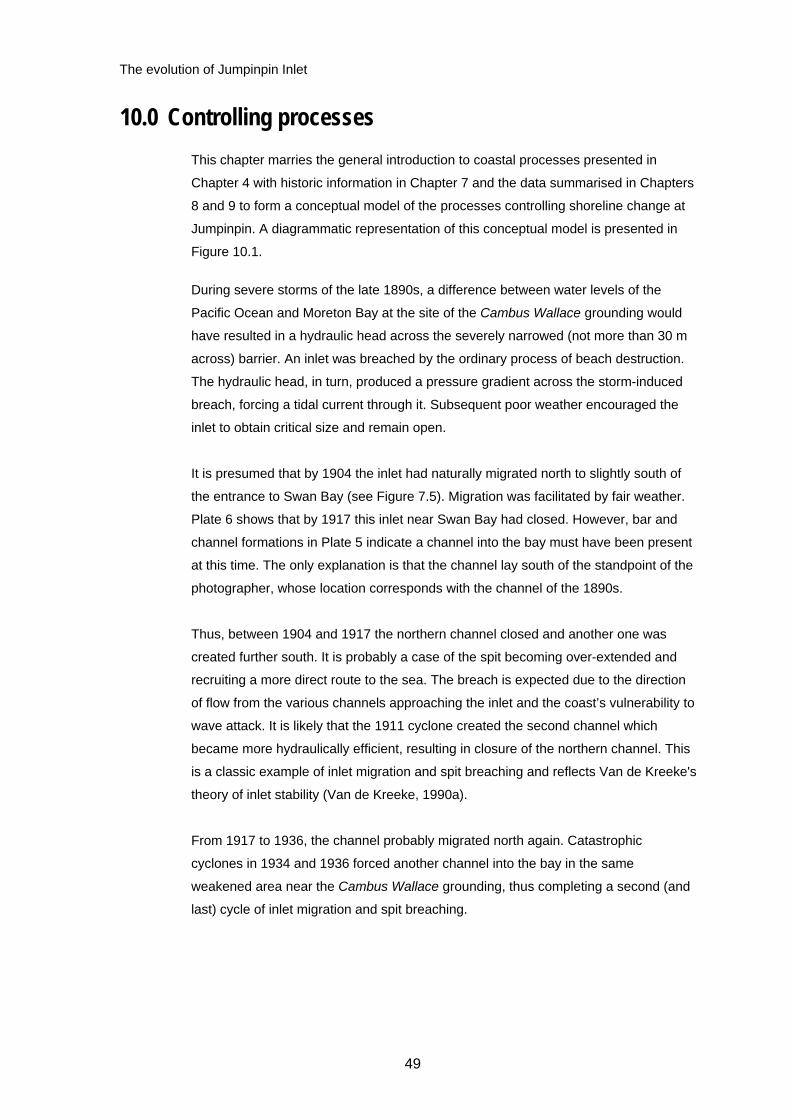
The evolution of Jumpinpin Inlet
49
10.0 Controlling processes This chapter marries the general introduction to coastal processes presented in
Chapter 4 with historic information in Chapter 7 and the data summarised in Chapters
8 and 9 to form a conceptual model of the processes controlling shoreline change at
Jumpinpin. A diagrammatic representation of this conceptual model is presented in
Figure 10.1.
During severe storms of the late 1890s, a difference between water levels of the
Pacific Ocean and Moreton Bay at the site of the Cambus Wallace grounding would
have resulted in a hydraulic head across the severely narrowed (not more than 30 m
across) barrier. An inlet was breached by the ordinary process of beach destruction.
The hydraulic head, in turn, produced a pressure gradient across the storm-induced
breach, forcing a tidal current through it. Subsequent poor weather encouraged the
inlet to obtain critical size and remain open.
It is presumed that by 1904 the inlet had naturally migrated north to slightly south of
the entrance to Swan Bay (see Figure 7.5). Migration was facilitated by fair weather.
Plate 6 shows that by 1917 this inlet near Swan Bay had closed. However, bar and
channel formations in Plate 5 indicate a channel into the bay must have been present
at this time. The only explanation is that the channel lay south of the standpoint of the
photographer, whose location corresponds with the channel of the 1890s.
Thus, between 1904 and 1917 the northern channel closed and another one was
created further south. It is probably a case of the spit becoming over-extended and
recruiting a more direct route to the sea. The breach is expected due to the direction
of flow from the various channels approaching the inlet and the coast’s vulnerability to
wave attack. It is likely that the 1911 cyclone created the second channel which
became more hydraulically efficient, resulting in closure of the northern channel. This
is a classic example of inlet migration and spit breaching and reflects Van de Kreeke's
theory of inlet stability (Van de Kreeke, 1990a).
From 1917 to 1936, the channel probably migrated north again. Catastrophic
cyclones in 1934 and 1936 forced another channel into the bay in the same
weakened area near the Cambus Wallace grounding, thus completing a second (and
last) cycle of inlet migration and spit breaching.
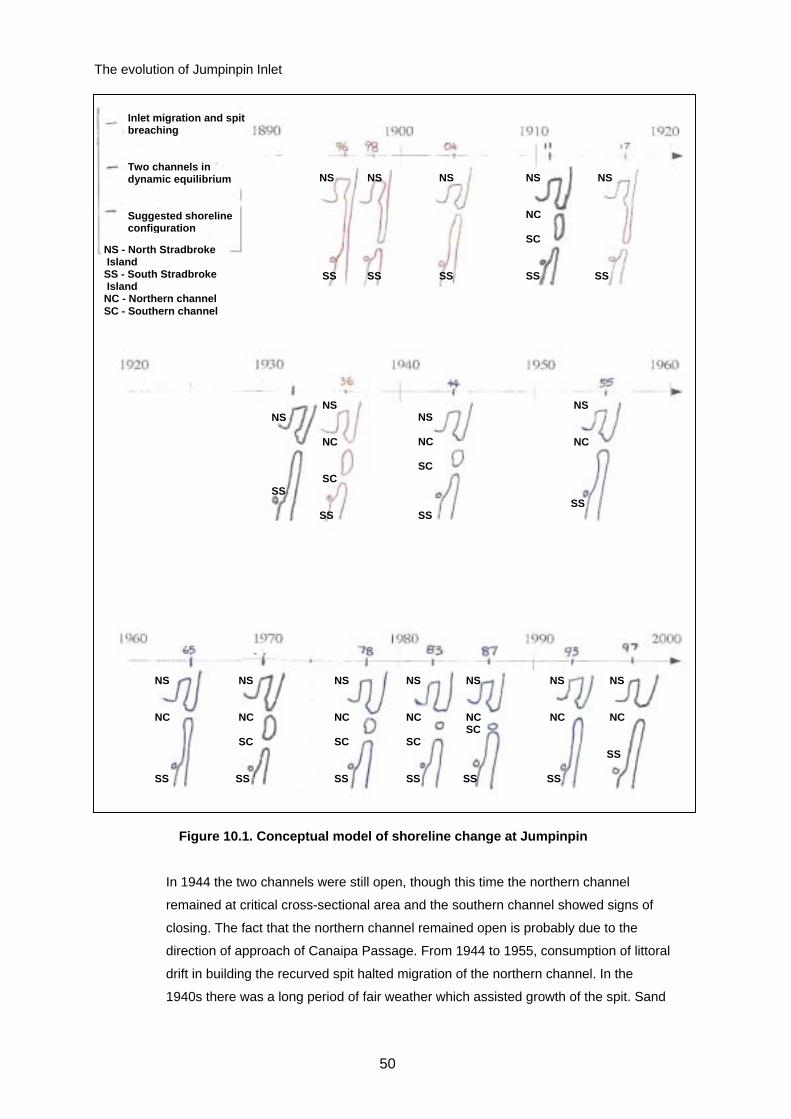
The evolution of Jumpinpin Inlet
50
Figure 10.1. Conceptual model of shoreline change at Jumpinpin
In 1944 the two channels were still open, though this time the northern channel
remained at critical cross-sectional area and the southern channel showed signs of
closing. The fact that the northern channel remained open is probably due to the
direction of approach of Canaipa Passage. From 1944 to 1955, consumption of littoral
drift in building the recurved spit halted migration of the northern channel. In the
1940s there was a long period of fair weather which assisted growth of the spit. Sand
Inlet migration and spit breaching Two channels in dynamic equilibrium Suggested shoreline configuration
NS SS
NS SS
NS SS
NS NC SC SS
NS SS
NS SS
NS NC SC SS
NS NC SC SS
NS NC SS
NS NC SS
NS NC SC SS
NS NC SC SS
NS NC SS
NS NC SS
NS NC SC SS
NS NC SC SS
NS - North Stradbroke Island SS - South Stradbroke Island NC - Northern channel SC - Southern channel

The evolution of Jumpinpin Inlet
51
must have been in abundant supply as despite severe weather in the early 1950s
closure was complete in 1955.
During the period of closure of the southern channel, the northern channel widened in
response to increasing tidal prism. Once closure was complete, littoral transport
conditions returned to normal. The channel then began to slowly migrate and
continued to do so until a second channel was again created. Migration of the
northern channel was slow due to the presence of coffee rock on Kalinga banks and
probably on the other deltaic islands. Efficient sand bypassing by stable inlet and tidal
current processes is witnessed in deposits of sand to the downdrift side causing a
slight offset in coastal alignment.
Cyclones in the early 1950s severely eroded South Stradbroke spit from the east.
Flooding in 1967, 1972 and 1974 exaggerated erosion in the bend of Tipplers
Passage where flows attempt to move along a straight path. By 1970 the spit was
dangerously narrow. It is of little surprise that the catastrophic weather of 1974 forged
a second channel through this spit, thus denoting another cycle in the evolution of
Jumpinpin.
The force of the 1974 storms was sufficient to further widen the northern channel, and
with two channels active, Jumpinpin was capturing more tidal prism than before. By
1978 rebuilding of the updrift spit had begun, thus consuming littoral drift which in turn
restricted migration of the northern channel and caused a recession in the downdrift
offset.
Between 1978 and 1981, when the northern channel came dangerously close to
closing, more tidal flow than ever before was directed through the southern channel.
The northern channel may still have been conducting significant volumes of water and
as such it is possible the two channels were beginning to behave as separate inlets. If
the northern channel had closed, the cycle of inlet migration and spit breaching as
experienced early in the century may have again taken place. However, severe
cyclones in the early 1980s prevented this from happening. The channel was forced
to expand to accommodate the 0.7m storm surge associated with the cyclone of
1981. By 1983 it had returned to critical width by scouring the sand mass separating
the two channels rather than scouring the downdrift bank. The southern channel also
widened implying more tidal prism was moving through Jumpinpin than before.
Prior to the 1981 cyclone, North Stradbroke developed an east–west square
foreshore at Jumpinpin. This implies that although the channel had narrowed
significantly, the volume of water moving through the channel was still high. The high
flow rates jetted water directly eastward out to sea and prevented erosion of North
The evolution of Jumpinpin Inlet
52
Stradbroke. A local fisherman, Mr Greg Litherland (pers. comm. 1997), recalls the
channel being very deep at this time. After regaining some of its width the channel
returned to discharging flow in a northerly direction. The result was rounding of the
base of North Stradbroke and further development of a downdrift offset.
From 1983 to 1987 South Stradbroke grew in the usual manner with few severe
cyclones to impede growth. Correspondingly, the northern channel widened by
preferentially scouring the downdrift bank. Interestingly, the rate of sand deposition
was slower in this period than during the 1950s, even though several cyclones
affected Jumpinpin in the 1950s. In 1985 work on the seaway began and it was
expected that increased capture of tidal prism there would accelerate the rate of
closure of Jumpinpin. By 1993 the southern channel had closed off all together, after
which channel migration took place.
Throughout the last 50-year period sand was lost from the system in two ways: firstly,
by dune building on the back beach of North Stradbroke; and secondly, by aeolian
and tidal infilling of Swan Bay. It is conceivable that during floods some sediment may
have been moved to deep water from which it could not be readily returned. Infilling of
Swan Bay accelerated with westward migration of the updrift bank.

The evolution of Jumpinpin Inlet
53
11.0 The seaway The Nerang River entrance, located between the Southport Spit and South
Stradbroke Island at the southern extremity of Moreton Bay, is historically a rapidly
migrating inlet. The entrance had been moving northward at a rate of 20 to 40 metres
per year over the last century (Witt & Hill, 1987). In 1986 the entrance was relocated
and stabilised by the Gold Coast Waterways Authority to increase the recreational
opportunities for boating in the area by providing a safe entrance (or seaway). A
sand-bypassing system associated with the seaway collects longshore sand drift on
the southern side of the entrance, transfers it underneath the entrance through a
pipeline and discharges it to a feeder beach on the northern side.
The structure was designed for a 35-year life. Construction began in 1985. For seven
months, in 1986, littoral drift was interrupted by the breakwall at the seaway. This
interruption may have temporarily impeded growth of the recurved spit at Jumpinpin;
however, once the sand-bypassing system was operational, drift conditions were
returned to normal. In 1997 there was concern over the stability of the seaway due to
large increases in flow rates.
It was initially hoped that construction of the seaway would result in improved outflow
of water during ebb tides, thus lowering water levels in connected waterways. Logic
follows that improving flow here could reduce tidal flow capture at Jumpinpin, where
littoral transport processes would dominate and possibly close the inlet. This is
partially true as flow through the seaway increased and the southern channel at
Jumpinpin closed. However, only the southern channel closed; the northern channel
has remained active at all times. Analysis of aerial photographs has shown that
periodic closing of the southern channel is cyclical and is therefore not necessarily a
response to construction of the seaway.
An important consideration for determining if a relationship exists between events at
Jumpinpin and flow rate change at the seaway is if the models used for the seaway
development incorporated Jumpinpin. The first physical and mathematical models of
the seaway were developed by Delft Hydraulics in the period from 1973 to 1976.
Further models that incorporated sand bypassing were formulated in the early 1980s.
In a separate investigation in the 1980s, WBM Engineering and Environmental
Consultants (pers. comm., 1996) modelled tidal movement within the Moreton Bay–
broadwater system, taking into consideration Jumpinpin at both its configuration of the
time and if it were closed. All these models were developed when the southern
channel at Jumpinpin was active, and throughout the latter models this channel was
in an enlarged state. Models developed over these years may have considered these
The evolution of Jumpinpin Inlet
54
conditions at Jumpinpin normal and as such not fully recognised the potential impact
of just the southern channel closing.
If it is assumed that Jumpinpin and the seaway are interrelated, then redirection of
tidal prism toward the seaway due to the southern channel’s closure may be partially
responsible for the large increase in flow rate at the seaway. However, recent aerial
photographs show that the tidal channels leading into Jumpinpin are strong and
appear to be carrying at least the same amount of flow as previously. Furthermore,
widening of the northern channel at Jumpinpin during the period of closure shows that
the majority of tidal flow was redirected north through this channel and not south to
the seaway. This, and the fact that Jumpinpin’s main channel is the widest it has been
over the last 50 years, leads to the conclusion that shoreline changes at Jumpinpin
are not significantly affecting the seaway. For this conclusion to be validated detailed
numerical modelling of Jumpinpin is required.

The evolution of Jumpinpin Inlet
55
12.0 Prediction of future trends The period of study is insufficient to give predictions with any accuracy. Trends may
take hundreds of years to present themselves. Furthermore, the unpredictable nature
of many of the elements involved in this complex process make it impossible to
predict accurately the short-term changes that lie ahead. Nevertheless, the authors
venture to make the following tentative projections for the near future:
1. The northern channel at Jumpinpin will remain open.
2. A channel to the south of the present one will breach within the next decade,
or sooner at a time of catastrophic weather.
3. There will be no significant change in flow rates at the seaway if and when a
second channel opens at Jumpinpin.
4. Swan Bay will most likely continue to infill, perhaps becoming an isolated
lagoon.
Unknown future changes to the system, such as sea-level rise or engineered
changes, are difficult to factor in. Until they can be, predictions using historical
information cannot be quantified.
The evolution of Jumpinpin Inlet
56
13.0 Conclusions and recommendations
13.1 Conclusions
1. Jumpinpin is an ancient inlet that was active several times during the Holocene and
Pleistocene ages.
2. Confusion over the more recent date of inlet breaching remains unresolved. Eighteen
ninety-eight is suggested as the more likely date.
3. Over the last 100 years the inlet at Jumpinpin has been highly dynamic, changing rapidly
and significantly, with two cyclic trends in this pattern of shoreline change:
• Between 1898 and 1936 the major coastal process influencing the inlet was inlet
migration and spit breaching. Two cycles were completed.
• After 1936 the inlet comprised two channels in dynamic equilibrium. The northern
channel remained open from 1944 to 1997, migrating slightly north. The second
channel opens and closes on a 20-year cycle (open 1936, closed 1955, open
1974, closed 1993).
4. Migration of the northern channel has been retarded by the composition of Kalinga Banks
and by consumption of littoral drift in building of the recurved spit of South Stradbroke
Island.
5. Tidal prism capture at Jumpinpin has fluctuated but generally increased since 1944.
6. Swan Bay has significantly infilled and is predicted to continue to do so.
7. Development of the seaway is not seen to significantly impact on Jumpinpin or vice versa.
13.2 Recommendations
Based on the findings of this study it is recommended that further research be
dedicated to determining an alternate reason for flow rate increase at the seaway. It is
felt that closing or training Jumpinpin will not benefit the seaway.

The evolution of Jumpinpin Inlet
57
References Beckmann, G.G. (1975) ‘Southern Moreton Bay – past, present and future’.
Proceedings of the Royal Society of Queensland. pp. 133–139.
Bird, E.C.F. (1973) ‘Australian coastal barriers’, Barrier islands. Compiled by
M.L. Schwartz, Dowden, Hutchinson & Ross Inc. USA. pp. 410–425.
Bruun, P. & Gerritsen, F. (1960) Stability of coastal inlets. Amsterdam: North–Holland
Publishing Company.
COPE (Coastal Observation Program – Engineering) (1985) City of Gold Coast for
the years 1972 to 1984. Beach Protection Authority, Brisbane.
Courier Mail. (1952) “Stradbroke: You can see it falling away”. Courier Mail
3 September 1952, p. 1. Brisbane.
Covacevich, J., Durbidge, E. & McInnes, J. (1984) “Stradbroke in early maps”.
Focus on Stradbroke. Boorolong Publications, Brisbane. pp. 81–99.
FitzGerald, D.M. (1988) ‘Shoreline erosion and deposition processes associated with
tidal inlets. Coastal and estuarine studies - hydrodynamics and sediment
dynamics of tidal inlets, D.G. Aubrey & l. Weishar (eds). Verlag: Berlin, West
Germany.
FitzGerald, D.M., Hubbard, D.K. & Nummedal, D. (1978) ‘Shoreline changes
associated with tidal inlets along the South Carolina Coast’. Coastal Zone ‘78.
American Society of Civil Engineers. USA. pp. 1973–1993.
Gordon, A.D. (1987) ‘Beach fluctuations and shoreline change – NSW’. 8th
Australasian conference on coastal and ocean engineering. Launceston.
30 November – 4 December, 1987. Institute of Engineers, Australia. pp. 103–107.
Hanlon, W.E. (1935) ‘The early settlement of the Logan and Albert districts’, The
Historical Society of Queensland Journal. Vol. 2, No. 5, parts 1–6, pp. 206–262.
Hayes, M.O. (1991) ‘Geomorphology and sedimentation patterns of tidal inlets –
a review’, Coastal Sediments ‘91, American Society of Civil Engineers. USA.
pp. 1343–1374.
Hayes, M.O. (1975) ‘Morphology of sand accumulation in estuaries – and introduction
to the symposium’. Estuarine research. Academic Press Inc. USA, 1975.
pp. 3–21.
Kana, T.W. (1989) ‘The South Carolina coast – natural processes and erosion’,
Coastal Zone ‘89. American Society of Civil Engineers. USA. pp. 265–273.
Kelley, R.A. (1984) ‘Previously unpublished notes and photographs on the Jumpinpin
breakthrough, North Stradbroke’. Focus on Stradbroke. Boorolong Publications,
Brisbane. pp. 152–155.
Kelley, R.A. & Baker, J. (1984) ‘Geological development of North and South
Stradbroke islands and surrounds’, Focus on Stradbroke. Boorolong Publications,
Brisbane. pp. 156–166.

The evolution of Jumpinpin Inlet
58
Maxwell, W.G.H. (1970) ‘The sedimentary framework of Moreton Bay, Queensland’.
Australian Journal of Marine Freshwater Research. No. 21. pp. 71–88.
Nummedal, D. (1983) ‘Barrier islands’. CRC handbook of coastal processes and
erosion. P.D. Komar (ed). CRC Press.
Polglase, R.H. (1987) ‘The Nerang River entrance sand bypassing system’.
8th Australasian conference on coastal and ocean engineering. Launceston.
30 November – 4 December, 1987. Institute of Engineers, Australia. pp. 196–200.
Salter, L. (1984) ‘The early white history of South Stradbroke Island’. Focus on
Stradbroke: new information on North Stradbroke Island and surrounding areas,
1974–1984. Boorolong Publications, Brisbane. p. 112.
Salter, L. (1985) South Stradbroke Island. National Library of Australia, Paddington.
SPM (Shore Protection Manual) (1984) Vol. 1, 4th edition. Prepared for Department of
the Army. USA.
Stanley, D.J. & Swift, D.J.P. (eds) (1974) Marine sediment transport and
environmental management. John Wiley & Sons, New York.
Stephens, A.W. (1982) ‘Surficial sediments of the Southern Queensland Shelf:
Southport–Point Lookout and Fraser Island areas’. Hanover, Queensland.
Telegraph (1973) ‘Why it was named Jumpinpin’. Telegraph 4 June 1973, Brisbane.
Thomson, A.K. (ed) (1967a) The collected works of Thomas Welsby. Vol. 1. The
Jacaranda Press.
Thomson, A.K. (ed) (1967b) The collected works of Thomas Welsby. Vol. 2. The
Jacaranda Press.
Van De Kreeke, J. (1990a) ‘Stability analysis of a two-inlet bay system’. Coastal
Engineering, No. 14. Elsevier Science Publishers, Amsterdam. pp. 481–497.
Van De Kreeke, J. (1990b) ‘Can multiple tidal inlets be stable?’ Estuarine, Coastal
Shelf Science. Vol. 30, pp. 261–273. Academic Press Inc., London.
Van De Kreeke, J. (1985) ‘Stability of tidal inlets - Pass Cavallo, Texas’, Estuarine,
Coastal Shelf Science. Vol. 21, pp. 33–43. Academic Press Inc., London.
Ward, W.T. (1977) Handbook of recent geological studies of Moreton Bay, Brisbane
River and Stradbroke Island. G.R. Orme, & R.W. Day (eds). Australasian
Sedimentologists Group first meeting. Brisbane.
Welsby, T. (1921) ‘Stradbroke Island’. Courier Mail 26 March 1921, Brisbane.
Witt, C.L. & Hill, P.C. (1987) ‘Gold Coast Seaway: an overview of the project’s design
and construction and its subsequent performance’, 8th Australasian conference
on coastal and ocean engineering. Launceston. 30 November – 4 December,
1987. Institute of Engineers, Australia. pp. 259–266.

The evolution of Jumpinpin Inlet
59
Further reading Apelt, C.J. & Piorewicz, J. ‘Modelling the morphological dynamics of tidal inlets’,
8th Australasian conference on coastal and ocean engineering. Launceston.
30 November – 4 December, 1987. Institute of Engineers, Australia. pp. 307–311.
Bales, J.D. & Holley, E.R. ‘Sand transport in Texas tidal inlet’, Journal of Waterway,
Port, Coastal, and Ocean Engineering. Vol. 115, No. 4, July 1989. pp. 427–443.
Barr, David. ‘Vegetating reclaimed areas near the Gold Coast Seaway’, Beach
Conservation.
Bird, E.F.C. Coasts. 2nd Edition. Australian National University Press, Canberra.
1976.
Brigginshaw, Jim. ‘Whiskey galore under Jumpinpin sands’, Courier Mail, 11 January
1978.
Bruun, P. ‘Tidal inlets and littoral drift’ in Future marine science in Moreton Bay,
J.G. Greenwood, & N.J., Hall (eds), School of Marine Science: The University
of Queensland.
Byrne, R.J., Bullock, P. & Tyler. ‘Response characteristics of a tidal inlet - a case
study’, Estuarine research. Academic Press Inc. USA. 1975. pp. 201–215.
Carter, Paddy (ed.). Historic North Stradbroke. North Stradbroke Island Historical
Museum Assoc. Inc. Queensland, 1994.
‘Coastal rehabilitation’, Engineers Australia, Vol. 67, No. 4, April 1995. pp. 36–38.
DeAlteris, J.T. & Byrne, R.J. ‘The recent history of Wachapreague Inlet, Virginia’,
Estuarine research. 1973, pp. 167–181.
Dean, R.G. & Walton, T.L. ‘Sediment transport processes on the vicinity of inlets with
special reference to sand trapping’, Estuarine research. Academic Press Inc.
USA, 1975. pp. 129–147.
Durbidge, E. & Covacevich. J. North Stradbroke Island. Imprint Pty Ltd, Brisbane.
1981.
Dwyer, Nan. ‘Untouched by all the razzamatazz’, The Sunday Mail, 4 March 1984.
Fessenden, F.W. & Scott, S.C. ‘The coastal breach at Nauset Beach, Chatam,
Massachusetts – a case study’, Coastal Zone ‘89. American Society of Civil
Engineers. USA, 1989. pp. 138–149.
Focus on Stradbroke - New information on North Stradbroke Island and surrounding
areas 1974–1984. Papers prepared for the Royal Society of Queensland
Symposium, 11–12 August. Boorolong Publications. 1984.
Giese, G.S. ‘Cyclical behaviour of the tidal inlet at Nauset Beach, Chatham,
Massachusetts’ in Coastal and estuarine studies – hydrodynamics and sediment
dynamics of tidal inlets, D.G. Aubrey & l. Weishar (eds.), Verlag: Berlin, West
Germany. 1990.

The evolution of Jumpinpin Inlet
60
Giese, G.S., Liu, J.T. & Aubrey, D.G. ‘Impacts of tidal inlet formation on the physical
characteristics of a barrier beach–estuary system’, Coastal Zone ‘89. American
Society of Civil Engineers. USA, 1989. pp. 150–157.
Goodwin, P. & Williams, P.B. ‘Short term characteristics of coastal lagoon entrances
in California’, Coastal Sediments ‘91. American Society of Civil Engineers, 1991.
pp. 1092–1205.
Griffin, H.C. Use of the islands and waters of Moreton Bay. Australian frontier,
Canberra. 1967.
Hannah, Isobel. ‘Was it a galleon?’ Brisbane Courier Mail, 12 March 1921.
Hannah, Isobel. ‘More about Stradbroke’, Brisbane Courier Mail, 9 April 1921.
Hoyt, J.H. & Henry, V.J. ‘Influence of island migration on barrier island sedimentation’,
Barrier islands. Compiled by S.L. Maurice, Dowden, Hutchinson & Ross Inc. USA,
1973. pp. 238–246.
Hughes, M.G., ’Some aspects of the hydrodynamics and sedimentation of Sussex
Inlet’, Report submitted to the Shoalhaven City Council, 28 February 1985.
Hwang, Dennis. ‘Beach changes on Oahu as revealed by aerial photographs’,
Technical supplement number 22, Coastal zone management project, Urban and
regional planning program, Hawaii Institute of Geophysics, July 1981.
Knowles, S.C. & Gorman, L.T. ‘Historical coastal morphodynamics at St Marys
Entrance and vicinity, Florida, USA’, Coastal Sediments ‘91, American Society of
Civil Engineers, 1991. pp. 1449–1461.
Leatherman, S.P., Davidson, A.T. & Nicholls, J.R. ‘Coastal geomorphology’,
Environmental science and the coastal zone: issues for further research. National
Research Council. US National Academy Press, Washington, 1994.
McCabe, P., Healy, T.R. & Nelson, C.S. ‘Mangawhai Harbour and the development of
its dual inlet system’. 1985 conference on coastal and ocean engineering. Inst.
Prof. Engineers, NZ 1985.
Macmillan Australian Atlas. Macmillan Education, Hong Kong. 1983.
Mason, Brian & Sultmann, Selwyn. ‘The sand dune research station’, Beach
Conservation.
Mitchell, J.K. Community response to coastal erosion: individual and collective
adjustments to hazard on the Atlantic Shore. The University of Chicago,
Department of Geography Research Paper No. 156, 1974.
O'Brien, M.P. ‘Comments on tidal entrances on sandy coasts’, 17th international
conference on coastal engineering, Sydney, 23–28 March 1980. Institute of
Engineers, Australia.
Patterson, C.C. & Groves, L. ‘Wave penetration and rubble mound breakwater
stability model studies for tidal inlet training works’, Fifth Australian conference
on coastal and ocean engineering, Perth, 25–27 November 1981. Institute of
Engineers, Australia.

The evolution of Jumpinpin Inlet
61
Patterson, Dean & Pattearson, Chris. ‘New Gold Coast study’, Beach Conservation.
Pierce, J.W. ‘Tidal inlets and washover fans’, Barrier islands. Compiled by
S.L. Maurice, Dowden, Hutchinson & Ross Inc. USA, 1973. pp. 334–338.
Pound, M.D. & Witt, R.W. ‘Nerang River entrance sand bypassing system’,
8th Australasian conference on coastal and ocean engineering. Launceston.
30 November – 4 December, 1987. Institute of Engineers, Australia. pp. 222–226.
Searle, P. ‘Photography – an aid to coastal management’, Beach Conservation,
No. 51, April 1983.
Shamban, A.J. & Moslow, T.F. ‘Historical morphologic evolution and sedimentation at
Barataria Pass, Louisiana’, Coastal Sediments ‘91, American Society of Civil
Engineers, 1991. pp. 1375–1387.
Smith, A.W. & Gordon, A.D. ‘Secondary sand transport mechanisms’. 17th
international conference on coastal engineering, Sydney, 23–28 March 1980.
Smith, A.W.S & Laracy, S.W. ‘The dynamics of training walls at barrier island
estuarine outlets’.
Stephens, A.W., Roy, P.S & Jones, M.R. ‘Geological model of erosion on a littoral drift
coast’, Fifth Australian conference on coastal and ocean engineering, Perth.
25–27 November 1981.
Vallianos, L. ‘Barden Inlet, NC, a case study of coastal inlet migration’, 17th
international conference on coastal engineering, Sydney, 23–28 March 1980.
Institute of Engineers, Australia.
Viles, H. & Spencer, T. Coastal problems. Edward Arnold Printer, 1995. Great Britain.
pp. 93–97.
Warme, J.E. Sanchez-Barreda, L.A. & Biddle, K.T. ‘Sedimentary processes and
patterns in West Coast lagoons’, Estuarine processes Vol. 2. Academic Press,
New York. 1976. pp. 167–179.

The evolution of Jumpinpin Inlet
62
Appendixes A. Glossary B. Aerial photographs C. Aerial documentation D. Storm events E. COPE data

The evolution of Jumpinpin Inlet
63
Appendix A. Glossary of terms
In any discussion on coastal engineering an agreement of the meaning of terms is necessary. Provided here are definitions of terms used in this report. Although the terms came from many sources, the Shore Protection Manual (SPM, 1984) was of particular value. Accretion – A slow addition to land by deposition of a water-borne sediment (growth or increase in size by gradual external addition). Aeolian – Relating to or caused by winds. Bar – A submerged or emerged embankment of sand, gravel or other unconsolidated material built on the sea floor in shallow water by waves and currents. Barrier island – Elongated island, parallel to shore and separated from the mainland by a bay, lagoon or marsh area. Beach profile – Surveyed cross-section of a beach (see Figure A.1). Berm – Flat beach at the top of wave uprush, reached only by higher storm waves. Channel – A natural or artificial waterway of perceptible extent which either periodically or continuously contains moving water, or which forms a connecting link between two bodies of water. Coast – A strip of land of indefinite width (maybe several kilometres) that extends from the shoreline inland to the first major change in terrain features. Coastline – The line that forms the boundary between the land and the water. Continental shelf – The zone bordering a continent and extending from the low water line to the depth (usually about 180 m) where there is a marked or rather steep descent toward a greater depth. Current – A flow of water. Current, Ebb – The tidal current away from shore or down a tidal stream. Usually associated with the decrease in the height of the tide. Current, Flood – The tidal current toward shore or up a tidal stream. Usually associated in the increase in the height of the tide. Current, Tidal – The alternating horizontal movement of water associated with the rise and fall of the tide caused by the astronomical tide-producing forces. Cyclone, Extra tropical (ETC) – An area of low pressure around which the winds flow in a clockwise direction in the southern hemisphere, specifically with associated cold fronts, warm fronts and occluded fronts (also know as baroclinic storms). Downdrift – The directing of predominant movement of littoral materials (sediment). Fetch – The distance travelled by waves with no obstruction. Geomorphology – That branch of both physiography and geology which deals with the form of the earth, the general configuration of its surface, and the changes that take place in the evolution of landform. Indurated sand – Sand hardened to the consistency of soft rock.

The evolution of Jumpinpin Inlet
64
Inlet – A short, narrow waterway connecting a bay, lagoon or similar body of water with a large parent body of water. Inlet gorge – Generally the deepest region of the inlet channel. Isthmus – A narrow strip of land connecting two larger masses of land. Littoral – The region or zone between the limits of high and low tides. Littoral drift – The sedimentary material moved in the littoral zone under the influence of waves and currents. Littoral transport – Movement of littoral drift in the nearshore zone by waves and currents. Movement can be perpendicular (onshore–offshore) or parallel (longshore) to the shore. Littoral zone – Zone of water extending from the shoreline to just beyond the seaward-most breakers. Longshore transport – Littoral transport in the direction parallel to the shore. Middle ground shoal – A shoal formed by ebb and flood tides in the middle of the channel of the lagoon or estuary end of an inlet. Morphology – Physical form and structure. Nearshore zone – Region where the forces of the sea react against the land. Offshore – The comparatively flat zone of variable width, extending from the breaker zone to the seaward edge of the continental shelf. The direction seaward from the shore. Parallax – An apparent change in the direction of an object, cause by a change in observational position that provides a new line of site. Quartzose – Relating to or made of quartz. Sand bypassing – Hydraulic or mechanical movement of sand from the accreting updrift side to the eroding downdrift side of an inlet. Natural or man-made. Scour – Removal of underwater material by waves and currents, especially at the base or toe of a shore structure. Setup, Wave – Superelevation of the water surface over normal surge elevation due to onshore mass transport of the water by wave action alone. Shoal (Noun) – A detached elevation of the sea bottom, comprised of any material except rock or coral, which may endanger surface navigation. Shoal (Verb) – To become shallow gradually. Spit – A small point of land or a narrow shoal projecting into a body of water from the shore. Storm surge – A rise above normal water level on the open coast due to the action of wind stress on the water’s surface. Surge – The name applied to wave motion with a period intermediate between that of the ordinary wind wave and that of the tide.

The evolution of Jumpinpin Inlet
65
Swash – The rush of water up onto the beachface following the breaking of a wave. Swash channel – A secondary channel passing through or shoreward of an inlet or river bar. Swell – Wind-generated waves that have travelled out of their generating area. Swell characteristically exhibits a more regular and longer period and has flatter crests than waves within their fetch. Tidal inlet – A natural inlet maintained by tidal flow. Tidal prism – The total amount of water that flows into a harbour or estuary or out again with movement of the tide, excluding any freshwater flow. Tidal range – The difference in height between consecutive high and low (or higher high and lower low) waters. Updrift – The direction opposite to that of the predominant movement of littoral (sediment) materials. Wave – A ridge, deformation or undulation of the surface of a liquid. Wave height – The vertical distance between a crest and the proceeding trough. Wind setup – The vertical rise in the still-water level on the leeward side of a body of water caused by wind stresses on the surface of the water.

The evolution of Jumpinpin Inlet
66
Visual definitions
Figure A.1. Visual definition of terms describing a typical beach profile (Source: SPM, 1984)
Figure A.2. Visual definition of the morphological components of a typical tidal inlet (Source: Adapted from Hayes, 1991)

The evolution of Jumpinpin Inlet
67
Figure A.3. Visual definition of terms describing an ebb-tidal delta (Source: Adapted from Hayes, 1975)

The evolution of Jumpinpin Inlet
68
Appendix B. Aerial photographs and other photographs

The evolution of Jumpinpin Inlet
69
Figure B.1. 1944 Aerial photograph of Jumpinpin inlet
North Stradbroke Island
North channel
South Stradbroke Island
South channel
Swan Bay
Crusoe Island
Pandanus Island
Stingaree Island
Canaipa Passage
Swan Bay
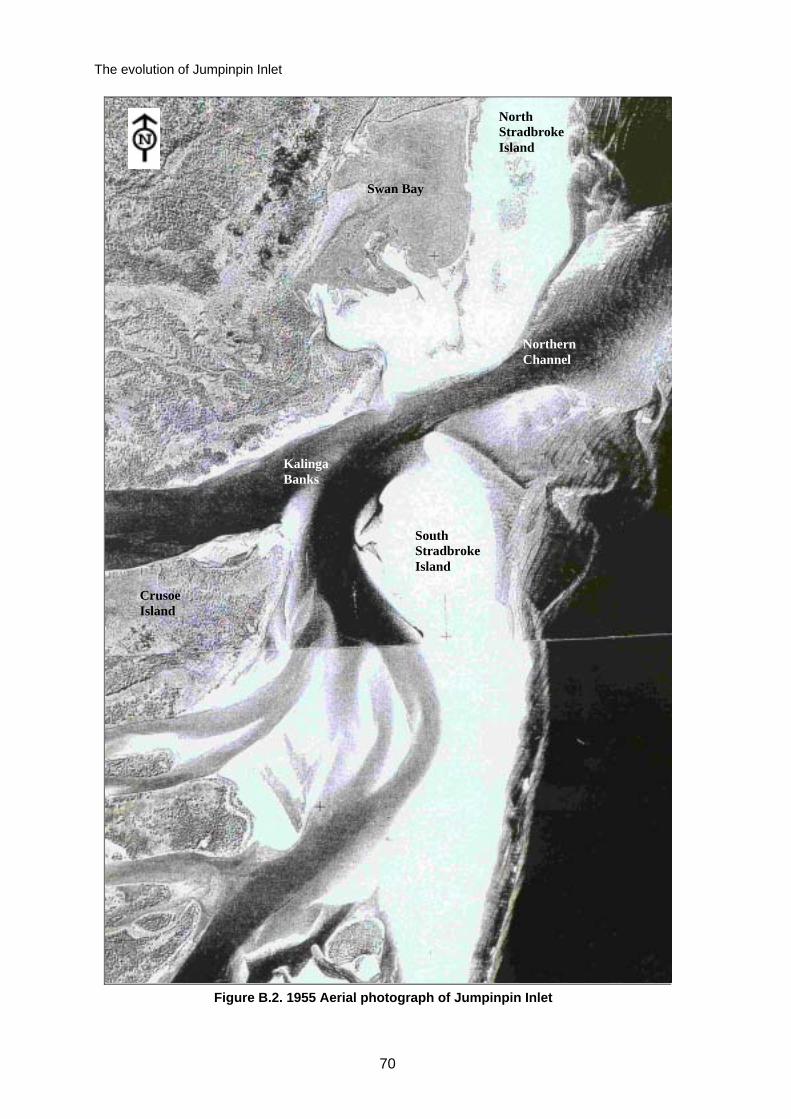
The evolution of Jumpinpin Inlet
70
Figure B.2. 1955 Aerial photograph of Jumpinpin Inlet
North Stradbroke Island
Northern Channel
Kalinga Banks
Swan Bay
Crusoe Island
South Stradbroke Island

The evolution of Jumpinpin Inlet
71
Figure B.3. 1965 Aerial photograph of Jumpinpin inlet
North Stradbroke Island
South Stradbroke Island
Tippler’s Passage
Short Island
Swan Bay

The evolution of Jumpinpin Inlet
72
Figure B.4. 1970 Aerial photograph of Jumpinpin Inlet
North Stradbroke Island
South Stradbroke Island
Tipplers Passage
Swan Bay
Canaipa Passage
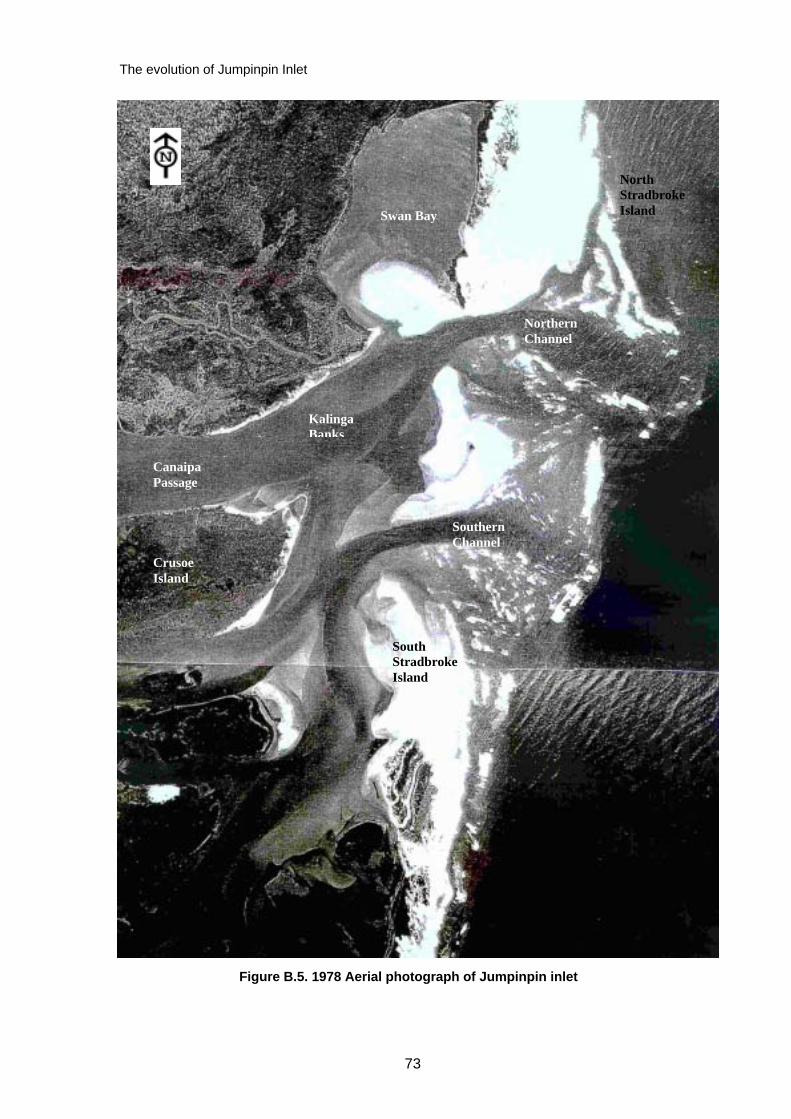
The evolution of Jumpinpin Inlet
73
Figure B.5. 1978 Aerial photograph of Jumpinpin inlet
Swan Bay
Northern Channel
South Stradbroke Island
Southern Channel
North Stradbroke Island
Crusoe Island
Canaipa Passage
Kalinga Banks

The evolution of Jumpinpin Inlet
74
Figure B.6. Circa 1980 satellite image of the southern end of North Stradbroke Island
North Stradbroke Island
Jumpinpin Inlet South Stradbroke Island
South Moreton Bay
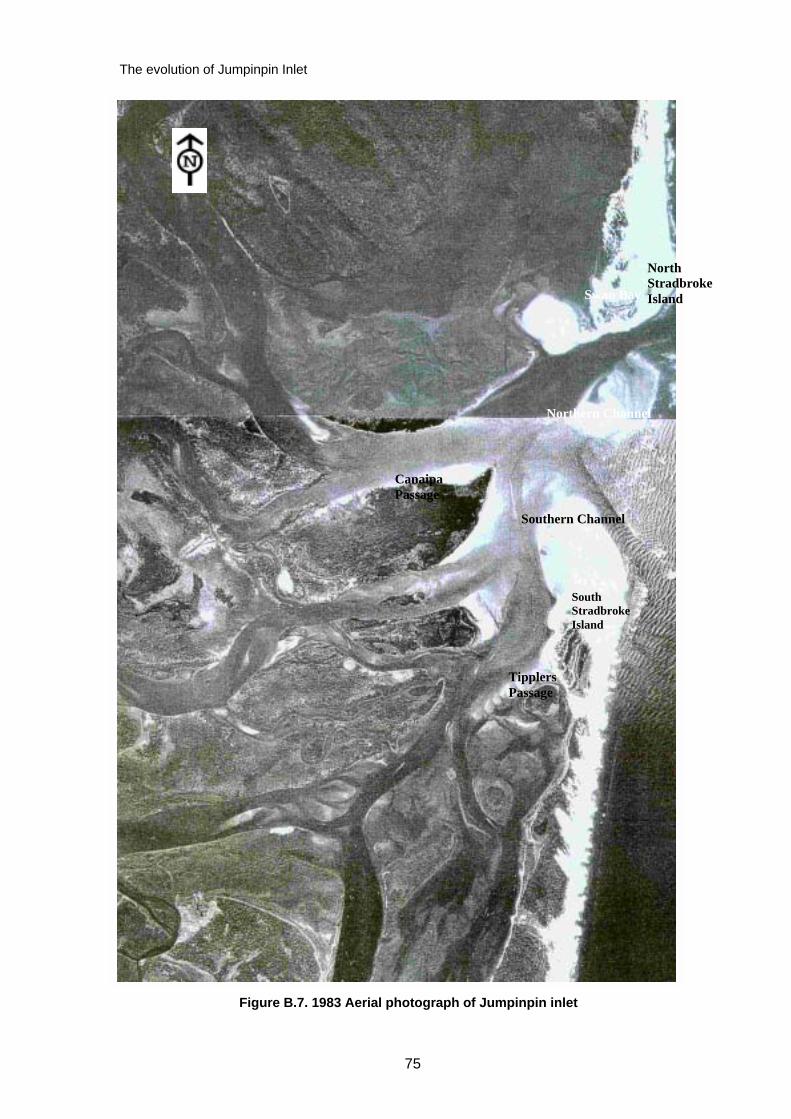
The evolution of Jumpinpin Inlet
75
Figure B.7. 1983 Aerial photograph of Jumpinpin inlet
Northern Channel
Canaipa Passage
Tipplers Passage
South Stradbroke Island
Northern Channel
Southern Channel
Swan Bay
North Stradbroke Island

The evolution of Jumpinpin Inlet
76
Figure B.8. 1987 Aerial photograph of Jumpinpin inlet
South Stradbroke Island
North Stradbroke Island
Northern Channel
Tipplers Passage
Swan Bay

The evolution of Jumpinpin Inlet
77
Figure B.9. 1993 Aerial photograph of Jumpinpin inlet
North Stradbroke Island
South Stradbroke Island
Northern Channel
Tipplers Passage
Swan Bay
Canaipa Passage

The evolution of Jumpinpin Inlet
78
Figure B.10a. Jumpinpin inlet 1997, looking south at South Stradbroke Island
Figure B.10b. Jumpinpin inlet 1997, looking south

The evolution of Jumpinpin Inlet
79
Figure B.10c. Jumpinpin inlet throat 1997, looking south
Figure B.10d. Jumpinpin downdrift bank 1997, looking west – evidence of erosion
The evolution of Jumpinpin Inlet
80
Appendix C. Aerial photography analysis
This section describes in detail the changing configuration of Jumpinpin from aerial photographs and other relevant photographs. 1944 (KD 1048, Tambourine, Run 1: 1944 & KD 1049, Beenleigh Area, run 6: 1944) The first aerial photographs of Jumpinpin were taken in 1944 during the Second World War. The value of these photographs is limited due to their age and quality. The aerial covering the southern end of Jumpinpin is overexposed. The breakthrough at Jumpinpin is obvious, with two channels conducting water to and from the sea. The northernmost channel is deep and narrow, not more than 200 metres at its throat. This channel follows the path of Canaipa Passage in the north, runs east–west between Singaree and Crusoe Islands, turning northeast and remaining at this bearing until it reaches the ocean. The southernmost channel approaches the inlet from the south, turning abruptly east at the mouth, then slightly south out to sea. The southern channel is wider (perhaps three times) but shallower. Despite poor photo quality, extensive shoaling in the vicinity of this channel is obvious. Interestingly, the second channel lies just to the north of where the Cambus Wallace was wrecked in 1884. Ebb-delta formations exist at both inlets, the southern being the larger. This suggests the southern inlet is younger and formed during flood conditions. The two channels are separated by a sand island (name unknown). The island is convex shaped (toward the ocean) with shoals of sand stretching seaward like wings from each tip of the island. These shoals aid in defining and lengthening the throat of both channels. The island is unvegetated and slightly elongated to the southwest. The ocean coastline is of near north–south alignment with North Stradbroke ever so slightly offset east of South Stradbroke. South Stradbroke shows signs of recurved spit moving northward. The head of this spit, north of Pandanas Island, lacks vegetation implying very new and rapid growth. The southern channel could well have been much wider prior to 1944. Abundance of sand shoals inside the mouth might also suggest reworking of a previous flood-tide delta. A narrow band of vegetation can be seen colonising the eastern edge of Swan Bay. The entrance to Swan Bay is constricted by sand, and the southeast interior shoaled to the level of Never Never Creek. A small ebb-tide lobe is evident offshore of the northern channel and a larger one off the southern channel. Both are pushed close to the coast implying wave action is the dominant force.
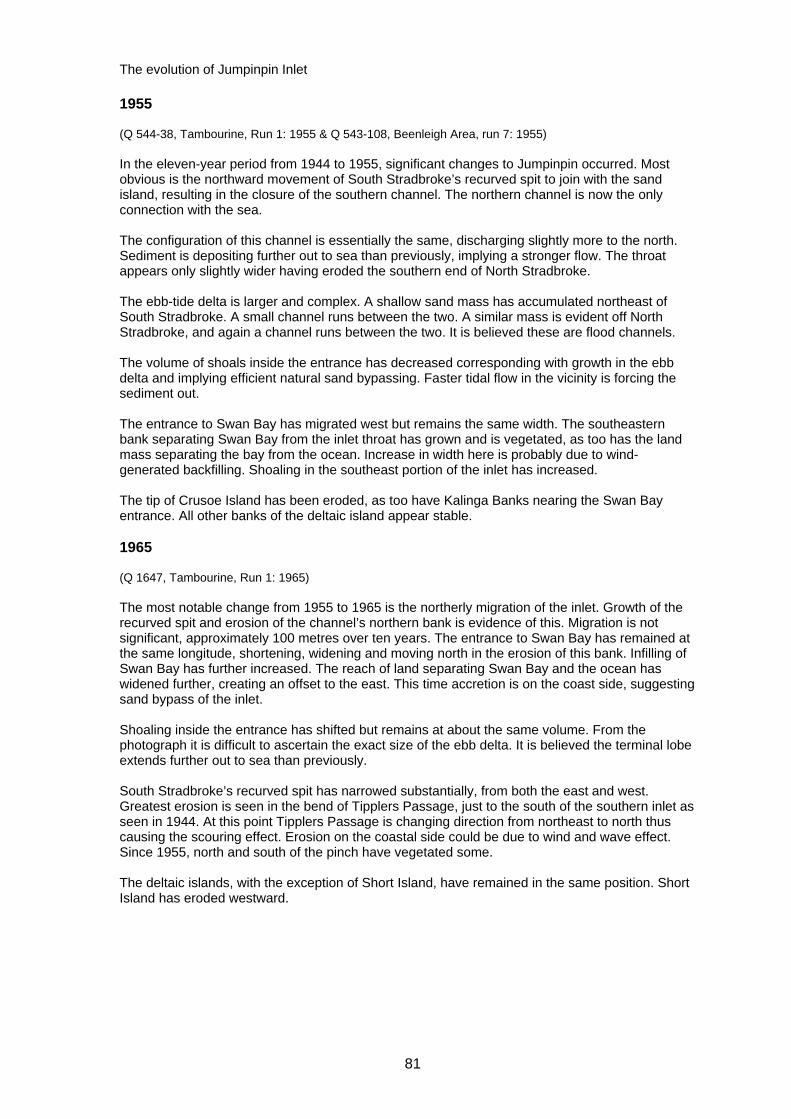
The evolution of Jumpinpin Inlet
81
1955 (Q 544-38, Tambourine, Run 1: 1955 & Q 543-108, Beenleigh Area, run 7: 1955) In the eleven-year period from 1944 to 1955, significant changes to Jumpinpin occurred. Most obvious is the northward movement of South Stradbroke’s recurved spit to join with the sand island, resulting in the closure of the southern channel. The northern channel is now the only connection with the sea. The configuration of this channel is essentially the same, discharging slightly more to the north. Sediment is depositing further out to sea than previously, implying a stronger flow. The throat appears only slightly wider having eroded the southern end of North Stradbroke. The ebb-tide delta is larger and complex. A shallow sand mass has accumulated northeast of South Stradbroke. A small channel runs between the two. A similar mass is evident off North Stradbroke, and again a channel runs between the two. It is believed these are flood channels. The volume of shoals inside the entrance has decreased corresponding with growth in the ebb delta and implying efficient natural sand bypassing. Faster tidal flow in the vicinity is forcing the sediment out. The entrance to Swan Bay has migrated west but remains the same width. The southeastern bank separating Swan Bay from the inlet throat has grown and is vegetated, as too has the land mass separating the bay from the ocean. Increase in width here is probably due to wind-generated backfilling. Shoaling in the southeast portion of the inlet has increased. The tip of Crusoe Island has been eroded, as too have Kalinga Banks nearing the Swan Bay entrance. All other banks of the deltaic island appear stable. 1965 (Q 1647, Tambourine, Run 1: 1965) The most notable change from 1955 to 1965 is the northerly migration of the inlet. Growth of the recurved spit and erosion of the channel’s northern bank is evidence of this. Migration is not significant, approximately 100 metres over ten years. The entrance to Swan Bay has remained at the same longitude, shortening, widening and moving north in the erosion of this bank. Infilling of Swan Bay has further increased. The reach of land separating Swan Bay and the ocean has widened further, creating an offset to the east. This time accretion is on the coast side, suggesting sand bypass of the inlet. Shoaling inside the entrance has shifted but remains at about the same volume. From the photograph it is difficult to ascertain the exact size of the ebb delta. It is believed the terminal lobe extends further out to sea than previously. South Stradbroke’s recurved spit has narrowed substantially, from both the east and west. Greatest erosion is seen in the bend of Tipplers Passage, just to the south of the southern inlet as seen in 1944. At this point Tipplers Passage is changing direction from northeast to north thus causing the scouring effect. Erosion on the coastal side could be due to wind and wave effect. Since 1955, north and south of the pinch have vegetated some. The deltaic islands, with the exception of Short Island, have remained in the same position. Short Island has eroded westward.
The evolution of Jumpinpin Inlet
82
1970 (Q 2141, Beenleigh East Key: 1970) In this five-year period South Stradbroke narrowed further while North Stradbroke widened. The inlet remained in the same position. The pinch at South Stradbroke remained the same width but the head of the spit narrowed, eroding from the inside. Over the past 20 years Tipplers Passage has become increasingly larger and deeper, now approximately equalling the size of Canaipa Passage. Shoaling appears much the same. North Stradbroke Island has developed a significant offset indicating sand bypass. Unfortunately the ebb-tide delta is cropped off the frame. The entrance to Swan Bay has narrowed and realigned from a northeast channel to northwest. Pattern of infilling is much the same. Burial of vegetation from wind-blown sand is evident on both North and South Stradbroke islands. Backfilling of Swan Bay from the east has occurred. The deltaic islands remain unchanged. 1978 (Q 3606, Beenleigh, Run 7: 1978 & Q 3608, Beenleigh, Run 8: 1978) Massive changes took place between 1970 and 1978. The floods and cyclones of 1974 are assumed to be the major driving forces. Most significant is the reopening of a second channel, very close in position to where the channel was in 1944. The sand island separating the two channels is in the exact location of the head of South Stradbroke in 1970, though the recurved spit of South Stradbroke has shifted west slightly. Both channels are active, the northernmost slightly larger. Both have ebb-tidal deltas. The northern channel discharges to the east-south-east, and the southern channel to the east. Canaipa Passage has become dominant once again. The previous offset of North Stradbroke has receded slightly. Kalinga Banks nearing Swan Bay entrance has eroded, as have the northern banks of the northernmost channel. The result is a northerly migration of this side. Massive burial of vegetation on North Stradbroke is apparent. Shoals in Swan Bay have reworked into a fan shape, and the entrance has widened due to erosion of the western bank. Another correlation with the 1944 configuration is the rebuilding of the tip of Crusoe Island. There is a larger ebb delta than 1944. Circa 1980 satellite image Despite the large scale of satellite imagery, it is possible to see that the northern inlet at Jumpinpin came close to closing. The southern channel remained open while the northern channel became increasingly constricted from growth of the sand body separating the two channels. Heavy shoaling between this body and Crusoe Island formed a barrier practically segregating the two channels.

The evolution of Jumpinpin Inlet
83
1983 (Q 4267, SEQ, Run 12 & 13: 1983) From circa 1980 to 1983 the central sand island reduced in size. Thus, the northern inlet regained its width and the southern inlet widened further. Shoaling previously separating the entrances has been flushed out. In the period of 1978 to 1983 the northernmost bank remained stable, while South Stradbroke grew north and east. Both channels have changed orientation, north channel emerging northeast while the southern channel opened south-south-east. Reflection makes analysis of ebb deltas difficult though it appears smaller. Deltaic islands and Swan Bay remain unchanged. More vegetation is apparent on North and South Stradbroke islands. 1987 (Qc 4616, Beenleigh, Run 7 & 8: 1987) Continued growth of the recurved spit has occurred, almost reaching the sand island which has migrated westward. There is dominance of the northern channel, with most waters of Tipplers Passage now entering and leaving this channel. This channel swings northward upon exiting the mouth, thus rounding the bottom of North Stradbroke. Sand bypassing is occurring, as is evident from sand build-up on North Stradbroke. The channel to Swan Bay is wider still, eroding on the western bank with more infilling apparent. 1993 (Qc 4656, Beenleigh, Run 7 & 8: 1993) Recurved spit of South Stradbroke has joined with the sand island to close the southern inlet, very similar to what happened in 1955. The now main northern channel throat is wider than it has been throughout aerial history. The channel branches in two directions when leaving the mouth: east and southeast. The eastern branch is larger and deeper, forking again further out creating a northeast and southeast channel. The northernmost branch of these channels is scouring North Stradbroke. Due to channel configuration the ebb delta has become rather complex. It appears to be undergoing the process of ebb-tidal delta breaching. Entrance to Swan Bay is closing due to movement of its eastern bank, and infilling is significantly increasing. Tipplers Passage is strong, though not as dominant as Canaipa Passage. 1997 It would appear conditions observed in 1997 are very similar to 1993—one channel, possibly narrower, with evidence of further erosion of the downdrift bank. Continued infilling of Swan Bay is occurring.
The evolution of Jumpinpin Inlet
84
Appendix D. Major storm events
The southern Queensland coast is repeatedly subject to major storm events, the most damaging being tropical cyclones and floods. Such weather, especially on top of high tides, culminates to cause coastal destruction. Listed here are storm events having significant impact on the southern Queensland coast over the last 100 years. All information was provided courtesy of Jeff Callaghan from the Bureau of Meteorology, Brisbane. Note: 1. Moreton Bay tide gauge is located in the vicinity of the Brisbane River Mouth. 2. Gold Coast wave recording station is located at Nobby Head at North Burleigh.
Jan 1892 Tropical cyclones recurved over Brisbane. Apr 1892 Tropical cyclones recurved over Brisbane. Jan 1893 Tropical cyclone recurved over Brisbane. Feb 1893 Flood of height 9.25 m in Brisbane River. 0.58 m storm surge measured
on Moreton Bay tide gauge. Feb 1894 Tropical cyclone passed east of Brisbane. 0.58 m storm surge at Moreton
Bay tide gauge. Abnormal high tide at Brisbane. Apr 1894 Severe gales recorded at Cape Moreton. Jan 1896 Tropical cyclone Sigma passed northeast of Townsville. Jan 1897 Reported in the Annual Report to Parliament of 1897 is ‘the great flood of
January 23’ (found in Salter 1984, pp. 114) which swept away many crops of oysters.
Feb 1898 Tropical cyclone Eline recurved over Mackay. Feb 1898 Cyclone passed the centre of the continent then over Brisbane causing
severe gales. Mar 1898 Cyclone passed east of Brisbane. Gales on the south coast. Mar 1899 Tropical cyclone crossed the coast at Princess Charlotte Bay. On Flinders
Island porpoises were found 15.2 m up on the cliffs. Mar 1911 Tropical cyclone passed from the Gulf south through inland Queensland.
Gales along the whole southeast Queensland coast. Jan 1918 Tropical cyclone passed the coast north of Mackay. Record flood at
Rockhampton. Apr 1921 Tropical cyclone passed to the east of Bustard Heads and passed over
Bundaberg, Maryborough and Hervey Bay. Apr 1927 Severe tropical cyclone east of Gold Coast. Record high tide Gold Coast. Feb 1928 Tropical cyclone crossed the coast of Brisbane. Subsequent serious
floods in southeast Queensland. Apr 1928 Low parts of Brisbane flooded. Feb 1931 Major floods in southeast Queensland, flood levels exceed the 1893 flood
levels. Storm surge of 0.76 m on Moreton Bay tide gauge. Severe beach erosion. Currumbin Creek mouth breached.

The evolution of Jumpinpin Inlet
85
Feb 1934 Tropical cyclone tracked from the Gulf to NSW coast. Serious flooding in southeast Queensland, also flooding from storm surges and waves in Moreton Bay. Largest storm surge on record on Moreton Bay tide gauge – 1.16 m.
Mar 1936 Tropical cyclone recurved seaward of Fraser Island. Extensive erosion on
the Gold Coast, the Southport (and Jumpinpin ?) spit was breached. Jan 1938 Tropical cyclone crossed south of Bundaberg. Severe beach erosion at
the Gold Coast. Mar 1938 Tropical cyclone recurved east of Bowen. Gales. Severe beach erosion at
Gold Coast. Mar 1940 Floods in southeast Queensland. Apr 1946 Heavy-to-flood rains in Brisbane. Jan 1947 Tropical cyclone passed near Caloundra. Record floods in southeast
Queensland with water up to telephone wires. 0.55 m storm surge on Moreton Bay tide gauge.
Jan 1948 Severe tropical cyclone passed east of Brisbane and produced a 96 knot
gust at Lord Howe Island. 0.46 m storm surge in Moreton Bay, 1.5 m surge on foreshore.
Jan 1950 Tropical cyclone tracked from Gulf to Sydney. Northeast gales on
Moreton Bay and 2 m waves. Storm surge of 0.58 m. Sea water inundation at Wynnum.
Nov 1950 Tropical low crossed coast near Brisbane. Jan 1951 50 to 60 knot winds on Moreton Bay. Several houses undermined by sea.
Severe erosion at Gold Coast with breaching of Southport spit, which was closed with bulldozer.
Feb 1954 Tropical cyclone crossed coast at Coolangatta. Widespread damage on
Gold and Sunshine coasts and around Brisbane. 0.64 m storm surge on Moreton Bay gauge, however much worse on foreshore. Floods combined with storm surge caused evacuations on the Nerang River.
Jun 1954 Extra tropical cyclone. Mar 1955 Brisbane River floods. Jun 1958 Extra tropical cyclone generating severe erosion. Jan 1959 Tropical cyclone Beatrice crossed near Lismore. Severe beach erosion in
southern Queensland. Jan 1963 Tropical cyclone Annie, rapidly developing tropical cyclone crossed
Sunshine Coast. Fortunately it crossed at low tide as the Moreton Bay tide gauge indicated a 0.76 m storm surge.
Jun 1965 Extra tropical cyclone. Jul 1965 Extra tropical cyclone. Jan 1967 Cyclone Dinah. Houses unroofed along Sunshine and Gold coasts.
Erosion at Gold Coast, with a section of the Esplanade collapsing.

The evolution of Jumpinpin Inlet
86
Mar 1967 Tropical cyclone Elaine moved south-south-east past the south coast.
Severe flooding in Brisbane creeks and Logan River. Further beach erosion.
Apr 1967 Tropical cyclone Glenda moved 500 km east of Brisbane. 6 m waves
recorded off southeast Queensland coast. Severe erosion at Gold Coast. June 1967 Three extra tropical cyclones passed contributing to further erosion. Feb 1972 Cyclone Daisy. Flooding throughout southeast Queensland. Peak swell
height to 8.3 m recorded at Gold Coast. Apr 1972 Severe cyclone Emily crossed the coast southeast of Gladstone
generating huge seas. It claimed the lives of eight seamen off the southern and central Queensland coasts.
Jul 1973 Extra tropical cyclone of a week’s duration. Severe erosion. Jan 1974 Weak cyclone Wanda crossed the coast near Maryborough. Cape
Moreton averaged 56 knot easterlies and torrential rain followed. The 1931 flood level was exceeded in Brisbane. Major floods also affected the Gold Coast. Heavy swells (height to 4.5 m at Gold Coast) caused severe beach erosion along southern Queensland. Maximum storm surge was recorded at 1.0 m between Noosa and Double Island Point.
Feb 1974 Cyclone Pam, very large, intense cyclone passing 500 km east of
Brisbane. A 0.68 m storm surge recorded on Moreton Bay gauge combined with a king tide to give a record 3.13 m high tide. Along the open coast the beaches were already severely eroded due to earlier cyclones and this amplified the effects of wave run-up.
Mar 1974 Zoe crossed the coast at Coolangatta and recurved back out to sea.
Extensive flooding and severe beach erosion along the Gold Coast with a significant wave height of 3.8 m.
Jan 1976 David, huge cyclone, crossed to the north of St Lawrence generating
gales and huge swells from Papua New Guinea to Lord Howe Island. The Port of Brisbane was closed. Tides were up to 1 m above predicted levels.
Feb 1980 Cyclone Ruth. Big tides and heavy swells caused extensive foreshore
erosion along the Gold and Sunshine coasts. The Brisbane wave recording station recorded significant (peak) wave heights of 4.0 m (6.3 m).
May 1980 Extra tropical cyclone. Feb 1981 Cyclone Cliff crossed Fraser Island and made landfall near Bundaberg.
0.7 m storm surge at Gold Coast with large swell. 4.3 m (7.2 m) significant (peak) wave height recorded at Brisbane wave recording station.
Jun 1983 Two extra tropical cyclones. Apr 1984 Cyclone Lance underwent rapid extra tropical transition near and east of
Brisbane. Sustained westerlies reached 60 knots damaging the western side of offshore islands. Huge seas at Gold Coast. 5.1 m (8.8 m) significant (peak) wave height at Brisbane wave recording station.

The evolution of Jumpinpin Inlet
87
Apr 1988 Extra tropical cyclone creating huge swells. Apr 1989 Severe extra tropical cyclone. Very damaging. Feb 1990 Cyclone Nancy crossed near Byron Bay then moved seaward again.
Strongest wind report was a mean wind of 60 knots gusting to 73 knots at Cape Moreton causing damage to houses on offshore islands. Flash flooding south from Brisbane.
Mar 1993 Cyclone Rodger came within 250 km of Fraser Island before turning back
out to sea. Winds and sea closed the Port of Brisbane for the first time since Cyclone David in 1976. Swells came from the north, northeast and east. A storm surge of 0.74 m was measured at the seaway. Significant (peak) wave heights of 7.5 m (13.2 m) at Brisbane wave recording station.
May 1996 Extra tropical cyclone. Severe coastal erosion and flooding in Brisbane.

The evolution of Jumpinpin Inlet
88
Appendix E COPE data
The Beach Protection Authority’s Coastal Observation Programme – Engineering (COPE) was initiated at Currigee, South Stradbroke Island, in 1972. Amongst other things, the programme monitored littoral current. Results for the period 1972 to 1984 are summarised below.