the extending access index: promoting global health - academics
TRANSCRIPT

GLOBAL ADMINISTRATIVE LAW
WORKING PAPERS
The Extending Access Index: Promoting Global Health
NICOLE HASSOUN
Associate Professor
SUNY Binghamton - Department of Philosophy
IRPA Working Paper – GAL Series No. 11/2012
This publication is sponsored by

2
All rights reserved.
No part of this paper may be reproduced in any form
without permission of the author.
Copy Editor: Eleonora Cavalieri
© 2012 NICOLE HASSOUN
Istituto di Ricerche sulla Pubblica Amministrazione
00199, Rome, Italy
www.irpa.eu
Cite as:
N. Hassoun, “The Extending Access Index: Promoting Global Health”, IRPA Working Paper GAL Series n.
11/2012 Finalized 19/10/2012 (www.irpa.eu).
ISSN 2280-868X - IRPA Working Papers
The IRPA - Istituto di ricerche sulla pubblica amministrazione (Institute for research on public
administration) is a non profit organization, founded in 2004 by Sabino Cassese and other professors of
administrative law, which promotes advanced studies and research in the fields of public law and public
administration. The current president is Prof. Luisa Torchia.
Global Administrative Law Steering Committee:
Professors Stefano Battini, Lorenzo Casini; Edoardo Chiti; Mario Savino; Giulio Vesperini.
IRPA Working Papers Steering Committee:
Professors Stefano Battini, Sabino Cassese, Lorenzo Casini, Edoardo Chiti, Bernardo Giorgio Mattarella,
Giulio Napolitano, Aldo Sandulli, Mario Savino, Luisa Torchia, Giulio Vesperini.

The Extending Access Index: Promoting Global Health
Nicole Hassoun
Nicole Hassoun is an associate professor in philosophy at SUNY Binghamton. From 2006-2012 she
was an assistant professor at Carnegie Mellon University affiliated with Carnegie Mellon's Program
on International Relations and the University of Pittsburgh’s Center for Bioethics and Health Law. In
2009-2010 she held a postdoctoral position at Stanford University and visited at the United Nation’s
World Institute for Development Economics Research. She has also been a visiting scholar at the
Center for Poverty Research in Austria and the Center for Advanced Studies in Frankfurt. Her book
Globalization and Global Justice: Shrinking Distance, Expanding Obligations has just appeared with
Cambridge University Press. She has published in journals like the American Philosophical
Quarterly, Journal of Development Economics, The Journal of Applied Ethics, The American Journal
of Bioethics, Public Affairs Quarterly, The European Journal of Philosophy, Environmental Ethics,
and Utilitas.

4
Abstract
Many people around the world cannot access essential medicines for diseases like malaria,
tuberculosis (TB) and HIV/AIDS. One way of addressing this problem is a Global Health Impact
certification system where pharmaceutical companies are rated on the basis of their drugs’ impact on
global health. The best companies, in a given year, will then be allowed to use a Global Health Impact
label on all of their products – everything from lip balm to food supplements. Highly rated companies
will have an incentive to use the label to garner a larger share of the market. If even a small
percentage of consumers promote global health by purchasing Global Health Impact products, the
incentive to use this label will be substantial. An associated Global Health Impact licensing campaign
will also have a big impact. Pharmaceutical companies rely, to a large extent, on university research
and development. So, if universities only allow companies that agree to use Global Health Impact
practices to benefit from their technology, companies will have an incentive to abide by Global Health
Impact standards. The Global Health Impact certification system gives companies a reason to produce
medicines that will save millions of lives (like a new malaria or HIV vaccine). This paper presents a
model rating system that can provide the basis for Global Health Impact certification. It explores
some of the methodological choices underlying the construction of this index and explains how the
model can be improved with further research.
Key Words: Global Health, Index, Extending Access, Essential Medicines

5
Table of Contents
1. Extending access on essential drugs ............................................................................................... 5
2. Model rating system ............................................................................................................................ 6
3.1 Malaria example ............................................................................................................ 12
3.2 TB example ..................................................................................................................... 13
3.3 HIV example ................................................................................................................... 22
3. A Few Concrete Examples: Calculating Novartis’, Lupin Pharmaceuticals’ and
Bristol-Myers Squibb's Scores …………………………………………………………….28
4. Improving the index: questions for future research ............................................................... 28
5. Conclusion ............................................................................................................................................ 28
Appendix 1: Anti-TB drug list .............................................................................................................. 31
Appendix 2: Antiretroviral treatment regimen proportions and efficacies ............................... 32
1. Extending Access on Essential Drugs
Many people around the world cannot access essential medicines to treat diseases like
malaria, tuberculosis (TB) and HIV/AIDS. One way of addressing this problem is a Global
Health Impact certification system where pharmaceutical companies are rated on the basis of
their drugs’ impact on global health. The best companies, in a given year, will then be
allowed to use a Global Health Impact label on all of their products – everything from lip
balm to food supplements. Highly rated companies will have an incentive to use the label to
garner a larger share of the market. If even a small percentage of consumers promote global
health by purchasing Global Health Impact products, the incentive to use this label will be
substantial. If consumption of Global Health Impact goods reaches 1% of the market in
generic and over-the-counter and medications — that will yield about 360 million dollars-
worth of incentive for pharmaceutical companies to become Global Health Impact certified.1
An associated Global Health Impact licensing campaign will also have a big impact.
Pharmaceutical companies rely, to a large extent, on university research and development.
So, if universities only allow companies that agree to use Global Health Impact practices to
This paper was first presented at the 8th Viterbo Global Administrative Law Seminar ―Indicators in Global
Governance‖, held in Rome (Italy), at the Aspen Institute Italia, on June 14-15, 2012
(http://www.irpa.eu/category/gal-section/gal-seminars/).
The model underlying this paper has benefited from significant contributions by the other members of
Academics Stand Against Poverty’s Global Health Impact working group especially Denise Teo Wei Lin.
Angelina Sung, Nathan Lubchenco, George Nardi, Matt Wilson, and Saptarshi Ghose. We would also like to
thank Academics Stand Against Poverty, Stanford University, Carnegie Mellon University, the Falk and
Berkman Foundation, and Justitia Amplificata for their support during various stages of model construction.
Baruch Fishoff, Mark Roberts, Eran Ben-David and others (acknowledged in previous papers on this proposal)
also deserve our sincere thanks. 1 N. Hassoun, ―Global Health Impact‖, Developing World Bioethics (2012): 1471- 8847,
<http://onlinelibrary.wiley.com/doi/10.1111/j.1471-8847.2011.00314.x/abstract>, visited on 1 September 2012.

6
benefit from their technology, companies will have an incentive to abide by Global Health
Impact standards. If 1% of universities sign on to a Global Health Impact licensing campaign,
that will create 840 million dollars-worth of incentive for pharmaceutical companies to
become certified every year.2 That is more than the cost of developing a new drug, even on
the highest estimates, and might double the number of drugs for neglected diseases produced
between in 1975-1999 in a similar time-frame.3 A Global Health Impact certification system
will give companies a reason to produce medicines that will save millions of lives (like a new
malaria or HIV vaccine).4 This paper presents a model rating system that can provide the
basis for Global Health Impact certification. Several of the assumptions it relies upon require
significant refinement. Nevertheless, this paper hopes to illustrate how a good model can be
constructed and open the door to debate about the best ways of doing so.
2. Model Rating System
For Global Health Impact certification to be a good idea, the rating system upon which a
label relies must be objective and output-based. For the Global Health Impact label, the
objective is to design a rating system that can incentivize companies to extend access on
essential medicines globally. Towards this end, companies should be able to impact their
rating and, if companies’ scores improve, that should improve global health.
Consider, here, a preliminary model evaluating the impact of all first-line drugs for
HIV/AIDS, TB, and (p. falciparum) malaria as they are some of the diseases with the largest
global health impact for which good data is available globally.
2 Ibid
3 P. Trouiller, E. Torreele, P. Olliaro, N. White, S. Foster, D. Wirth, and B. Pécoul, ―Drugs for Neglected
Diseases: A Failure of the Market and A Public Health Failure?‖, Tropical Medicine and International Health, 6
(2001): 945-51. 4 N. Hassoun, ―Global Health Impact‖, Developing World Bioethics (2012): 1471 – 8847,
<http://onlinelibrary.wiley.com/doi/10.1111/j.1471-8847.2011.00314.x/abstract>, visited on 1 September 2012.
N. Hassoun, ―Measuring Global Health Impact: Incentivizing Research and Development of Drugs for
Neglected Diseases‖, P. Lenard and C. Straehle (eds.), Justice and Global Health Inequalities, Global Justice
and Human Rights Series, (Edinburgh University Press, Edinburgh, 2012).

7
Company
Rankings
The model was completed in two (rough) steps. First, we estimated the impact of each drug.
Second, we ranked companies by aggregating their drugs’ impact on global health. This will
allow us to rate companies based on their relative (or absolute standing). Several of the
assumptions the model relies upon could benefit from significant refinement. Nevertheless,
what follows explains the basic structure of this model.
To evaluate the impact of each drug globally, we consider the impact of each drug in each
country where that drug is a first-line therapy. Roughly, this requires information on the need
for different essential medicines (e.g. the death and disability due to the diseases they treat),
information about access to the drug (e.g. treatment percentages), and information about drug
effectiveness (e.g. efficacy estimates). Initially, the drug’s impact will be
Need*Access*Effectiveness. The need for different essential medicines is calculated in
Disability Adjusted Life Years (DALYs) lost to the diseases they treat. Information about
access to the drugs is an estimate of the number of people with access to treatment divided by
the number of people who need treatment for each drug in each country.5 In the model,
treatment percentages at the country-drug level are sometimes approximated by the percent of
people receiving treatment for the disease in a country. Finally, we use estimates of drugs’
efficacy from clinical trial data as it is collected in a systematic and comparable way and
better data is not available.
A slightly simplified, hypothetical, example will help explain the basic idea. Again, the
drug’s impact in the model is, roughly, Need*Access*Effectiveness. Suppose, for instance,
100 million DALYs are lost per annum to a disease treatable with a drug that reduces the
5 A measure of access over which companies have complete control and responsibility would be even better but
it is hard to think of such an indicator.

8
impact of the disease by 80%, on average. If 50% of the population that needs it has access to
it, the drug will save 80 million DALYs (100*.8*.5 = 40).6
Good data is available on all of the components of the rating system but data on efficacy
globally is sometimes sparse. We hope to build models that will predict drug efficacy at the
country-level when that data is not available from clinical trials. For now, however, we are
simply averaging the efficacy estimates from clinical trial data and imputing this to countries
missing efficacy information to arrive at a global estimate.7
Sample Data: Collected Artemether-Lumafantrine Efficacy Information8
Sample Data: Multi Drug-Resistant Tuberculosis % Treatment Coverage
6 To deal with the ―me-too‖ problem it is possible to consider drugs’ marginal impact. This may be important for
some HIV/AIDS medicines but it is also difficult to know where the problem is occurring and to decide on the
appropriate comparators. See: J. Bloom, ―Me-too? Says Who? (Medical Progress Today)‖ Medical Council on
Science and Health, (2012), <http://www.acsh.org/news/newsID.1992/news_detail.asp>, visited on 4 April
2012. Moreover, there are other ways of addressing this problem. Finally, higher-priced but only slightly more
effective drugs will probably not attract a large market share and so the percentage of patients receiving me-too
drugs may remain small. In any case, we do not try to address that problem here. 7 So far, we have completed a systematic review of efficacy data for the main first-line drugs for malaria and
use estimates for HIV/AIDS and TB. 8 Contact authors for source data.

9
Colors in each region denote the % treatment coverage for TB: red being 0% treatment coverage and
green being 100% treatment coverage.9
Again, once impact is calculated, companies can be rated on the basis of their drugs’
aggregate contribution to alleviating the global burden of disease. Here is a visual illustration
of the rating system’s main components that feed into the overall rating.
Right now the impact of drugs for HIV/AIDS is most important in our model. This is driven
by the DALY and treatment percentage estimates we are using which may be higher for
9 Author’s calculations from the following source: World Health Organization, ―Tuberculosis (TB)‖, Data for
Global Tuberculosis Control 2011. Country Data, Case Notifications, World Health Organization: Geneva,
(2012), <http://who.int/tb/country/data/download/en/index.html> visited on 20 August 2012. Columns:
e_inc_num on the estimates sheet and dst_mdr_sld, dst_mdr, and dst on the notifications sheet.

10
diseases like HIV than for diseases like malaria (which are extremely rare in developed
countries where better data is available).10
Percent DALYs Lost to Each Disease
11 Percent Estimated DALYs Averted for Each Disease
Impact Scores by Company
Percent of Total DALYS Averted
DALYs lost to HIV
10
We have not yet considered drug interactions or side effects. Part of the reason these DALY estimates are
poor is that the methods for estimating DALYs lost to p. falciparum malaria (and perhaps TB) in the GBD study
probably greatly underestimate the need for these drugs. Better estimates may be available from other sources R.
Snow, M. Craig, U. Deichman, and K. Marsh, "Estimating Mortality, Morbidity and Disability due to Malaria
Among Africa's Non-Pregnant Population", World Health Organization: Geneva, (1999). R. W. Snow, M. H.
Craig, C. R. J. C. Newton, and R. W. Steketee, ―The Public Health Burden of Plasmodium Falciparum Malaria
in Africa: Deriving the Numbers‖, Disease Control Priorities Project, 11, (2003). 11
World Health Organization, "Table 2. Estimated Total DALYs ('000), By Cause and WHO Member State,
2004 (a, m)", World Health Organization: Geneva, (2009).
11
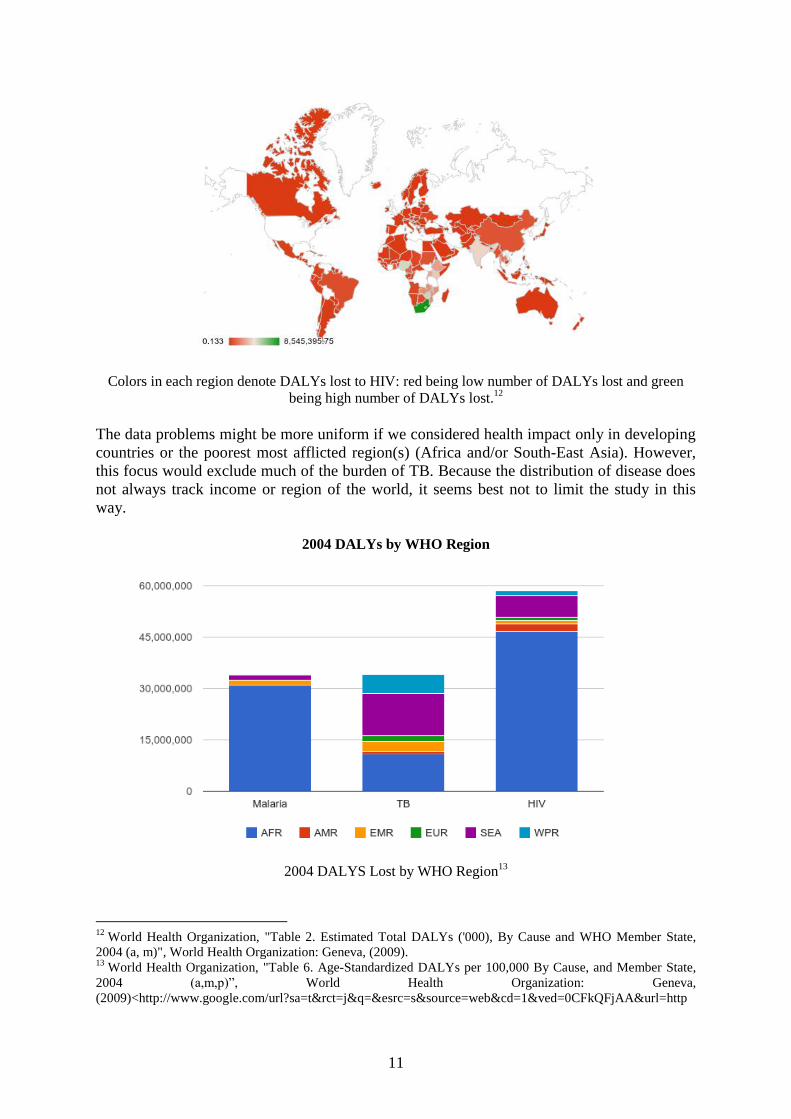
Colors in each region denote DALYs lost to HIV: red being low number of DALYs lost and green
being high number of DALYs lost.12
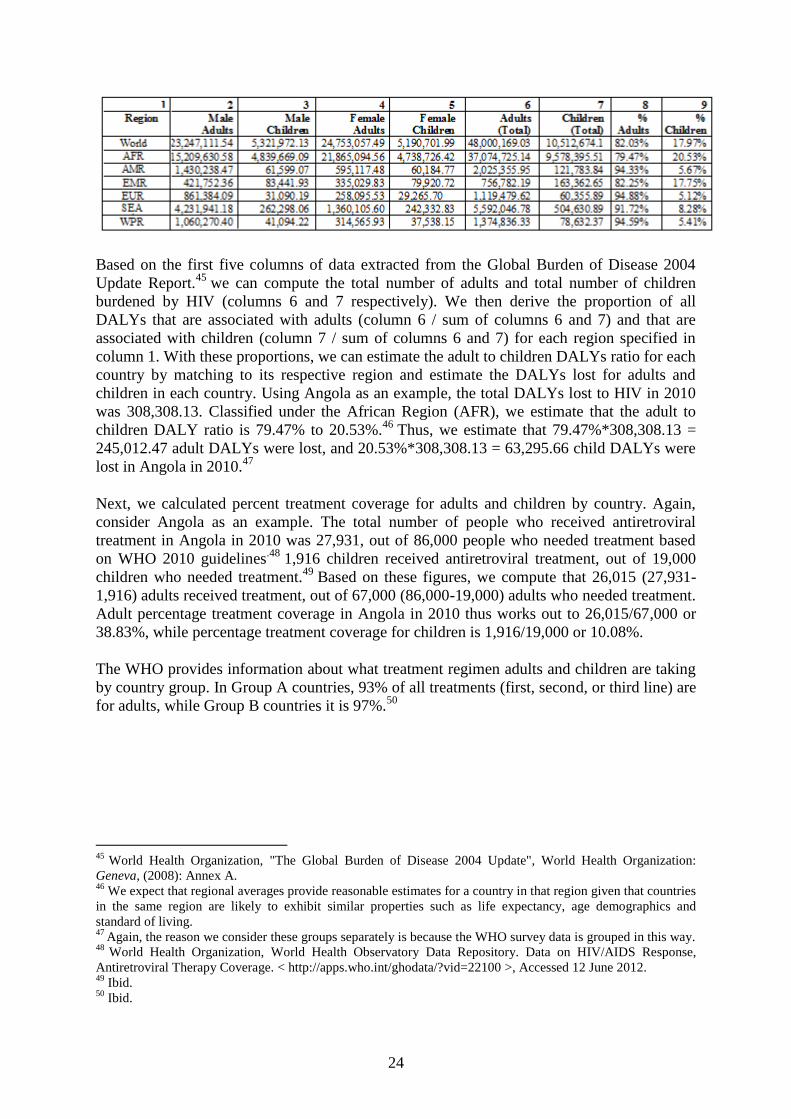
The data problems might be more uniform if we considered health impact only in developing
countries or the poorest most afflicted region(s) (Africa and/or South-East Asia). However,
this focus would exclude much of the burden of TB. Because the distribution of disease does
not always track income or region of the world, it seems best not to limit the study in this
way.
2004 DALYs by WHO Region
2004 DALYS Lost by WHO Region13
12
World Health Organization, "Table 2. Estimated Total DALYs ('000), By Cause and WHO Member State,
2004 (a, m)", World Health Organization: Geneva, (2009). 13
World Health Organization, "Table 6. Age-Standardized DALYs per 100,000 By Cause, and Member State,
2004 (a,m,p)‖, World Health Organization: Geneva,
(2009)<http://www.google.com/url?sa=t&rct=j&q=&esrc=s&source=web&cd=1&ved=0CFkQFjAA&url=http

12
3. A Few Concrete Examples: Calculating Novartis’, Lupin Pharmaceuticals’ and Bristol-
Myers Squibb's Scores
It will help to consider some real examples of how companies focusing on malaria, TB, and
HIV/AIDS’s scores were calculated. (No company in our sample makes drugs for more than
one disease but some make more than one drug).
3.1 Malaria Example
Consider an example of how Novartis’ score was calculated. Novartis is credited only for one
anti-malarial: Artemether-Lumefantrine. So its score is based entirely on Artemether-
%3A%2F%2Fwww.who.int%2Fhealthinfo%2Fglobal_burden_disease%2Fgbddeathdalycountryestimates2004.x
ls&ei=oQ4xUKTqENL46QH5-YCgBQ&usg=AFQjCNFaB2O3wzTGY2HVWp2f-863ErO-
Tg&sig2=hOlV5YixqJtK_VHA30a0cg>, visited on 5 September 2012.

13
Lumefantrine’s score. Artemether-Lumefantrine is a first-line drug in Angola, so consider
how its impact in Angola was calculated. 784,000 DALYs were lost to malaria in Angola in
2004.14
100% of the malaria in Angola was p. falciparum malaria15
so the full 784,000
DALYs were lost to p. falciparum malaria. The treatment coverage was 11%. Clinical trials
in Angola suggested that Artemether-Lumefantrine was 96.4% effective.16
So the estimated
impact of Artemether-Lumefantrine for Angola is (784,000*.11*.964) = 83,135.36 DALYs
saved. The above process was repeated for every country where Artemether-Lumefantrine
was a first-line drug, so that an impact score for every country was obtained. To get the total
impact score for Norvatis, we summed the scores for all of these countries. The total impact
score for Novartis was 4,641,166.66 DALYs saved.
Given limited data on clinical trials for p. falciparum malaria in different countries, the
malaria scoring model has fall-back data points in cases where specific data is not available.
If specific country-level treatment coverage for the first-line drug is not available, the global
average treatment coverage for that drug is used instead. If global average treatment coverage
for that drug is also unavailable, the country-specific artemisinin-based combination therapy
(ACT) treatment coverage is used in place.17
Finally, if country-specific ACT treatment
coverage is unavailable, the global average ACT treatment coverage is used. For instance, if
the first-line therapy for, say, Afghanistan is a combination of Artesunate and Sulfadoxine-
Pyrimethamine (AS+SP), then first-line therapy efficacy shall reflect the efficacy of AS+SP
in Afghanistan. If this efficacy data is not available, the global average efficacy of AS+SP is
used instead.
In cases where there are more than one first-line drug for a country, an average is taken
across each drug’s treatment coverage. For instance, the first-line for Chad is a combination
of Artesunate and Amodiaquine (AS+AQ), and Artemether-Lumefantrine (AL). Thus, Chad’s
first-line drug efficacy reflects the average of AS+AQ’s efficacy in Chad and AL’s efficacy
in Chad.
3.2 TB Example
14
This is the year of the latest available GBD study data World Health Organization, "Table 6. Age-
Standardized DALYs per 100,000 By Cause, and Member State, 2004 (a,m,p)‖, World Health Organization:
Geneva, (2009),
<http://www.google.com/url?sa=t&rct=j&q=&esrc=s&source=web&cd=1&ved=0CFkQFjAA&url=http%3A%
2F%2Fwww.who.int%2Fhealthinfo%2Fglobal_burden_disease%2Fgbddeathdalycountryestimates2004.xls&ei=
oQ4xUKTqENL46QH5-YCgBQ&usg=AFQjCNFaB2O3wzTGY2HVWp2f-863ErO-
Tg&sig2=hOlV5YixqJtK_VHA30a0cg>, visited on 5 September 2012. 15
Again, this is the main contributor to the GBD due to malaria and, so, we focused on this kind of malaria in
creating our model. World Health Organization World Health Organization, "WHO World Malaria Report
2011", World Health Organization: Geneva, (2011): p. 53. 16
Please contact authors for relevant data collected via a systematic review of first-line malaria drugs’ efficacy. 17
For relevant treatment coverage data see: World Health Organization. ―World Malaria Report 2008‖ World
Health Organization: Geneva, (2008).
<http://whqlibdoc.who.int/publications/2008/9789241563697_eng.pdf>, visited on 17 August 2012. Also
see: World Health Organization, "Malaria: Country Profiles." World Health Organization: Geneva, (2011).
<http://www.who.int/malaria/publications/country-profiles>, visited on 17 August 2012.

14
Calculating Lupin Pharmaceuticals’ final impact score was a bit more difficult for three
reasons. First, it makes two first-line anti-TB drugs (Rifampicin and Ethambutol) that are
used in combination with two other drugs (Isoniazid and Pyrazinamide) from other
companies. Lupin also makes one of the second-line anti-TB drugs -- Levofloxacin -- for
Extensively Drug-Resistant (XDR) TB treatment that is used with at least one injectable
second-line agent and Cycloserine (which are also from other companies). Moreover,
Rifampicin, Ethambutol, Isoniazid and Pyrazinamide are used for different lengths of time as
a first-line treatment and Rifampicin, Ethambutol, and Pyrazinamide are used primarily to
prevent resistance from Isoniazid from developing. So it is difficult to decide how to credit
the different drugs in the combination and extract Ethambutol’s and Isoniazid’s impact. A
similar problem is also seen when attempting to credit Lupin Pharmaceuticals for
Levofloxacin since it is used in a combination therapy (for XDR-TB). Second, for TB and
HIV/AIDS it was also important to consider interactions between the diseases and the drugs.
People with HIV/AIDS are highly susceptible to TB and those who contract it should finish
their TB medicine, if possible, before starting treatment for HIV/AIDS. Otherwise resistance
to the HIV/AIDS medications develops, but protocols differ for different disease states and
drugs. Finally, people with different disease-states (e.g. latent versus active TB) and different
levels of resistance to different drugs (e.g. Multidrug-Resistant or MDR-TB, Extensively
Drug-Resistant or XDR-TB, and Totally Drug-Resistant or TDR-TB) receive different
treatment.
In our preliminary TB model, we have attempted to deal with some of these problems. The
chart below outlines the breakdown of different patient groups we considered in crediting
companies for anti-TB drugs.
Our current model considers three broad categories of drug resistance in TB: Drug-
Susceptible (or "Normal") TB, MDR-TB and XDR-TB. TDR-TB is excluded from the
current model as, thus far, only a small number of TDR-TB cases have been reported.18
We
attempted to disaggregate the impact of anti-TB drugs into the remaining three levels of
resistance. For Drug-Susceptible TB, we also consider the difference in drugs’ impacts on
18
The first two cases of TDR-TB were reported in 2007 in Italy. Subsequently, 15 cases were found in Iran in
2009 and 12 in India since 2009. Z. T. Udwadia, " MDR, XDR, TDR Tuberculosis: Ominous Progression",
Mumbai: Hinduja Hospital and Research Center, (2008),
<http://www.tbonline.info/media/uploads/documents/thoraxjnl-2012-20166.pdf>, visited on 7 June 2012.
All TB Incident Cases
Drug-Susceptible ("Normal") TB MDR-TB XDR-TB
HIV+ HIV-
Latent TB Latent TB Active TB Active TB

15
HIV+ versus HIV- TB cases. Finally, because different treatment regimens are used for latent
and active TB, they were also differentiated in the model.
Most anti-TB treatment is a combination therapy. The contribution of each drug should sum
to the overall impact of the therapy. Eventually we hope to extract the impact of individual
drugs within a combination therapy along these lines (using the standard treatment for active
TB as an example): To calculate the impact of each drug for active TB treatment
(Rifampicin+Ethambutol+Isoniazid+Pyrazinamide), we need to construct some estimate of
what Isoniazid’s efficacy would have been were it used as a monotherapy, and subtract that
value from the impact of the combination at any given point in time.19
We have yet to try to
do this. For simplicity sake, we assume that each drug carries equal weight in any given
regimen and credit the drugs equally. Each of the four drugs gets a quarter of the credit for
the regimen’s impact.
Although we lack data on a few countries, most specify that the treatment for active TB is the
standard first-line regimen of Rifampicin, Isoniazid, Ethambutol and Pyrazinamide described
above. We assume this is the case for all countries.
The treatment regimen for MDR-TB is more complex due to the possibility of patients being
resistant to different combinations of first-line anti-TB drugs. The following table
summarizes the various types of MDR-TB regimens considered in our model:20
Like the approach taken with the standard first-line regimen, each drug is given equal weight
in its regimen. As we have yet to disaggregate MDR-TB cases into specific resistant cases,
we assume for now that each of the seven types of resistant cases has equal prevalence.
The treatment regimen considered for XDR-TB consists of Cycloserine, at least one
injectable second-line agent, and one fluoroquinolone.21
19
This is because, as noted above, the other drugs are used primarily to prevent resistance to Isoniazid from
developing. We might create the necessary model by estimating how resistance rates would have evolved from
past estimates of resistance rates and a model of the relationship between resistance and efficacy. 20
World Health Organization, "Guidelines for the Management of Drug-Resistant Tuberculosis", World Health
Organization: Geneva, (1997): p. 33-35.

16
Each drug in this regimen is given equal weight in our model.
Given the abovementioned basis of our model, the first step in calculating Lupin
Pharmaceuticals' impact score is as follows: Taking Botswana as an example country, we see
that 16,855.46 DALYs are lost to TB in Botswana.22
In 2010, 10,000 incident cases of TB were reported according to the WHO23
, 80% of
registered cases were tested for HIV status, and 65.43% of TB cases with known HIV status
were HIV positive.24
So 8,000 (80% of 10,000) TB incident cases were tested for HIV, and
the breakdown of HIV positive to HIV negative cases was 5,235 (65.43% of 8,000) to 2,765
(34.57% of 8,000). In countries where data is not available regarding the proportion of TB
incident cases with known HIV cases, an estimate was derived. This was done by calculating
the average proportion of known HIV status in countries for a particular WHO region where
we have data, as well as the average population across these same countries. This was
repeated for all six regions.25
To estimate the proportion of known HIV status in any
particular country X, we take the population of X divided by the average population figure
for X's region and multiply by the average proportion of known HIV status in that same
region.26
The next step involves breaking down incident cases into Drug-Susceptible TB, MDR-TB
and XDR-TB. We start with MDR-TB first. Drug Susceptibility Tests (DST) on first-line
anti-TB drugs are done to confirm if a patient is multidrug-resistant. In Botswana, 947 TB
cases received DST in 2010, of which 106 were confirmed to be MDR-TB. This leads to a
MDR-TB proportion of 11.19%.27
21
The possible injectable second-line agents are Kanamycin, Amikacin, and Capreomycin, and the possible
floroquinolones include Levofloxacin, Moxifloxacin, Gatifloxacin, and Ofloxacin. This recommendation is
based on a study done on XDR-TB treatment in Lima, Peru. C. D. Mitnick, S. S. Shin, K. J. Seung, M. L. Rich,
S. S. Atwood, J. J. Furin, and M. C. Becerra, "Comprehensive Treatment of Extensively Drug-Resistant
Tuberculosis", The New England Journal Of Medicine, 359, 6 (2008),
<http://www.nejm.org/doi/pdf/10.1056/NEJMoa0800106>, visited on 7 May 2012. 22
World Health Organization, "Table 2. Estimated Total DALYs ('000), By Cause and WHO Member State,
2004 (a, m)", World Health Organization: Geneva, (2009). 23
Estimated number of incident cases (all forms) in 2010. Author’s calculations from the following sources:
Column e inc num on the estimates sheet World Health Organization, ―Tuberculosis (TB)‖, Data for Global
Tuberculosis Control 2011. Country Data, Case Notifications, World Health Organization: Geneva, (2012),
<http://who.int/tb/country/data/download/en/index.html> visited on 20 August 2012. 24
Data from: World Health Organization, ―Tuberculosis (TB)‖, Data for Global Tuberculosis Control 2011.
Country Data, Case Notifications, World Health Organization: Geneva, (2012),
<http://who.int/tb/country/data/download/en/index.html> visited on 20 August 2012. 25
The six WHO regions are: African Region (AFR), Region of the Americas (AMR), Eastern Mediterranean
Region (EMR), European Region (EUR), South East Asia Region (SEA) and Western Pacific Region (WPR). 26
In 2010, HIV testing among TB patients reached 34% globally, 59% in the African Region and 75% in 68
countries. World Health Organization, "Global HIV/AIDS Response: Progress Report 2011", World Health
Organization: Geneva, (2011).This estimation technique allows us to maintain the 34% global testing rate. 27
New and re-treatment patients who received diagnostic drug susceptibility testing (DST, including rapid tests)
in 2010. Author’s calculations from the following source: World Health Organization, ―Tuberculosis (TB)‖,
Data for Global Tuberculosis Control 2011. Country Data, Case Notifications, World Health Organization:

17
Assuming that this is a representative proportion, we extend this same proportion to all TB
incident cases in Botswana. In other words, we estimate that 11.19% of 10,000 incident cases
in Botswana are MDR-TB cases, working out to 1,119 cases that require MDR-TB treatment.
Based on 2010 WHO data, 114 individuals received MDR-TB treatment in Botswana.28
So
our estimated treatment coverage was 10.18%. To compute the DALYs lost to MDR-TB in
Botswana, we use the same MDR-TB proportion of 11.19% to estimate that 1,886.67 DALYs
were lost in 2010.29
Because treatment coverage in Botswana is 10.18% (and we assume this
is representative across all MDR-TB cases), the impact of any MDR-TB regimen in
Botswana comes to 153.72. Impact is calculated by DALYs lost to MDR-TB * MDR-TB
treatment coverage * efficacy of MDR-TB treatment. MDR-TB treatment is approximately
80% efficacious.30
Thus, we estimate that 1,886.67 * 10.18% * 80% or 153.72 DALYs are
averted by drugs for MDR TB in Botswana.
For XDR-TB, DSTs are done on second-line anti-TB drugs to confirm if MDR-TB cases are
extensively drug-resistant. In Botswana, 24 MDR-TB cases received second-line DST in
2010, and out of which one case was confirmed to be extensively drug-resistant.31
The
proportion of XDR-TB among MDR-cases that received second-line DST thus works out to
4.17%, and again we assume that we can extend this proportion to all MDR-TB cases.
Multiplying this XDR-TB proportion to the total number of MDR-TB cases in Botswana, we
have 4.17% out of 1,119 MDR-TB cases (or 47 cases) being extensively drug-resistant. We
have yet to obtain good data regarding country-level treatment coverage for XDR-TB. Hence,
we use global treatment coverage of 43% as an estimate.32
Since 4.17% of MDR-TB cases
are XDR-TB, we assume that this proportion is also representative of the DALYs lost to
XDR-TB. Hence, we estimate that 4.17% of 1,886.67 DALYs lost to MDR-TB in Botswana
in 2010 or 78.61 DALYs were lost to XDR-TB in Botswana. Efficacy of XDR-TB treatment
is estimated at 55%.33
Thus the impact of XDR-TB treatment in Botswana in 2010 is 78.61
DALYs lost * 43% treatment coverage * 55% efficacy = 18.59.
Geneva, (2012), <http://who.int/tb/country/data/download/en/index.html> visited on 20 August 2012. Columns:
dst and dst_mdr on the notifications sheet 28
Confirmed MDR-TB cases started on treatment with second-line drugs in 2010. Author’s calculations from
the following sources: Column dst_mdr sld on the notifications sheet World Health Organization, ―Tuberculosis
(TB)‖, Data for Global Tuberculosis Control 2011. Country Data, Case Notifications, World Health
Organization: Geneva, (2012), <http://who.int/tb/country/data/download/en/index.html> visited on 20 August
2012. 29
This assumption can be improved upon as more DALYs are probably lost to the average MDR TB case than
to drug-susceptible TB (similarly for XDR TB). 30
The treatment of MDR-TB has reported cure rates over 80%, especially true when fluoroquinolones and
adjuvant surgical therapy are used. Sandoz, "MDR-TB‖, (2006),
<http://www.tbdots.com/site/en/doctor_section_tb_mdr.html>, visited on 20 February 2012.Note that in the case
of malaria, efficacy data relied upon is based on clinical trial data. Please contact authors for relevant data. 31
MDR cases that received 2nd-line DST and DR cases that received 2nd-line DST found to have XDR-TB in
2010. Author’s calculations from the following sources: World Health Organization, ―Tuberculosis (TB)‖, Data
for Global Tuberculosis Control 2011. Country Data, Case Notifications, World Health Organization: Geneva,
(2012), <http://who.int/tb/country/data/download/en/index.html> visited on 20 August 2012. Columns: dst mdr
sdst and dst_mdr_sldst_xdr on the notifications sheet. 32
Treatment coverage in 2008 for XDR-TB is estimated at 43 3% globally. World Health Organization, "2007-
2008 XDR & MDR Tuberculosis Global Response Plan", World Health Organization: Geneva, (2008).World
Health Organization, "Implementing the WHO Stop TB strategy: A Handbook for National Tuberculosis
Control Programmes", World Health Organization: Geneva, (2008). 33
Several countries with good TB control programmes have shown that cure is possible for up to 50–60% of
affected people. StopTB, "Extensively Drug-Resistant Tuberculosis (XDR): The Facts", (2007),

18
Finally, we look at the treatment for Drug-Susceptible (or "Normal") TB. As mentioned
earlier, we assume that the DALYs lost to TB in general comes from the DALYs lost to
Drug-Susceptible TB, MDR-TB and XDR-TB. Based on this assumption, the DALYs lost to
Drug-Susceptible TB for Botswana in 2010 comes to 14,968.78. Approximately 30% of TB
patients that are co-infected with HIV have active TB.34
Previously we calculated that the
number of HIV+ and HIV- cases among incident cases with known HIV status in Botswana
were 5,235 and 2,765 respectively (of 8,000 cases in total). This means that among 5,235
HIV+ cases in Botswana, there are 3,664 latent TB cases (70% of 5,235) and 1,570 active TB
cases (30% of 5,235). It is estimated that 7.5% of HIV- TB cases have active TB.35
Thus
among 2,765 HIV- cases in Botswana, there are 2,558 latent TB cases (92.5% of 2,765) and
207 active TB cases (7.5% of 2,765). Given these figures, we derive that the proportions of
latent versus active TB among HIV+ and HIV- cases are as follows:
Latent TB / HIV+: 3,664 / 8,000 = 45.80%
Active TB / HIV+: 1,570 / 8,000 = 19.63%
Latent TB / HIV-: 2,558 / 8,000 = 31.98%
Active TB / HIV-: 207 / 8,000 = 2.59%
Here we assume that the proportions of each type of TB above can be extended to DALYs
lost to each type.36
With total DALYs lost to Drug-Susceptible TB at 14,968.78 in 2010 in
Botswana, DALYs lost to each type of TB are calculated as follows:
Latent TB / HIV+: 45.80% * 14,968.78 = 6,855.99
Active TB / HIV+: 19.63% * 14,968.78 = 2,938.28
Latent TB / HIV-: 31.98% * 14,968.78 = 4,786.43
Active TB / HIV-: 2.59% * 14,968.78 = 388.09
We have yet to get good treatment coverage data at the country level for each of the above
cases. Thus for now we use the WHO’s estimate of the prevalence of directly observed
treatment short-course (DOTS) coverage of 69.5% for all cases.37
Estimated efficacy for
<http://www.stoptb.org/events/world_tb_day/2007/assets/documents/5.5%20XDR%20TB.pdf>, visited on 8
March 2012. 34
P. P. Gibson, Evidence-Based Respiratory Medicine (Oxford: Blackwell, 2005): p. 312. 35
The risk for HIV negative people of progressing from latent to active TB is about 5-10%. World Health
Organization (WHO), "2007-2008 XDR & MDR Tuberculosis Global Response Plan", World Health
Organization: Geneva. (2008). World Health Organization (WHO), "Implementing the WHO Stop TB strategy:
A Handbook for National Tuberculosis Control Programmes", World Health Organization: Geneva, (2008). For
our model we took the average of this range (7.5%). 36
We recognize that the impact of latent TB on any affected individual is likely to be lower as compared to one
infected with active TB. This implies that latent TB contributes to a smaller proportion of DALYs lost as
compared to active TB, and the former should ideally be given less weight. However, for now we assume that
latent and active TB attribute to DALYs lost with equal weight. Future improvements to the model will account
for weight differences. 37
According to the WHO, there were 8.8 million incident cases of TB in 2010 and of which 5.8 million cases
were diagnosed, notified, and treated under the DOTS approach. World Health Organization, ―Global
Tuberculosis Control 2011‖, World Health Organization: Geneva, (2011). This is 65.9% coverage (5.8 million
out of 8.8 million). For now, we use this as basis for assumption of treatment coverage for Drug-Susceptible TB
given that this group makes up the majority of TB cases (MDR-TB, XDR-TB and TDR-TB form a minority
proportion of TB incident cases).

19
latent TB treatment in general is 90%38
and that for active TB treatment is also 90%.39
Thus,
impact scores for each case are calculated by DALYs lost * treatment coverage * treatment
efficacy:
Latent TB / HIV+: 6,855.99 * 69.5% * 90% = 4,066.29
Active TB / HIV+: 2,938.28 * 69.5% * 90% = 1,742.69
Latent TB / HIV-: 4,786.43 * 69.5% * 90% = 2,838.83
Active TB / HIV-: 388.09 * 69.5% * 90% = 230.18
The following table provides a quick summary for all the scores we have calculated thus far
for each scenario for Botswana in 2010:
(Recall that, in this model, we only consider the breakdown of latent versus active TB for
Drug-Susceptible ("Normal") TB while MDR and XDR TB are modeled in a more generic
context without such breakdowns.) 40
The next step is to disaggregate these scores into the corresponding drugs that are involved in
the treatment of Drug-Susceptible TB, MDR-TB and XDR-TB.
Drug-Susceptible TB Treatment Regimen (Latent)
Since latent TB treatment consists of just Isoniazid, Isoniazid receives full credit for the
impact in latent TB treatment.
Drug-Susceptible TB Treatment Regimen (Active)
38
H. M. Blumberg, M. K. Leonard, and R. M. Jasmer, "Update on the Treatment of Tuberculosis and Latent
Tuberculosis Infection", The Journal of the American Medical Association, 293, 22 (2005),
<http://jama.jamanetwork.com/article.aspx?volume=293&issue=22&page=2776#LatentTBInfection>, visited
on 9 May 2012.
39 World Health Organization, ―Global Tuberculosis Control 2011‖, World Health Organization: Geneva, (2011):
p. 71. 40
Again, impact score is calculated as follows: DALYs lost * treatment coverage * treatment efficacy

20
Again, we assume the impact of each drug in the standard 6-month regimen for active TB is
equal.41
MDR-TB Treatment Regimens
A total of 7 MDR-TB regimens are considered in this model. We give equal credit to each
regimen for MDR-TB treatment (i.e. each regimen gets 1/7 of MDR-TB treatment impact
scores) since we have yet to obtain data regarding to what extent each MDR-TB regimen is
used for each country. Within each regimen, each drug is also given equal credit. The
proportion of credit given to each drug in each of the 7 regimens is shown in the right column
in the table below.
41
It is clear, however, that some of the drugs in combination therapies like this may be more important than
others, e.g. if they are included only to prevent resistance from developing and are easily replaceable by
alternative drugs.

21
XDR-TB Treatment Regimen
We also gave proportionate weight to each drug in the above XDR-TB regimen.

22
For Botswana, we disaggregate the scores as follows: 42
Again, since this example is for Lupin Pharmaceuticals' impact score, we only focus on the
drugs by this company: Rifampicin, Ethambutol and Levofloxacin. The impact score for
Rifampicin, Ethambutol and Levofloxacin in Botswana is simply the sum of individual scores
in the table above that are associated with Rifampicin, Ethambutol, and Levofloxacin
respectively. The total score for Lupin Pharmaceuticals is the summation across all countries
in the model, which sums up to 677,939.57.
3.3 HIV Example
Finally, consider how we calculate Bristol-Myers Squibb's score. Bristol-Myers Squibb
makes these antiretroviral drugs for HIV: Didanosine, Stavudine and Efavirenz. Again, we
set aside questions about interactions between HIV drugs and others for a rough estimate of
efficacy.
42
Given that an impact score of 153.72 for MDR TB in the table below is to be "shared" (assuming equal
"sharing") among seven possible MDR-TB treatment regimens, each regimen gets an impact score of 153.72/7
or 21.96. To breakdown this score further for each drug in each regimen, this score of 21.96 is to be "shared"
(assuming equal "sharing" again) among all the drugs in each regimen. Taking the first MDR-TB regimen as an
example: (Kanamycin or Amikacin or Capreomycin)+ Ethambutol + Pyrazinamide + Ofloxacin --- we divide
the score of 21.96 by four (we take "Kanamycin or Amikacin or Capreomycin" as "one drug") such that
Ethambutol, Pyrazinamide and Ofloxacin gets 5.49 each. Only one of (Kanamycin or Amikacin or
Capreomycin) is used in this treatment regimen, so we give each drug a score of 5.49/3 or 1.83 assuming each
drug has an equal one in three chances of being used in this regimen. This same methodology is used to get
individual drug scores for all the seven MDR-TB regimens. Then sums for each drug (in all the regimens in
which it is used) are calculated.

23
Finally, consider how we calculate Bristol-Myers Squibb's score. Bristol-Myers Squibb
makes these antiretroviral drugs for HIV: Didanosine, Stavudine and Efavirenz. Again, we
set aside questions about interactions between HIV drugs and others for a rough estimate of
drug efficacy.
The HIV scoring model is based on WHO data collected from mid- and low-income countries
affected by HIV that responded to the WHO AIDS Medicines and Diagnostics Service
(AMDS) survey.43
These countries were classified by the WHO as either "Group A" or
"Group B" countries. The following table shows the list of countries that responded to the
WHO AMDS survey.44
Again the general formula for calculating the impact score for any drug is DALYs * %
Treatment Coverage * Drug Efficacy. Because the WHO presents statistics for adults
(defined as 15 years of age and above) and children (defined as below 15 years of age)
separately, the model starts by calculating impact for these patient groups.
First, we found the following breakdown of DALYs due to HIV by region, gender and age:
43
We extrapolate to all countries in the world. 44
Data extracted from World Health Organization, "Antiretroviral Medicines in Low- and Middle-Income
Countries: Usage in 2010 with Global and Regional Demand Forecast for 2011 - 2012", World Health
Organization: Geneva, (2010): p. 40 (Table 25).
24
Based on the first five columns of data extracted from the Global Burden of Disease 2004
Update Report.45
we can compute the total number of adults and total number of children
burdened by HIV (columns 6 and 7 respectively). We then derive the proportion of all
DALYs that are associated with adults (column 6 / sum of columns 6 and 7) and that are
associated with children (column 7 / sum of columns 6 and 7) for each region specified in
column 1. With these proportions, we can estimate the adult to children DALYs ratio for each
country by matching to its respective region and estimate the DALYs lost for adults and
children in each country. Using Angola as an example, the total DALYs lost to HIV in 2010
was 308,308.13. Classified under the African Region (AFR), we estimate that the adult to
children DALY ratio is 79.47% to 20.53%.46
Thus, we estimate that 79.47%*308,308.13 =
245,012.47 adult DALYs were lost, and 20.53%*308,308.13 = 63,295.66 child DALYs were
lost in Angola in 2010.47
Next, we calculated percent treatment coverage for adults and children by country. Again,
consider Angola as an example. The total number of people who received antiretroviral
treatment in Angola in 2010 was 27,931, out of 86,000 people who needed treatment based
on WHO 2010 guidelines.48
1,916 children received antiretroviral treatment, out of 19,000
children who needed treatment.49
Based on these figures, we compute that 26,015 (27,931-
1,916) adults received treatment, out of 67,000 (86,000-19,000) adults who needed treatment.
Adult percentage treatment coverage in Angola in 2010 thus works out to 26,015/67,000 or
38.83%, while percentage treatment coverage for children is 1,916/19,000 or 10.08%.
The WHO provides information about what treatment regimen adults and children are taking
by country group. In Group A countries, 93% of all treatments (first, second, or third line) are
for adults, while Group B countries it is 97%.50
45
World Health Organization, "The Global Burden of Disease 2004 Update", World Health Organization:
Geneva, (2008): Annex A. 46
We expect that regional averages provide reasonable estimates for a country in that region given that countries
in the same region are likely to exhibit similar properties such as life expectancy, age demographics and
standard of living. 47
Again, the reason we consider these groups separately is because the WHO survey data is grouped in this way. 48
World Health Organization, World Health Observatory Data Repository. Data on HIV/AIDS Response,
Antiretroviral Therapy Coverage. < http://apps.who.int/ghodata/?vid=22100 >, Accessed 12 June 2012. 49
Ibid. 50
Ibid.

25
Percent of Treated in Each Group Adult and Child51
The table below breaks down each of the four patient groups (Group A adults, Group A
children, Group B adults and Group B children) further to show the proportions of first,
second, and third line treatments administered.52
Next the model considers the following specific first and second line antiretroviral treatment
therapies for Adults in Group A as Angola is a Group A country.53
For full regimen details,
refer to Appendix 2.54
In the chart below of all the adults receiving first-line antiretroviral
therapy 27.70% are receiving a combination of Stavudine + Lamivudine + Nevirapine and we
are supposing it is 65.2% efficacious, for instance.55
51
World Health Organization, World Health Observatory Data Repository. Antiretroviral therapy coverage,
data on HIV/AIDS response. Accessed Jun 12, 2012. 52
Data extracted from: World Health Organization, "Antiretroviral Medicines in Low- and Middle-Income
Countries: Usage in 2010 with Global and Regional Demand Forecast for 2011 - 2012", World Health
Organization: Geneva, (2010): p. 4. 53
We are unable to locate efficacy and proportion data on specific third-line regimens and so do not include
them in this version of the model. Given that third-line regimens hold a relatively small proportion out of all
antiretroviral treatments, we predict that the impact of third-line regimens will be minimal. Hence, exclusion of
third-line regimens from the model due to lack of data should not severely affect final scores. 54
Regimen breakdown information extracted from World Health Organization, "Antiretroviral Medicines in
Low- and Middle-Income Countries: Usage in 2010 with Global and Regional Demand Forecast for 2011 -
2012", World Health Organization: Geneva, (2010): p. 5. 55
We have yet to do a systematic review of HIV/AIDS or TB drug efficacy. Instead we use either global
estimates (for TB) or estimates based on select clinical trials for HIV/AIDS combination therapies’ efficacy.
The later are probably significantly different from actual global efficacy (as efficacy is likely to vary by region,
country, and patient group). So the model can be improved with further data collection.

26
Group A56
Since there exist multiple combination therapies for each patient group and some therapies
are used more commonly than others (i.e. have higher proportions in the patient group),
weighted efficacies are computed for each patient group. Instead of merely taking the average
of all regimen efficacies in a patient group, we give each regimen different weight depending
on how commonly it is being used. A regimen with 90% efficacy might be very effective but
if it is only used 10% of the time, it should be assigned less weight than another regimen that
is used 80% of the time.
Weighted efficacy is the sum of each regime's proportion * each regime's efficacy. For
instance, the weighted efficacy for adult first-line treatment in Group A countries is:
((27.70% * 65.20%) + (26.80% * 83.50%) + (14.00% * 96.00%) + (11.40% * 76.70%) +
(10.60% * 76.60%) + (3.50% * 90.00%) + (2.70% * 79.00%) + (2.50% * 84.00%) + (.80% *
81.38%)) = 78.77%
The same approach is taken to compute the weighted efficacy for other patient groups. This
will yield the following weighted efficacies for treatment in Group A countries:
Adult First-Line Treatment Efficacy: 78.77%
Adult Second-Line Treatment Efficacy: 70.47%
Children First-Line Treatment Efficacy: 75.85%
Children Second-Line Treatment Efficacy: 70%
We use the above as the estimated weighted efficacies for Angola since it is classified under
Group A. Previously, we calculated that 245,012.47 adult DALYs and 63,295.66 child
DALYs were lost in Angola in 2010. Recall that we calculated that percentage treatment
coverage for adults was 38.83%, while percentage treatment coverage for children was
10.08%. We also previously saw that of all the treatments "Group A Adults" receive, first-
line treatments make up 97.10%, second-line treatments 2.90%, and third-line treatments
0.05%. We assume that we can disaggregate adult DALYs in the same proportion (and the
same goes for child DALYs). For example, of 245,012.47 adult DALYs, 237,907.11 (97.10%
of 245,012.47) can be recovered through first-line treatment, 7,105.36 (2.90% of 245,012.47)
56
Contact authors for source data.

27
through second-line treatment and 122.51 (0.05% of 245,012.47) through third-line
treatment.57
Finally the impact score for each patient group is calculated by potential DALYs recovered *
treatment coverage (using adult treatment coverage of 39.83% or children treatment coverage
of 10.08%) * weighted efficacy of regimes in the patient group.58
The impact scores for A
countries are as follows:
Adult First-Line Treatment Impact Score
= (245,012.47 * 97.10%) * 38.83% * 78.77% = 72,767.19
Adult Second-Line Treatment Impact Score
= (245,012.47 * 2.9%) * 38.83% * 70.47% = 1944.28
Children First-Line Treatment Impact Score
= (63,295.66 * 96.80%) * 10.08% * 75.85% = 4684.52
Children Second-Line Treatment Impact Score
= (63,295.66 * 3.20%) * 10.08% * 70% =142.92
Again, given the small proportion of third-line treatment regimens in comparison to first- and
second-line treatment regimens in general (and the lack of specific data associated with third-
line treatment regimens), we only consider first- and second-line treatment scores for adults
and children in this model.
Once we have the impact scores for treating each patient group in Angola, the next step is to
disaggregate the impact scores to the impact scores associated with each drug. As with drugs
in combination therapies for TB, we assume that each drug in any antiretroviral combination
therapy receives equal credit.
Consider, for instance, how we calculate Stavudine’s score in Angola’s adult population
receiving a first-line regimen. Again, we know that 72,767.19 is the final impact score for
adult first-line regimen treatments in Angola in 2010. Stavudine only occurs in these two
57
Note that the sum of DALYs saved through first, second and third line treatment for adults in Group A does
not add up exactly to 245,012.47 as the breakdown of treatment proportions provided by WHO (first line =
97.1%, second line = 2.9%, third-line = 0.05%) adds up to 100.05%, possibly due to rounding of decimals. 58
Multiplying each regimen’s efficacy by the regimen’s proportion in effect moves some information necessary
for calculating treatment percentages at the country-drug level with each regimen into the weighted efficacy
result, but running the calculation in this way was much more efficient given our data structure.

28
combinations (highlighted in the table). For the first combination therapy in the table above,
there are three drugs (Stavudine, Lamivudine and Nevirapine) and this combination therapy
makes up 27.70% of all adult first-line treatments in Angola. So each of the three drugs has a
weight of 27.70%/3 = 9.23%. For the third combination therapy in the table above, there are
also three drugs (Stavudine + Lamivudine + Efavirenz) but this combination therapy makes
up only 14% of all adult first-line treatments in Angola. So each drug receives a weight of
4.67%. So the total weight for Stavudine is 9.23% + 4.67% = 13.9% among Angola's adult
first-line treatment regimens. Thus, Stavudine's impact here is 13.9% of 72,767.19 =
10,114.63.
The same procedure is repeated to get each drug's impact for all regimens and patient groups
in each country. The scores are then summed up for each drug across all the countries. Since
Bristol-Myers Squibb makes Didanosine, Stavudine and Efavirenz, its total score of
5,570,674.58 reflects the sum of each drug's score.
4. Improving the Index: Questions for Future Research
Further research is necessary to improve the model. It is not always clear, for instance, which
company should receive credit for a drug’s impact. The structure of the pharmaceutical
market is complex. Some companies have patented drugs that other companies really
developed. Some have bought the rights to drugs others have patented and developed. Often
companies license out manufacturing and distribution of their drugs to other companies or
enter into co-marketing agreements. Ideally, it might be best to try to figure out which
companies have marketing rights to which drugs in different areas of the world or which
companies are really responsible for drug development. Those companies that have control
over licensing co-marketing, distribution, and manufacturing rights have a lot of control over
access to drugs and have often developed the drugs. Those companies that develop a drug are
able to control much that happens to it downstream (for the life of their patents). It is
difficult, however, to secure information about which companies market where (globally) or
even to isolate which company is really responsible for a drug’s development. For now, we
are relying primarily on FDA patent applications and companies’ annual reports to determine
which companies to credit.
We also need to address the issues described above. Further information about treatment
protocols is necessary, for instance, to determine which people should get which drugs and
how much credit to give each drug in countries where more than one drug is prescribed.
Taking into account side-effects associated with some drugs may also be important in
evaluating their impacts. Moreover, as noted above, we need to consider further interactions
between TB and HIV, and how to appropriation credit for different drugs in combination
when one company does not make all of the drugs.
5. Conclusion
Indicators are powerful because they can focus attention and legal or political effort on
achieving important goals.59
This paper has sketched the prospects for creating a new kind of
indicator – one that measures the global health impact of essential medicines -- that can be
59
B. Kingsbury, ―Indicators and Law in Global Governance‖, 8th Viterbo GAL Seminar ―Indicators in Global
Governance: Legal Dimensions‖, Istituto di Ricerche sulla Pubblica Amministrazione: Rome, Italy.
29
used to encourage pharmaceutical companies and others in positions of power to better
address global health needs.60
Of course, what impact this indicator will have depends on
how it is used.61
There is a lot of good work on potential pitfalls to avoid in constructing good
indicators and evaluating potential uses.62
It is necessary to consider the prospects and
potential draw-backs of the proposed indicator carefully to maximize its chances of providing
useful information that can promote global health. It is important that the indictor really track
what it is supposed to track (in this case global health impact) and that its assumptions are
made explicit and tested.63
To improve the model sketched above, amongst other changes, we
hope to:
Improve our disease models to better deal with interaction effects between
drugs and disease states.
Model resistance rates to mono-therapies to better credit drugs in combination
therapies
Improve efficacy estimates
Determine which companies it is best to credit for innovations
Include estimates of drug interactions/side effects
We are also working on some sensitivity analysis of our model to figure out which of its
simplifying assumptions has a large impact on the overall rating of companies (and what we
might focus on improving). We must also consider how update the indicator over time if it is
to provide a stable basis for fruitful philanthropic, governmental and non-governmental
action.64
No indicator is perfect and different indictors are appropriate for different purposes, but we
believe a good Global Health Impact indicator can have a major impact.65
By making the
goals we would like this indicator to help achieve explicit and keeping them in mind in
developing the model, we have tried to address some of the design issues necessary for
creating a good indicator. Further analysis will help us determine what proposed uses for the
60
For work on other global health indicators and their importance see: M. Samson, ―Indicators as a monitoring
tool for the implementation of Global Health Law‖, 8th Viterbo GAL Seminar ―Indicators in Global
Governance: Legal Dimensions‖, Istituto di Ricerche sulla Pubblica Amministrazione: Rome, Italy. 61
K. Davis, B. Kingsbury, and S. Merry, ―Indicators as a Technology of Global Governance‖, Public law &
Legal Theory Research Paper Series. Working Paper No. 10-26 and Law & Economics Research Paper Series
Working paper no. 10-13. New York University School of Law. B. Kingsbury, ―Indicators and Law in Global
Governance‖, 8th Viterbo GAL Seminar ―Indicators in Global Governance: Legal Dimensions‖, Istituto di
Ricerche sulla Pubblica Amministrazione: Rome, Italy. For discussion of some uses of indictors in law, see: K.
Davis, ―Legal Indicators: Potential and Perils‖, 8th Viterbo GAL Seminar ―Indicators in Global Governance:
Legal Dimensions‖, Istituto di Ricerche sulla Pubblica Amministrazione: Rome, Italy. 62
Ibid. 63
For discussion of the importance of this point in a different context, see: N. Hassoun, ―Free Trade, Poverty
and Inequality‖, Journal of Moral Philsophy, 8: 5-44. 64
Kevin E. Davis and Benedict Kingsbury, ―Indicators as Interventions: Pitfalls and Prospects in Supporting
Development Initiatives,‖ Rockefeller Foundation Working Paper, December 14, 2011. 65
K. Davis, B. Kingsbury, and S. Merry, ―Indicators as a Technology of Global Governance‖, Public law &
Legal Theory Research Paper Series. Working Paper No. 10-26 and Law & Economics Research Paper Series
Working paper no. 10-13. New York University School of Law. Also see: B. Kingsbury, ―Indicators and Law in
Global Governance‖, 8th Viterbo GAL Seminar ―Indicators in Global Governance: Legal Dimensions‖, Istituto
di Ricerche sulla Pubblica Amministrazione: Rome, Italy.

30
indicator are most promising. The discussion and contestation academic publication can bring is
important for improving the end result.66
If it is possible to develop and maintain a good rating system, it will have a significant impact on
global health. Such a rating system will support Global Health Impact certification, where highly-
rated pharmaceutical companies are allowed to use a Global Health Impact label on all of their
products. This will give companies a large incentive to become highly rated as they can use the label
to garner a larger share of the market for their over-the-counter medications and other consumer
products. An associated Global Health Impact licensing campaign would also have a big impact.
Again, the idea is that universities might give preference in licensing their products to highly rated
companies. This would give companies an even greater incentive to abide by Global Health Impact
standards. If the proposed Global Health Impact indicator is successful, it will provide the basis for
effective interventions that can help us address some of the most complex, changing, and devastating
global health problems people face.67
66
G. Dimitropoulos, ―Global Administrative Law as ―Enabling Law‖: How To Monitor And Evaluate Indicator-
-‐Based Performance‖, 8th Viterbo GAL Seminar ―Indicators in Global Governance: Legal Dimensions‖,
Istituto di Ricerche sulla Pubblica Amministrazione: Rome, Italy. 67
Kevin E. Davis and Benedict Kingsbury, ―Indicators as Interventions: Pitfalls and Prospects in Supporting
Development Initiatives,‖ Rockefeller Foundation Working Paper, December 14, 2011.

31
Appendix 1: Anti-TB Drug List
Abbreviation Full Name

32
Appendix 2: Antiretroviral Treatment Regimen Proportions and Efficacies68
Group A
Group B
68
Regimen breakdown information extracted from World Health Organization, "Antiretroviral Medicines in
Low- and Middle-Income Countries: Usage in 2010 with Global and Regional Demand Forecast for 2011 -
2012", World Health Organization: Geneva, (2010): p. 5. This efficacy information is currently the weakest in
our model as it is from selected clinical trial data (and we either use a data point from a different region/patient
group or the average for each treatment regimen type (e.g. first line) for each patient and country group when we
are not able to locate an appropriate trial).

33