the growing demand for permanent magnets in transportation
TRANSCRIPT
• Good afternoon.
Slide 1
The Growing Demand for
Permanent Magnets in Transportation
Steve Constantinides
Magnetics 2020, February 11, 2020
Slide 2
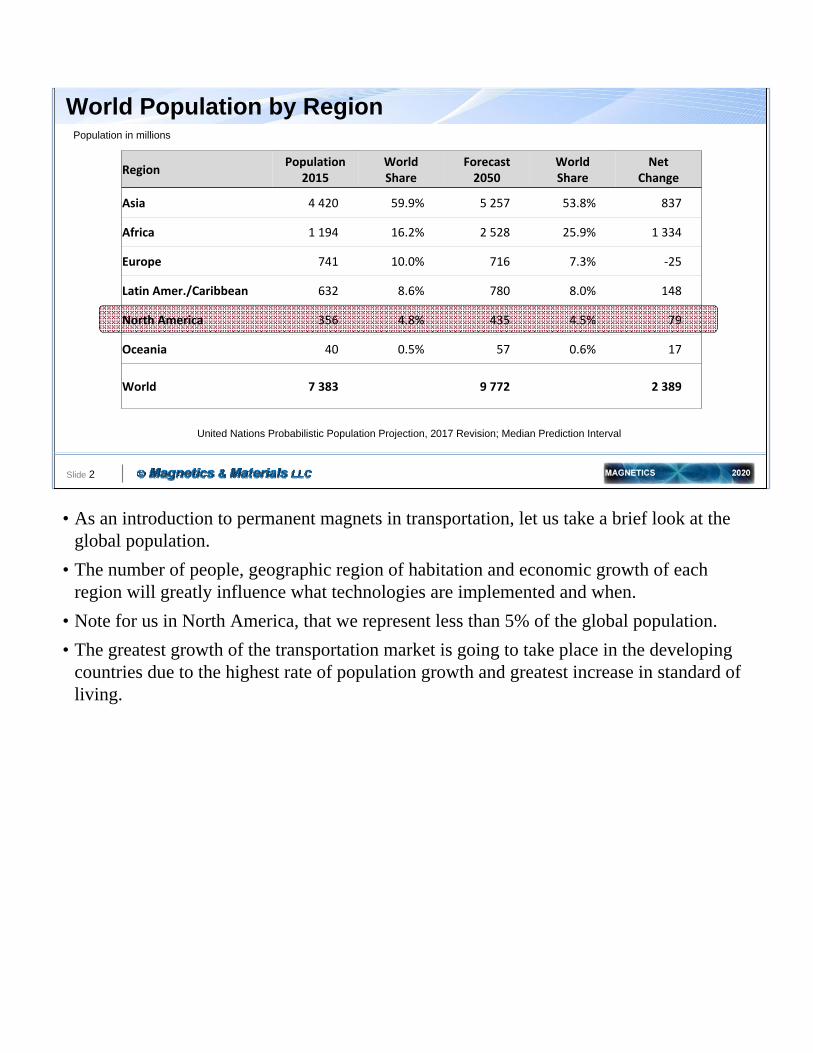
World Population by Region
United Nations Probabilistic Population Projection, 2017 Revision; Median Prediction Interval
RegionPopulation
2015WorldShare
Forecast2050
WorldShare
NetChange
Asia 4 420 59.9% 5 257 53.8% 837
Africa 1 194 16.2% 2 528 25.9% 1 334
Europe 741 10.0% 716 7.3% ‐25
Latin Amer./Caribbean 632 8.6% 780 8.0% 148
North America 356 4.8% 435 4.5% 79
Oceania 40 0.5% 57 0.6% 17
World 7 383 9 772 2 389
Population in millions
• As an introduction to permanent magnets in transportation, let us take a brief look at the global population.
• The number of people, geographic region of habitation and economic growth of each region will greatly influence what technologies are implemented and when.
• Note for us in North America, that we represent less than 5% of the global population.
• The greatest growth of the transportation market is going to take place in the developing countries due to the highest rate of population growth and greatest increase in standard of living.
Slide 3
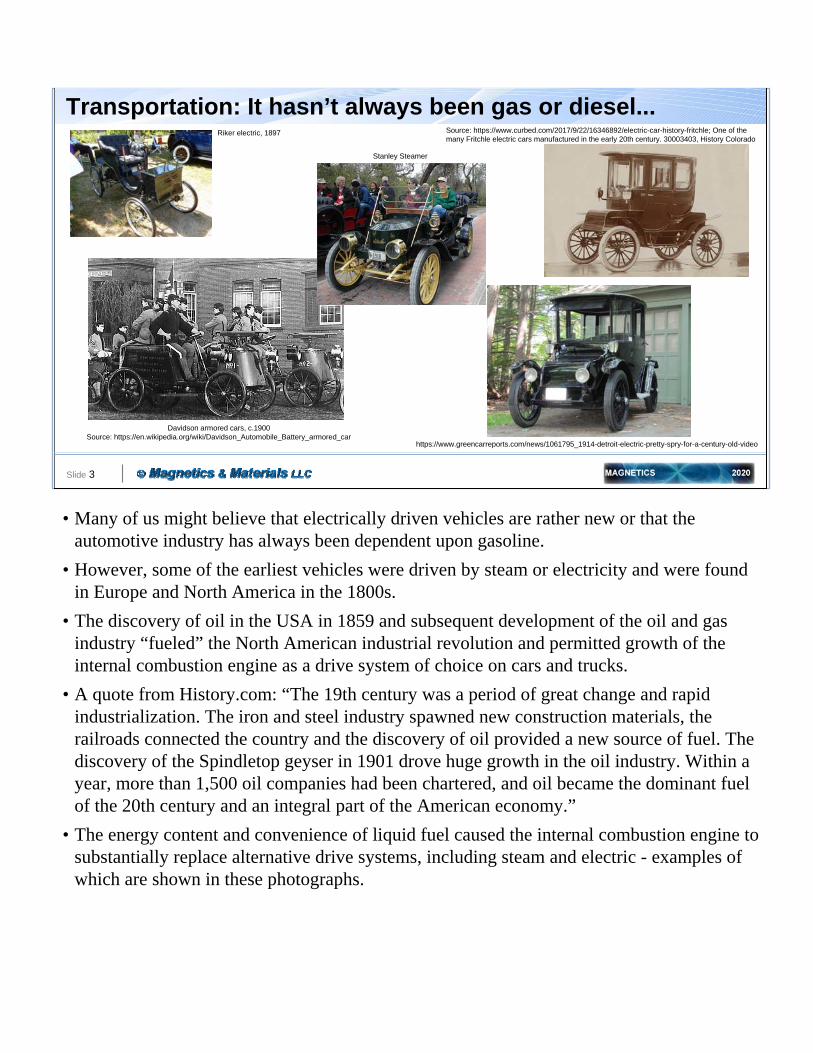
Transportation: It hasn’t always been gas or diesel...Riker electric, 1897
Stanley Steamer
Davidson armored cars, c.1900Source: https://en.wikipedia.org/wiki/Davidson_Automobile_Battery_armored_car
Source: https://www.curbed.com/2017/9/22/16346892/electric-car-history-fritchle; One of the many Fritchle electric cars manufactured in the early 20th century. 30003403, History Colorado
https://www.greencarreports.com/news/1061795_1914-detroit-electric-pretty-spry-for-a-century-old-video
• Many of us might believe that electrically driven vehicles are rather new or that the automotive industry has always been dependent upon gasoline.
• However, some of the earliest vehicles were driven by steam or electricity and were found in Europe and North America in the 1800s.
• The discovery of oil in the USA in 1859 and subsequent development of the oil and gas industry “fueled” the North American industrial revolution and permitted growth of the internal combustion engine as a drive system of choice on cars and trucks.
• A quote from History.com: “The 19th century was a period of great change and rapid industrialization. The iron and steel industry spawned new construction materials, the railroads connected the country and the discovery of oil provided a new source of fuel. The discovery of the Spindletop geyser in 1901 drove huge growth in the oil industry. Within a year, more than 1,500 oil companies had been chartered, and oil became the dominant fuel of the 20th century and an integral part of the American economy.”
• The energy content and convenience of liquid fuel caused the internal combustion engine to substantially replace alternative drive systems, including steam and electric - examples of which are shown in these photographs.
Slide 4
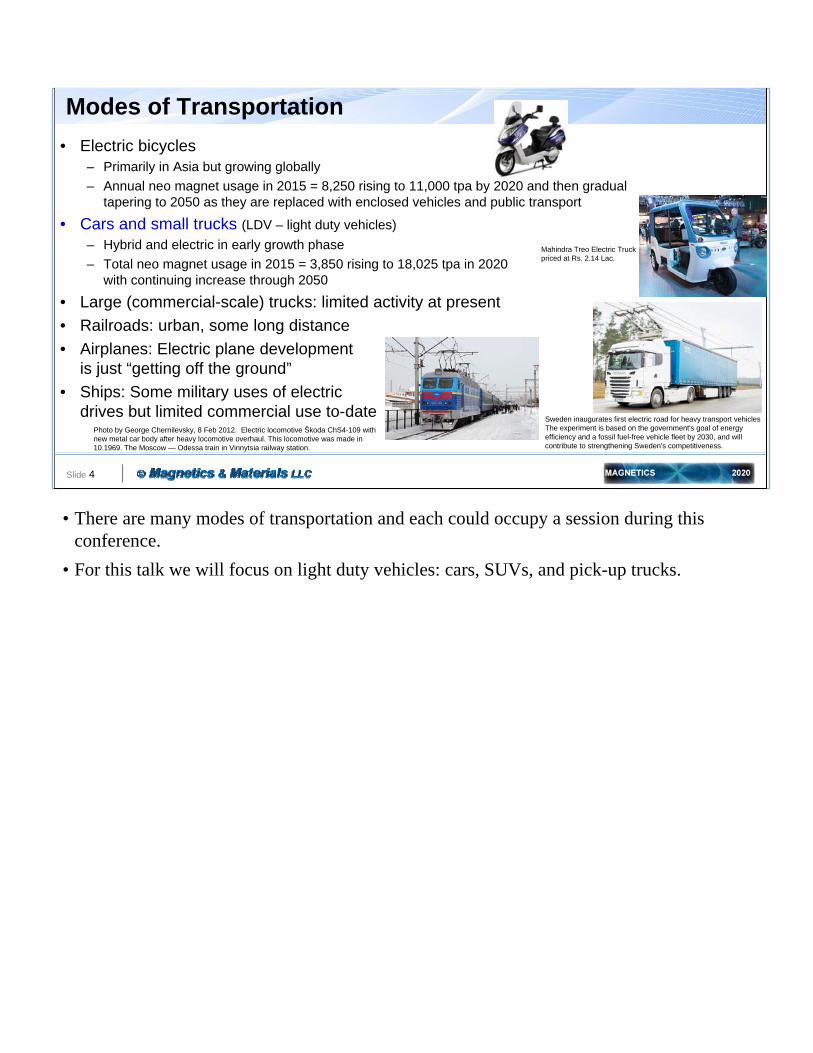
Modes of Transportation
• Electric bicycles– Primarily in Asia but growing globally
– Annual neo magnet usage in 2015 = 8,250 rising to 11,000 tpa by 2020 and then gradual tapering to 2050 as they are replaced with enclosed vehicles and public transport
• Cars and small trucks (LDV – light duty vehicles)
– Hybrid and electric in early growth phase
– Total neo magnet usage in 2015 = 3,850 rising to 18,025 tpa in 2020 with continuing increase through 2050
• Large (commercial-scale) trucks: limited activity at present
• Railroads: urban, some long distance
• Airplanes: Electric plane development is just “getting off the ground”
• Ships: Some military uses of electric drives but limited commercial use to-date
Sweden inaugurates first electric road for heavy transport vehiclesThe experiment is based on the government's goal of energy efficiency and a fossil fuel-free vehicle fleet by 2030, and will contribute to strengthening Sweden's competitiveness.
Mahindra Treo Electric Truck priced at Rs. 2.14 Lac.
Photo by George Chernilevsky, 8 Feb 2012. Electric locomotive Škoda ChS4-109 with new metal car body after heavy locomotive overhaul. This locomotive was made in 10.1969. The Moscow — Odessa train in Vinnytsia railway station.
• There are many modes of transportation and each could occupy a session during this conference.
• For this talk we will focus on light duty vehicles: cars, SUVs, and pick-up trucks.
Slide 5
The Acronyms
ICE Internal Combustion Engine
LDV Light Duty Vehicles (cars, SUVs, pickup trucks)
EV Electrically driven Vehicle
BEV BV Battery-powered, Electrically driven Vehicle
HEV HV Hybrid Electric Vehicle
PHEV PHV Plug-in Hybrid Electrically driven Vehicle
FCEV FCV Fuel Cell Electrically driven Vehicle
Comm
on
Altern
ativ
e
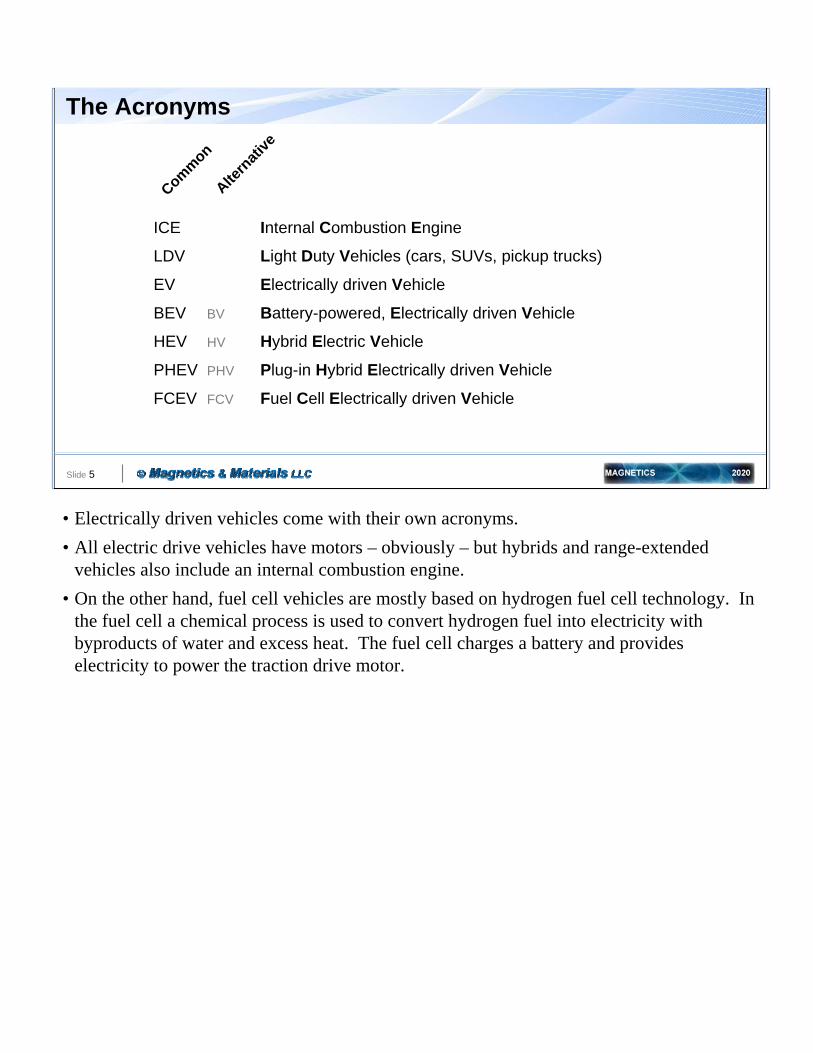
• Electrically driven vehicles come with their own acronyms.
• All electric drive vehicles have motors – obviously – but hybrids and range-extended vehicles also include an internal combustion engine.
• On the other hand, fuel cell vehicles are mostly based on hydrogen fuel cell technology. In the fuel cell a chemical process is used to convert hydrogen fuel into electricity with byproducts of water and excess heat. The fuel cell charges a battery and provides electricity to power the traction drive motor.
Slide 6
Drive Type versus Vehicle Size
Source: Toyota Motor Corp
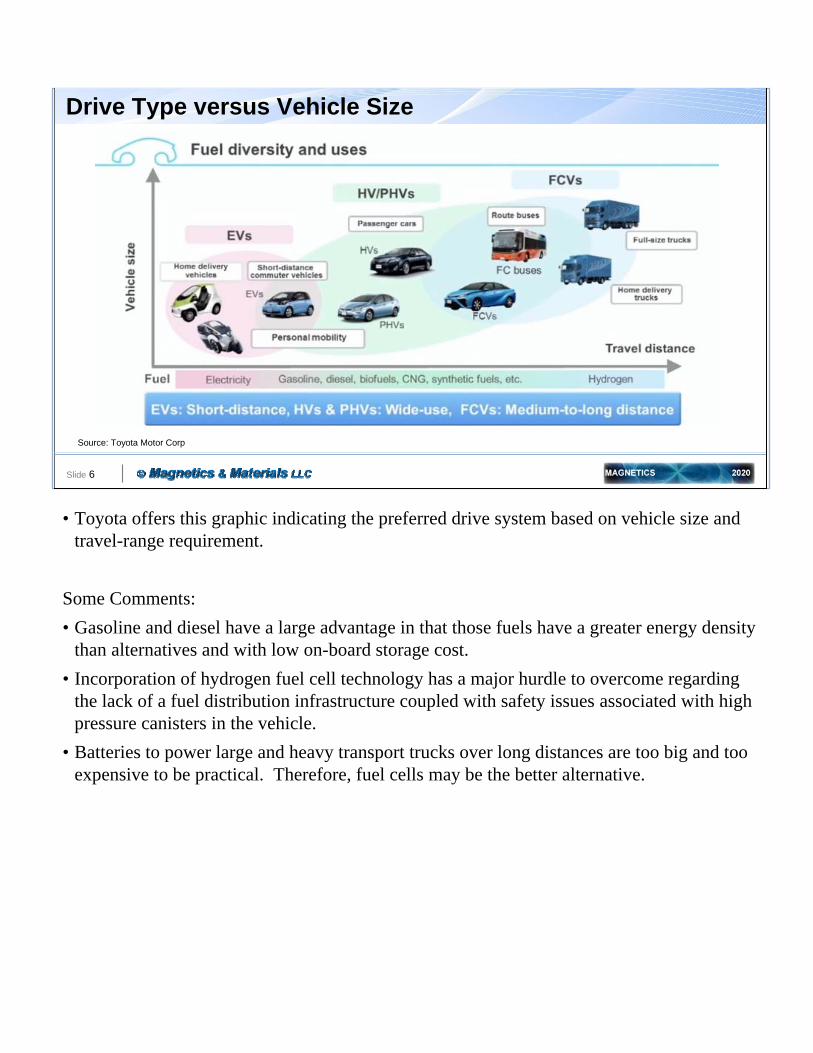
• Toyota offers this graphic indicating the preferred drive system based on vehicle size and travel-range requirement.
Some Comments:
• Gasoline and diesel have a large advantage in that those fuels have a greater energy density than alternatives and with low on-board storage cost.
• Incorporation of hydrogen fuel cell technology has a major hurdle to overcome regarding the lack of a fuel distribution infrastructure coupled with safety issues associated with high pressure canisters in the vehicle.
• Batteries to power large and heavy transport trucks over long distances are too big and too expensive to be practical. Therefore, fuel cells may be the better alternative.
Slide 7
Vehicle Drive Type
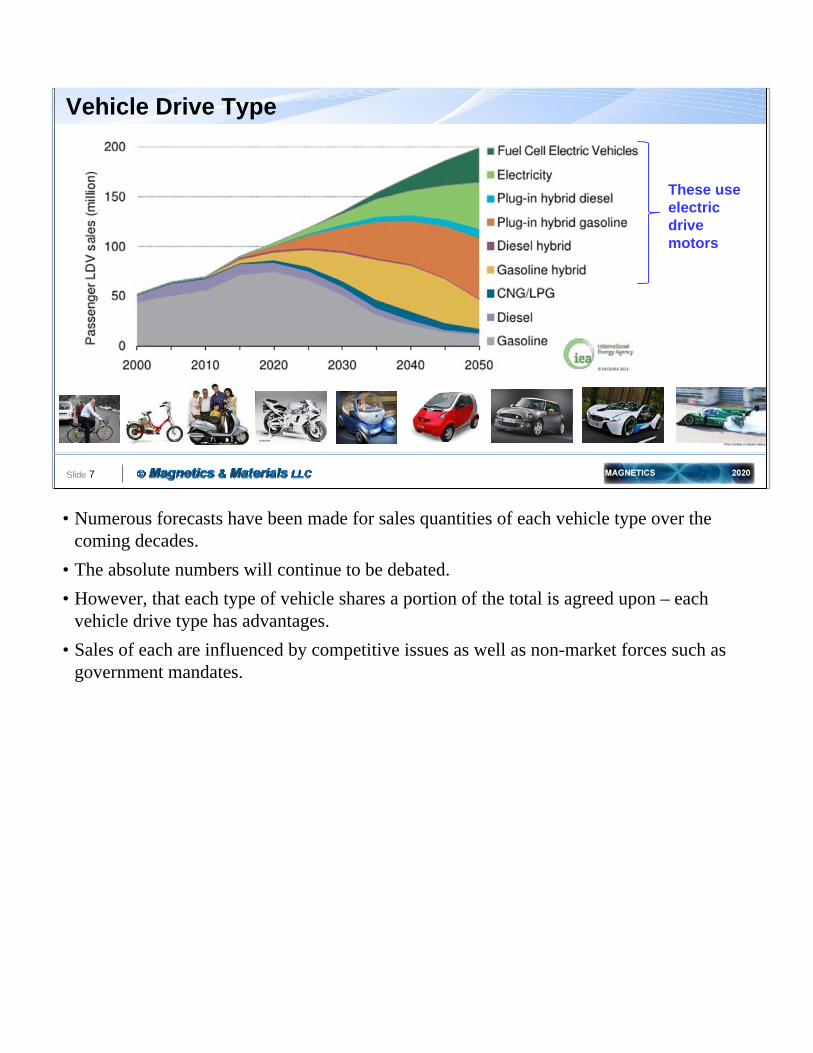
These use electric drive motors
• Numerous forecasts have been made for sales quantities of each vehicle type over the coming decades.
• The absolute numbers will continue to be debated.
• However, that each type of vehicle shares a portion of the total is agreed upon – each vehicle drive type has advantages.
• Sales of each are influenced by competitive issues as well as non-market forces such as government mandates.
Slide 8
Global Sales of Plug-In LDVs
Source: www.ev-volumes.com/country/total-world-plug-in-vehicle-volumes/
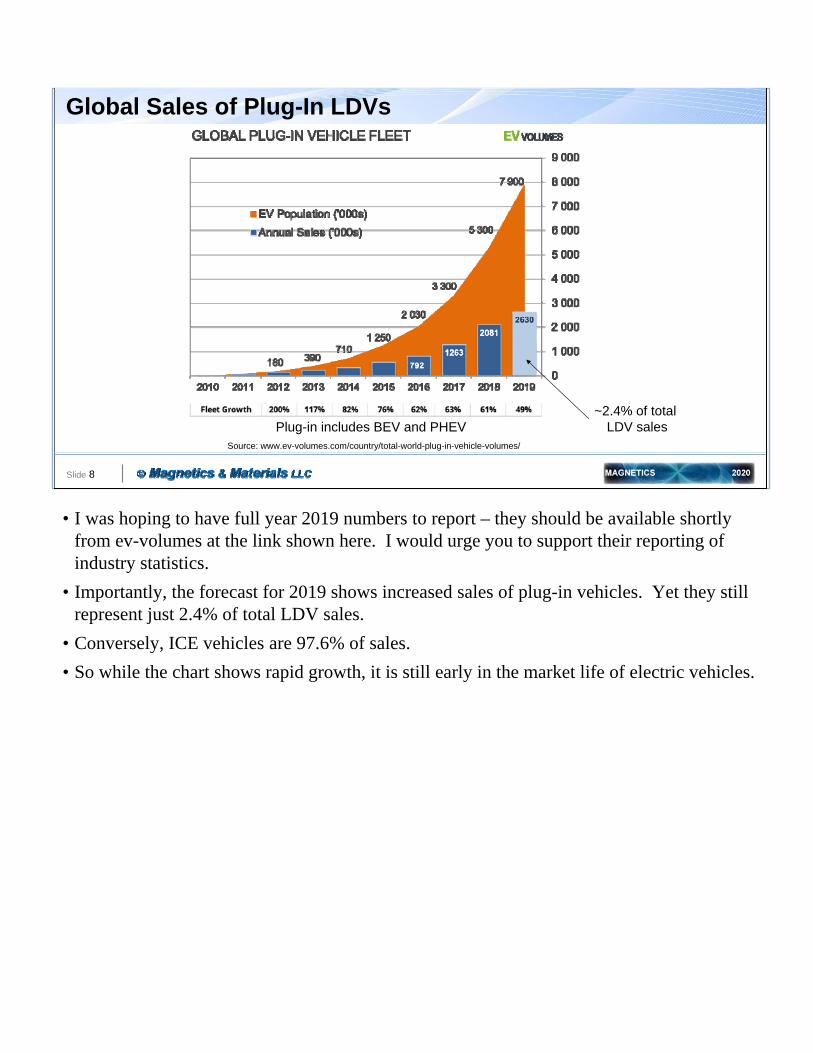
~2.4% of total LDV salesPlug-in includes BEV and PHEV
• I was hoping to have full year 2019 numbers to report – they should be available shortly from ev-volumes at the link shown here. I would urge you to support their reporting of industry statistics.
• Importantly, the forecast for 2019 shows increased sales of plug-in vehicles. Yet they still represent just 2.4% of total LDV sales.
• Conversely, ICE vehicles are 97.6% of sales.
• So while the chart shows rapid growth, it is still early in the market life of electric vehicles.
Slide 9
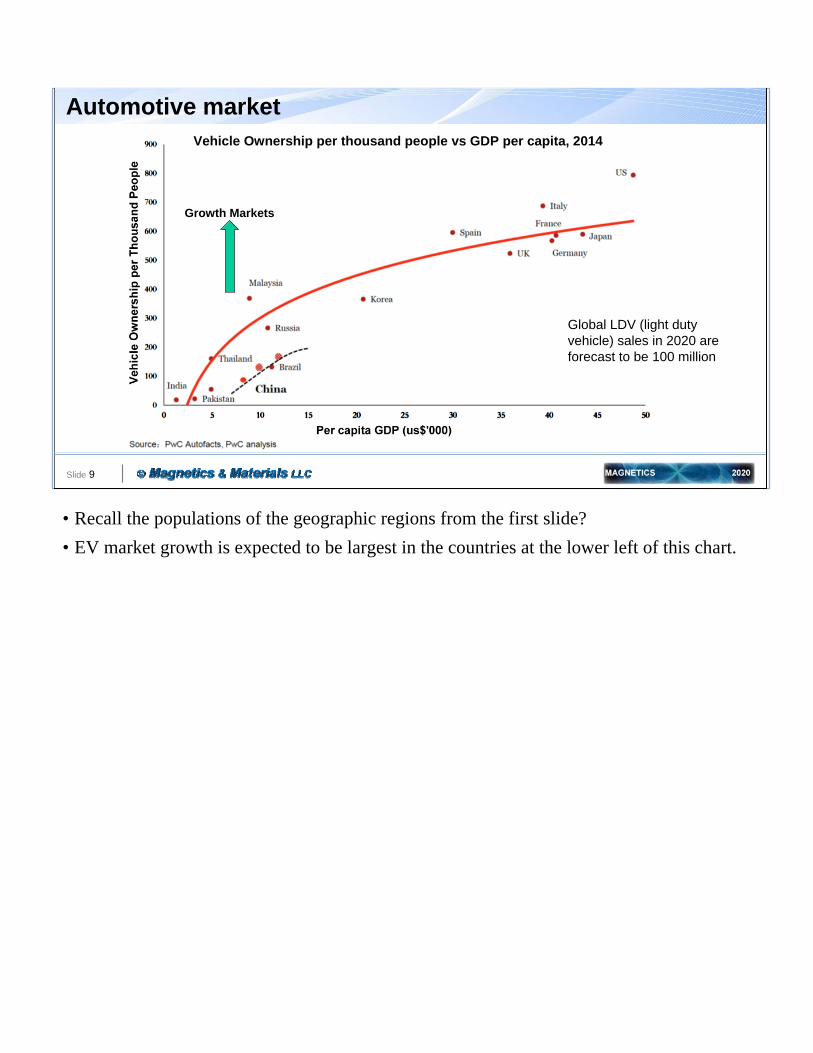
Automotive market
Growth Markets
Vehicle Ownership per thousand people vs GDP per capita, 2014
Global LDV (light duty vehicle) sales in 2020 are forecast to be 100 million
• Recall the populations of the geographic regions from the first slide?
• EV market growth is expected to be largest in the countries at the lower left of this chart.
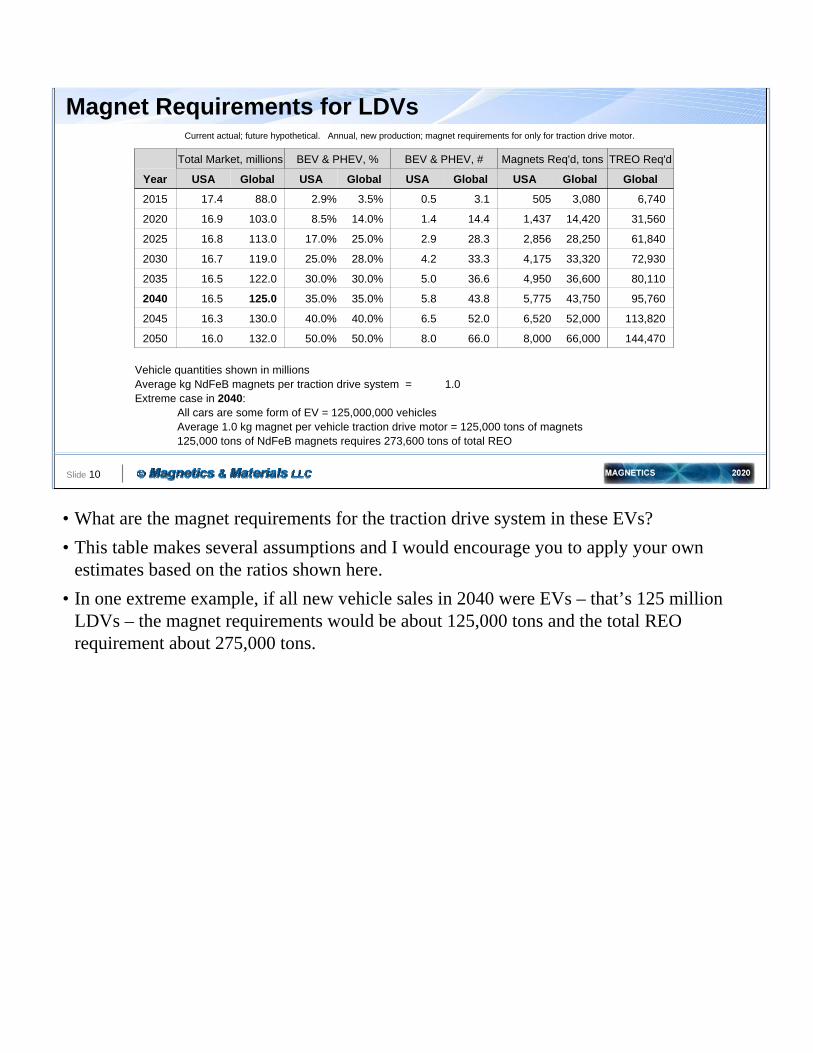
• What are the magnet requirements for the traction drive system in these EVs?
• This table makes several assumptions and I would encourage you to apply your own estimates based on the ratios shown here.
• In one extreme example, if all new vehicle sales in 2040 were EVs – that’s 125 million LDVs – the magnet requirements would be about 125,000 tons and the total REO requirement about 275,000 tons.
Slide 10
Magnet Requirements for LDVsCurrent actual; future hypothetical. Annual, new production; magnet requirements for only for traction drive motor.
Total Market, millions BEV & PHEV, % BEV & PHEV, # Magnets Req'd, tons TREO Req'd
Year USA Global USA Global USA Global USA Global Global
2015 17.4 88.0 2.9% 3.5% 0.5 3.1 505 3,080 6,740
2020 16.9 103.0 8.5% 14.0% 1.4 14.4 1,437 14,420 31,560
2025 16.8 113.0 17.0% 25.0% 2.9 28.3 2,856 28,250 61,840
2030 16.7 119.0 25.0% 28.0% 4.2 33.3 4,175 33,320 72,930
2035 16.5 122.0 30.0% 30.0% 5.0 36.6 4,950 36,600 80,110
2040 16.5 125.0 35.0% 35.0% 5.8 43.8 5,775 43,750 95,760
2045 16.3 130.0 40.0% 40.0% 6.5 52.0 6,520 52,000 113,820
2050 16.0 132.0 50.0% 50.0% 8.0 66.0 8,000 66,000 144,470
Vehicle quantities shown in millionsAverage kg NdFeB magnets per traction drive system = 1.0Extreme case in 2040:
All cars are some form of EV = 125,000,000 vehiclesAverage 1.0 kg magnet per vehicle traction drive motor = 125,000 tons of magnets125,000 tons of NdFeB magnets requires 273,600 tons of total REO
Slide 11
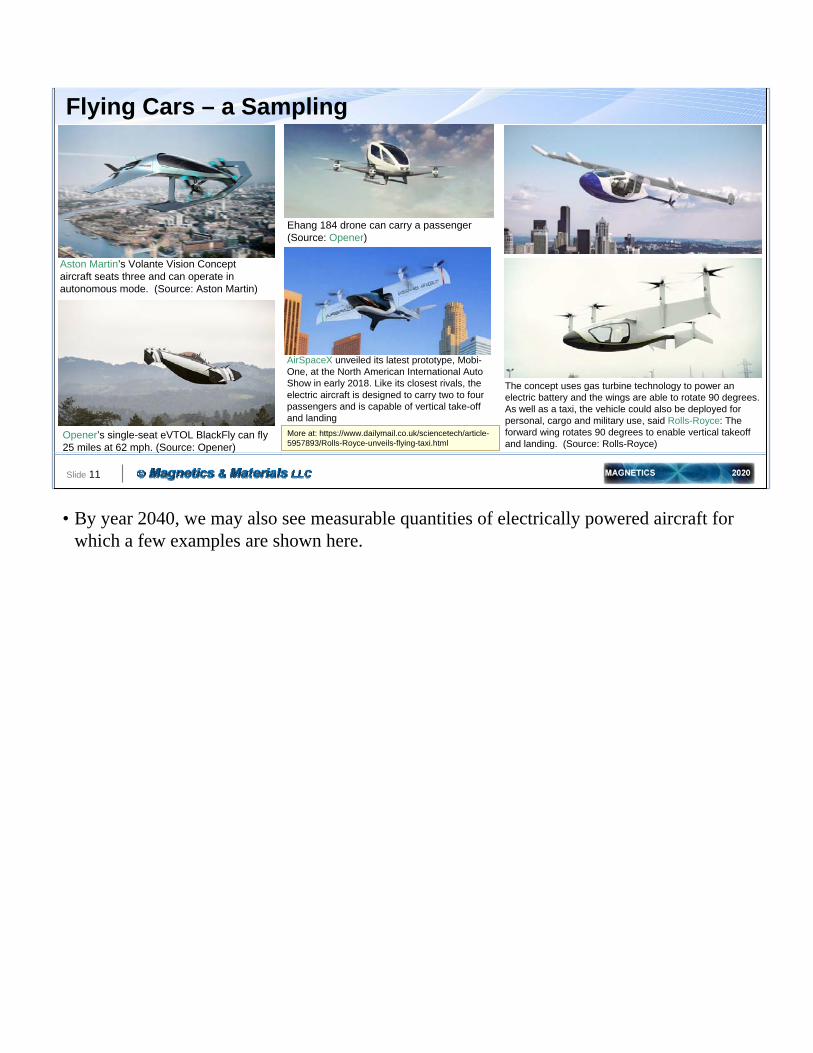
Flying Cars – a Sampling
The concept uses gas turbine technology to power an electric battery and the wings are able to rotate 90 degrees. As well as a taxi, the vehicle could also be deployed for personal, cargo and military use, said Rolls-Royce: The forward wing rotates 90 degrees to enable vertical takeoff and landing. (Source: Rolls-Royce)
Aston Martin’s Volante Vision Concept aircraft seats three and can operate in autonomous mode. (Source: Aston Martin)
Opener’s single-seat eVTOL BlackFly can fly 25 miles at 62 mph. (Source: Opener)
Ehang 184 drone can carry a passenger (Source: Opener)
AirSpaceX unveiled its latest prototype, Mobi-One, at the North American International Auto Show in early 2018. Like its closest rivals, the electric aircraft is designed to carry two to four passengers and is capable of vertical take-off and landing
More at: https://www.dailymail.co.uk/sciencetech/article-5957893/Rolls-Royce-unveils-flying-taxi.html
• By year 2040, we may also see measurable quantities of electrically powered aircraft for which a few examples are shown here.
Slide 12
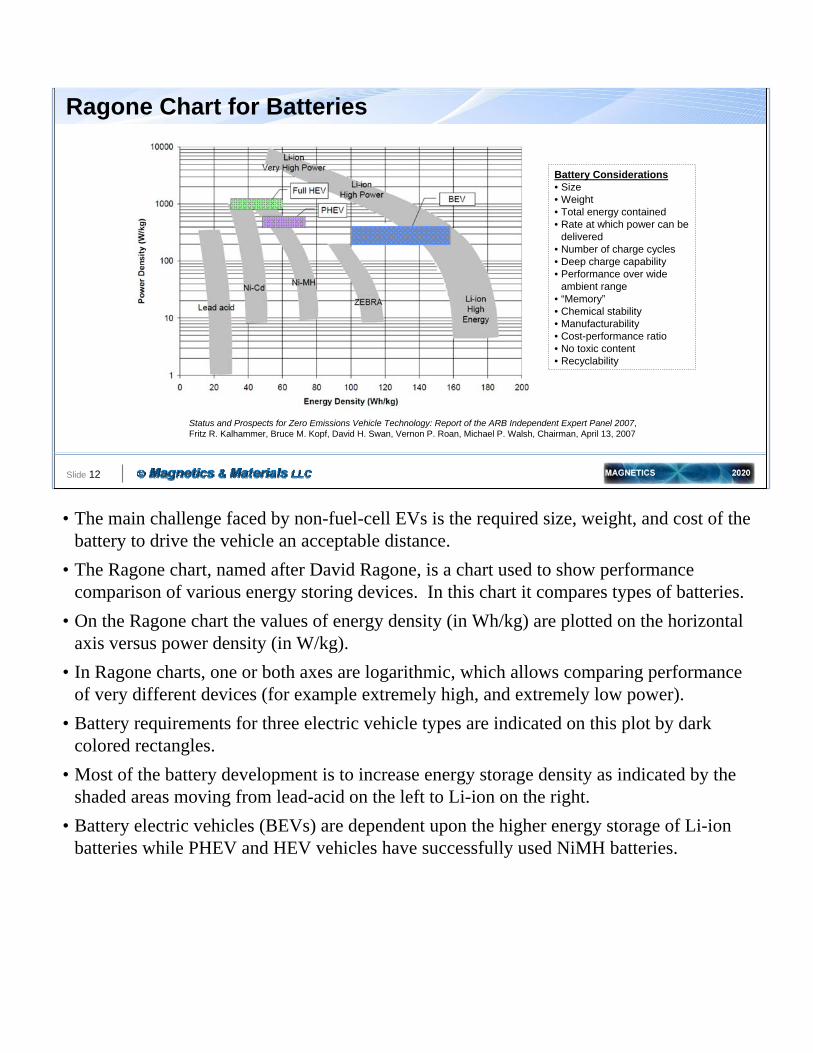
Ragone Chart for Batteries
Battery Considerations• Size• Weight• Total energy contained• Rate at which power can be
delivered• Number of charge cycles• Deep charge capability• Performance over wide
ambient range• “Memory”• Chemical stability• Manufacturability• Cost-performance ratio• No toxic content • Recyclability
Status and Prospects for Zero Emissions Vehicle Technology: Report of the ARB Independent Expert Panel 2007, Fritz R. Kalhammer, Bruce M. Kopf, David H. Swan, Vernon P. Roan, Michael P. Walsh, Chairman, April 13, 2007
• The main challenge faced by non-fuel-cell EVs is the required size, weight, and cost of the battery to drive the vehicle an acceptable distance.
• The Ragone chart, named after David Ragone, is a chart used to show performance comparison of various energy storing devices. In this chart it compares types of batteries.
• On the Ragone chart the values of energy density (in Wh/kg) are plotted on the horizontal axis versus power density (in W/kg).
• In Ragone charts, one or both axes are logarithmic, which allows comparing performance of very different devices (for example extremely high, and extremely low power).
• Battery requirements for three electric vehicle types are indicated on this plot by dark colored rectangles.
• Most of the battery development is to increase energy storage density as indicated by the shaded areas moving from lead-acid on the left to Li-ion on the right.
• Battery electric vehicles (BEVs) are dependent upon the higher energy storage of Li-ion batteries while PHEV and HEV vehicles have successfully used NiMH batteries.
Slide 13
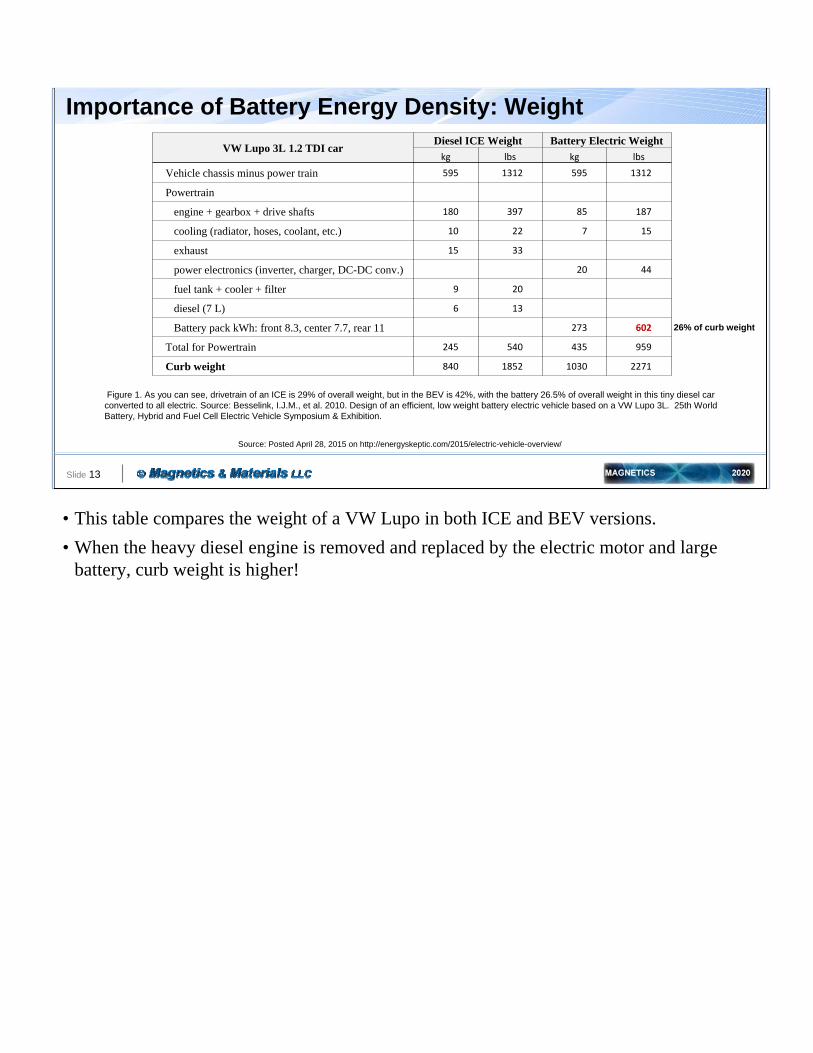
Importance of Battery Energy Density: Weight
VW Lupo 3L 1.2 TDI carDiesel ICE Weight Battery Electric Weight
kg lbs kg lbs
Vehicle chassis minus power train 595 1312 595 1312
Powertrain
engine + gearbox + drive shafts 180 397 85 187
cooling (radiator, hoses, coolant, etc.) 10 22 7 15
exhaust 15 33
power electronics (inverter, charger, DC-DC conv.) 20 44
fuel tank + cooler + filter 9 20
diesel (7 L) 6 13
Battery pack kWh: front 8.3, center 7.7, rear 11 273 602
Total for Powertrain 245 540 435 959
Curb weight 840 1852 1030 2271
Figure 1. As you can see, drivetrain of an ICE is 29% of overall weight, but in the BEV is 42%, with the battery 26.5% of overall weight in this tiny diesel car converted to all electric. Source: Besselink, I.J.M., et al. 2010. Design of an efficient, low weight battery electric vehicle based on a VW Lupo 3L. 25th World Battery, Hybrid and Fuel Cell Electric Vehicle Symposium & Exhibition.
Source: Posted April 28, 2015 on http://energyskeptic.com/2015/electric-vehicle-overview/
26% of curb weight
• This table compares the weight of a VW Lupo in both ICE and BEV versions.
• When the heavy diesel engine is removed and replaced by the electric motor and large battery, curb weight is higher!
Slide 14
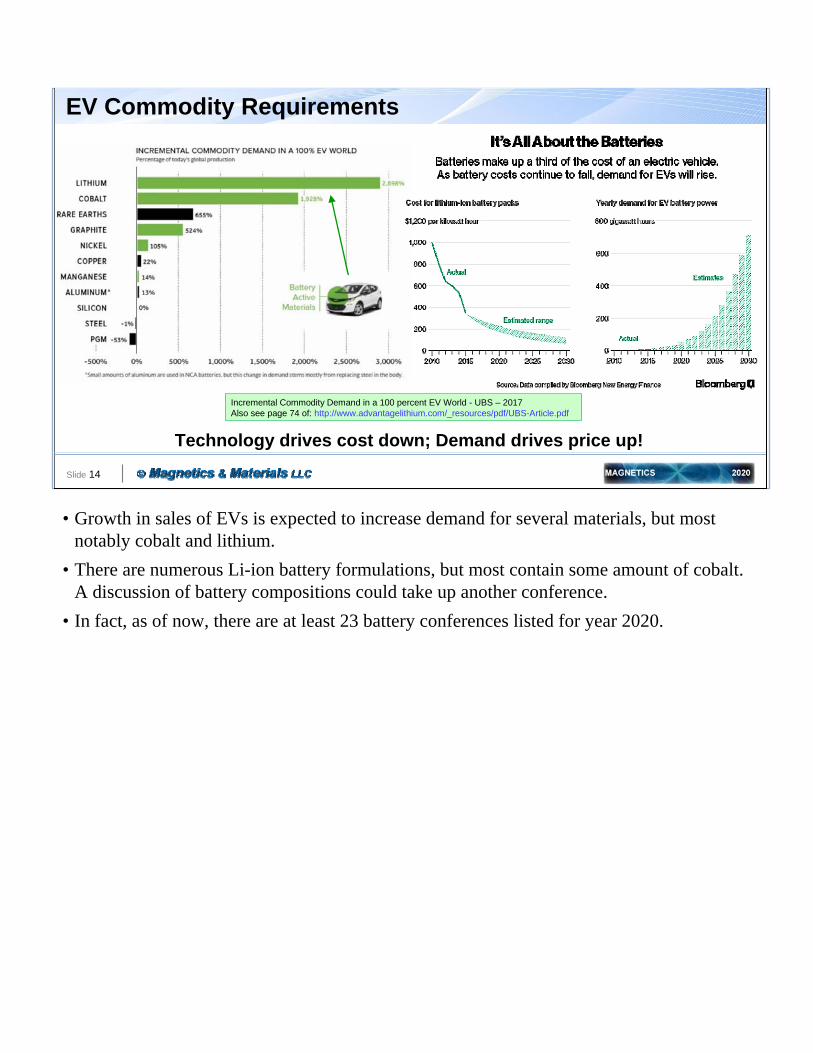
EV Commodity Requirements
Incremental Commodity Demand in a 100 percent EV World - UBS – 2017Also see page 74 of: http://www.advantagelithium.com/_resources/pdf/UBS-Article.pdf
Technology drives cost down; Demand drives price up!
• Growth in sales of EVs is expected to increase demand for several materials, but most notably cobalt and lithium.
• There are numerous Li-ion battery formulations, but most contain some amount of cobalt. A discussion of battery compositions could take up another conference.
• In fact, as of now, there are at least 23 battery conferences listed for year 2020.
Slide 15
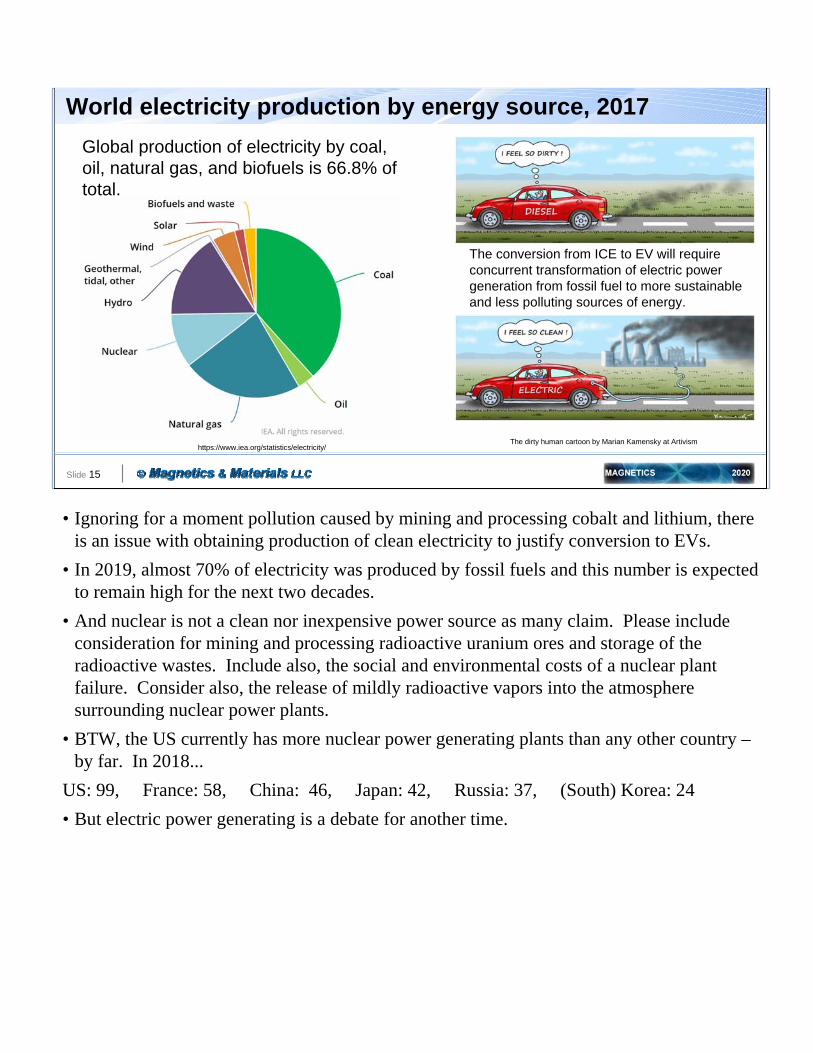
World electricity production by energy source, 2017
Global production of electricity by coal, oil, natural gas, and biofuels is 66.8% of total.
https://www.iea.org/statistics/electricity/The dirty human cartoon by Marian Kamensky at Artivism
The conversion from ICE to EV will require concurrent transformation of electric power generation from fossil fuel to more sustainable and less polluting sources of energy.
• Ignoring for a moment pollution caused by mining and processing cobalt and lithium, there is an issue with obtaining production of clean electricity to justify conversion to EVs.
• In 2019, almost 70% of electricity was produced by fossil fuels and this number is expected to remain high for the next two decades.
• And nuclear is not a clean nor inexpensive power source as many claim. Please include consideration for mining and processing radioactive uranium ores and storage of the radioactive wastes. Include also, the social and environmental costs of a nuclear plant failure. Consider also, the release of mildly radioactive vapors into the atmosphere surrounding nuclear power plants.
• BTW, the US currently has more nuclear power generating plants than any other country –by far. In 2018...
US: 99, France: 58, China: 46, Japan: 42, Russia: 37, (South) Korea: 24
• But electric power generating is a debate for another time.

Slide 16
Examples of PMs in Automotive: Combination of REPM and Ferrite
Source: TDK, https://product.tdk.com/info/en/products/magnet/technote/ap_automotive.html Magnet grades are shown in blue
• In addition to the traction drive motor, what other permanent magnet uses are there in a typical LDV?
• Hitachi, TDK and GM have all presented graphics showing what devices use magnets.
• This illustration by TDK also includes grade of ferrite and NdFeB magnet.
• One point made from the graphics and other textual information is that different car manufacturers have approached the use of magnets within LDVs differently – not all design the same way.
Slide 17
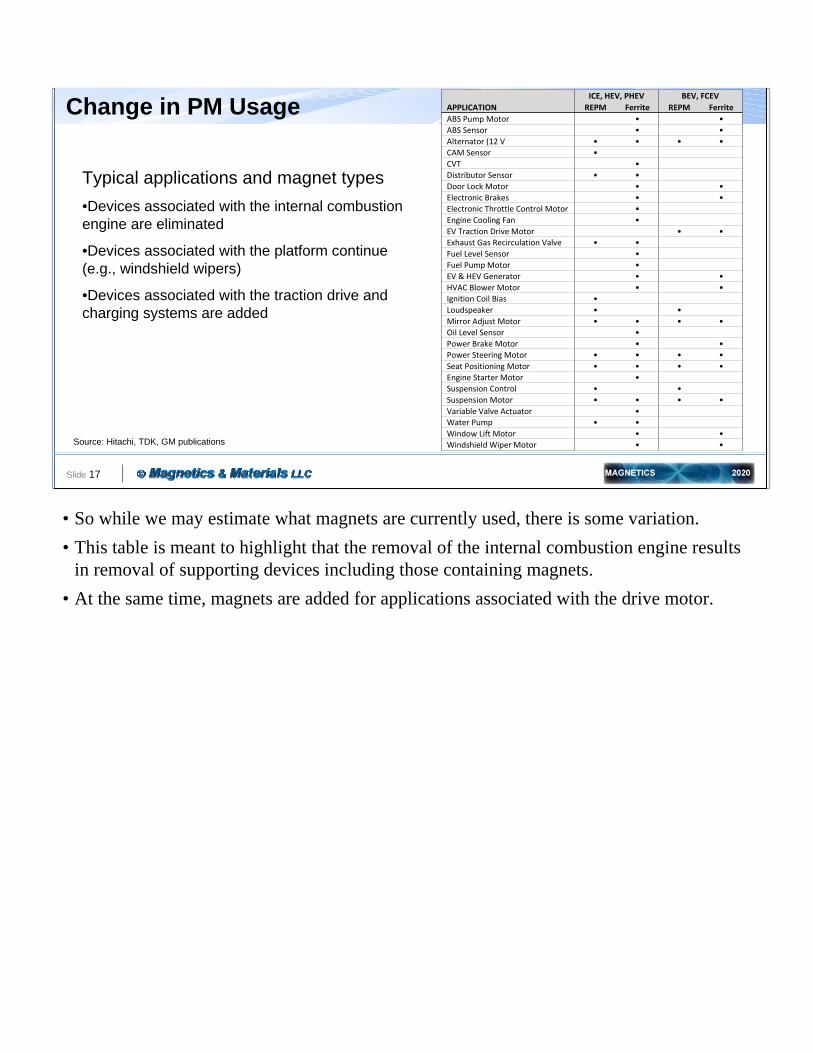
Change in PM Usage
Typical applications and magnet types
•Devices associated with the internal combustion engine are eliminated
•Devices associated with the platform continue (e.g., windshield wipers)
•Devices associated with the traction drive and charging systems are added
ICE, HEV, PHEV BEV, FCEV
APPLICATION REPM Ferrite REPM Ferrite
ABS Pump Motor • •
ABS Sensor • •
Alternator (12 V • • • •
CAM Sensor •
CVT •
Distributor Sensor • •
Door Lock Motor • •
Electronic Brakes • •Electronic Throttle Control Motor •
Engine Cooling Fan •
EV Traction Drive Motor • •Exhaust Gas Recirculation Valve • •
Fuel Level Sensor •
Fuel Pump Motor •
EV & HEV Generator • •
HVAC Blower Motor • •Ignition Coil Bias •
Loudspeaker • •
Mirror Adjust Motor • • • •Oil Level Sensor •
Power Brake Motor • •
Power Steering Motor • • • •
Seat Positioning Motor • • • •
Engine Starter Motor •Suspension Control • •
Suspension Motor • • • •
Variable Valve Actuator •
Water Pump • •
Window Lift Motor • •Windshield Wiper Motor • •Source: Hitachi, TDK, GM publications
• So while we may estimate what magnets are currently used, there is some variation.
• This table is meant to highlight that the removal of the internal combustion engine results in removal of supporting devices including those containing magnets.
• At the same time, magnets are added for applications associated with the drive motor.
Slide 18
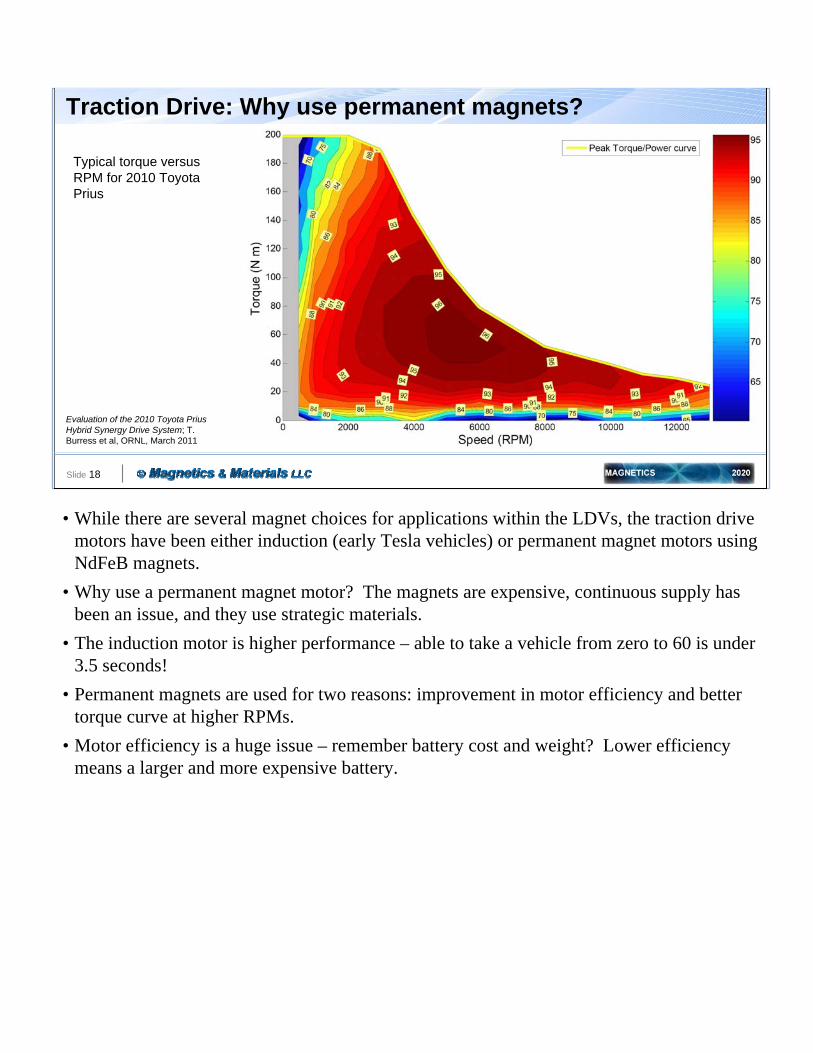
Traction Drive: Why use permanent magnets?
Typical torque versus RPM for 2010 Toyota Prius
Evaluation of the 2010 Toyota Prius Hybrid Synergy Drive System; T. Burress et al, ORNL, March 2011
• While there are several magnet choices for applications within the LDVs, the traction drive motors have been either induction (early Tesla vehicles) or permanent magnet motors using NdFeB magnets.
• Why use a permanent magnet motor? The magnets are expensive, continuous supply has been an issue, and they use strategic materials.
• The induction motor is higher performance – able to take a vehicle from zero to 60 is under 3.5 seconds!
• Permanent magnets are used for two reasons: improvement in motor efficiency and better torque curve at higher RPMs.
• Motor efficiency is a huge issue – remember battery cost and weight? Lower efficiency means a larger and more expensive battery.
Slide 19
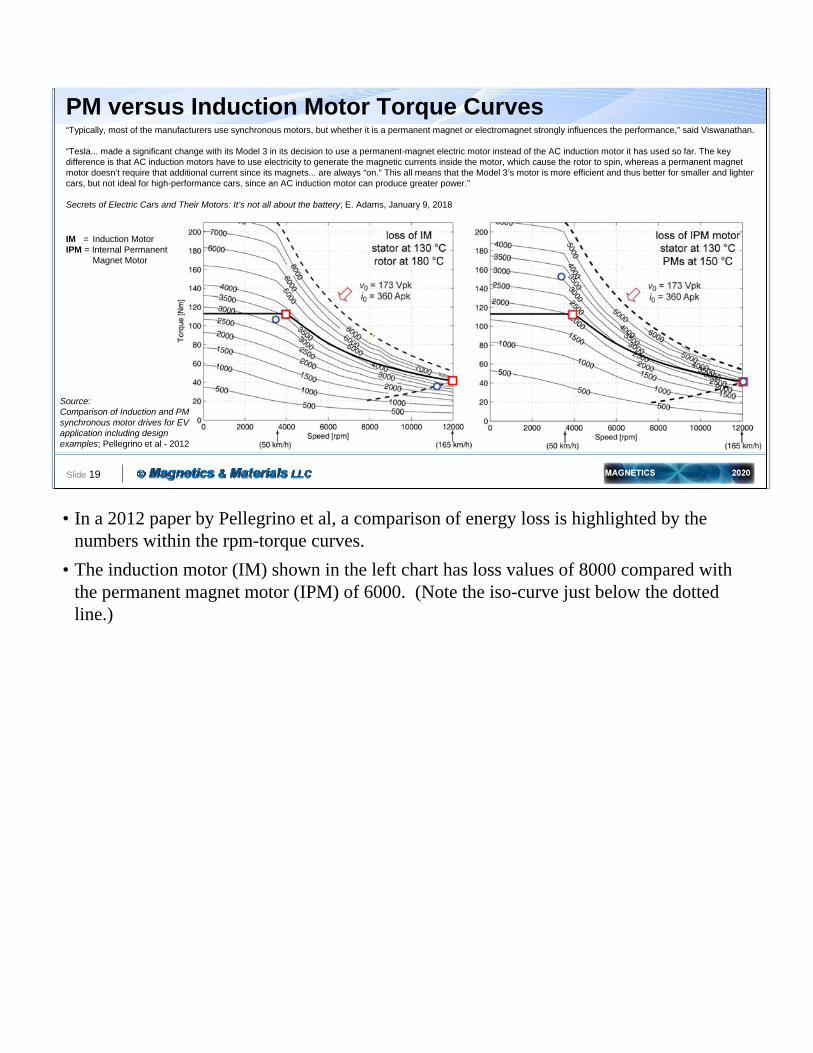
PM versus Induction Motor Torque Curves“Typically, most of the manufacturers use synchronous motors, but whether it is a permanent magnet or electromagnet strongly influences the performance,” said Viswanathan.
“Tesla... made a significant change with its Model 3 in its decision to use a permanent-magnet electric motor instead of the AC induction motor it has used so far. The key difference is that AC induction motors have to use electricity to generate the magnetic currents inside the motor, which cause the rotor to spin, whereas a permanent magnet motor doesn’t require that additional current since its magnets... are always “on.” This all means that the Model 3’s motor is more efficient and thus better for smaller and lighter cars, but not ideal for high-performance cars, since an AC induction motor can produce greater power.”
Secrets of Electric Cars and Their Motors: It’s not all about the battery; E. Adams, January 9, 2018
Source:Comparison of Induction and PM synchronous motor drives for EV application including design examples; Pellegrino et al - 2012
IM = Induction MotorIPM = Internal Permanent
Magnet Motor
• In a 2012 paper by Pellegrino et al, a comparison of energy loss is highlighted by the numbers within the rpm-torque curves.
• The induction motor (IM) shown in the left chart has loss values of 8000 compared with the permanent magnet motor (IPM) of 6000. (Note the iso-curve just below the dotted line.)
Slide 20
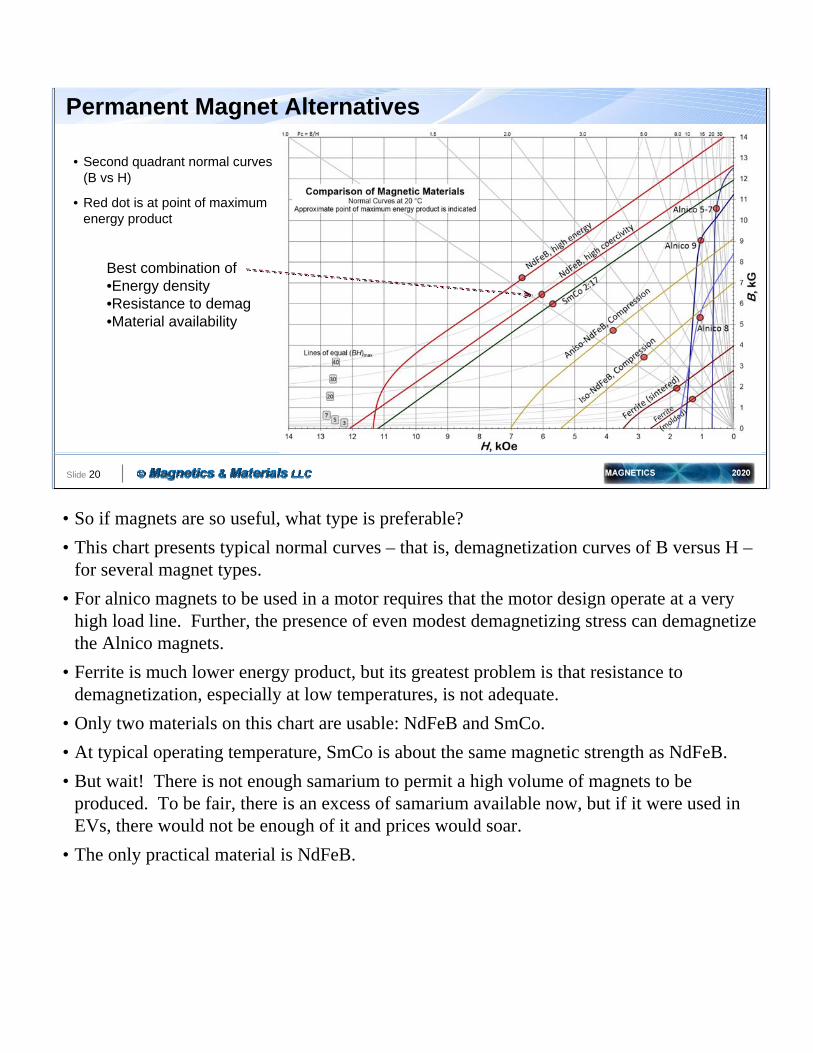
Permanent Magnet Alternatives
• Second quadrant normal curves (B vs H)
• Red dot is at point of maximum energy product
Best combination of•Energy density•Resistance to demag•Material availability
• So if magnets are so useful, what type is preferable?
• This chart presents typical normal curves – that is, demagnetization curves of B versus H –for several magnet types.
• For alnico magnets to be used in a motor requires that the motor design operate at a very high load line. Further, the presence of even modest demagnetizing stress can demagnetize the Alnico magnets.
• Ferrite is much lower energy product, but its greatest problem is that resistance to demagnetization, especially at low temperatures, is not adequate.
• Only two materials on this chart are usable: NdFeB and SmCo.
• At typical operating temperature, SmCo is about the same magnetic strength as NdFeB.
• But wait! There is not enough samarium to permit a high volume of magnets to be produced. To be fair, there is an excess of samarium available now, but if it were used in EVs, there would not be enough of it and prices would soar.
• The only practical material is NdFeB.
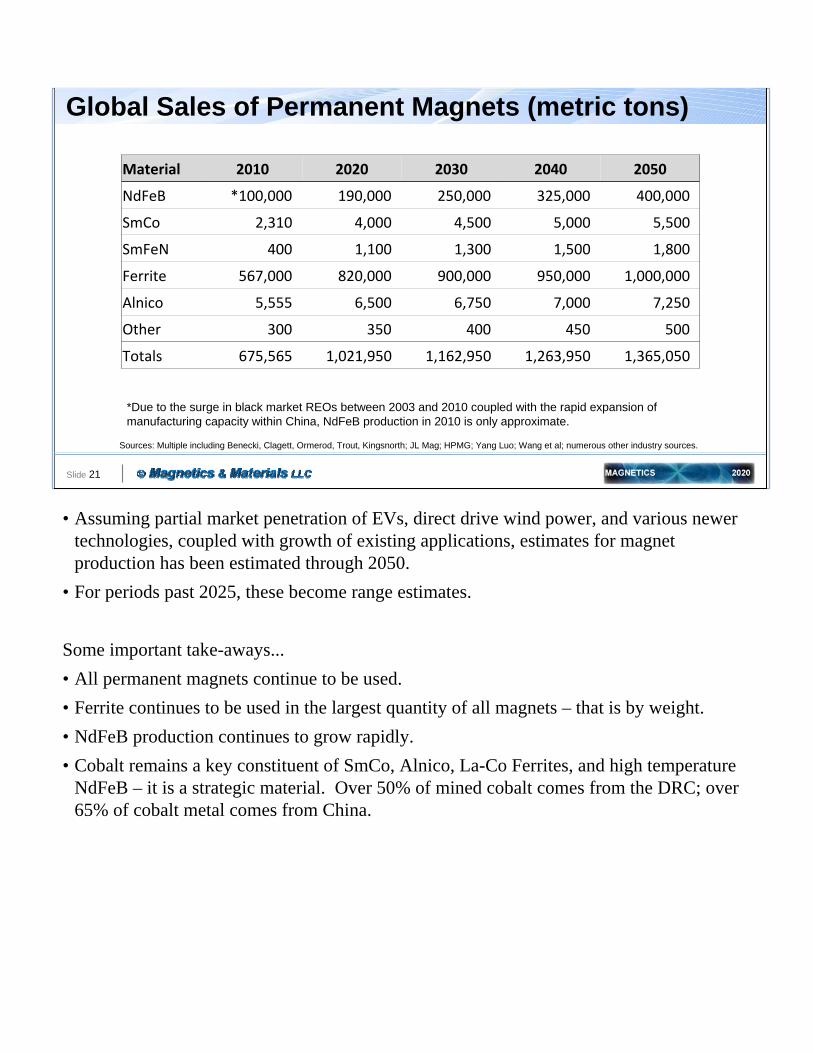
• Assuming partial market penetration of EVs, direct drive wind power, and various newer technologies, coupled with growth of existing applications, estimates for magnet production has been estimated through 2050.
• For periods past 2025, these become range estimates.
Some important take-aways...
• All permanent magnets continue to be used.
• Ferrite continues to be used in the largest quantity of all magnets – that is by weight.
• NdFeB production continues to grow rapidly.
• Cobalt remains a key constituent of SmCo, Alnico, La-Co Ferrites, and high temperature NdFeB – it is a strategic material. Over 50% of mined cobalt comes from the DRC; over 65% of cobalt metal comes from China.
Slide 21
Global Sales of Permanent Magnets (metric tons)
Sources: Multiple including Benecki, Clagett, Ormerod, Trout, Kingsnorth; JL Mag; HPMG; Yang Luo; Wang et al; numerous other industry sources.
Material 2010 2020 2030 2040 2050
NdFeB *100,000 190,000 250,000 325,000 400,000
SmCo 2,310 4,000 4,500 5,000 5,500
SmFeN 400 1,100 1,300 1,500 1,800
Ferrite 567,000 820,000 900,000 950,000 1,000,000
Alnico 5,555 6,500 6,750 7,000 7,250
Other 300 350 400 450 500
Totals 675,565 1,021,950 1,162,950 1,263,950 1,365,050
*Due to the surge in black market REOs between 2003 and 2010 coupled with the rapid expansion of manufacturing capacity within China, NdFeB production in 2010 is only approximate.

Slide 22
ASTM International ‒ Permanent Magnet Standards
• A1054: Sintered Ferrite Permanent Magnets
• A1070: Cast and Sintered Alnico Permanent Magnets
• A1101: Sintered and Fully Dense Neodymium Iron Boron (NdFeB) Permanent Magnets
• A1102: Sintered Samarium Cobalt (SmCo) Permanent Magnets
www.astm.org
• Before closing this discussion, I’d like to share two additional slides.
• This first one deals with magnetic materials’ standards that have been or are being developed by ASTM, IEC, and in China.
• The four ASTM permanent magnet standards are listed here. Standards for Alnico, SmCo and NdFeB are recent – within the past two years.
• I would urge you to become a member of ASTM and participate in the creation and maintenance of standards.
• The $75 annual dues provide access to one volume of ASTM standards - for example, the 53 or so magnetics standards in volume 03.07.
• Each of the permanent magnet standards also includes appendixes with information about the material composition and manufacture. The standards are informational as well as normative which broadens their usefulness.
Slide 23
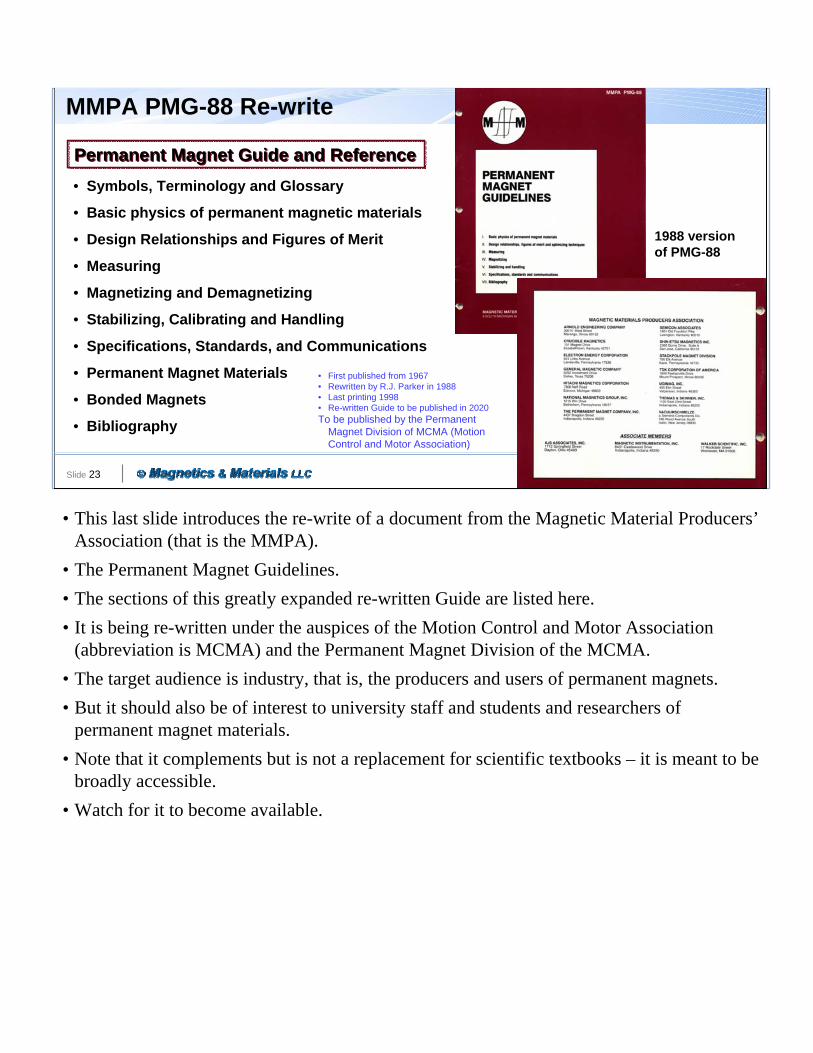
MMPA PMG-88 Re-write
• Symbols, Terminology and Glossary
• Basic physics of permanent magnetic materials
• Design Relationships and Figures of Merit
• Measuring
• Magnetizing and Demagnetizing
• Stabilizing, Calibrating and Handling
• Specifications, Standards, and Communications
• Permanent Magnet Materials
• Bonded Magnets
• Bibliography
Permanent Magnet Guide and ReferencePermanent Magnet Guide and Reference
• First published from 1967• Rewritten by R.J. Parker in 1988• Last printing 1998• Re-written Guide to be published in 2020 To be published by the Permanent
Magnet Division of MCMA (Motion Control and Motor Association)
1988 version of PMG-88
• This last slide introduces the re-write of a document from the Magnetic Material Producers’Association (that is the MMPA).
• The Permanent Magnet Guidelines.
• The sections of this greatly expanded re-written Guide are listed here.
• It is being re-written under the auspices of the Motion Control and Motor Association (abbreviation is MCMA) and the Permanent Magnet Division of the MCMA.
• The target audience is industry, that is, the producers and users of permanent magnets.
• But it should also be of interest to university staff and students and researchers of permanent magnet materials.
• Note that it complements but is not a replacement for scientific textbooks – it is meant to be broadly accessible.
• Watch for it to become available.
Slide 24
Steve Constantinides
Magnetics & Materials LLC
4785 County Road 33
Honeoye, NY 14471
www.magmatllc.com
Honeoye Lake in the Finger Lakes region of New York State
• Education in Materials Science
• Four years Military
• 12 years with Corning Inc. (Glass Works)
• 3 years with tungsten carbide manufacturer (GTE)
• 4 years with Crucible Magnetics (Crumax)
• 25 years with Arnold Magnetic Technologies
• 3 years as independent consultant-contractor
• Thank you!