the human development and capability association (hdca
TRANSCRIPT
The Human Development and Capability Association (HDCA)
2012 International Conference
“Revisiting Development: Do We Assess It Correctly?”
Jakarta, 5-7 September 2012
Changes in well-being level of households
in Hanoi and Ho Chi Minh City: Trends and implications
Le Ho Phong Linh1, Patrick Gubry2, Nguyen Trong Hoai3
1 Ho Chi Minh City Institute for Development Studies (HIDS), [email protected] 2 Institute of Research for Development (IRD), UMR “Development and Societies”, University
Paris 1, [email protected] 3 Economics University of Ho Chi Minh City, [email protected]
2
Abstract Vietnam has achieved a relatively high economic growth rate during the last three
decades. However, the growth is accompanied with many socio-economic issues
that hinder improvement in the quality of life of the households. This paper aims at
tabulating a practical well-being index to measure changes in the level of well-
being of households in Hanoi and Ho Chi Minh City, the two biggest cities in
Vietnam. The index was established based on the Theory of Human Needs and the
available data about living standards of households in the cities during the 2002-
2008 period. It concerns aspects of households’ life such as demography, social
status, education, health, work, financial status, living accommodations, and
consumption. The study showed that the aggregate level of well-being of
households in the cities has increased during the period but the trends of the
indexes were diverse and unstable. Though increasing is the common trend, there
are very few indexes having a continuous increasing trend. Most indexes have
increasing trend with down turn(s) in specific year(s) whereas some of them have
decreasing trends. Further improvements to increase the quality of databases and
the quality of well-being index are necessary.
Keywords: well-being, households, Hanoi, Ho Chi Minh City, Vietnam
1. Introduction The economy of Vietnam was officially transformed from a “central planned
economy” to a “market oriented economy” in 1986 when the nation was in a deep
deficit crisis4. At that time, the internal production could not fulfil the domestic
demand while the population of the country was increasing 2.32% per year. In
such a harsh condition, how to increase the production to meet the demand of
people is one of the crucial aims of the country. To achieve the target, several
socio-environmental factors were neglected and/or sacrificed for economic
purposes. Hanoi and Ho Chi Minh City, the two most important urban centres of
4 This process is called “Doi moi” or “Renovation”.
3
the country, were strongly influenced by this orientation. Despite impressive
achievement in economic development, the negative impacts of economic growth
in the cities are easy to observe. Socio-environmental problems such as pollution,
inequality, high density, traffic congestion, deteriorated infrastructure, decrease of
green spaces, etc. are dramatically increasing.
One of the main causes of the problems is the over-evaluation of the important role
of economic factors. Since “Doi moi”, the increase of economic indicators is
considered as the achievement of national progress. Economic growth is a mean to
achieve a better life but it is not an aim in itself. The final aim of people is to have
a good life, which is more meaningful than just being rich. Without good indexes
to measure development, it would be hard for policy makers to identify goals,
priorities, steps and the necessary resources for the development goals. However,
there are very few studies about quality of life and methods to measure the
improvement in quality of life of the households in Vietnam. Therefore, this study
focuses on issues such as “Is it possible to measure changes in the well-being level
of households by an aggregate index?”, “Which are possible indicators to measure
changes in the well-being level of households in Hanoi and Ho Chi Minh City?”,
“How does the well-being level of households in the cities change by time?” and
“Is there a gap between economic growth and improvement of well-being level of
households in the cities?”
4
2. Formulating the well-being index of households: Theoretical and
technical issues
Theory and data
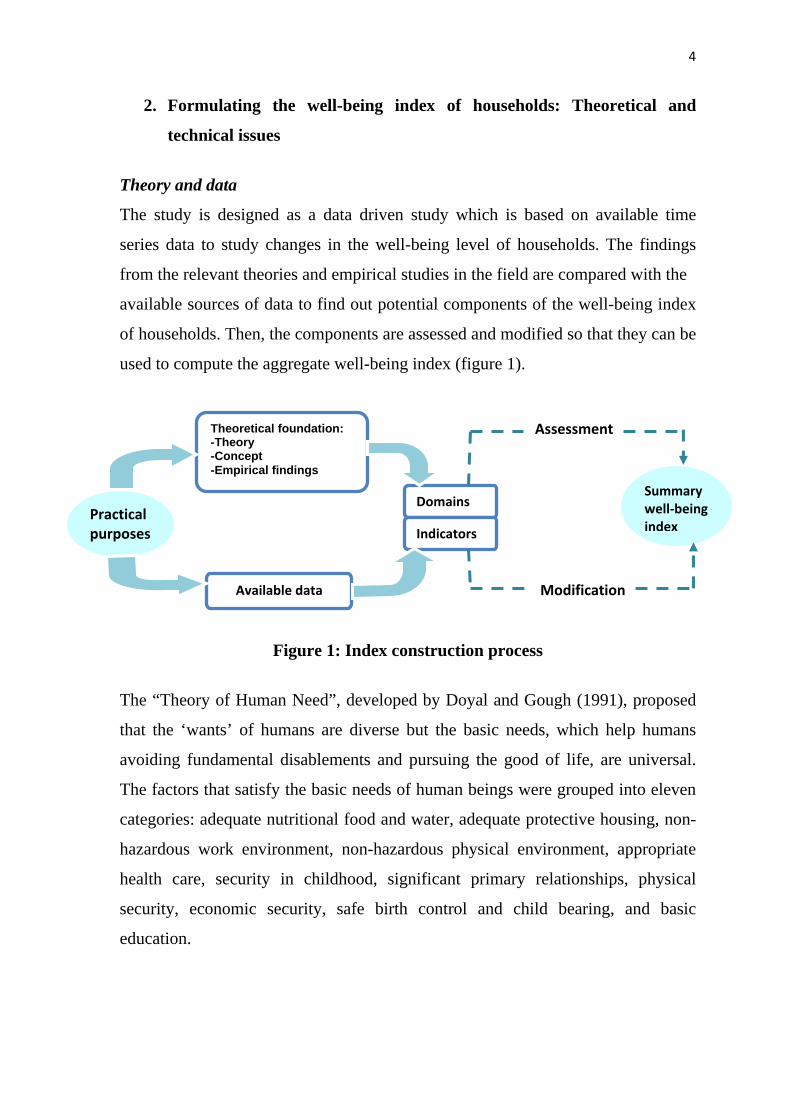
The study is designed as a data driven study which is based on available time
series data to study changes in the well-being level of households. The findings
from the relevant theories and empirical studies in the field are compared with the
available sources of data to find out potential components of the well-being index
of households. Then, the components are assessed and modified so that they can be
used to compute the aggregate well-being index (figure 1).
Figure 1: Index construction process
The “Theory of Human Need”, developed by Doyal and Gough (1991), proposed
that the ‘wants’ of humans are diverse but the basic needs, which help humans
avoiding fundamental disablements and pursuing the good of life, are universal.
The factors that satisfy the basic needs of human beings were grouped into eleven
categories: adequate nutritional food and water, adequate protective housing, non-
hazardous work environment, non-hazardous physical environment, appropriate
health care, security in childhood, significant primary relationships, physical
security, economic security, safe birth control and child bearing, and basic
education.
Practical purposes
Summary well‐being index
Theoretical foundation:-Theory -Concept -Empirical findings
Available data
Domains
Indicators
Assessment
Modification
5
Dolan, Peasgood and White (2006) have reviewed 153 relevant studies to find out
potential indicators of personal well-being and possible influences of the indicators
to well-being. Based on the synthetic results of the studies, they have classified
possible well-being indicators into seven groups: income, personal characteristics,
socially developed characteristics, time using, attitudes and beliefs, relationships,
and environment. These findings are coherent with the categories of the “Theory
of Human Need”. And they are used as guidance for the determination of well-
being indicators.
Among the available databases, the Vietnam Household Living Standards Survey
(VHLSS) is the most suitable data for the study. Though there are severe
limitations5, the VHLSS is the only available database that possesses detailed and
systematic information about aspects of life of households in the whole Vietnam.
From 2002, the survey is carried out every two years. This gives room for time-
series analyses. The two cities, Hanoi and Ho Chi Minh City (HCMC), were
chosen with the aim to study urban well-being and urban poverty which is lower
than in rural areas, but less known and sometimes more worrisome. The
comparison between both cities is the second aim. Besides changes in socio-
economic life of the cities are happening very fast; it makes the observation of
changes within a short period of time easier. The descriptive information of the
data of the both provinces6 is illustrated in table 1.
5 The main limitation is the sampling method. It excludes ‘mobile households’, ‘floating
population’ and increases the “cluster effect” of the collected data. Others limitations are the small sample size, the level of representativeness of the database, and sometimes the questions which were asked at the interviews.
6 The surveyed data does not represent the data for the cities of Hanoi and HCMC, but the data of the whole provinces which include a large portion of rural population.

6
Table 1: Descriptive characteristics of sampling data
Hanoi HCMC
20087 2006 2004 2002 2008 2006 2004 2002
Number of surveyed households
240 240 240 740 300 300 300 775
Mean of p-weight 3575.9 3160.3 2763.8 884.1 5088.2 4380.3 3849.0 1345.9
Sources: Author’s calculation from VHLSS 2002, 2004, 2006, and 2008
Except on year 2002, the sample sizes of the cities were kept constant at 240
observations in Hanoi and 300 observations in HCMC during the 2004-2008
period. The average sampling weights have increased gradually during the study
period due to population increase.
Components of the well-being index
All information of the four VHLSS which might be used to measure the well-being
level of households were listed, modified and checked if they could be used as a
component of the well-being index. Finally, 29 indicators were selected as
components of the summary well-being index and were grouped into seven
domains.
Table 2: Components of the well-being index
Indicator Definition
1. Demographic and social characteristics
non-single parent Ratio of non-single parent households (households have father, mother and child/children)
non-single occupant
Ratio of non-single occupant households (households have at least two members)
KT1 Ratio of household members who have a permanent resident permit and live in this dwelling (members who live and register at the same place)
non-poor Ratio of households which are not classified as poor8
7 In 2008, the boundaries of Hanoi were extended. Yet, the data of the year 2008 in this study are
the data of the old Hanoi. 8 The ratio of poor households in VHLSS 2008 is the ratio of poor households in 2007 as there is
not information about the ratio of poor households in 2008 in the questionnaire.

7
life improvement Ratio of households which state that life of household members is currently better than five years before9
2. Educational status
schooling status Ratio of households which state that there is no member from 6 to 18 years old who did not attend school in the last 12 months
literate Ratio of households which state that there is no member equal to or older than 13 who does not know how to read and write
bachelor or above Ratio of households which state that there is at least one member having a bachelor degree or above
3. Health and entertainment
healthy Ratio of household members which have not suffered from any illness or injury in the last 12 months
Insurance Ratio of household members who have had health insurance or free health care in the last 12 months
non-hospitalized Ratio of household members who have not used in-patient treatment in the last 12 months
entertainment Ratio of daily expenses for books, newspapers, magazines and entertainment over living expenditure of household in the last 12 months
non-smoking Ratio of households that have had no smokers in the last 12 months
4. Work and career
working status Ratio of households which state that there is no members who could not find a job in the last 12 months
leader Ratio of households which state that there is at least one member who is a leader in any field in the last 12 months
professional Ratio of households which state that there is at least one member who has a high or mid-level professional status in any field in the last 12 months
working time Ratio of households in which the average of time worked by working members was not higher than 56 hours per week in the last 12 months
5. Financial status
excess income Ratio of excess income over incomes of households (the excess income of the household is income minus living expenditure)
health care coverage
Ratio of households not stating that they could not afford to cover health careexpenses for all household members in the last 12 months
Unindebtedness Ratio of households not having to borrow money or goods or being indebted in the last 12 months
6. Consumption and basic services
non-food expenses Ratio of non-food expenses over living expenditures of households in the last12 months (non-food expenses is living expenditure minus expenditures for food and drink)
tap water Ratio of households having tap water as a main source of drinking and cooking water
non-rental payment Ratio of non-rental payment expenses in total living expenditures
9 The base years of this question are different in VHLSS. Thus, the values of this indicator were
adjusted based on the assumption that the percentage of households which state that the life of household members has improved after one year is constant during the mentioned period in the questionnaire.

8
of households in the last 12 months (the non-rental payment expenses is living expenditure minus housing rental expense)
7. Ownership and living accommodations
assets and appliances
Ratio of assets and durable goods that households have in the total of the items listed in the questionnaire
living space Average living area of household members equal to or larger than 25 m2
permanent house Ratio of households which are located in a permanent house
safe toilet Ratio of households having a safe and protected toilet (flush toilet with septic tanks sewage pipes)
house ownership Ratio of households that own or partly own the dwelling in which they are living
Internet connection Ratio of households having an Internet connection
To mitigate the impacts of the “economy of scale”, the regional and seasonal
differences, and the imprecision of the collected values, the index does not use the
absolute value but the relative ratios of the indicators. The year 2002 is chosen as
the base year and it is indexed at 100%. The index value is the percentage of the
current value of the indicator divided by its base value. However, the Hanoi versus
HCMC well-being indexes (Hanoi vs. HCMC well-being indexes) applies a multi-
base method. The index value of an indicator in a specific year is the percentage of
the value of this indicator of the households in Hanoi divided by the corresponding
value in HCMC.
Mean and weight of the index
There are three kinds of means: arithmetic, geometric and harmonic. The
arithmetic mean is the most commonly used method to compute aggregate indexes.
It is also the most transparent method for index construction (Salzman 2003, Smith
et al. 2007). The arithmetic and harmonic means have an important limitation.
They are very sensitive to outliers and skewed data, which are common for
aggregate indexes in social sciences. Besides, these kinds of means do not qualify
for the requirement for self-consistency of an index (Fisher 1987)10. The geometric
10 The requirement is that the product of an index which follows a forward method and an index
that follows a backward method, of the same data set, must be 1.00. Assume that there are two series of data for 5 years as follow: 10, 15, 20, 12, 20 and 50, 90, 80, 100, 60 The arithmetic

9
mean is the only one which satisfies both requirements (Smith et al., 2007: 372-
374). This mean can better capture the performance of the individual dimensions
of the aggregate index. It respects the differences and reduces the level of
substitutability across dimensions (UNDP 2010). Therefore, it is applied to
calculate the well-being index of households.
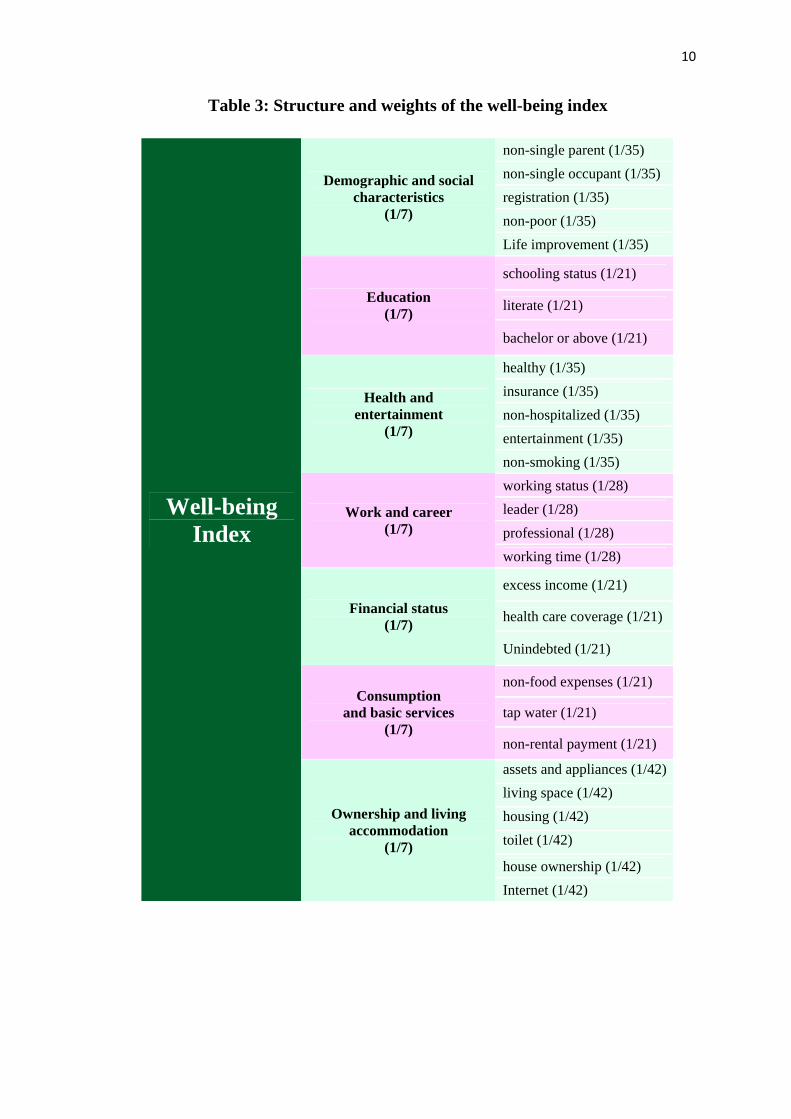
Since there is no persuasive evidence for an appropriate weighting scheme for the
well-being index, equal weight is applied. This technique is more favourable than
other weighting schemes as it makes the choice of weight less subjective and
minimizes the disagreements among indicators or domains (Hagerty and Land
2004, Salzman 2003, Smith et al. 2007, Decancq and Lugo 2008, Alkire 2010). It
is a weighting scheme that has no preference to any component of the aggregate
index. A detailed description of the relative weight of components of the index is
illustrated in table 3.
mean (AM), geometric mean (GM), and harmonic mean (HM) of these series of data by forward and backward methods are as follows:
Forward (1st year base) Backward (5th year base) Mean 1st 2nd 3th 4th 5th 5th 4th 3th 2nd 1stAM 1 1.65 1.8 1.6 1.6 1 1.13 1.17 1.13 0.67GM 1 1.643 1.79 1.55 1.55 1 1 1.15 1.06 0.65HM 1 1.636 1.78 1.5 1.5 1 0.88 1.14 1 0.62
Taking the 5th value of the forward index multiplied by the 1st index value of the backward index for the three means, we have the value of AM, GM, and HM: 1.07, 1, and 0.94 respectively. The value of GM always equals to 1.
10
Table 3: Structure and weights of the well-being index
non-single parent (1/35)
non-single occupant (1/35)
registration (1/35)
non-poor (1/35)
Demographic and social characteristics
(1/7)
Life improvement (1/35)
schooling status (1/21)
literate (1/21) Education
(1/7)
bachelor or above (1/21)
healthy (1/35)
insurance (1/35)
non-hospitalized (1/35)
entertainment (1/35)
Health and entertainment
(1/7)
non-smoking (1/35)
working status (1/28)
leader (1/28)
professional (1/28)
Work and career (1/7)
working time (1/28)
excess income (1/21)
health care coverage (1/21) Financial status
(1/7)
Unindebted (1/21)
non-food expenses (1/21)
tap water (1/21) Consumption
and basic services (1/7)
non-rental payment (1/21)
assets and appliances (1/42)
living space (1/42)
housing (1/42)
toilet (1/42)
house ownership (1/42)
Well-being Index
Ownership and living accommodation
(1/7)
Internet (1/42)
11
Evaluating the well-being index
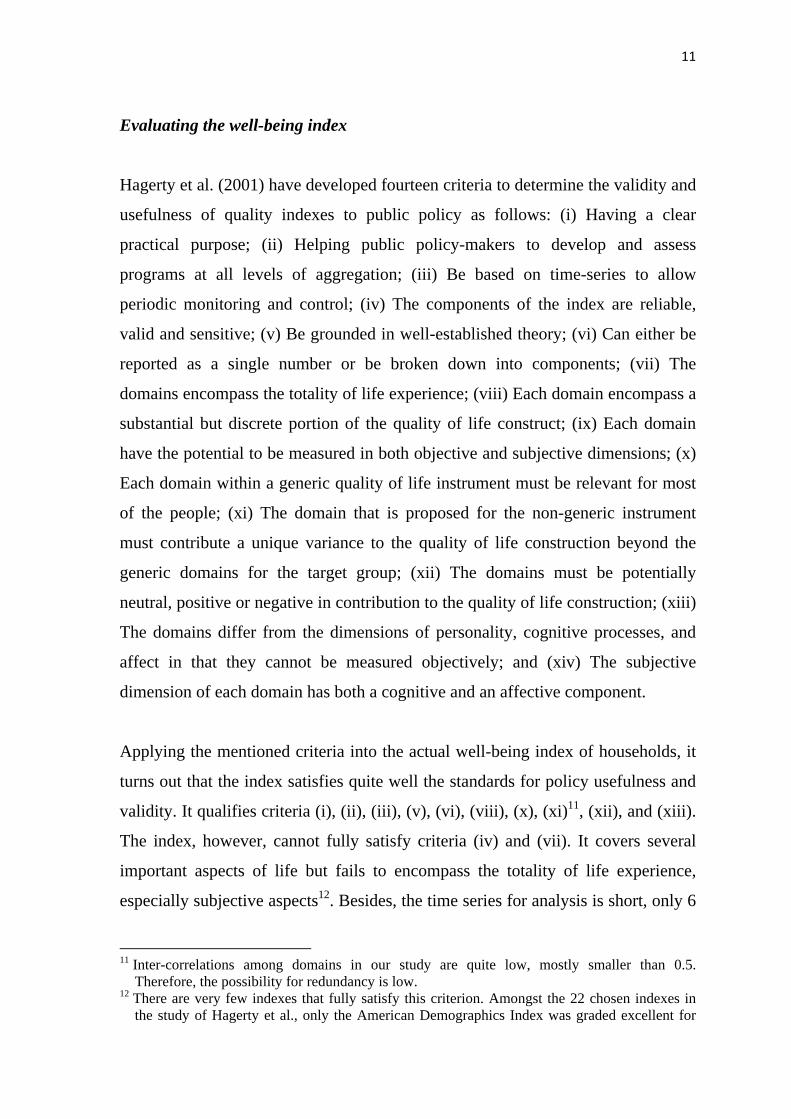
Hagerty et al. (2001) have developed fourteen criteria to determine the validity and
usefulness of quality indexes to public policy as follows: (i) Having a clear
practical purpose; (ii) Helping public policy-makers to develop and assess
programs at all levels of aggregation; (iii) Be based on time-series to allow
periodic monitoring and control; (iv) The components of the index are reliable,
valid and sensitive; (v) Be grounded in well-established theory; (vi) Can either be
reported as a single number or be broken down into components; (vii) The
domains encompass the totality of life experience; (viii) Each domain encompass a
substantial but discrete portion of the quality of life construct; (ix) Each domain
have the potential to be measured in both objective and subjective dimensions; (x)
Each domain within a generic quality of life instrument must be relevant for most
of the people; (xi) The domain that is proposed for the non-generic instrument
must contribute a unique variance to the quality of life construction beyond the
generic domains for the target group; (xii) The domains must be potentially
neutral, positive or negative in contribution to the quality of life construction; (xiii)
The domains differ from the dimensions of personality, cognitive processes, and
affect in that they cannot be measured objectively; and (xiv) The subjective
dimension of each domain has both a cognitive and an affective component.
Applying the mentioned criteria into the actual well-being index of households, it
turns out that the index satisfies quite well the standards for policy usefulness and
validity. It qualifies criteria (i), (ii), (iii), (v), (vi), (viii), (x), (xi)11, (xii), and (xiii).
The index, however, cannot fully satisfy criteria (iv) and (vii). It covers several
important aspects of life but fails to encompass the totality of life experience,
especially subjective aspects12. Besides, the time series for analysis is short, only 6
11 Inter-correlations among domains in our study are quite low, mostly smaller than 0.5.
Therefore, the possibility for redundancy is low. 12 There are very few indexes that fully satisfy this criterion. Amongst the 22 chosen indexes in
the study of Hagerty et al., only the American Demographics Index was graded excellent for

12
years, and the data of the base year, the year 2002, are not complete. The index is
unqualified for criteria (ix) and (xiv); the lack of subjective information of well-
being domains is also the main limitation of our well-being index. This is also a
common limitation of most data driven studies about quality of life, well-being and
multidimensional poverty13.
Another issue of the index is its significance. In this study, our concern is whether
changes in the well-being level of households by time are real or if they just
happen by chance. The Spearman test is applied to test this hypothesis as it is less
sensitive to extreme values than the Pearson test (StataCorp 2009: 1769). The H0
hypothesis is that the mean of indicators is unchanged by time. If this null
hypothesis is rejected or the test is significant, we can conclude that there are real
changes in the index values by time. Changes of means of indicators are not
caused by sampling chance. This conclusion is reliable at 1%, 5% or 10%,
depending on the level of significance of the test (Garson 2009).
3. Well-being dynamics: Trends and disparities
Changes in the well-being level of households in the cities: The Individual
index14
This part examines the trends and disparities of the individual indexes within
domains of well-being of households in the cities15.
criterion (vii). Other eight indexes were graded satisfactory while the other 13 indexes were not satisfactory (Hagerty et al. 2001).
13 Detailed information about criteria and index evaluation can be consulted in Hagerty et al. 2001.
14 Detail information about values of individual indexes, domain indexes, and the aggregate indexes were illustrated in appendix 1 and 2.
15 The values of the indicators were illustrated in appendix 1.
13
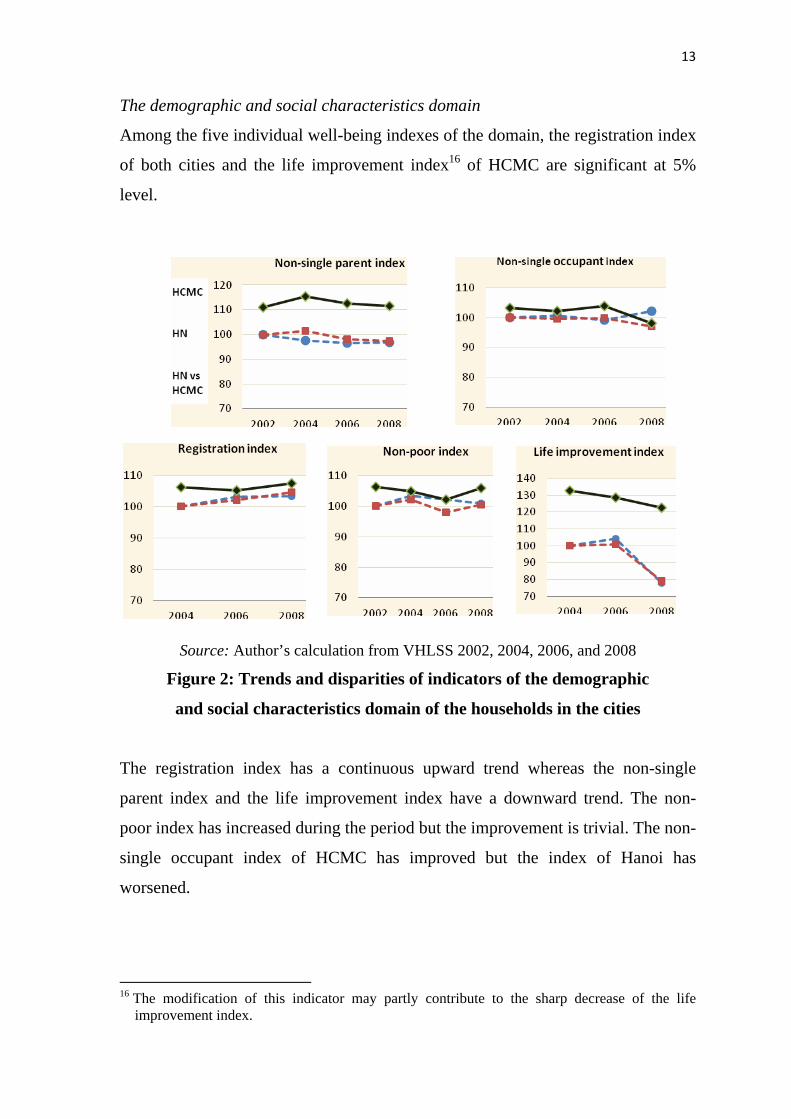
The demographic and social characteristics domain
Among the five individual well-being indexes of the domain, the registration index
of both cities and the life improvement index16 of HCMC are significant at 5%
level.
Source: Author’s calculation from VHLSS 2002, 2004, 2006, and 2008
Figure 2: Trends and disparities of indicators of the demographic
and social characteristics domain of the households in the cities
The registration index has a continuous upward trend whereas the non-single
parent index and the life improvement index have a downward trend. The non-
poor index has increased during the period but the improvement is trivial. The non-
single occupant index of HCMC has improved but the index of Hanoi has
worsened.
16 The modification of this indicator may partly contribute to the sharp decrease of the life
improvement index.

14
The educational status domain
In comparison with the base values, all individual well-being indexes of the
educational domain have increased in the 2002-2008 period but the increasing
trends of the indexes are not stable. Besides, only the schooling status index of
HCMC is significant at 10% level. This implies that the changes of individual
indexes may be not real. However, all the HN vs. HCMC indexes are significant at
1% level which implies that the differences between the cities are reliable at 99%
or above.
Source: Author’s calculation from VHLSS 2002, 2004, 2006, and 2008.
Figure 3: Trends and disparities of the indicators
of the educational index of household in the cities
Comparing the two cities, it is obvious that the educational status of households in
Hanoi is better than that of HCMC. The improvement trends of the indexes of
households in Hanoi are not only clearer but also more consistent than that of
HCMC. Although, there is a convergent tendency of the schooling status index and
the bachelor or above index of households in the cities, the disparity of the literate
index between the cities tends to increase by time.
15
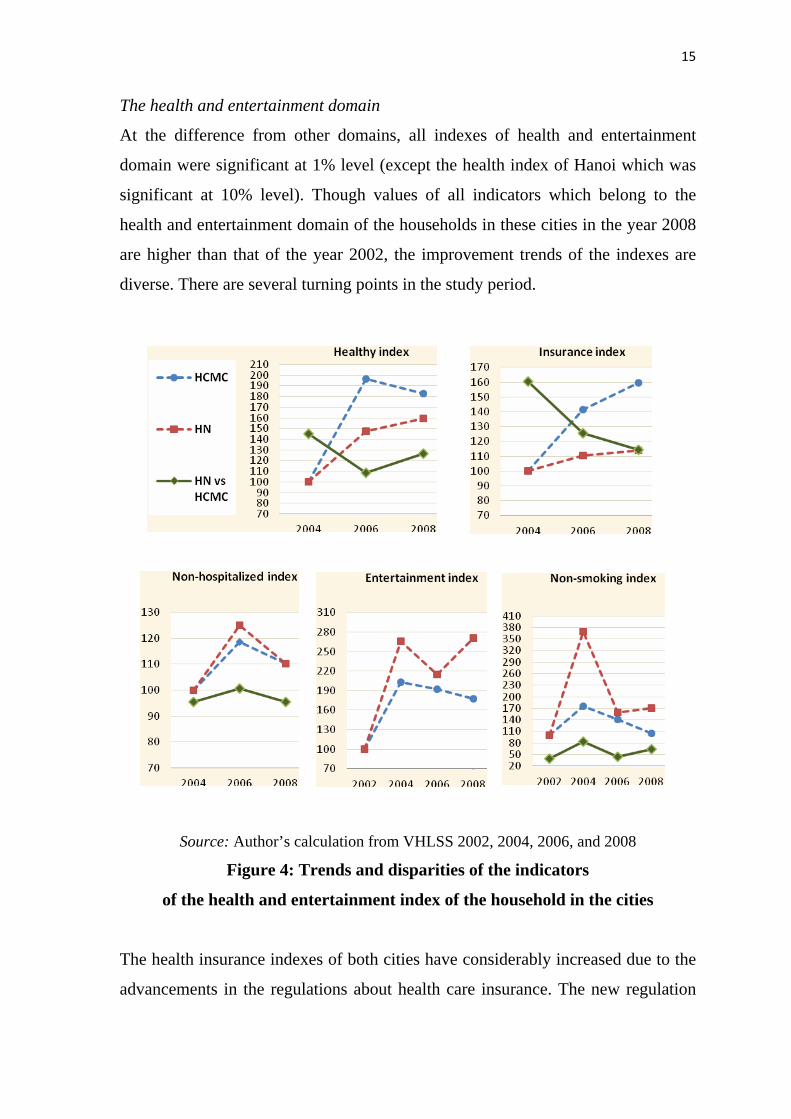
The health and entertainment domain
At the difference from other domains, all indexes of health and entertainment
domain were significant at 1% level (except the health index of Hanoi which was
significant at 10% level). Though values of all indicators which belong to the
health and entertainment domain of the households in these cities in the year 2008
are higher than that of the year 2002, the improvement trends of the indexes are
diverse. There are several turning points in the study period.
Source: Author’s calculation from VHLSS 2002, 2004, 2006, and 2008
Figure 4: Trends and disparities of the indicators
of the health and entertainment index of the household in the cities
The health insurance indexes of both cities have considerably increased due to the
advancements in the regulations about health care insurance. The new regulation

16
allows individuals to have chance to buy a “voluntary health care insurance”17 and
increases the number of agents who can receive free health care from the State.
The entertainment indexes of the cities have increased very fast. However, the
sharp increase mainly comes from the fact that the base values of this indicator
were very low in the year 2002 (the ratio of expenses for entertainment in the total
expenses of households were 0.17% in Hanoi and 0.38% in HCMC). When the
government pushed up the “socialization” process of the entertainment activities, it
allowed non-government sectors to participate in entertainment activities. The
entertainment services have been diversified and became more attractive to the
people.
17 According to circular 14/2007/TTLT-BYT-BTC about voluntary health care, from 12/2007,
individuals can buy health care insurance. This is a considerable improvement in the regulation about health insurance in Vietnam.
17
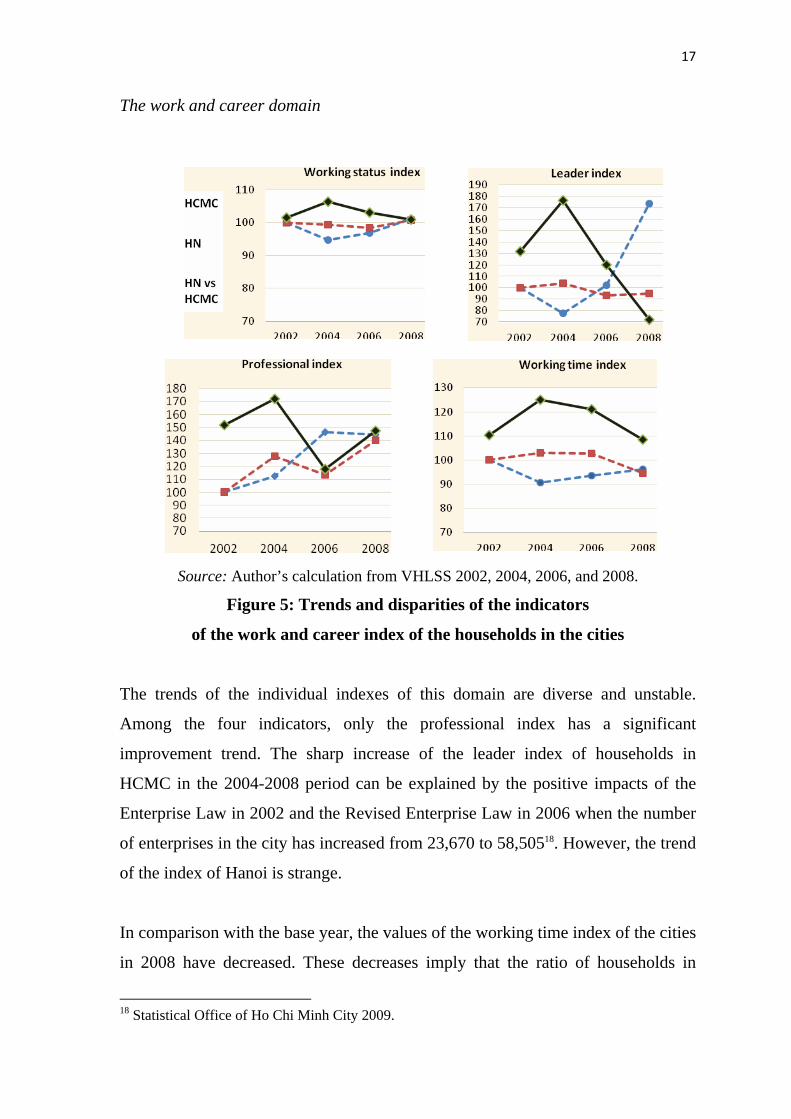
The work and career domain
Source: Author’s calculation from VHLSS 2002, 2004, 2006, and 2008.
Figure 5: Trends and disparities of the indicators
of the work and career index of the households in the cities
The trends of the individual indexes of this domain are diverse and unstable.
Among the four indicators, only the professional index has a significant
improvement trend. The sharp increase of the leader index of households in
HCMC in the 2004-2008 period can be explained by the positive impacts of the
Enterprise Law in 2002 and the Revised Enterprise Law in 2006 when the number
of enterprises in the city has increased from 23,670 to 58,50518. However, the trend
of the index of Hanoi is strange.
In comparison with the base year, the values of the working time index of the cities
in 2008 have decreased. These decreases imply that the ratio of households in
18 Statistical Office of Ho Chi Minh City 2009.

18
which the average time worked by the working members is higher than 56 hours
per week has increased despite the implementation of the decision No.
188/1999/AD-TTg about 40-working hours in November 1999.
The financial status domain
Within the financial status domain, the excess income index and the health care
coverage index of HCMC are significant at the 1% level. The unindebtedness
index of the households in Hanoi is significant at 5% level while others are
insignificant at the 10% level.
Source: Author’s calculation from VHLSS 2002, 2004, 2006, and 2008
Figure 6: Trends and disparities of the indicators
of the financial status domain of the households in the cities
All the three financial indexes of households in the cities have improved in the
2002-2008 period. However, the values of the excess income index in the year
2008 are much lower than the values of the peak year. The trends imply that the
excess income of households have decreased in the recent years. This finding is
suitable with the practical economic status of Vietnam over the period. The
country is facing many difficulties. The inflation rate of Vietnam has increased
from 4% in 2002 to 9.5% in 2004, then to 6.6% in 2006 and soared up to 23% in
19
200819. The increase of the unindebtedness index of the households shows an
improvement in the financial status of the households but it is also a signal that the
households are more careful about spending and investment activities.
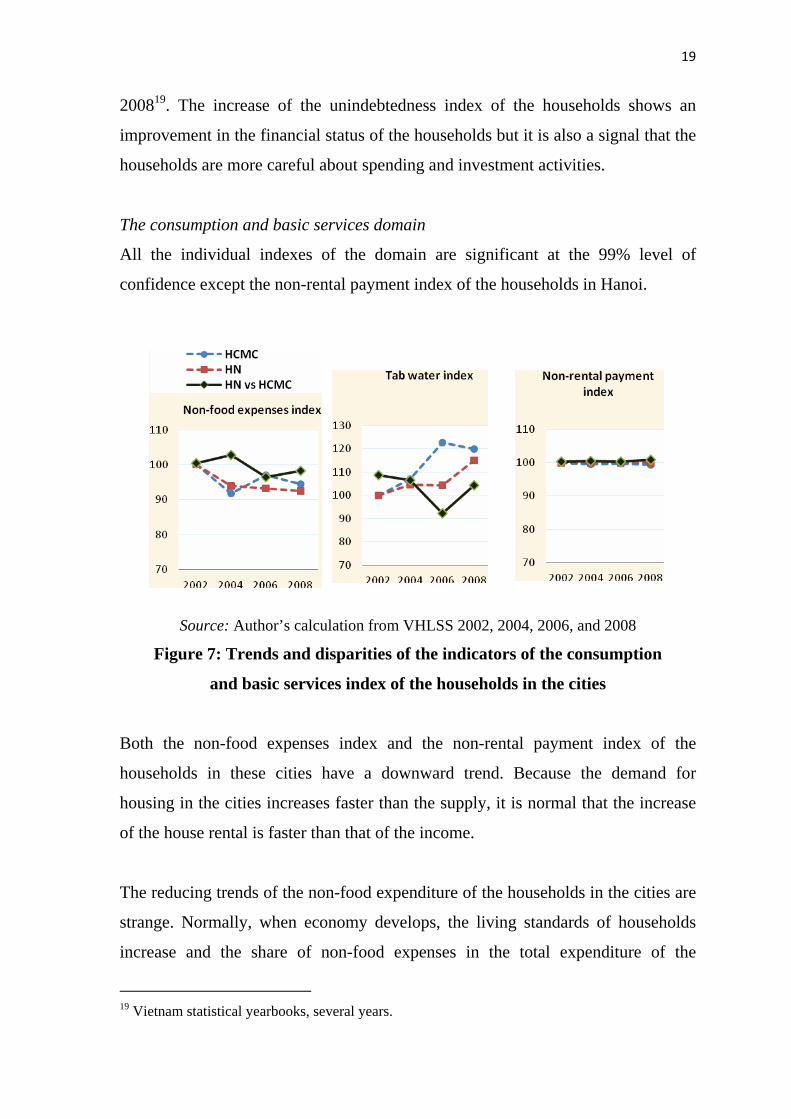
The consumption and basic services domain
All the individual indexes of the domain are significant at the 99% level of
confidence except the non-rental payment index of the households in Hanoi.
Source: Author’s calculation from VHLSS 2002, 2004, 2006, and 2008
Figure 7: Trends and disparities of the indicators of the consumption
and basic services index of the households in the cities
Both the non-food expenses index and the non-rental payment index of the
households in these cities have a downward trend. Because the demand for
housing in the cities increases faster than the supply, it is normal that the increase
of the house rental is faster than that of the income.
The reducing trends of the non-food expenditure of the households in the cities are
strange. Normally, when economy develops, the living standards of households
increase and the share of non-food expenses in the total expenditure of the
19 Vietnam statistical yearbooks, several years.

20
households decreases. The main cause of this tendency is the high level of inflation
and the difficulties of the economy of Vietnam in those years.
The ownership and living accommodation domain
All the individual indexes of this domain are significant at the 99% level of
confidence and have increasing trends.
Source: Author’s calculation from VHLSS 2002, 2004, 2006, and 2008
Figure 8: Trends and disparities of the indicators of the ownership
and living accommodation index of the households in the cities
The index which has the highest growth rate is the Internet connection. Within six
years from 2002 to 2008, the index values of the cities have increased by more
than 350%. Overall, the households in HCMC have a higher improvement rate of
the assets and appliances index, the permanent house index, and the Internet
21
connection index. However, the households in Hanoi have a higher improvement
rate of the living space index, and the safe toilet index.
Changes in the well-being level of households in the cities: The domain and
aggregate indexes20
Changes in the well-being level of households in Hanoi
The aggregate well-being index of households in Hanoi has increased by 11.6%
during the period but the trends of the domain indexes are diverse. Thus, the
improvement in the well-being level of households is neither high nor stable. The
only domain which has increased consecutively during the six years is the
ownership and living accommodation (57.4%). The values of the other five
indexes have also increased but at a moderate level: health and entertainment
(6.1%), financial status (9.6%), educational status (7.7%), work and career, and
consumption and basic services (2%), whereas, the value of the demographic and
social characteristics index has decreased by 6.5% during the period. The results
remind that the structure and relations within households are sensitive to the
changes in socio-economic conditions.
20 The values of the domains and the aggregate indexes are illustrated in appendix 2.

22
Source: Author’s calculation from VHLSS 2002, 2004, 2006 and 2008
Figure 9: Changes in the well-being level of households in Hanoi
Changes in the well-being level of households in Ho Chi Minh City
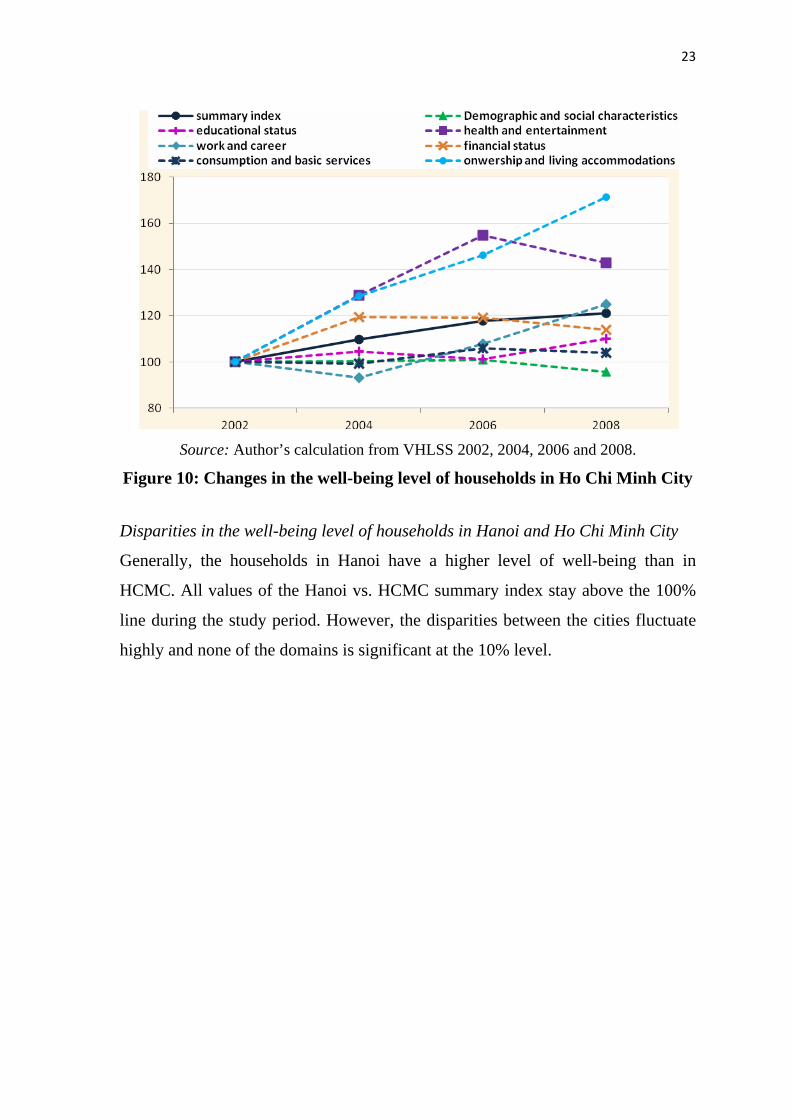
Figure 10 illustrates the changes of the domain indexes and the summary well-
being index of households in HCMC by time. Overall, most domain indexes of the
households in HCMC have the same trends with the corresponding domains of the
households in Hanoi. However, the levels of changes and improvement of the
indexes of households are higher in HCMC. The summary well-being index of
households in HCMC has increased by 21.1% during the period. The other
domains, also have upward trends with down turn(s) in specific year(s). Whereas,
the demographic and social characteristics has decreased by 4.2%.
23
Source: Author’s calculation from VHLSS 2002, 2004, 2006 and 2008.
Figure 10: Changes in the well-being level of households in Ho Chi Minh City
Disparities in the well-being level of households in Hanoi and Ho Chi Minh City
Generally, the households in Hanoi have a higher level of well-being than in
HCMC. All values of the Hanoi vs. HCMC summary index stay above the 100%
line during the study period. However, the disparities between the cities fluctuate
highly and none of the domains is significant at the 10% level.

24
Source: Author’s calculation from VHLSS 2002, 2004, 2006, and 2008
Figure 11: Disparities in the well-being level of the households
in Hanoi and Ho Chi Minh City
In detail, the households in Hanoi have a higher level in educational status,
demographic and social characteristics, work and career, ownership and living
accommodation, and consumption and basic services. The households in HCMC,
however, have a higher level of financial status and health and entertainment
domains.
4. Well-being dynamics: Findings and implications
Main results
Despite limitations of the data, the findings provided an overview about changes in
the level of well-being as well as disparities in the well-being level of the
households in the cities. Overall, the level of well-being of the households has
increased during the 2002-2008 period. However, the trends of the individual and
domain indexes of the households are diverse. Some indexes have gradually
increased; many indexes have increased with down turn(s) while some have
decreased.
25
There is a common belief in developing countries, which is also popular in
Vietnam, that there is a close relation between economic development and quality
of life of the people. However, the findings show that this relation is not strong.
The average improvements rate of the aggregate well-being index of households in
Hanoi is about 2%/year and the corresponding ratio of HCMC is about 3,5%/year
during the 2002-2008 period, much lower than the average growth rate of the
cities21 . Besides, the economic growth rates of the cities were high and stable
during the period but the increase of the well-being indexes was slow and unstable.
This study is one of the very first efforts which aim at exploring changes in the
well-being level of households in the cities. There are various limitations.
However, the findings show that it is possible to monitor changes in the life of
households based on the available data. Development is a very complicated
process, thus having efficient tools to measure the progress toward the goals is
useful. It would help development agents identify priorities and monitor
development progress.
Limitations and further studies
Although the VHLSS are a good source of data for social studies about living
standards of households, they were not carried out to measure the level of well-
being of the households. This is the reason why we had to apply the lowest
standards of the “Theory of Human Need” to measure the level of well-being of
households in Hanoi and Ho Chi Minh City. Therefore, the well-being index in
this study, can only measure the very basic needs of the people. It could not take
into account the subjective opinions of the households about their life as well as
the non-basic needs of humans, such as the need for the autonomy and self-
development, though they are important aspects of human well-being.
21 The economic growth rates of Hanoi in 2005, 2006, 2007 and 2008 were 10.8%, 11.2%, 11.2%
and 10.9% respectively. The corresponding rates of HCMC were 12.2%, 12.1%, 12.6% and 10.7% (Statistical yearbooks of Vietnam, several years).

26
Besides, It is worth to remind that the findings of the study must be interpreted
with cautiousness due to the limitations of available data: small sample size, high
cluster effect, short time series, and sometimes inconsistent data... Moreover, there
are very few data about subjective aspects of households’ life in the database
which hinders the measurement of subjective aspects of the well-being of
households. These facts highlight the need for further improvement of the
database.
The biggest challenge, however, is to select suitable indicators for the well-being
index and to collect reliable data for the measurement. The selected indicators
must properly represent the level of well-being of the people and can be easily
collected. They must be general enough to cover important aspects of life but be
also simple enough for practical applications and understandable by most of the
population. An ideal well-being index must contain both objective and subjective
aspects of households’ life. Further studies which help to clarify the notion and
establish a reliable well-being index would be very useful for the society.
References
Alkire, Sabina. 2010. Multidimensional Poverty and its Discontents. Paper presented at EUDN conference, Paris. December 01.
Dasgupta, Partha. 1993. An Enquiry into Well-Being and Destitution. Oxford: Clarendon Press.
Decancq, Koen and Maria Ana Lugo. 2008. Setting weights in multidimensional indices of well-being. OPHI Working Paper No. 18.
Dolan, Paul, Tessa Peasgood and Mathew White. 2006. Review of research on the influences on personal well-being application for policy making. Final report for Delfra, 24 August 2006.
Doyal, Len and Ian Gough. 1991. A Theory of Human Need, Macmillan, London.
Fisher, Franklin. 1987. Household Equivalence Scales and Interpersonal Comparisons. Review of Economic Studies, Vol. 54: 519-524.
Frones, Ivar. 2007. Theorizing indicators: On Indicators, Signs and Trends. Social Indicators Research, 83: 5-23.
Gough, I.R. and McGregor, J.A., ed. 2007. Wellbeing in Developing Countries: New Approaches and Research Strategies. Cambridge: Cambridge University Press.

27
Hagerty, Michael R., Robert A. Cummins, Abbott L. Ferriss, Kenneth Land, Alex C. Michalos, Mark Peterson, Adrew Sharpe, Joseph Sirgy and Joachim Vogel. 2001. Quality of life indexes for national policy: Review and agenda for research, Social Indicators Research, 55: 1–96.
Hagerty, Michael R. and Kenneth C. Land. 2004. Constructing Summary Indices of Social Well-Being: A Model for the Effect of Heterogeneous Importance Weights. Revision of a paper presented at the annual meeting of the American Sociological Association, Chicago, IL, and August 16-19, 2002.
Harland, C. 2008. Suffering Peacefully. Living with Adversity in Chiawa, Zambia. PhD Diss., University of Bath.
Harrison, Kelly. 2002. Objectifying the Objective List, M.A. Thesis, Rice University.
Garson, David G. 2009. Univariate GLM, ANOVA and ANCOVA. Univariate GLM: Statnotes from North Carolina State University. [http://faculty.chass.ncsu.edu/garson/PA765/anova.htm#ftest; 02/11/2010]
General Statistics Office. 2002. Household Living Standards Survey 2002: Household questionnaire.
___. 2004. Operational Handbook: Vietnam Household Living Standard Survey 2004.
___. 2004a. Household Living Standards Survey 2004: Questionnaire on Household Survey.
___. 2006. Operational Handbook: Vietnam Household Living Standard Survey 2006.
___. 2006a. Household Living Standards Survey 2006: Questionnaire on Household Survey.
___. 2008. Operational Handbook: Vietnam Household Living Standard Survey 2008.
___. 2008a. Household Living Standards Survey 2008: Questionnaire on Household Survey.
Nussbaum, Martha C. and Amartya Sen. Eds. 1993. The Quality of Life. Oxford: Clarendon Press.
Salzman, Julia. 2003. Methodological Choices Encountered in Construction of Composite Indices of Economic and Social Well-Being. Center for the Study of Living Standards.
Smith, James Brubaugh, Heidi Gross, Neil Wollman and Bradley Yoder. 2007. NIVAH: a composite index measuring violence and harm in the U.S. Social Indicator Research, No. 85: 351-387.
StataCorp. 2009. Stata survey data reference manual. Statistical Software – Release 11. College Station, TX: StataCorp LP.
Statistical Office of Ho Chi Minh City. 2009. Number of enterprises at 31 Dec. by type of economic sector and type of enterprise. [www.pso.hochiminhcity.gov.vn/so_lieu_ktxh/2009/Doanh_nghiep_qua_ket_qua_dieu_tra/1001.htm; 06/02/2011]
UNDP-United Nations Development Programme. 2010. Human Development Report. 2009. Vietnam: The Human Development Index-Going Beyond Income. [http://hdrstats.undp.org/en/countries/country_fact_sheets/cty_fs_VNM.html; 01/05/2010]
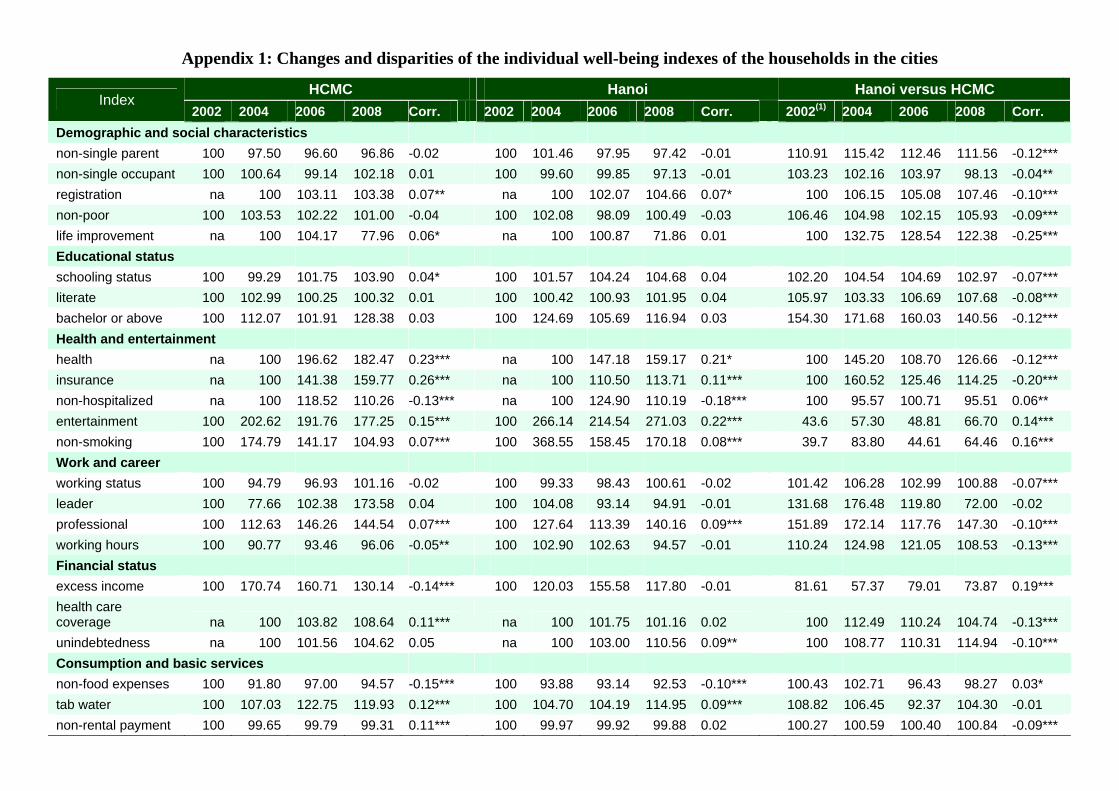
Appendix 1: Changes and disparities of the individual well-being indexes of the households in the cities
HCMC Hanoi Hanoi versus HCMC Index
2002 2004 2006 2008 Corr. 2002 2004 2006 2008 Corr. 2002(1) 2004 2006 2008 Corr.
Demographic and social characteristics
non-single parent 100 97.50 96.60 96.86 -0.02 100 101.46 97.95 97.42 -0.01 110.91 115.42 112.46 111.56 -0.12***
non-single occupant 100 100.64 99.14 102.18 0.01 100 99.60 99.85 97.13 -0.01 103.23 102.16 103.97 98.13 -0.04**
registration na 100 103.11 103.38 0.07** na 100 102.07 104.66 0.07* 100 106.15 105.08 107.46 -0.10***
non-poor 100 103.53 102.22 101.00 -0.04 100 102.08 98.09 100.49 -0.03 106.46 104.98 102.15 105.93 -0.09***
life improvement na 100 104.17 77.96 0.06* na 100 100.87 71.86 0.01 100 132.75 128.54 122.38 -0.25***
Educational status
schooling status 100 99.29 101.75 103.90 0.04* 100 101.57 104.24 104.68 0.04 102.20 104.54 104.69 102.97 -0.07***
literate 100 102.99 100.25 100.32 0.01 100 100.42 100.93 101.95 0.04 105.97 103.33 106.69 107.68 -0.08***
bachelor or above 100 112.07 101.91 128.38 0.03 100 124.69 105.69 116.94 0.03 154.30 171.68 160.03 140.56 -0.12***
Health and entertainment
health na 100 196.62 182.47 0.23*** na 100 147.18 159.17 0.21* 100 145.20 108.70 126.66 -0.12***
insurance na 100 141.38 159.77 0.26*** na 100 110.50 113.71 0.11*** 100 160.52 125.46 114.25 -0.20***
non-hospitalized na 100 118.52 110.26 -0.13*** na 100 124.90 110.19 -0.18*** 100 95.57 100.71 95.51 0.06**
entertainment 100 202.62 191.76 177.25 0.15*** 100 266.14 214.54 271.03 0.22*** 43.6 57.30 48.81 66.70 0.14***
non-smoking 100 174.79 141.17 104.93 0.07*** 100 368.55 158.45 170.18 0.08*** 39.7 83.80 44.61 64.46 0.16***
Work and career
working status 100 94.79 96.93 101.16 -0.02 100 99.33 98.43 100.61 -0.02 101.42 106.28 102.99 100.88 -0.07***
leader 100 77.66 102.38 173.58 0.04 100 104.08 93.14 94.91 -0.01 131.68 176.48 119.80 72.00 -0.02
professional 100 112.63 146.26 144.54 0.07*** 100 127.64 113.39 140.16 0.09*** 151.89 172.14 117.76 147.30 -0.10***
working hours 100 90.77 93.46 96.06 -0.05** 100 102.90 102.63 94.57 -0.01 110.24 124.98 121.05 108.53 -0.13***
Financial status
excess income 100 170.74 160.71 130.14 -0.14*** 100 120.03 155.58 117.80 -0.01 81.61 57.37 79.01 73.87 0.19***
health care coverage na 100 103.82 108.64 0.11***
na 100 101.75 101.16 0.02
100 112.49 110.24 104.74 -0.13***
unindebtedness na 100 101.56 104.62 0.05 na 100 103.00 110.56 0.09** 100 108.77 110.31 114.94 -0.10***
Consumption and basic services
non-food expenses 100 91.80 97.00 94.57 -0.15*** 100 93.88 93.14 92.53 -0.10*** 100.43 102.71 96.43 98.27 0.03*
tab water 100 107.03 122.75 119.93 0.12*** 100 104.70 104.19 114.95 0.09*** 108.82 106.45 92.37 104.30 -0.01
non-rental payment 100 99.65 99.79 99.31 0.11*** 100 99.97 99.92 99.88 0.02 100.27 100.59 100.40 100.84 -0.09***
29
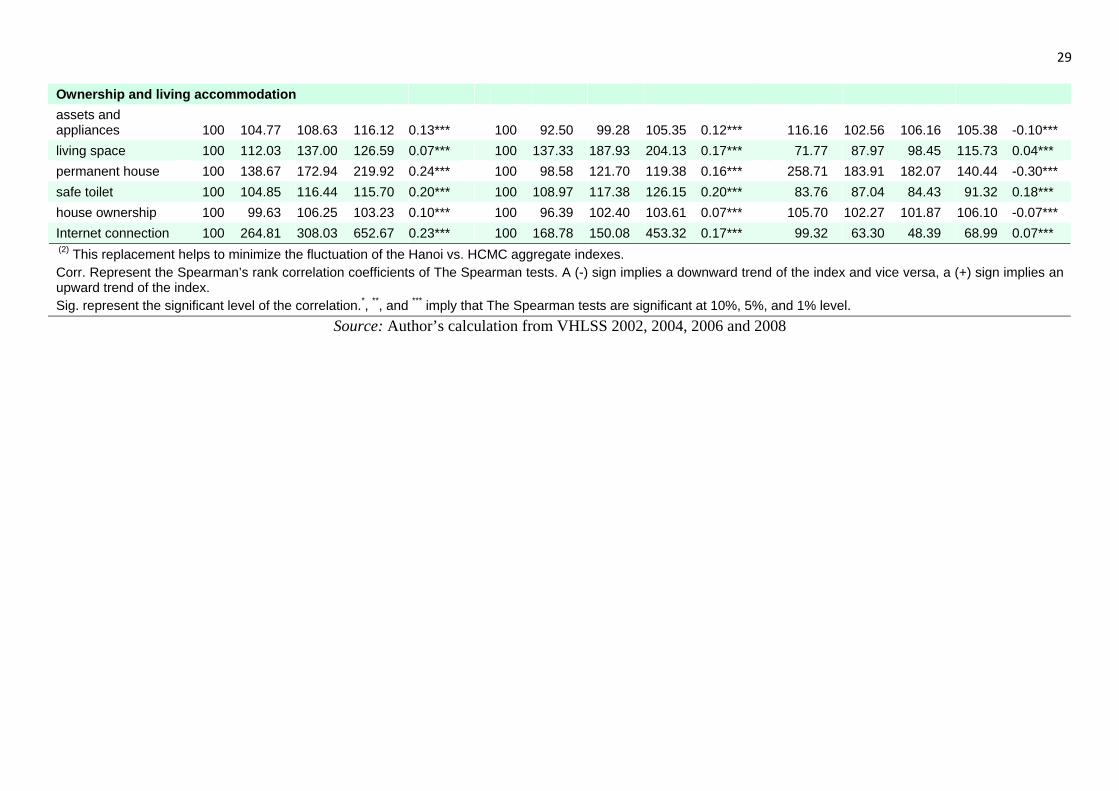
Ownership and living accommodation
assets and appliances 100 104.77 108.63 116.12 0.13***
100 92.50 99.28 105.35 0.12***
116.16 102.56 106.16 105.38 -0.10***
living space 100 112.03 137.00 126.59 0.07*** 100 137.33 187.93 204.13 0.17*** 71.77 87.97 98.45 115.73 0.04***
permanent house 100 138.67 172.94 219.92 0.24*** 100 98.58 121.70 119.38 0.16*** 258.71 183.91 182.07 140.44 -0.30***
safe toilet 100 104.85 116.44 115.70 0.20*** 100 108.97 117.38 126.15 0.20*** 83.76 87.04 84.43 91.32 0.18***
house ownership 100 99.63 106.25 103.23 0.10*** 100 96.39 102.40 103.61 0.07*** 105.70 102.27 101.87 106.10 -0.07***
Internet connection 100 264.81 308.03 652.67 0.23*** 100 168.78 150.08 453.32 0.17*** 99.32 63.30 48.39 68.99 0.07*** (2) This replacement helps to minimize the fluctuation of the Hanoi vs. HCMC aggregate indexes. Corr. Represent the Spearman’s rank correlation coefficients of The Spearman tests. A (-) sign implies a downward trend of the index and vice versa, a (+) sign implies an upward trend of the index. Sig. represent the significant level of the correlation.*, **, and *** imply that The Spearman tests are significant at 10%, 5%, and 1% level.
Source: Author’s calculation from VHLSS 2002, 2004, 2006 and 2008

Appendix 2: Trends and differences of the aggregate well-being indexes of the households in the cities
HCMC Hanoi Hanoi versus HCMC (Hanoi vs. HCMC) Index
2002 2004 2006 2008 Corr. 2002 2004 2006 2008 Corr. 2002 2004 2006 2008 Corr.
Summary index 100 109.77 117.87 121.14 1.00*** 100 112.23 112.48 116.60 1.00*** 101.89 108.67 101.43 102.31 0.16
Demographic & social characteristics
100 100.32 101.01 95.77 1.00***
100 100.62 99.75 93.52 0.00
104.04 111.77 110.04 108.81 0.49
Educational status
100 104.65 101.30 110.190.80
100 108.34 103.60 107.66 0.40
118.67 122.86 121.36 115.94 [-0.05]
Health & entertainment
100 128.78 154.90 142.99 0.80
100 157.88 147.18 155.87 0.40**
70.44 101.35 78.55 90.11 [-0.38]
Work & career 100 93.14 107.92 124.95 0.80 100 107.95 101.63 106.07 0.40 122.29 141.73 115.16 103.80 [-0.05]
Financial status 100 119.52 119.22 113.94 0.20 100 106.27 117.70 109.63 0.80 93.45 88.87 98.68 96.17 0.38
Consumption & basic services
100 99.30 105.91 104.04 0.60
100 99.42 98.98 102.04 0.20
103.10 103.22 96.35 101.11 0.38
Ownership & living accommodations
100 128.50 146.31 171.22 1.00***
100 114.22 126.49 157.41 1.00***
111.26 98.89 96.19 102.28 0.27
Corr. Represent the Spearman’s rank correlation coefficient of Spearman test. (-) sign implies a downward trend of the index and vice versa. Sig. represent the significant level of the correlation.*, **, and *** imply that The Spearman tests are significant at 10%, 5%, and 1% level.
Source: Author’s calculation from VHLSS 2002, 2004, 2006 and 2008