the immunogenetics of natural killer cell alloreactivity · the immunogenetics of natural killer...
TRANSCRIPT
I
The Immunogenetics of Natural Killer Cell
Alloreactivity
Bree Amanda Foley BSc (Hons)
This thesis is presented for the degree of Doctor of Philosophy of the University of
Western Australia
2008 School of Pathology and Laboratory Medicine
II
Statement of Candidate Contribution
All work was performed by the author unless otherwise stated in the thesis ……………………………….. Bree Foley Student ……………………………….. Campbell Witt Supervisor ……………………………….. Frank Christiansen Supervisor

III
Declaration from UWA website

IV
The data presented in chapter 4 has been submitted for publication. The bibliographic
details and percentage contribution of each author to the work are set out below
The Reactivity of Bw4-positive HLA-B and HLA-A Alleles with KIR3DL1: Implications
for Patient and Donor Suitability for Haploidentical Stem Cell Transplants.
Foley BA, De Santis D, van Beelen E, Lathbury LJ, Christiansen FT and Witt CS
Blood 2008 (In Press)
Author Signature
Bree Foley (76%)
Dianne De Santis (4%)
Els Van Beelen (4%)
Louise Lathbury (2%)
Frank Christiansen (4%)
Campbell Witt (10%)

V
The data presented in chapter 5 has been accepted for publication. The bibliographic
details and contribution of each author to the work are set out below.
KIR2DS1-Mediated Activation Overrides NKG2A-Mediated Inhibition in HLA-C C2
Negative Individuals. Foley B, De Santis D, Lathbury L, Christiansen F and Witt, C.
International Immunology Accepted 23rd January 2008 Author Signature
Bree Foley (80%)
Dianne De Santis (5%)
Louise Lathbury (5%)
Frank Christiansen (5%)
Campbell Witt (5%)
VI
Acknowledgments
First and foremost I would like to thank my two supervisors, Campbell Witt and Frank
Christiansen. Thank you for allowing me the opportunity to work on this project. I thank
you both for all of your guidance, advice, patience, wisdom, helpfulness and
encouragement over the past four years. I don’t think that there any words that can
truly describe how thankful I am for all of your efforts in helping me complete this PhD, I
will always be eternally grateful.
I would like to thank the three members of my lab group: Jodie Goodridge, Louise
Lathbury and Dianne De Santis. Jodie I thank you for tolerating my many questions,
always encouraging me and always being there when I needed help. Louise I thank
you for teaching me the ‘ins and outs’ of NK cell cloning and for all your guidance over
the past four years. Dianne I thank you for all of your help in the lab, I really
appreciated having someone else in the lab who knew exactly what studying NK cell
alloreactivity really involved.
A special thank you to Els van Beelen from the Department of Immunohematology and
Blood Transfusion at Leiden University Medical Center for all of your help in generating
the results presented in chapter 4.
Thank you to all the staff at the Department of Clinical Immunology at RPH for all your
help over the years. I thank you for performing class I HLA typing on the donors used in
this thesis and sequencing of KIR genes. I would especially like to thank Catena
Causerano for teaching me the basics of tissue culture, for your infinite wisdom and for
allowing me to work in the cell lab.
VII
Thank you to the staff of the Flow Cytometry Unit (RPH) particularly to Rom Krueger.
Thank you for all of your patience in teaching me the basics of flow cytometry and
helping me to optimise protocols.
Thank you to the staff of the Department of Medical Physics (RPH). I owe you a huge
thank you for your help with the 51Cr-realse cytotoxicity assays and for counting my
many thousands of samples.
Thank you to the staff at the Research Center (RPH). Thank you for allowing me to
work in the radioactive area and work in your tissue culture lab.
Thank you to all of the current and past PhD students, post-doctoral researchers,
research assistants and honours students: Andrew, Ann, Coral-Ann, Craig, Darren,
Diana, Dino, Hayley, Julius, Karey, Leo, Niamh, Nicole, Silvia, Sonia and Steve for all
of your advice over the years, I really do appreciate it all. A special thank you to my
‘lunch buddies’, Coral-Ann, Hayley, Karey, Silvia and Sonia for all the entertaining
lunches over the years. An extra thank you to Coral-Ann for help with formatting this
thesis. A special thank you to Julius for helping me ‘escape’ when experiments didn’t
work out. A special thank you to Diana who always knew exactly what I was going
through and for always being there when I needed someone the most.
Finally I would like to thank my family. Thank you Mum and Dad for your constant
support and encouragement, not just during this PhD but throughout my whole life. I
know it sounds cliché but you always told me that I could do anything that I wanted and
you’ve always believed in me. To my brother Dylan and sister Alyssa, thank you for
always supporting me and for always being there for me.

VIII
Abstract
Natural killer (NK) cell alloreactivity can be exploited in haploidentical haematopoietic
stem cell transplantation (HSCT) to improve graft survival, reduce graft versus host
disease and decrease leukaemic relapse. NK cells lyse cells that have reduced
expression of class I HLA molecules. In an allogeneic setting, donor NK cells may be
activated by the absence of donor (self) class I HLA molecules on recipient cells; the
absence of self-epitopes being detected by inhibitory KIR receptors on donor NK cells.
The way in which genetic polymorphism of the receptors and ligands affects NK
allorecognition of missing self, has not been fully elucidated.
HLA-C molecules are divided into two groups, C1 and C2, with KIR2DL1 recognising
cells expressing C2 and KIR2DL2 and KIR2DL3 recognising cells expressing C1.
Donor NK cells expressing KIR2DL2 or KIR2DL3 can be alloreactive towards a
recipient if they lack the C1 epitope and donor NK cells expressing KIR2DL1 can be
alloreactive towards a recipient if they lack the C2 epitope. KIR3DL1 recognises the
Bw4 epitope present on one-third of HLA-B alleles and certain HLA-A alleles. NK cells
from donors expressing KIR3DL1 can be alloreactive towards recipients whose cells
lack Bw4.
Mismatches of KIR related HLA epitopes does not always results in NK alloreactivity.
Therefore it is not possible to reliably predict NK alloreactivity based solely on the
donor’s HLA type and KIR repertoire and the recipient’s HLA type. The current
selection of suitable donors for a recipient undergoing a haploidentical HSCT involves
long, labourious NK cell cloning assays to determine if the donor’s NK cells can lyse
the recipient’s cells. This thesis has attempted to gain a better understanding of the
interaction of HLA alleles and KIR receptors, which may eventually allow suitable
donors to be predicted from HLA type and KIR genotypes.

IX
To date there has been no systematic survey of all the common HLA-B and HLA-C
alleles to interact with KIR. This thesis examined the ability of all the common HLA-C
alleles to interact with two different alleles of KIR2DL3; KIR2DL3*001 and
KIR2DL3*002. Whilst NK cells expressing KIR2DL3*002 were equally inhibited by
target cells expressing any of the common C1 alleles, NK cells expressing
KIR2DL3*001 were inhibited to a variable degree. HLA-C*1402, a C1 allele, only
weakly inhibited NK cells expressing KIR2DL3*001 or KIR2DL2*001. Other alleles such
as HLA-C*0303 and HLA-C*0304 gave modest inhibition of cells expressing
KIR2DL3*001.
This thesis also undertook a systematic analysis of the ability of the most common
HLA-B alleles and HLA-A alleles with Bw4 serological reactivity to inhibit KIR3DL1-
dependent NK cells. All Bw4-negative HLA-B alleles failed to inhibit target cells from
lysis. All Bw4-positive HLA-B alleles, with the exception of HLA-B*1301 and –B*1302,
protected targets from lysis. HLA-A*2402 and HLA-A*3201 unequivocally protected
target cells from lysis whereas HLA-A*2501 and HLA-A*2301 provided only weak
protection from lysis. KIR3DL1-dependent alloreactive NK clones were identified in
donors whose only Bw4 positive allele was HLA-A*2402 but not in donors whose only
Bw4 positive HLA allele was HLA-B*1301 or B*1302.
Finally this thesis demonstrated that an activating KIR can control NK cell alloreactivity.
Donors who are C2 negative and KIR2DS1 positive had NK cells that expressed the
activating receptor KIR2DS1 and were capable of lysing cells expressing the C2
epitope. More so, KIR2DS1 dependent NK clones were shown to override inhibitory
signals generated by NKG2A interacting with its ligand, HLA-E. The identification of
these NK clones has important implications for haploidentical HSCT in that recipient
expressing all three NK epitopes, C1, C2 and Bw4 were previously thought to be
resistant to alloreactive NK cells controlled by inhibitory receptors. Such patients may
be amenable to haploidentical HSCT from C2 negative, KIR2DS1 positive donors.

X
These results will improve the ability to predict NK cell alloreactivity based on a donor’s
HLA type and KIR repertoire and the recipient’s HLA type.

XI
Table of Contents
THESIS DECLARATION............................................................................................................ II
ACKNOWLEDGMENTS............................................................................................................VI
ABSTRACT .........................................................................................................................VIII
TABLE OF CONTENTS…………………………………………………... ......................................XI
LIST OF TABLES..................................................................................................................XVI
LIST OF FIGURES..............................................................................................................XVIII
CHAPTER 1: LITERATURE REVIEW........................................................................................ 1
1.1 SCOPE OF THE LITERATURE REVIEW............................................................................. 2
1.2 NATURAL KILLER CELLS ................................................................................................... 2
1.2.1 FUNCTIONS OF NK CELLS ............................................................................................. 3
1.2.1.1 Natural Killer Cell Cytotoxicity.......................................................................... 4
1.3 NATURAL KILLER CELL ALLORECOGNITION................................................................... 5
1.3.1 THE “MISSING SELF” HYPOTHESIS.................................................................................. 5
1.3.2 NATURAL KILLER CELLS RECEPTORS ............................................................................. 6
1.3.2.1 Killer Cell Immunoglobulin-like Receptors (KIR) .............................................. 7
1.3.2.2 CD94/NKG2 Receptor Family .......................................................................... 9
1.3.2.3 Leukocyte Immunoglobulin-like Receptors (LILR).......................................... 10
1.3.2.4 Natural Cytotoxicity Receptors....................................................................... 10
1.4 KIR ..................................................................................................................................... 11
1.4.1 KIR HAPLOTYPES ....................................................................................................... 12
1.4.2 KIR GENE POLYMORPHISM ......................................................................................... 13
1.4.3 KIR RECOGNITION OF CLASS I HLA ............................................................................. 13
1.5 DEPARTURES FROM THE SIMPLE C1/C2, BW4/BW6 INHIBITORY MODEL ................. 15
1.5.1 HLA-C*1402 AS A LIGAND FOR KIR2DL2 AND KIR2DL3 .............................................. 15
1.5.2 KIR3DL1 AND HLA-B................................................................................................. 16
1.6 KIR3DL2 AND HLA-A ......................................................................................................... 18
1.7 RULES GOVERNING NK ALLOREACTIVITY .................................................................... 21
1.8 ACTIVATING KIR ............................................................................................................... 22
1.9 ALLOGENEIC BONE MARROW TRANSPLANTATION..................................................... 24
1.9.1 COMPLICATIONS OF BMT ............................................................................................ 24
1.9.1.1 Leukemic Relapse ......................................................................................... 24

XII
1.9.1.2 Rejection........................................................................................................ 25
1.9.1.3 GvHD............................................................................................................. 25
1.9.2 MATCHING DONOR AND RECIPIENT FOR BMT ................................................................ 26
1.9.3 CELLS MEDIATING GRAFT VERSUS HOST DISEASE ........................................................ 26
1.9.3.1 Role of T cells in Graft versus Host Disease.................................................. 26
1.9.3.2 Role of Natural Killer cells in GvHD ............................................................... 28
1.9.4 CELLS MEDIATING THE GRAFT VERSUS LEUKAEMIA EFFECT........................................... 29
1.9.4.1 Role of T cells in GvL effect ........................................................................... 31
1.9.4.2 Role of Natural Killer cells in GvL effect ......................................................... 31
1.10 RECENT EVIDENCE OF THE ROLE OF NK CELLS IN BMT .......................................... 32
1.10.1 EVIDENCE THAT ALLOREACTIVE NK CELLS CAN ELIMINATE LEUKAEMIC CELLS .............. 32
1.10.2 EVIDENCE THAT ALLOREACTIVE NK CELLS CAN PREVENT GVHD.................................. 33
1.10.3 PREDICTION OF NK ALLOREACTIVITY USING HLA AND KIR GENETICS ........................... 34
1.11 HYPOTHESES AND AIMS ............................................................................................... 35
CHAPTER 2: MATERIALS AND METHODS ........................................................................... 37
2.1 CELL CULTURE................................................................................................................. 38
2.1.1 CELL LINES ................................................................................................................ 38
2.1.2 SEPARATION OF PMBC............................................................................................... 39
2.1.2.1 Isolation of PBMC.......................................................................................... 39
2.1.2.2 Isolation of PBMC from Unusable Red Cell Bags as Allogeneic Feeder Cells 39
2.1.2.3 Storage of Pooled Allogeneic PBMC ............................................................. 39
2.1.2.4 Thawing of PBMC.......................................................................................... 40
2.1.2.5 Irradiation of Cells.......................................................................................... 40
2.2 NATURAL KILLER CELL CLONING................................................................................... 40
2.2.1 ENRICHMENT OF NATURAL KILLER CELLS ..................................................................... 40
2.2.2 NATURAL KILLER CELL CLONING.................................................................................. 41
2.2.3 NATURAL KILLER CELL POLYCLONAL CULTURES ........................................................... 41
2.2.4 RESTIMULATION OF NATURAL KILLER CELL CLONES AND POLYCLONAL CULTURES .......... 42
2.3 IMMUNOPHENOTYPING................................................................................................... 42
2.3.1 FLOW CYTOMETRY ON WHOLE BLOOD ......................................................................... 42
2.3.2 NK CELL PHENOTYPYING-LABELLED PRIMARY ANTIBODIES ........................................... 42
2.3.3 NK CELL PHENOTYPYING AND CLASS I HLA STAINING-LABELLED SECONDARY ANTIBODIES
.......................................................................................................................................... 43
2.3.4 ANALYSIS OF FLOW CYTOMETRY DATA......................................................................... 43
2.4 NATURAL KILLER CELL CYTOTOXICITY......................................................................... 43
2.4.1 TARGET CELL PREPARATION ....................................................................................... 44
2.4.2 EFFECTOR CELL PREPARATION ................................................................................... 44

XIII
2.4.3 4 HOUR 51CR RELEASE ASSAY .................................................................................... 44
2.4.4 CD107A ASSAY ......................................................................................................... 45
2.5 DNA AND RNA................................................................................................................... 46
2.5.1 DNA EXTRACTION ...................................................................................................... 46
2.5.2 RNA EXTRACTION ...................................................................................................... 46
2.5.3 REVERSE TRANSCRIPTASE PCR.................................................................................. 46
2.6 POLYMERASE CHAIN REACTION.................................................................................... 46
2.6.1 AMPLIFICATION OF KIR2DL2, KIR2DL3 AND KIR2DS1 FROM CDNA............................. 47
2.6.2 SSP-PCR FOR KIR2DS1 ON GENOMIC DNA AND SSP-PCR FOR KIR2DL1 FROM CDNA48
2.6.3 KIR3DL1 ALLELE TYPING ........................................................................................... 50
2.6.4 KIR GENOTYPING BY SSP- PCR................................................................................. 50
2.6.5 VISUALISING PCR PRODUCTS ..................................................................................... 51
2.6.6 DNA SEQUENCING ..................................................................................................... 51
CHAPTER 3: KIR2DL3*001 AND KIR2DL3*002 DIFFER IN THEIR ABILITY TO INTERACT WITH C1-GROUP HLA-C ALLELES ....................................................................................... 52
3.1 INTRODUCTION ................................................................................................................ 53
3.2 MATERIALS AND METHODS ............................................................................................ 54
3.3 RESULTS ........................................................................................................................... 55
3.3.1 SELECTION OF NK CLONES ......................................................................................... 55
3.3.1.1 Characterisation of Clones from Donor 1 ....................................................... 56
3.3.1.1 Characterisation of Clones from Donor 2 ....................................................... 57
3.3.1.1 Characterisation of Clones from Donor 3 ....................................................... 58
3.3.1.1 Characterisation of Clones from Donor 4 ....................................................... 58
3.3.2 SUMMARY OF NK CLONES........................................................................................... 59
3.3.3 KIR2DL3 MEDIATED INHIBITION BY THE COMMON C1-GROUP AND C2-GROUP HLA-C
ALLELES ............................................................................................................................. 61
3.3.4 HLA-C*1402 INHIBITS NK CELLS FROM SOME DONORS ............................................... 68
3.3.5 HLA-C*1402 ONLY INHIBITS NK CELLS EXPRESSING KIR2DL3*002............................... 70
3.3.6 DO HLA-C ALLELES THAT INTERACT WEAKLY WITH KIR2DL3*001 SHARE AMINO ACID
MOTIFS? ............................................................................................................................. 72
3.4 DISCUSSION ..................................................................................................................... 74
CHAPTER 4: THE REACTIVITY OF BW4-POSITIVE HLA-B AND HLA-A ALLELES WITH KIR3DL1: IMPLICATIONS FOR PATIENT AND DONOR SUITABILITY FOR HAPLOIDENTICAL STEM CELL TRANSPLANTS.................................................................. 79
4.1 INTRODUCTION ................................................................................................................ 80
XIV
4.2 MATERIALS AND METHODS ............................................................................................ 82
4.3 RESULTS ........................................................................................................................... 85
4.3.1 KIR3DL1 GENOTYPE OF NK CELLS............................................................................. 85
4.3.2 KIR3DL1 DEPENDENT NK CELLS LYSE CELLS LACKING THE BW4 EPITOPE.................... 87
4.3.3 HLA-B*13 IS NOT A KIR3DL1 LIGAND BUT HLA-B*5101 IS ........................................... 93
4.3.4 HLA-A*2402 AND HLA-A*3201 ARE LIGANDS FOR KIR3DL1 ........................................ 96
4.3.5 DONORS WHO HAVE HLA-B*1301 OR B*1302 CAN MAKE KIR3DL1 DEPENDENT NK CLONES
BUT THESE NK CLONES ARE INFREQUENT.............................................................................. 98
4.3.6 DONORS WHO LACK BW4 EXPRESSING HLA-B ALLELES BUT EXPRESS HLA-A*2402 CAN
MAKE KIR3DL1 DEPENDENT NK CLONES ............................................................................ 101
4.4 DISCUSSION ................................................................................................................... 102
CHAPTER 5: KIR2DS1-MEDIATED ACTIVATION OVERRIDES NKG2A-MEDIATED INHIBITION IN HLA-C C2 NEGATIVE INDIVIDUALS ........................................................... 108
5.1 INTRODUCTION .............................................................................................................. 109
5.2 MATERIALS AND METHODS .......................................................................................... 111
5.3 RESULTS ......................................................................................................................... 114
5.3.1 ALLOREACTIVE NK CLONES EXPRESSING CD158A LYSE C2 EXPRESSING TARGETS ..... 114
5.3.2 THE ALLOSPECIFICITY OF CLONE C9 CANNOT BY EXPLAINED BY KIR3DL2.................... 116
5.3.3 THE ALLOSPECIFICITY OF CLONE C9 IS DETERMINED BY THE PRESENCE OF THE C2 EPITOPE
IN A DOSE DEPENDENT MANNER ........................................................................................ 118
5.3.4 CLONE C9 EXPRESSES KIR2DS1*002 ...................................................................... 119
5.3.5 ACTIVATION BY C2 POSITIVE TARGETS IS MEDIATED BY KIR2DS1 AND OVER-RIDES
NKG2A MEDIATED INHIBITION............................................................................................ 120
5.3.6 KIR2DS1 ACTIVATED NK CLONES REPRESENT 1% OF ALL NK CELLS IN C1 HOMOZYGOUS
INDIVIDUALS...................................................................................................................... 122
5.3.7 NK CELLS ACTIVATED BY C2 KILL EBV NON-INFECTED TARGETS................................. 125
5.4 DISCUSSION ................................................................................................................... 127
CHAPTER 6: FINAL DISCUSSIONS AND CONCLUSIONS ................................................. 130
6.1 THE AIMS OF THIS THESIS............................................................................................ 132
6.2 SUMMARY OF NEW DATA ON HLA:KIR INTERACTION PROVIDED IN THIS THESIS. 132
6.2.1 KIR2DL2/3 AND HLA-C............................................................................................ 132
6.2.2 KIR3DL1 AND BW4 .................................................................................................. 133
6.2.3 KIR2DS1 AND C2 GROUP HLA-C ALLELES ................................................................ 133
6.3 LIMITATIONS TO THE CONCLUSIONS DRAWN IN THIS THESIS ................................ 134

XV
6.4 FURTHER STUDIES ........................................................................................................ 136
6.5 IMPLICATIONS FOR HAPLOIDENTICAL HSCT.............................................................. 137
CHAPTER 7: REFERENCES ................................................................................................. 138
APPENDICES ........................................................................................................................ 159
APPENDIX 1: SOLUTIONS AND BUFFERS .............................................................................. 160
APPENDIX 2: ANTIBODIES................................................................................................... 164
APPENDIX 3: PRIMER SEQUENCES...................................................................................... 165

XVI
List of Tables
Table 1.1 The five-year probability of leukaemic relapse for AML and ALL patients with
and without ‘NK mismatches’. ...................................................................... 32
Table 2.1 Master Mix for KIR2DL2, KIR2DL3 and KIR2DS1 (cDNA) Full Length PCR 47
Table 2.2 KIR2DL2 cDNA and KIR2DL3 cDNA Full Length PCR Thermocycling
Conditions .................................................................................................. 48
Table 2.3 KIR2DS1 Full Length PCR Thermocycling Conditions................................. 48
Table 2.4 Mater Mix for KIR2DS1 SSP (Genomic DNA) .............................................. 49
Table 2.5 Master Mix for KIR2DL1 SSP (cDNA) .......................................................... 49
Table 2.6 KIR2DS1 SSP (Genomic DNA) and KIR2DL1 SSP (cDNA) Thermocycling
Conditions .................................................................................................... 49
Table 2.7 Master Mix for KIR3DL1 Allele Typing.......................................................... 50
Table 2.8 KIR3DL1 Allele Typing Thermocycling Conditions ....................................... 50
Table 3.1 NK Donor Class I HLA Typing...................................................................... 55
Table 3.2 NK Donor KIR Genotype .............................................................................. 55
Table 3.3 Class I HLA Typing of Target Cell Panel Used To Screen NK Clones......... 56
Table 3.4 NK Clones from Donor 2 for which the Alloreactivity Pattern was Consistent
with Receptor Expression ............................................................................ 57
Table 3.5 NK Clones from Donor 3 for which the Alloreactivity Pattern was Consistent
with Receptor Expression .......................................................................... 58
Table 3.6 HLA-C Target Cell Panel .............................................................................. 61
Table 3.7 HLA-C Target Cell Panel 2 ........................................................................... 64
Table 3.8 HLA-C Target Cell Panel 3 ........................................................................... 66
Table 3.9 Amino Acid Differences between KIR2DL3*002, KIR2DL3*001 and
KIR2DL2*001 ............................................................................................... 71
Table 3.11 Residue 7 Binding Environment of Strong, Moderate and Low Inhibiting
HLA-C .......................................................................................................... 73
Table 3.12 Residue 8 Binding Environment of Strong, Moderate and Low Inhibiting
HLA-C .......................................................................................................... 73

XVII
Table 4.1 HLA Class I and KIR3DL1 Allele Typing of NK Cell Donors........................ 83
Table 4.2. HLA Class I Typing of BLCL Target Cell Panel ........................................... 84
Table 5.1. Class I HLA Typing and NK Epitopes of BLCL Target Cell Panel ............. 112
Table 5.2. HLA Typing NK Epitopes and KIR Typing of NK Cell Donors ................... 113

XVIII
List of Figures
Figure 1.1 KIR Genomic Structure ............................................................................... 12
Figure 1.2 KIR Haplotypes ........................................................................................... 13
Figure 1.4 Recognition of HLA-C by KIR2DL2 (left) and KIR2DL1 (right). ................... 14
Figure 3.1 NK clones selected for use in testing different HLA-C alleles and their
staining with CD158b and their cytotoxicity patterns ................................. 60
Figure 3.2 Clone A6 and YTS-2DL3 differ in their interaction with HLA-C alleles with the
C1 epitope.................................................................................................. 63
Figure 3.3 Pattern of Inhibition is Reproduced with a second panel of C1-group HLA-C
alleles......................................................................................................... 65
Figure 3.4 C1-group HLA-C alleles differ in their ability to inhibit YTS-2DL3 ............... 67
Figure 3.5 HLA-C*0702 inhibits all NK clones whereas HLA-C*1402 only inhibits some
NK clones................................................................................................... 69
Figure 3.6 Amplification of KIR2DL2 or KIR2DL3 cDNA from each clone.................... 70
Figure 4.1 Low level KIR3DL1 expression differs in two donors due to a
nonsynonymous mutation at nucleotide position 115 in exon 3 encoding the
D0 domain of the KIR3DL1*005 allele. ...................................................... 86
Figure 4.2. CD107a expression by KIR3DL1-positive polyclonal NK cells is inhibited by
most Bw4-positive targets.......................................................................... 89
Figure 4.3. Level of Bw4 expression does not correlate with percentage of CD107a
expression induced on KIR3DL1 positive NK cells. ................................... 92
Figure 4.4. HLA-B*1302 and HLA-B*1301 do not inhibit cytotoxicity of KIR3DL1-
dependent NK cells.................................................................................... 95
Figure 4.5 Inhibition through Bw4 expressing HLA-A alleles can be reversed by
addition of anti-KIR3DL1............................................................................ 97
Figure 4.6 Donors who express HLA-B*1302 or HLA-B*1301 make very few KIR3DL1-
dependent NK cells.................................................................................. 100
Figure 5.1. Receptor expression and cytotoxicity pattern of CD158b negative clones
showing specificity for C2 positive targets. .............................................. 115

XIX
Figure 5.2. Despite expression of KIR3DL2, clone C9 was inhibited equally well by
HLA-A*0301 and HLA-A*0201 homozygous BLCL target. ...................... 117
Figure 5.3. NK clone C9 only lyses C2 positive BLCL targets and shows a C2 dose
effect. ....................................................................................................... 118
Figure 5.4. NK clone C9 transcribes KIR2DS1*002. .................................................. 119
Figure 5.5 Target cell lysis by NK clone C9 is enhanced by anti-NKG2A antibody and
inhibited by anti-CD158a (anti-KIR2DL1/KIR2DS1)................................. 121
Figure 5.6. NK cell activation through KIR2DS1 (CD158a) only occurs in C2 negative,
KIR2DS1 positive individuals. .................................................................. 124
Figure 5.7. C2 positive EBV transformed and PHA blast cells both activate CD158a
positive NK cells....................................................................................... 126

XX

Chapter 1
1
Chapter 1
Literature Review

Chapter 1
2
Chapter 1: Literature Review
This literature review will cover literature available at the time of commencement of this
thesis (February 2004). Literature published after 2004 but which is relevant to the
topics in this thesis will be discussed in the relevant chapter.
1.1 Scope of the Literature Review
Allogeneic bone marrow transplantation (BMT) or haematopoietic stem cell
transplantation (HSCT) is commonly used in clinical practice as a curative treatment for
haematological malignancies as well as non-malignant disorders and diseases of the
haematopoietic system, such as severe aplastic anaemia. Despite advances in human
leucocyte antigen (HLA) matching, BMT remains a high-risk treatment for these
diseases and disorders. In addition, many recipients will not have an HLA identical
sibling donor but most will have a haploidentical related donor. The discovery (Ruggeri
et al, 2002) that certain HLA mismatches result in the generation of alloreactive natural
killer (NK) cells that can not only prevent leukemic relapse, but also enhance bone
marrow engraftment and eliminate graft versus host disease (GvHD), has greatly
increased the efficacy of haploidentical BMT. NK alloreactivity cannot always be
predicted from KIR and HLA genotypes. A clearer understanding of the interactions
between KIR and HLA alleles will improve prediction of NK alloreactivity. This literature
review will introduce NK cells, their receptors and their interaction with class I HLA,
followed by an overview of bone marrow transplantation and a review of the role of NK
cell alloreactivity in BMT.
1.2 Natural Killer Cells
NK cells are components of the innate immune response. They are important in the
initial phase of infections and play an important role in tumour surveillance. They
received their name from their ability to kill target cells without prior sensitisation
(Kiessling et al, 1975). Recognised morphologically as relatively large lymphocytes

Chapter 1
3
containing cytoplasmic azurophilic granules, NK cells were also once known as large
granular lymphocytes (LGL) (Herberman 1986). Comprising 10-15% of circulating
blood lymphocytes, NK cells are also found in the bone marrow, spleen, lymph nodes,
liver, lung, omentum, intestine and placenta (reviewed in Vivier 2006).
NK cells are thought to originate from the same lineage as T lymphocytes in the bone
marrow (Spits et al, 1995). However, they do not rearrange immunoglobulin (Ig) or T
cell receptor genes to make antigen receptors like T and B cells (Lanier and Phillips
1992). Resting peripheral blood NK cells can be identified from T and B lymphocytes
based on their expression of CD56 (neural cell adhesion molecule-1, NCAM-1), CD16
(FcγRIII) and CD160. Since all three makers are expressed by other immune cells it is
the combination of the three markers and lack of the T cell marker CD3 that effectively
identify NK cells.
NK cells can be further characterised based on the surface level of expression of CD56
and CD16. Approximately 90% of NK cells circulating in peripheral blood have low
density CD56 (CD56dim) and express high levels of CD16 whereas the other 10%
(CD56bright) express higher levels of CD56 (Lanier et al, 1986). CD56dim expressing NK
cells are more strongly cytotoxic towards target cells than are CD56bright cells. CD56bright
NK cells produce greater quantities of cytokines, but are weakly cytotoxic relative to
CD56dim cell.
1.2.1 Functions of NK Cells
NK cells are pivotal members of the innate immune response, playing a crucial role in
the elimination of virus-infected and tumour cells as well as the recruitment of cells of
the adaptive immune response. NK cells mediate their activities through the release of
cytokines or through cytotoxic pathways (section 1.2.1.1). Cytokines produced by NK
cells in response to virus-infected or tumour cells play a major role in shaping the
Chapter 1
4
adaptive immune response. For example IFNγ production by NK cells influences the
TH1/TH2 bias of the adaptive immune response by activating TH1 cells (Seaman 2000).
Recently the relationship between dendritic cells (DC) and NK cells has been examined
in the early stages of the immune response. Many of the cytokines (eg. Interleukin-12
(IL-12) and interleukin-18 (IL-18)) known to enhance NK cell function are naturally
produced by DC in response to microbial infections (reviewed Andoniou et al, 2006).
NK cells also reciprocally enhance DC function. NK cells have been shown to eliminate
immature DC, perhaps to ensure that only activated DC are involved in antigen
presentation (Ferlazzo and Munz, 2004). NK cells also activate DCs through the
production of IFNγ and tumour necrosis factor-α (TNFα) and other mechanisms that
require cell to cell contact (Gerosa et al, 2002). The interaction between NK cells and
DC demonstrate that effective immune responses rely on relationships between the
cells of both the innate and adaptive immune response.
NK cells have also been shown to play a role in the regulation of haematopoiesis
(Trinchieri, 1995). They influence the growth of haematopoietic cells through the
release of cytokines, including GM-CSF and TNFα which influence stem cell
proliferation and differentiation (Seaman 2000).
1.2.1.1 Natural Killer Cell Cytotoxicity
NK cells lyse susceptible target cells (eg. virus-infected cells or tumour cells), by one of
two mechanisms: “natural killing” (no prior sensitisation), or by antibody dependent
cellular cytoxicity (ADCC). Natural killing is initiated through a variety of activating
receptors and can be inhibited by a variety of inhibitory receptors. In ADCC, the
activating receptor, FcγRIII (CD16) binds to the Fc piece of antibodies bound to the
target cell (Roitt et al, 2000). In both pathways, NK cells can lyse the target via two
Chapter 1
5
mechanisms; either perforin-mediated cytotoxicity or induction of apoptosis through
Fas (Bosi and Griffiths, 1999).
1.3 Natural Killer Cell Allorecognition
1.3.1 The “Missing self” Hypothesis
Until relatively recently, it was thought that NK cells had receptors for foreign antigens
on target cells. However, the nature of the receptors and foreign antigen remained
elusive. Subsequently a correlation was observed between the susceptibility of target
cells to NK cell lysis and low, or absent, expression of class I MHC molecules on the
target cell (Snell, 1976). Low or absent expression of class I MHC molecules is
common in tumour cells and virus-infected cells, the usual targets for NK cell lysis.
Therefore, it was proposed that NK cells may interact with MHC class I molecules, but
perhaps somehow recognise the absence of MHC class I. This idea was consistent
with research conducted by Cudkowicz and Bennet (1971) who investigated the
phenomenon of ‘F1 hybrid resistance’ in which it was observed that homozygous
parental bone-marrow transplants were rejected by their heterozygous (absence of one
parental antigen) F1 offspring. Thus they were responding to the absence of MHC class
I. Rejection could be prevented by depletion of recipient NK cells demonstrating that
NK cells were responsible for the rejection.
Karre and colleagues (1986) studied NK cell mediated rejection of H-2 incompatible
lymphomas and bone marrow grafts in mice. Lymphoma cells selected for the loss of
H-2 were less malignant than the wild-type and were rejected by innate mechanisms
rather than adaptive mechanisms. NK cells were postulated to be the effector. It was
hypothesised that NK cells recognise and eliminate cells that fail to express self MHC
class I molecules (Ljunggren and Karre 1990) and this was formally known as the
“missing self” hypothesis.

Chapter 1
6
Pursuing the ‘missing self’ hypothesis, Storkus and colleagues (1987) demonstrated
that transfection of class I HLA genes into class I bare target cells rendered the target
cells totally or partially resistant to NK cell mediated lysis. This further supported the
idea that NK cells sense the presence of MHC class I molecules on target cells
resulting in inhibition of target lysis.
In 1988, Ciccone and colleagues demonstrated that human NK cells would proliferate
in the presence of allogeneic stimulator cells. Lymphocytes were treated in vitro with
monoclonal antibodies (mAbs) against CD3, CD4 and CD8 followed by treatment with
rabbit complement to eliminate T cells. The T cell depleted population was cultured
with irradiated allogeneic cells. The CD3-, CD2+, CD7+ lymphocytes, which proliferated,
lysed target cells bearing the same HLA type as the stimulator cells, but did not lyse
autologous cells. This was the first evidence that human NK cells could be alloreactive.
Moretta and colleagues (1990) described four distinct NK cell cytotoxic specificities
based on the lysis of different allogeneic target cells and showed that the four
specificities could be correlated with the expression on the NK cells of molecules
recognised by the mAb, EB6 and GL183. The four different effector populations were
EB6+GL183-, EB6-GL183+, EB6+GL183+ and EB6-GL183-. Using an informative
family, Ciccone and colleagues (1990) mapped susceptibility of target cells to lysis by
alloreactive NK cells, to a region in the MHC between BF and HLA-B.
1.3.2 Natural Killer Cells Receptors
NK cell receptors for target cell ligands fall into two broad groups based on their
structure (Yokoyama, 1998): C-type lectin-like receptors and Ig-like receptors. C-type
lectin-like receptors are disulfide-linked, dimeric, type II, integral membrane proteins.
They include the CD94/NKG2 family and the Ly49 family (found only in mice). Ig-like
receptors are usually monomeric type I integral membrane proteins. Ig-like receptors

Chapter 1
7
include the killer immunoglobulin-like receptors (KIR), natural cytotoxicity receptors and
the LILR family of receptors.
Subsets of NK cells differ in their receptor expression. (Yokoyama, 1998). Receptor
expression differs not only between NK clones within an individual but also between
individuals (Valiante et al, 1997). Within an individual, NK cells differ in the number and
type of receptors expressed. However, every NK cell in a given individual that is
capable of cytotoxicity has at least one inhibitory receptor for self-HLA molecules to
prevent lysis of autologous cells. The inhibitory receptor may be a KIR with specificity
for allelic epitopes of the classical class I HLA loci or another inhibitory receptor, for
example NKG2A, the ligand for which is the monomorphic, non-classical class I
molecule, HLA-E.
1.3.2.1 Killer Cell Immunoglobulin-like Receptors (KIR)
Following the identification of a region in the MHC that determined the susceptibility of
targets to killing by different NK cell clones, Colonna and colleagues (1992) identified a
correlation between the expression of particular HLA-C alleles on target cells and
resistance to NK cell mediated lysis. NK cell clones with different specificities termed
NK-1 and NK-2 were identified. NK-1 clones were inhibited by targets expressing HLA-
C alleles with an asparagine at amino acid 77 and lysine at amino acid 80 in the α1
domain of HLA-C molecules. NK cells, with the NK-2 specificity, were inhibited by
target cells expressing HLA-C alleles with a serine at amino acid 77 and asparagine at
amino acid 80. All HLA-C alleles have one or the other of these two sets of amino
acids. The NK receptor p58 (different forms of which were recognised by the EB6 and
GL183 antibodies) was identified as the receptor that recognised HLA-C (Moretta et al,
1993). NK cells, with the specificity NK-1, expressed a p58 receptor that reacted with
the mAb EB6, and NK cells, with the NK-2 specificity expressed a p58 receptor that
reacted with the mAb GL183. Other NK clones that were inhibited by target cells

Chapter 1
8
expressing certain HLA-B alleles were also discovered. D’Andrea and colleagues
(1995) showed that these NK cells expressed the NKB1 surface antigen, or p70. NKB1
was structurally similar to the p58 receptors but recognised HLA-B alleles with the Bw4
public epitope at amino acids 77-83 of the α1 domain of HLA-B molecules.
Colonna and Samaridis (1995) and Wagtmann et al (1995) described the structure of
the p58 and p70 receptors. Utilising molecular techniques, p58 and p70 were shown to
posses two and three immunoglobulin-like domains, respectively. Pende and
colleagues (1996) described an additional receptor, p140, a dimer of a p70-like
receptor, with three immunoglobulin-like domains that had a high degree of homology
to p58 and p70. The p140 receptor was shown to interact with the -A3 allele at the
HLA-A locus and it was postulated that p140 may recognise an allelic determinant of
HLA-A alleles.
The p58, p70 and p140 NK cell receptors are encoded on the leukocyte receptor
complex (LRC) on chromosome 19q13.4 in man and recognise allelic determinants of
HLA-C, HLA-B and HLA-A alleles, respectively. The discovery that p58, p70 and p140
interacted with cells expressing the appropriate HLA class I molecules causing
inhibition of NK mediated lysis, revealed that NK recognition of “non-self” was based on
a mechanism that was different to T and B cell recognition of non-self. These inhibitory
receptors were initially called “killer cell inhibitory receptors”. However the later
discovery of activating versions of these receptors led to them being renamed “killer
cell immunoglobulin-like receptors” or KIR. Inhibitory KIR interact with HLA class I
molecules. Activating KIR show a high degree of sequence homology to inhibitory KIR,
often differing by only a few amino acids in the Ig-domains that are responsible for
ligand binding (Wagtmann et al, 1995; Biassoni et al, 1996). They produce activation
signals when cross-linked with antibodies. Their ligands are believed to be the same as
for their inhibitory counterparts because of the structural similarity between the
Chapter 1
9
receptors. However this has been difficult to demonstrate (Vales-Gomez et al, 1998;
Winter et al, 1998; Saulquin et al, 2003).
Inhibitory KIR have immuno-receptor tyrosine–based inhibition motifs (ITIMs) in their
cytoplasmic tail (Moretta et al, 2000). Upon engagement of HLA class I, the tyrosine
residues are phosphorylated and bind to the protein tyrosine phosphatase, SHP-1,
leading to negative cell signalling (Burshtyn et al, 1996). Activating receptors lack
ITIMs, but have a positively charged amino acid residue in their transmembrane
domain. This associates with the negatively charged adaptor molecule DAP-12. DAP-
12 contains an immuno-receptor tyrosine-based activation motif (ITAM). Upon ligand
engagement or antibody cross-linking, phosphorylation occurs through Src tyrosine
kinases, which recruit and activate further tyrosine kinases such as ZAP-70 which
activates signalling pathways (Lanier et al, 1998).
1.3.2.2 CD94/NKG2 Receptor Family
The CD94/NKG2 receptor family is encoded on chromosome 12p13 in humans and
chromosome 6 in mice (Yabe et al, 1993). The NKG2 family consists of six genes:
NKG2A, NKG2C, NKG2E, NKG2D and NKG2F and CD94. Each member of the family
forms a disulfide-linked heterodimer with CD94, except for NKG2D which is self-
dimerizing (Lazetic et al, 1996). The CD94/NKG2A heterodimer forms an inhibitory
receptor which binds to the genetically invariant non-classical class I HLA molecule,
HLA-E (Yokoyama, 1998). As the expression of HLA-E is promoted by binding of
peptides clipped from leader-sequence of classical HLA class I molecules, it is thought
that HLA-E expression acts as a barometer of classical class I protein expression. The
purpose of CD94/NKG2A may, therefore, be to monitor overall class I expression
whereas KIR receptors monitor the expression of individual alleles. CD94/NKG2B is a
splice variant of NKG2A, which lacks the stem region but still associates with CD94
and recognises HLA-E (Braud et al, 1998). CD94/NKG2C and NKG2D are activating

Chapter 1
10
receptors. CD94/NKG2C recognises HLA-E, but with lower affinity than CD94/NKG2A
(Vales-Gomez et al, 1999). NKG2D is a homodimer and unlike the other members of
the NKG2 family does not associate with CD94 (Lazetic et al, 1996). NKG2D
recognises the non-classical MHC molecules, MICA and MICB, and other non-MHC
molecules. The NKG2D ligands, MICA and MICB, ULBP1, ULBP2 and ULBP3 and the
RAE family, are up regulated by cells in times of stress and in virus-infected cells and
tumour cells (Farrell et al, 2000).
1.3.2.3 Leukocyte Immunoglobulin-like Receptors (LILR)
Most LILRs are expressed on a wide variety of cell types including NK cells, TH cells,
cytotoxic T lymphocytes (CTL), B cells and monocytes (Colonna et al, 1997; Meyaard
et al, 1997) and the genes encoding these receptors are in the LRC. The LILR deliver
an inhibitory signal to NK cells. LILRB1 binds to an array of classical and non-classical
HLA class I molecules, including HLA-F and HLA-G. LILRB2 and LILRA1 also bind
class I molecules (reviewed Brown et al, 2004). As the epitopes recognised by the LILR
family are genetically monomorphic, it seems unlikely that the LILRB1 receptors play
any role in allorecognition.
1.3.2.4 Natural Cytotoxicity Receptors
Natural cytotoxicity receptors (NCR) are activating receptors on NK cells (Moretta et al,
2000). Three receptors, NKp46, NKp44 and NKp30 are classified as NCR. Although
belonging to the immunoglobulin-gene superfamily, natural cytotoxicity receptors have
little homology with other receptors encoded by the LRC or with each other and there is
very little known about the genetic polymorphism of these receptors. Sivori and
colleagues (1999) reported a positive correlation with NKp46 surface density and
natural cytotoxicity of fresh and cultured NK cells against various FcγR-negative and
positive targets such as the class I negative cell lines, 721.221 and K562. The ligands
for NKp30, NKp44 and NKp46 however remain elusive. Some investigators have

Chapter 1
11
suggested viral antigens as being the ligands for the NCR (Arnon et al, 2001;
Mandelboim et al, 2001; Arnon et al, 2005) based on their role in the lysis of virally-
infected cells. Similarly, NCR have also been shown to mediated lysis of tumour cells
of various histotypes suggesting their ligands may be up-regulated or induced following
tumour transformation (reviewed Bottino et al, 2005).
1.4 KIR
Genes encoding the KIR receptors are found on chromosome 19q13.4 in the LRC
(Suto et al, 1998). KIR are classified as 2-domain (2D) or 3-domain (3D) according to
the number of immunoglobulin-like extracellular domains in the translated protein. They
are further subdivided on the basis of the length of their cytoplasmic tail (long - L) or
(short-S) (Vilches and Parham, 2002). Different genes sharing the same number of Ig
domains and the same kind of cytoplasmic tail are distinguished by a number at the
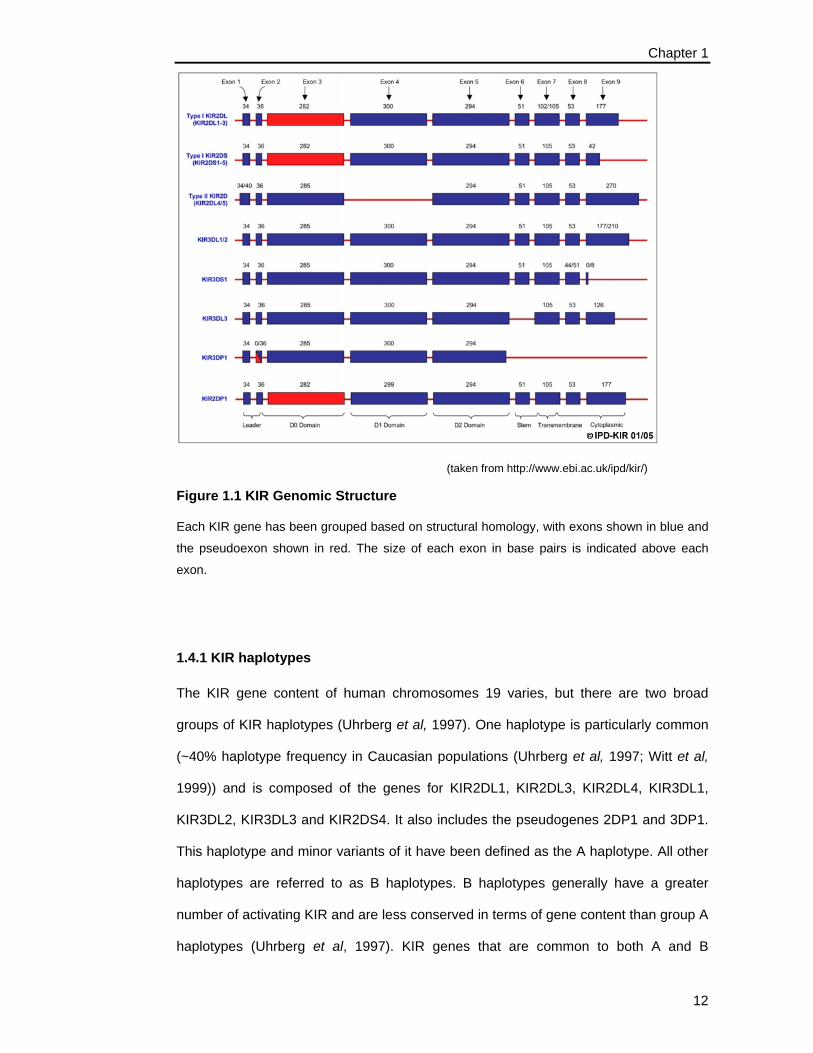
end of their name eg. KIR2DL3. KIR receptors are encoded by nine exons with exon 3
existing as a pseudoexon that is not translated in any of the 2D genes except KIR2DL4
and KIR2DL5 (Vilches et al, 2000a) (Figure 1.1). The Ig-domain encoded by exons 3, 4
and 5 are referred to as the D0, D1 and D2 domains, respectively. Skipping of exon 3
during transcription of the 2D KIR results in these KIR only translating the D1 and D2
domains. KIR2DL4 and KIR2DL5 are encoded by only eight exons (Vilches et al,
2000b) and lack the exon encoding the D1 Ig domain (Figure 1.1).
Chapter 1
12
(taken from http://www.ebi.ac.uk/ipd/kir/)
Figure 1.1 KIR Genomic Structure
Each KIR gene has been grouped based on structural homology, with exons shown in blue and
the pseudoexon shown in red. The size of each exon in base pairs is indicated above each
exon.
1.4.1 KIR haplotypes
The KIR gene content of human chromosomes 19 varies, but there are two broad
groups of KIR haplotypes (Uhrberg et al, 1997). One haplotype is particularly common
(~40% haplotype frequency in Caucasian populations (Uhrberg et al, 1997; Witt et al,
1999)) and is composed of the genes for KIR2DL1, KIR2DL3, KIR2DL4, KIR3DL1,
KIR3DL2, KIR3DL3 and KIR2DS4. It also includes the pseudogenes 2DP1 and 3DP1.
This haplotype and minor variants of it have been defined as the A haplotype. All other
haplotypes are referred to as B haplotypes. B haplotypes generally have a greater
number of activating KIR and are less conserved in terms of gene content than group A
haplotypes (Uhrberg et al, 1997). KIR genes that are common to both A and B

Chapter 1
13
haplotypes are known as framework genes. These include: KIR3DL3, the pseudogene
KIR3DP1, KIR2DL4 and KIR3DL2 (Figure 1.2)
(Adapted from Martin et al, 2000)
Figure 1.2 KIR Haplotypes
KIR genes are organised into two haplotypes, A haplotype and B haplotype. The bold lines
indicate the more common haplotypes.
1.4.2 KIR Gene Polymorphism
Whilst KIR haplotypes contribute to the diversity of an individual’s KIR repertoire, allelic
variation within each KIR gene also exists (Vilches and Parham, 2002). Allelic
polymorphisms have been described for all inhibitory KIR, with the receptors KIR3DL1
and KIR3DL2 showing the most extensive polymorphism. The influence of polymorphic
positions on ligand binding and other functions will be discussed in sections 1.4.3 and
1.5.
1.4.3 KIR Recognition of Class I HLA
KIR recognise allelic determinants of classical class I HLA molecules. HLA-C alleles
can be divided into two groups, C1 and C2, based on their amino acids sequences in
the α1 helix. (Colonna et al, 1993). C1-group alleles have the amino acid serine (Ser)
at residue 77 and asparagine (Asn) at residue 80. C2-group alleles have the amino
Haplotype ‘A’
3DL3 2DP1
2DL3 2DL1
3DP1 2DL4
3DL1 2DS4 3DL2
3DS1 2DS12DL1V
2DL5.1 2DS3
2DS2 2DL2 2DS2 2DL2 2DL5.2 2DS5
2DL5.1 2DS3
3DL1
2DL1
Haplotype ‘B’
Centromeric variable Telomeric variable
2DP1
Chapter 1
14
acid Asn at residue 77 and Lysine (Lys) at residue 80 (Colonna et al, 1993). HLA-B
alleles can similarly be split into two groups based on the Bw4 and Bw6 epitopes at
amino acids 77-83 (Muller et al, 1989).
The residues involved in the KIR/HLA binding interface are highly conserved in all KIR
and HLA alleles (Boyington and Sun, 2002) except for those residues determining
locus or allele specificity. Only the amino acid at position 80 of HLA-C determines
whether it binds to KIR2DL1 or KIR2DL2/3 (KIR2DL2 or KIR2DL3) (Mandelboim et al,
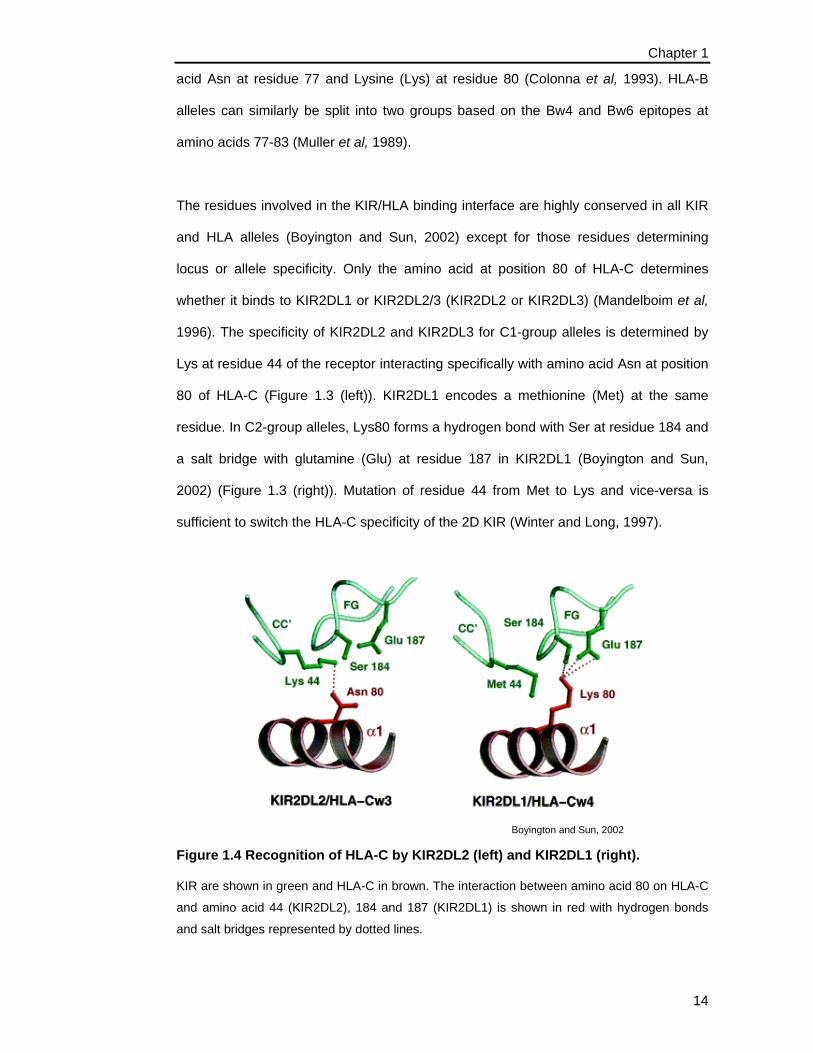
1996). The specificity of KIR2DL2 and KIR2DL3 for C1-group alleles is determined by
Lys at residue 44 of the receptor interacting specifically with amino acid Asn at position
80 of HLA-C (Figure 1.3 (left)). KIR2DL1 encodes a methionine (Met) at the same
residue. In C2-group alleles, Lys80 forms a hydrogen bond with Ser at residue 184 and
a salt bridge with glutamine (Glu) at residue 187 in KIR2DL1 (Boyington and Sun,
2002) (Figure 1.3 (right)). Mutation of residue 44 from Met to Lys and vice-versa is
sufficient to switch the HLA-C specificity of the 2D KIR (Winter and Long, 1997).
Boyington and Sun, 2002
Figure 1.4 Recognition of HLA-C by KIR2DL2 (left) and KIR2DL1 (right).
KIR are shown in green and HLA-C in brown. The interaction between amino acid 80 on HLA-C
and amino acid 44 (KIR2DL2), 184 and 187 (KIR2DL1) is shown in red with hydrogen bonds
and salt bridges represented by dotted lines.
Chapter 1
15
It has been reported that KIR are unable to recognise HLA class I molecules that have
an empty peptide binding groove (Boyington and Sun, 2002) suggesting that KIR
recognition is dependent on the peptide folded in the class I molecule. Peruzzi and
colleagues in 1996 demonstrated that residues 7 and 8 of the peptide bound by the
Bw4 positive HLA-B allele, HLA-B*27, influenced KIR3DL1 binding. Mutation of these
residues conferred or abolished the interaction between KIR3DL1 and HLA-B*27.
Similarly, residues 7 and 8 are likely to influence binding of KIR2DL1, KIR2DL2 and
KIR2DL3 to HLA-C. Crystal structures of KIR2DL2 in complex with HLA-Cw3, show the
KIR molecule is situated directly over residues 7-9 of the peptide resulting in direct
contact between KIR and residues 7 and 8 (Boyington et al, 2000). In contrast mouse
studies suggest that MHC binding to the Ly49 family of receptors is generally
independent of peptide although Ly49C and Ly49I exhibit a degree of peptide
specificity in their recognition of H-2Kb and H-2Kd (reviewed Deng and Mariuzza 2006).
1.5 Departures from the Simple C1/C2, Bw4/Bw6 Inhibitory Model
1.5.1 HLA-C*1402 as a Ligand for KIR2DL2 and KIR2DL3
HLA-C*1402, has a serine at position 77 and an asparagine at position 80 (C1-group)
and would therefore be expected to bind to the NK receptors KIR2DL2 and KIR2DL3.
In 1993, Colonna and colleagues reported that HLA-C*1402 behaved in an unexpected
manner. They established the specificity of NK clones as NK-1 and NK-2 (equivalent of
C1-dependent and C2-dependent clones in current terminology) using the chromium-
51 cytotoxicity release assay and PHA blast targets from individuals with different HLA-
C alleles. However, they found that five group 1/group 2 HLA-C heterozygous target
cells were not protected from lysis by NK clones that were inhibited by target cells
expressing HLA-C alleles with Ser77 and Asn80 (C1-dependent clones). It was
determined by sequence analysis that each of these targets had HLA-C*1402, which
has Ser77 and Asn80. Due to the absence of an anti-HLA-C*1402 specific antibody for
Chapter 1
16
HLA-C*1402 it could not be determined whether the allele was expressed on the cell
surface. Therefore it was suggested that lack of inhibition via HLA-C*1402 may be due
to poor or no expression of the allele at the cell surface or alternatively, due to the
allele being unable, or only weakly able, to bind to its receptor.
1.5.2 KIR3DL1 and HLA-B
Amino acids 77-83 contribute to the Bw4 and Bw6 public epitopes. Only amino acids
82 (leucine) and 83 (arginine) are common to all Bw4 alleles but other amino acids
between 77-83 are typically present in Bw4 positive alleles and not in Bw6 positive
alleles. In 1994, Cella and colleagues defined a new NK cell clone allo-specificity, NK-
3. NK cell clones with the NK-3 specificity were inhibited by PHA blasts expressing the
Bw4 epitope. The NK receptor interacting with Bw4 was identified as NKB1 (current
nomenclature KIR3DL1) (Litwin et al, 1994). Using the chromium-51 cytotoxicity
release assay, Cella et al (1994) reported greater levels of inhibition of NK3 specific NK
clones by target cells whose Bw4 allele included an isoleucine at residue 80 compared
to target cells expressing an HLA-Bw4 allele with a threonine at this position. They also
showed that NK-3 specific NK cell clones were also inhibited by cells expressing HLA-
A alleles that share the Bw4 motif including isoleucine at residue 80. This suggested
that some HLA-A alleles could bind to KIR3DL1. Subsequently, D’Andrea et al (1995)
showed that the predominant influence which determines binding to KIR3DL1 is the
amino acid at position 80. HLA-Bw4 alleles express either an isoleucine (Ile) or
threonine (Thr) at this position.
Gumperz and colleagues (1995) also demonstrated the inhibition of NK cells
expressing the NKB1 receptor by targets expressing Bw4-positive alleles. They also
investigated influence of the amino acid at position 80. NKB1 positive NK clones
generated from two donors were tested by chromium release against a panel of
721.221 cells transfected with Bw4 alleles (B*1513 (80Ile), B*2705(80Thr),
B*5101(80Ile) and B*5801 (80Ile)) or Bw6 alleles (B*0702, B*1501, B*1502, B*1508

Chapter 1
17
and B*3501) as well as HLA-A and HLA-C transfectants. NKB1-positive NK clones
were all inhibited by Bw4 expressing transfectants and not by the Bw6 expressing
transfectants. NKB1-positive NK clones were less effectively inhibited by the HLA-
B*2705 (80Thr) transfectant than the HLA-B*5801 (80Ile) transfectant. This was in
accordance with the data presented by Cella and colleagues (1994). However, HLA-
B*1513, which has an isoleucine at position 80 and would therefore be expected to
bind strongly to NKB1 gave inhibition comparable to that of HLA-B*2705. Whilst this
data was not entirely consistent with the results of Cella and colleagues, it did support
the idea that different HLA-B alleles have different affinities for KIR3DL1.
Gumperz and colleagues also investigated the potential of HLA-A alleles to inhibit
NKB1-positive (KIR3DL1) NK clones. The Bw4-positive HLA-A alleles, HLA-A*2403
and HLA-A*2501, were transfected into the 721.221 cell line. Expression of HLA-
A*2403 and HLA-A*2501 protected the transfectants from lysis by NKB1-positive NK
clones, to a similar degree as transfectants expressing Bw4-positive HLA-B alleles.
However, addition of DX9, an antibody specific for NKB1, did not result in reversal of
inhibition by the HLA-A transfectants. This was in stark contrast to HLA-B alleles in
which the DX9 antibody always reversed the inhibition seen. Thus it was concluded
that either NK cell binding to HLA-A alleles utilised a different part of the receptor or
that the binding to HLA-A alleles was via a different, perhaps unknown receptor
altogether.
Currently 17 different alleles of KIR3DL1 have been described, some of which differ in
density of surface expression. KIR3DS1 an activating receptor with high homology to
KIR3DL1 in the Ig-domains, also segregates as an allele of KIR3DL1. KIR3DL1 surface
density may be high, low or absent depending on the allele (Gardiner et al, 2001).
KIR3DL1*004 is retained in the cytoplasm due to two substitutions in the first two
immunoglobulin domains and is therefore not expressed on the surface of the cell. It
has been speculated that these substitutions effect the folding of the protein and

Chapter 1
18
consequently its ability to be expressed on the cell surface (Pando et al, 2003). The
reason for differences in expression between the “low” and “high” expression alleles is
less clear. It is possible that there is no real difference in membrane density between
“low” and “high” alleles. Rather differences in amino acid substitutions in the
immunoglobulin domains between the two types of alleles may influence binding of the
antibody DX9 to the receptor due to failure to form the DX9 epitope (Rojo et al, 1997;
Gardiner et al, 2001). Gardiner and colleagues also suggested that it is possible that
NK cells with the low expression phenotype simply have a lower number of KIR3DL1
molecules on the surface or that a large majority of those expressed did not bind to the
DX9 antibody. The low expression of other alleles, such as KIR3DL1*007, can not
easily be explained by immunoglobulin domain substitutions as the only amino acids
unique to KIR3DL1*007 are in the transmembrane region and cytoplasmic domain.
Gardiner and colleagues suggested that cytoplasmic domain substitutions may alter
folding of the receptor or translocation to the cell surface resulting in the low expressing
phenotype.
1.6 KIR3DL2 and HLA-A
KIR3DL2 is a framework gene present on all examples of chromosome 19 (Valiante et
al, 1997). It has been suggested that KIR3DL2 may recognise allelic determinants of
HLA-A alleles, but this remains controversial. Prior to discovery of KIR3DL2, Storkus
and colleagues (1991) found that the transfectants expressing HLA-A2 allele did not
protect target cells from NK mediated lysis whereas transfectants expressing HLA-A3, -
Aw68, and -Aw69 were all resistant to NK cell lysis. Storkus et al, attributed the
inhibition to the fact that HLA-A3, -Aw68, and -Aw69 all have an Asp-74 residue in the
α1 domain whereas HLA-A2 has a His-74 residue. Site-directed mutation of the His-74
to Asp-74 conferred resistance to NK cell lysis. This suggested that the Asp-74 residue
was important in binding to the inhibitory ligand on the NK cell. These studies were
undertaken prior to the discovery of the KIR genes and it was not known which KIR or
other receptor was mediating inhibition.

Chapter 1
19
Other studies have provided evidence that HLA-A3 (Dohring et al, 1996; Pende et al,
1996) and HLA–A11 (Gavioli et al, 1996; Pende et al, 1996) are ligands for KIR3DL2.
Both HLA-A3 and -A11 have the Asp-74 residue that was suggested to be important by
Storkus et al (1991). Dohring et al (1996) investigated the specificity of binding of a 70-
kDA receptor encoded by NKAT-4 (later to be known as KIR3DL2). They transfected
class I HLA negative target cells with different HLA alleles. NK clones were derived
from peripheral blood lymphocytes (PBL) and KIR expression determined by flow
cytometry using 5.133 mAb against the 70kDA receptor (KIR3DL2). NK clones that
were KIR3DL2 positive were specifically inhibited by HLA-A3 transfectants, but not by
transfectants expressing any of the other HLA-A, -B or -C alleles tested. Consistent
with the data of Storkus et al (1991), target cells expressing HLA-A2 were lysed. Target
cells expressing HLA-A11 were not tested. Dohring and colleagues did not test NK
clones that were negative for the NKAT-4 receptor against transfectants expressing
HLA-A3. It would have been important to determine whether such NK clones that did
not express NKAT-4 were able to lyse target cells expressing HLA-A3 in order to
determine whether another receptor could also bind to HLA-A3. However, blocking
NKAT-4 with an anti-NKAT-4 antibody increased NK cytotoxicity of target cells
expressing HLA-A3 suggesting that the inhibition observed for HLA-A3 was mediated
by NKAT-4. Dohring and colleagues did not test for the expression of CD94/NKG2A,
which binds to HLA-E. As HLA-A3 is one of the alleles whose signal peptide promotes
HLA-E expression, HLA-A3 may have induced HLA-E expression and any inhibition of
cytotoxicity may have occurred via CD94/NKG2A. However, transfectants expressing
HLA-A2, and -68 (which also promote HLA-E expression), were susceptible to killing by
NK cell clones expressing NKAT-4. Therefore, it appears more likely that HLA-A3
binding to NKAT-4 was responsible for the inhibition of cytotoxicity rather than
CD94/NKG2A.

Chapter 1
20
Pende and colleagues also examined the interaction between HLA-A3 and KIR3DL2.
After analysis of receptor expression, NK cell clones were selected based on the
expression of a then unidentified receptor (later shown to be KIR3DL2). Expression
was determined by two mAbs termed Q66 and Q241. These mAbs were derived from a
BALB/c mouse immunised with an NK cell clone that was inhibited by HLA-A3. Further
NK clones were identified using these mAbs and these clones were tested against a
panel of target cells expressing various HLA alleles: HLA-A1, -A2, -A3, -A11, -A24, -B7,
-B27, -B35, -B44, -B51, -Cw1 -Cw4 and –Cw5. Lysis of all target cells occurred except
where the target expressed HLA-A3 or -A11. Addition of the mAb Q66 resulted in
reversal of inhibition of lysis of targets expressing HLA-A3 or –A11. These NK clones
did not express the p58 or p70 receptor, but they did express CD94/NKG2A. However,
blocking of CD94/NKG2A with a mAb did not restore lysis of target cells expressing
HLA-A3. This evidence supports the findings of Dohring et al (1996) and Storkus et al
(1991) and suggests that KIR3DL2 binds an epitope expressed on HLA-A3.
Whilst Storkus demonstrated that site-directed mutation of His-74 in HLA-A2 to Asp-74
conferred resistance to NK cell lysis and concluded from this the importance of Asp-74,
it seems highly unlikely that Asp-74 is the only critical amino acid. All common HLA-A
alleles express Asp-74, with the HLA-A2 family being the only alleles to express His-
74. If this position was the only critical position, all HLA-A alleles, (apart from HLA-A2)
would bind to KIR3DL2, but as Pende and colleagues have demonstrated that HLA-A1
and HLA-A24 alleles do not protect targets from lysis by NK cells expressing KIR3DL2.
This suggests that other residues are important in binding of HLA-A alleles to KIR3DL2.
As the amino acid encoded at position 80 is critical in KIR recognition of HLA-B and
HLA-C alleles it is worth considering amino acid in relation to KIR3DL2. All HLA-A
alleles have either isoleucine or threonine at position 80 with HLA-A2, HLA-A3, HLA-
A11 and HLA-A68 all encoding threonine. As HLA-A3 and HLA-A2 differ in their
inhibition of KIR3DL2 expressing NK clones, this suggests that amino acid 80 may not
be critical for KIR3DL2 recognition of HLA-A.
Chapter 1
21
Valiante and colleagues (1997) were unable to demonstrate that HLA-A3 interacts with
KIR3DL2 as shown by Dohring et al (1996) and Pende et al (1996). Valiante and
colleagues tested NK cells from two donors against a panel of target cells expressing
various HLA alleles (section 1.7.1). Both donors had NK cell clones that expressed
KIR3DL2 and that were inhibited by cells expressing HLA-A*0201 and HLA-A*0301.
However this inhibition was shown not to be due to the expression of KIR3DL2 as
addition of anti-KIR3DL2 did not reverse inhibition. NK clones that were inhibited by
HLA-A*0301 also expressed CD94/NKG2A. They concluded that any inhibition of
target cells expressing HLA-A3 occurred via CD94/NKG2A. The identification of the
epitope that constitutes a ligand for KIR3DL2 remains controversial.
1.7 Rules Governing NK Alloreactivity
Valiante and colleagues (1997) elucidated some of the roles governing cytotoxic NK
cells and NK alloreactivity. They studied the NK cell receptor expression of two donors:
PP and NV. These donors differed in their KIR gene repertoire and HLA type. NK cell
clones from each donor selected for cytotoxic activity against the class I negative target
721.221 were tested for cytotoxicity against target cells transfected with HLA class I
genes. Some NK clones could be inhibited by HLA-C alleles. Cytotoxic NK clones from
donor PP that expressed KIR2DL3 were inhibited by cells expressing the C1 epitope.
NK clones from donor NV that expressed KIR2DL2 were also inhibited by cells
expressing the C1 epitope. Other NK clones from NV expressed KIR2DL1 and these
clones were inhibited by cells expressing the C2 epitope. NV also had clones that could
be inhibited by HLA-B alleles with the Bw4 epitope. These clones expressed KIR3DL1.
Still other clones could be inhibited by HLA-A alleles. Both PP and NV had NK cell
clones that were inhibited by cells expressing HLA-A*0201 and HLA-A*0301. However
this inhibition was not due to the expression of KIR3DL2 (Section 1.5.3), but rather
occurred via the CD94/NKG2A receptor present in both donor’s NK cell receptor
repertoire.

Chapter 1
22
In an allogeneic BMT setting NK cells from one individual may be able to kill cells from
another individual if the targets lack the appropriate class I HLA ligands. Valiante et al
(1997) demonstrated that NK clones from NV could kill cells from PP. PP lacks the
HLA-C ligand for KIR2DL1, an inhibitory receptor present on some NK clones from NV.
Any alloreactive clones from NV that could kill PP targets expressed KIR2DL1. NK
clones from PP displayed no alloreactivity when mixed with cells from NV. This was
because NV possessed all the HLA class I ligands for PP’s inhibitory receptors.
The general rules governing NK cell cytotoxicity that emerged from these studies were:
1. Every NK cell capable of cytotoxicity expresses at least one inhibitory receptor for
self-class I HLA.
2. The inhibitory receptor can be a KIR, which recognises allelic determinants of class
I HLA molecules, but if this KIR does not recognise self class I HLA, then it cannot
be the only inhibitory receptor on that NK cell.
3. The inhibitory receptor on those NK cells may be CD94/NKG2A, which recognises
HLA-E, or ILT-2, which recognises HLA-G and certain other class I HLA.
1.8 Activating KIR
Structurally similar to their inhibitory counterparts, it is thought that the activating KIR
(KIR2DS1, KIR2DS2, KIR2DS3, KIR2DS4, KIR2DS5 and KIR3DS1) may also
recognise class I HLA but this has been difficult to demonstrate. In 1995, Morretta and
colleagues demonstrated that some NK clones that lyse C2 expressing targets react
with the anti-CD158a antibody which recognises KIR2DL1 and its activating
counterpart, KIR2DS1. If these clones expressed KIR2DL1 inhibition of lysis would be
Chapter 1
23
expected. Activation of these NK clones by C2 homozygous targets was abolished by
addition of anti-CD158a therefore suggesting that these NK clones are activated by C2
binding to the activating receptor KIR2DS1. Despite this early data there has been little
additional evidence of activation of NK cells through KIR2DS1 recognition of the C2
ligand. Both Biassoni et al (1997) and Vales-Gomez et al (1998) using binding assays
demonstrated weak binding of KIR2DS1 with HLA-Cw4 (C2) comapred with strong
binding of KIR2DL1 with HLA-Cw4 questioning the physiological relevance of this
interaction.
Likewise, an interaction between KIR2DS2 and C1 group HLA-C alleles has been
difficult to demonstrate. KIR2DS2-Ig fusion proteins were used to study the interaction
between KIR2DS2 and C1 (Winter et al, 1998). The KIR2DS1-Ig fusion protein failed to
bind to 721.221 cells transfected with HLA-C*0304 (C1). However, mutation of the
amino acid at position 45, which is unique to KIR2DS2, from a tyrosine to a
phenylalanine (present in KIR2DL2) resulted in binding to HLA-C*0304. Saulquin and
colleagues (2003) solved the crystal strucutre of KIR2DS2 thereby providing supporting
evidence of a lack of interaction between KIR2DS2 and C1. The tyrosine at position 45
and the glutamine at position 71 of KIR2DS2 slightly alter the structure of KIR2DS2 in
such a way as to make interaction with C1 unlikely.
An interaction between KIR3DS1 and Bw4 positive HLA-B alleles also remains to be
formally demonstrated however a correlation between carriage of both KIR3DS1 and
Bw4 and AIDS progression suggests a biological interaction (Martin et al, 2002). It is
possible that the ligands for the activating KIR may not even be class I HLA. Rather
they may recognise stress related or pathogen enduced molecules or viral antigens. If
HLA moleucles are shown to be ligands for the activating KIR, it may be possible for
activating KIR to be exploited in NK cell alloreactivity.

Chapter 1
24
1.9 Allogeneic Bone Marrow Transplantation
This section of the lit review deals with mechanisms of rejection, GvHD and the graft
versus leukemia (GvL) effect with a particular focus on the role of NK cells. A review of
the recent evidence for a beneficial role of NK cell alloreactivity in HSCT will follow.
BMT is commonly used in clinical practice as a curative treatment for haematological
malignancies as well as non-malignant disorders and diseases of the haematopoietic
system, such as severe aplastic anaemia. Over the past 50 years the use of BMT has
increased greatly, paralleled by our understanding of the MHC and HLA genes.
When leukaemic patients fail conventional chemotherapy and radiation therapy, high-
dose chemotherapy and/or myeloablative irradiation is used to destroy the patient’s
leukaemic cells but it also destroys the patient’s haematopoietic system. The purpose
of a BMT is to replace the patient’s own haematopoietic system with a new one from
the donor.
1.9.1 Complications of BMT
1.9.1.1 Leukemic Relapse
Leukaemic relapse is a major problem after BMT. The risk of relapse depends on the
type of leukaemia, the stage of the leukaemia (eg, first or second remission), the age of
the recipient and whether or not it is the first BMT or subsequent BMT (Kernan et al,
1993). Interestingly, the risk of relapse is influenced by compatibility between donor
and recipient. An increase in mismatching between donor and recipient lowers the
probability of leukaemic relapse because donor immune cells are better able to
recognise the patient’s incompatible leukaemic cells.

Chapter 1
25
1.9.1.2 Rejection
Despite its current wide usage, BMT still remains a high-risk treatment. Graft rejection
occurs in about 5% of transplants and usually results in the death of the patient. Graft
rejection is mediated by the recipient’s residual immune system reacting against
incompatibilities present on the donor’s stem cells. Residual host T cells play an
important role in the process of acute rejection (reviewed in Buckley, 2003).
Coordinated response between residual activated T cells and APC results in acute
rejection. Evidence from murine models dating back to the early 1970s (Cudkowicz and
Bennett 1971; Murphy et al, 1987) suggest that NK cells may also mediate graft
rejection. Depletion of donor T cells from the donor’s marrow before transplantation has
been shown to increase the likelihood of rejection (Poynton 1988), suggesting that the
likelihood of rejection is determined by a battle between the host’s residual T and NK
cells and the donor T cells.
1.9.1.3 GvHD
GvHD is a common complication of allogeneic BMT occurring in 20-50% of allogeneic
HLA-identical sibling transplants (Tabbara et al, 2002). It is caused by donor T cells
present in the infused marrow reacting against incompatibilities present on recipient
tissues. GvHD can be acute or chronic with different pathologies for each. GvHD is
more common when donor and recipient are mismatched for HLA alleles, but can still
occur even if the recipient is HLA identical to the donor due to mismatching of minor
histocompatibility loci (Petersdorf et al, 1999). The onset and severity of GvHD is
dependent on the degree of HLA mismatching between the recipient and the donor
(Hansen et al, 1999).
Chapter 1
26
1.9.2 Matching donor and recipient for BMT
The recognition of histocompatibility antigens greatly improved the efficacy of
transplantation of both solid organs and bone marrow. The HLA antigens are the most
important determinants of compatibility in allogeneic transplantation (Hansen et al,
1999). Therefore it is preferable to chose donor and recipient pairs with identical HLA
types. However only 25-30% of patients have an HLA-identical sibling and therefore
require an HLA matched unrelated donor. For the 25% of patients who can not find an
unrelated HLA identical match, a haploidentical BMT can be performed. A
“haploidentical” match refers to donors who share only one haplotype with the
recipient. As both parents share one haplotype with an individual, most patients will
have a haploidentical relative available. Therefore research has been undertaken to
investigate methods that will enable use of haploidentical donors. The potential for
complications arising from donor-recipient incompatibility are, of course, even greater
after haploidentical BMT than after HLA matched related or HLA matched unrelated
BMT due to the large number of HLA incompatibilities on the non-shared haplotype. It
is in this setting that NK cells may play a role responding to the absence of self-ligands
on the recipient’s cells.
1.9.3 Cells Mediating Graft versus Host Disease
1.9.3.1 Role of T cells in Graft versus Host Disease
GvHD is thought to be initiated when recipient APCs, in particular DC, present host
antigens to donor T cells (Reddy and Ferrara, 2003). Acute GvHD can be divided into
three different phases: phase 1- the pre-graft patient conditioning regime; phase 2-
donor T cell activation; phase 3: inflammatory effectors.
Before infusing the donor stem cells, the patient’s own bone marrow is destroyed by a
combination of intensive chemotherapy and radiotherapy. This results in a severe

Chapter 1
27
immune deficiency in the patient. Phase 1 of acute GvHD begins during this process.
Matzinger developed the “danger signal theory” that postulates that the immune system
is up-regulated in times of tissue stress or damage (the immune system senses
‘danger’) and this leads to the immune system being on a heightened alert for foreign
antigens (Matzinger, 1997). Damage to the host’s tissues caused by the conditioning
regime prior to transplantation causes the production of inflammatory cytokines and up-
regulates adhesion and MHC molecule expression predisposing the recipient to acute
GvHD following transplantation.
In Phase 2 of acute GvHD, donor T cells are activated subsequent to their interaction
with host APC (Reddy and Ferrara, 2003; Ferrara et al, 1999). TH cells recognise
foreign peptide in the context of class II HLA molecules on the surface of the APC and
CTL recognise foreign peptide in the context of MHC class I on the surface of donor
cells. Murine studies (Shlomchik et al, 1999) have demonstrated that the removal of
host APC reduces the severity of GvHD. Once activated, donor T cells produce an
array of cytokines and effector molecules. TH1 cytokines are produced preferentially
(Reddy and Ferrara, 2003) with IL-2 and IFN-γ being two of the most important
cytokines implicated in the pathogenesis of acute GvHD. IL-2 is important in the
activation of T cells and other effector cells such as NK cells. IFN-γ up-regulates
expression of adhesion molecules and MHC molecules and the production of
chemokines, thus increasing antigen presentation of foreign peptides (Ferrara et al,
1999).
Phase 3 of acute GvHD is initiated after the production of cytokines and effector
molecules by T cells. Activated T cells recruit an array of immune effector cells
including mononuclear phagocytes and NK cells. These effector cells, attack the host’s
organs and, in particular, the skin, the gastrointestinal tract and the liver (Sviland,
2000). Both CTL and NK cells are thought to be responsible for tissue damage (Ghayur
et al, 1987; Ferrara et al, 1989; Hill and Ferrara 2000). Tissue damage is mediated via

Chapter 1
28
the Fas/Fas ligand and the perforin/granzyme pathways (Kagi et al, 1994). T cells also
recruit mononuclear phagocytes.
As T cells are the primary initiators of GvHD, various studies, both human and mouse,
have attempted to reduce GvHD by T cell depletion of donor marrow. Early murine
studies (Uphoff, 1958) demonstrated that a graft that did not contain immunologically
competent cells resulted in less GvHD. Dicke et al (1968) confirmed in murine models
that the selective removal of donor T cells resulted in decreased frequency and severity
of GvHD.
The success of T cell depletion in murine studies led to its use in human BMT where it
has been shown to be associated with a major reduction in the risk of GvHD (reviewed
in Poynton, 1988). T cell depleted BMT was first described in relation to mismatched
transplants as these transplants would otherwise have an increased risk of GvHD
(Hansen et al, 1999). However, since GvHD also occurs with HLA identical donors, T
cell depletion has also been used for these transplants with equal efficacy in terms of
reducing GvHD (Atkinson et al, 1987). The beneficial effect of T cell depletion on GvHD
has been reviewed by Poynton (1998) and Butturini and Gale (1999). Unfortunately T
cell depletion also leads to an increase in graft rejection and leukaemic relapse.
Therefore T cell depletion is now generally reserved for use with HLA mismatched
donors.
1.9.3.2 Role of Natural Killer cells in GvHD
The role of NK cells in the pathogenesis of GvHD is less clear. Little is known about the
role of NK cells in GvHD in humans and most evidence for any role comes from murine
models. NK cells are implicated in the third phase of acute GvHD (Reddy and Ferrara,
2003). There is evidence from both humans and animal models (reviewed Reddy and
Ferrara, 2003), that NK cells, along with CTL, may be important effectors in the

Chapter 1
29
destruction of tissue. Ghayur and colleagues (1987) investigated the role of NK cells in
GvHD in strains of beige mutant mice (mice homozygous for the beige gene lack NK
cells). Mice were injected with lymphoid cells from either homozygous beige (bg/bg) or
heterozygous mice (bg/+). Early splenomegaly and pronounced immunosuppression
were observed in both bg/bg and bg/+ mice suggesting these effects were mediated by
donor T cells. However, only the mice injected with lymphoid cells from the bg/+ mice
had persistent GvH reactions and associated tissue damage which correlated with an
increase in NK cell cytotoxicity (measured by the 51Cr release assay) of donor origin.
NK cells were further implicated in GvH-associated tissue damage by Ferrara et al
(1989). Murine donor LGL were found infiltrating epithelial cells, mainly of the skin, liver
and intestinal tract, tissues typically associated with GvHD. Rhoades and colleagues
(1993) provided evidence for a role of NK cells in GvH-associated tissue damage in
humans. They found a strong association between high numbers of circulating NK cells
during acute GvHD. NK cells were the predominant cell infiltrating skin biopsies taken
from patients with GvHD with no increase in CD3+ T cells nor B cells. Thus suggests
that NK cells are the mediators of tissue destruction in GvHD.
In summary, the evidence outlined above suggests that donor T cells are the initiators
of GvHD after BMT and there is little evidence that NK cells play a role in initiating
GvHD. However, NK cells appear to play an important role in GvH-associated tissue
damage.
1.9.4 Cells Mediating the Graft versus Leukaemia Effect
The main purpose of a BMT is to replace the patient’s haematopoietic system which is
destroyed by lethal doses of irradiation used to kill the leukaemic cells. Leukaemic
relapse is quite common following BMT and it is much harder to treat recurrent
leukaemia then the primary leukemia. One of the advantages of allogeneic BMT over

Chapter 1
30
autologous BMT is the lower incidence of leukaemic relapse following allogeneic BMT.
This has been termed the GvL effect. It is thought that donor lymphocytes infused with
the transplanted bone marrow destroy any remaining leukaemic cells (Farag et al,
2002).
Early murine studies (Barnes et al, 1956) established the concept that bone marrow
allografts mediate an anti-leukaemia effect. Leukaemic mice infused with syngeneic
marrow could not be cured, whereas mice infused with allogeneic marrow were able to
clear the leukaemia but subsequently died from GvHD. Weiden and colleagues (1979)
were among the first to propose a relationship between leukaemia relapse and GvHD
in humans. In allogeneic (HLA-identical siblings) BM, they found that the leukemic
relapse rate was 2.5 times lower in transplants with GvHD compared to those without
GvHD (P<0.01). Other authors have reported that the prevalence of GvHD is greater
and leukemic relapse lower in HLA mismatched BMT than in HLA matched BMT,
supporting the idea that the same immune responses that causes GvHD also reduces
leukaemic relapse (Weiden et al, 1979; Weiden et al, 1981; Horowitz et al, 1990).
The GvL effect exhibited in HLA-identical siblings is thought to occur due to differences
in minor histocompatibility antigens because donor and recipient are matched for the
major histocompatibility antigens. Donor T cells recognise these antigens as foreign.
Therefore, the GvL effect can be mediated by T cells against minor histocompatibility
antigens (Riddell et al, 2003). The GvL effect in HLA mismatched BMT is likely to be
directed against the major histocompatibility antigens. Given class I HLA mismatch,
both T cells and NK cells are potentially involved. The GvL effect is also more profound
in certain leukemias. Aversa and colleagues (1998) studied patients with leukaemia
who underwent T cell depleted BMT from haploidentical relatives. They concluded that
AML and chronic myelogenous leukaemia (CML) in the chronic phase exhibit a greater
GvL effect than acute lymphocytic leukaemia (ALL).

Chapter 1
31
1.9.4.1 Role of T cells in GvL effect
Section 1.6.3.1 discussed T cell depletion of donor bone marrow as a method of
preventing GvHD. Although successful, it is associated with an unacceptable increase
in the rate of leukaemia relapse (Butturini and Gale, 1988). In one study of HLA
identical sibling BMT, the risk of relapse was 20% without T cell depletion and 40%
with T cell depletion (Butturini and Gale, 1988). This suggests an important role for T
cells in the GvL effect. Donor T cells are capable of recognising both major and minor
histocompatibility molecules on the surface of the leukaemic cells (reviewed Riddell et
al, 2003). It seems likely that the recognition of minor histocompatibility antigens is
responsible for the GvL effect exhibited in HLA-identically matched related individuals,
as there is no MHC incompatibility. In vitro assays have demonstrated that T cells
specific for minor histocompatibility antigens can lyse recipient leukaemic cells and
prevent leukaemic colony formation (Warren et al, 1998).
1.9.4.2 Role of Natural Killer cells in GvL effect
Until very recently the role of NK cells in the GvL effect has been less clear and
evidence in humans has been mainly circumstantial. For example, any GvL effect seen
after T cell depletion has been postulated to be due to NK cells (Poynton, 1988). NK
cells are one of the first cells to recover following both allogeneic and autologous BMT
(Poynton, 1988). Therefore they could potentially be involved in the elimination of
residual leukemic cells. Evidence for NK cells mediating the GvL effect in a
haploidentical setting in humans has recently been described and will be reviewed in
detail in section 1.7
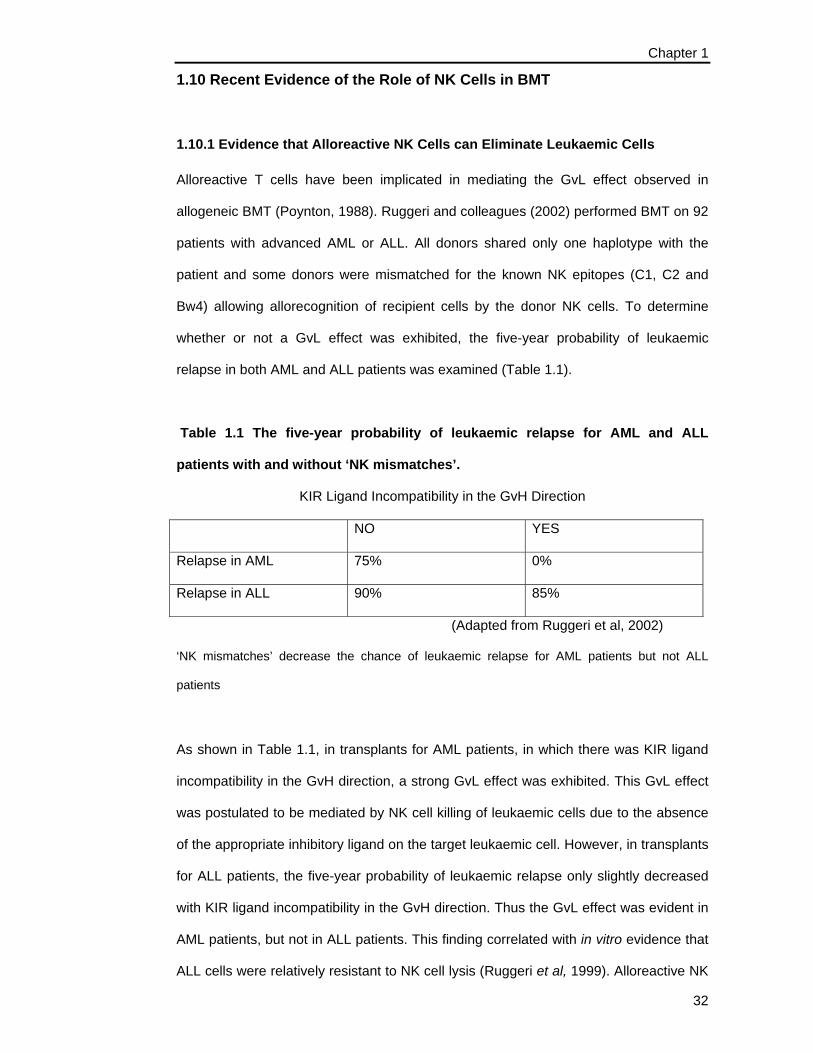
Chapter 1
32
1.10 Recent Evidence of the Role of NK Cells in BMT
1.10.1 Evidence that Alloreactive NK Cells can Eliminate Leukaemic Cells
Alloreactive T cells have been implicated in mediating the GvL effect observed in
allogeneic BMT (Poynton, 1988). Ruggeri and colleagues (2002) performed BMT on 92
patients with advanced AML or ALL. All donors shared only one haplotype with the
patient and some donors were mismatched for the known NK epitopes (C1, C2 and
Bw4) allowing allorecognition of recipient cells by the donor NK cells. To determine
whether or not a GvL effect was exhibited, the five-year probability of leukaemic
relapse in both AML and ALL patients was examined (Table 1.1).
Table 1.1 The five-year probability of leukaemic relapse for AML and ALL
patients with and without ‘NK mismatches’.
KIR Ligand Incompatibility in the GvH Direction
NO YES
Relapse in AML 75% 0%
Relapse in ALL 90% 85%
(Adapted from Ruggeri et al, 2002)
‘NK mismatches’ decrease the chance of leukaemic relapse for AML patients but not ALL
patients
As shown in Table 1.1, in transplants for AML patients, in which there was KIR ligand
incompatibility in the GvH direction, a strong GvL effect was exhibited. This GvL effect
was postulated to be mediated by NK cell killing of leukaemic cells due to the absence
of the appropriate inhibitory ligand on the target leukaemic cell. However, in transplants
for ALL patients, the five-year probability of leukaemic relapse only slightly decreased
with KIR ligand incompatibility in the GvH direction. Thus the GvL effect was evident in
AML patients, but not in ALL patients. This finding correlated with in vitro evidence that
ALL cells were relatively resistant to NK cell lysis (Ruggeri et al, 1999). Alloreactive NK
Chapter 1
33
cells that had previously been shown to be able to kill allogeneic PHA lymphoblasts or
EBV-transformed B lymphoblastoid cell lines (BLCL) of leukemia patients were then
tested against AML, CML or ALL cells from the same patients. AML and CML cells
lacking the relevant HLA epitopes were lysed, but ALL cells from only 2 out of 5
patients were lysed. To determine why ALL cells were less susceptible to NK cells
mediated lysis, the expression of several adhesion molecules was determined by flow
cytometry. ALL cells resistant to lysis by NK cells exhibited low expression of the
lymphocyte function antigen-1 (LFA-1) compared with susceptible CML and AML cells.
This data suggests that NK cells require the expression of LFA-1 on the surface of the
target cell, in addition to the absence of a ligand for the inhibitory KIR, to be able to
bind and lyse the target cell.
Having shown that NK mismatches may induce the GvL effect, murine studies were
conducted to investigate the mechanisms behind these results. Ruggeri and colleagues
(2002) injected human CML cells into severe combined immunodeficient (SCID) mice.
Mice developed advanced leukemia within 6 weeks and died if left untreated or infused
with human NK cells that were not alloreactive towards the human leukemic cells.
However, mice infused with human NK cells that were alloreactive towards leukemic
cells cleared the leukaemia and survived. Thus alloreactive NK cells were not only able
to kill leukaemic cells in vitro, but they were also capable of clearing leukaemia in an
animal model.
1.10.2 Evidence that Alloreactive NK cells can Prevent GvHD
Haploidentical transplants performed by Ruggeri et al (2002) also suggested that
alloreactive NK cells protect against GvHD. The prevalence of GvHD was 0% in
transplants with potential for NK alloreactivity and 13.5% in transplants without the
potential for NK alloreactivity. Ruggeri and colleagues investigated the mechanisms by
which GvHD was reduced in a murine model. H-2b mice transplanted with non-T cell

Chapter 1
34
depleted marrow from H-2d mice died from GvHD. However, if recipient mice were
infused with alloreactive NK cells from H-2d mice as part of the conditioning regime
prior to infusion of stem cells, 100% of the mice survived without developing GvHD.
Even with escalating doses of donor T cells, all mice still survived. Mice infused with
non-alloreactive NK cells prior to transplant developed GvHD. They provided evidence
that alloreactive NK cells prevent GvHD by eliminating recipient APC, thereby
preventing interaction with donor T cells which would otherwise initiate GvHD. These
experimental findings were consistent with lower prevalence of GvHD observed in
human transplants, in which there was potential for NK alloreactivity.
In summary, Ruggeri and colleagues provided evidence that alloreactive NK cells could
eliminate leukaemic cells in vitro and in animal models. They also postulated that the
GvL effect exhibited in human haploidentical BMT was mediated by alloreactive NK
cells. The low occurrence of GvHD evident in the human haploidentical BMT was also
postulated to be due to alloreactive NK cells lysing recipient APC.
1.10.3 Prediction of NK alloreactivity using HLA and KIR Genetics
Not all mismatches of KIR related HLA epitopes result in NK alloreactivity. Therefore it
is not possible to reliably predict NK alloreactivity based on the donor’s HLA type and
KIR repertoire and the recipient’s HLA type. It has been reported that HLA-C*1402 (C1)
may not be a ligand for KIR2DL2/3 despite having the appropriate amino acid at
position 80 for a C1-group allele (Colonna et al, 1993). It might be predicted therefore
that donors who have HLA-C*1402 as their only C1 allele may not be able to generate
alloreactive NK clones dependent on KIR2DL2/3. Other examples of HLA-C alleles that
do not behave as their amino acid sequence at position 80 would predict, may exist but
a survey of all common alleles has not been undertaken. Genetic polymorphisms of the
inhibitory KIR for HLA-C alleles (KIR2DL1, KIR2DL2 and KIR2DL3) also exists and the
Chapter 1
35
influence of this allelic variation on the ability to generate alloreactive NK cells has not
been examined.
Only two-thirds of HLA-Bw4 positive and KIR3DL1 positive individuals can generate NK
clones that are alloreactive towards targets that are Bw4-negative (reviewed in Ruggeri
et al, 2006). The reason for this is not clear, but it could be due, at least in part, to the
different levels of expression of the KIR3DL1 alleles (Gardiner et al, 2001).
KIR3DL1*004 is the second most common KIR3DL1 allele in Caucasions (Halfpenny et
al, 2004) but it is not expressed on the cell surface and therefore could account for a
large proportion of patients with Bw4 and KIR3DL1 who do not make KIR3DL1
dependent NK clones. It is also not known whether the high and low expression
KIR3DL1 alleles respond in the same way to targets lacking Bw4 nor whether high or
low KIR3DL1 expression affects a donor’s ability to generate KIR3DL1 dependent NK
clones. The different Bw4-positive HLA alleles may also interact differently with
KIR3DL1. Bw4-positive HLA alleles with an 80I have been reported to be better ligands
then those with an 80T (Cella et al, 1994). Therefore the ability of donors to make
KIR3DL1 dependent NK clones may be effected by their Bw4-positive HLA alleles.
The role of activating KIR in mediating alloreactivity is less well defined. The ligands for
the activating KIR remain controversial but are believed to be the same as for their
inhibitory counterparts because of the structural similarity between the receptors.
However this has been difficult to demonstrate (Vales-Gomez et al, 1998; Winter et al,
1998; Saulquin et al, 2003). The role of activating KIR in mediating NK alloreactivity
needs investigating.
1.11 Hypotheses and Aims
Long, labour intensive functional NK cloning assays are currently used to select donors
who are able to generate alloreactive NK clones towards a patient requiring a
haploidentical transplant. A better understanding of the interaction of HLA alleles and

Chapter 1
36
KIR receptors may eventually allow suitable donors to be predicted from HLA type and
KIR genotypes.
Hypothesis
The current understanding of HLA ligands and KIR receptors will not reliably predict
HLA:KIR interaction and therefore, the ability to generate alloreactive NK clones
Aims
1. To develop a more efficient assay for the detection of alloreactive NK cells
2. To determine the ability of common HLA-C alleles to interact with KIR2DL1 and
KIR2DL2/3
3. To determine the ability of common HLA-B alleles and Bw4-positive HLA-A alleles
to interact with KIR3DL1
4. To identify a role for activating KIR in mediating NK alloreactivity

Chapter 2
37
Chapter 2
Materials and Methods

Chapter 2
38
Chapter 2: Materials and Methods
2.1 Cell Culture
2.1.1 Cell Lines
EBV-transformed B-Lymphoblastoid Cell Lines
EBV-transformed BLCL were selected from an extensive panel at the Department of
Clinical Immunology and Immunogenetics at Royal Perth Hospital (RPH). Cell lines
were maintained in RPMI 1640 and 10% sterile heat inactivated FCS (RPMI/10%) and
split every 3-4 days to 1x10⁵ cells/mL.
721.221 Cell Line
The 721.221 cell line is a class I negative human BLCL (kindly provided by Jim
McCluskey, University of Melbourne). 721.221 cells were maintained in RPMI/10%FCS
and split every 2-3 days at 1x10⁵ cells/mL.
RPMI-8866 Cell Line
RPMI-8866 cells (American Type Cell Collection, Manassas, USA) were maintained in
RPMI/10%FCS and split every 2-3 days at 1x10⁵ cells/mL.
NK Cell Lines
The YTS NK cell line transfected with KIR2DL3 (kindly provided by Eric Long, NIAID)
was maintained in IMDM with 10%FSC and 1ug/mL puromycin (Sigma-Aldrich, St
Louis USA) and split every 3 days at 1x10⁵ cells/mL.
Chapter 2
39
2.1.2 Separation of PMBC
2.1.2.1 Isolation of PBMC
Blood was obtained from laboratory volunteers and blood donors from The Australian
Red Cross Blood Service with informed consent. Blood was diluted 1/3 with 1xPBS
containing 2%FCS (PBS2%) and mixed well. 1/3 Ficoll Paque (Pharmacia, Uppsala
Sweden) was under-layed carefully. Blood was then centrifuged at 1200g for 20
minutes with the brake-off. PBMC were harvested from the interface of the ficoll
gradient and washed three times in PBS2% at 300g for 7 minutes. Cells were then
resuspended in 1mL RPMI/10%. Cells were diluted either 1/2 or 1/5 in trypan blue and
counted using a Neubauer Haemocytometer (GmbH, Munich Germany).
2.1.2.2 Isolation of PBMC from Unusable Red Cell Bags as Allogeneic Feeder Cells
Ten unusable red cell bags were obtained from normal donors from the Australian Red
Cross Blood Bank. Buffy coats were made from the blood by centrifugation at 1200g for
15 minutes. The white cell layer (buffy coat) was removed with a pasteur pipette and
diluted 1/3 with PBS2%. PBMC were isolated on a gradient as in section 2.1.2.1. After
isolation and before cell counting, PMBC from each donor were pooled.
2.1.2.3 Storage of Pooled Allogeneic PBMC
Pooled allogeneic PBMC were stored at concentrations varying from 20-50 x 106
cells/mL in 1mL freezing medium in CryoTubeTM Vials (Nalgene Nunc International,
Albertslund Denmark). The vials were initially frozen at -80°C to allow the gradual
cooling of the cells before transfer to liquid nitrogen.
Chapter 2
40
2.1.2.4 Thawing of PBMC
Cells were removed from liquid nitrogen and placed on dry ice. Each vial was thawed in
a waterbath at 37°C and immediately transferred to RPMI/10%. The cells were then
centrifuged at 300g for 7 minutes. The cells were resuspended in 1mL RPMI/10%.
Cells were diluted either 1/2 or 1/5 in trypan blue and counted using a Neubauer
Haemocytometer.
2.1.2.5 Irradiation of Cells
Pooled allogeneic PBMC were irradiated at 30Gy using the GammaCell 3000 ELAN
(MDS Nordion, Ottawa Canada) at the Institute for Child Health Research. RPMI-8866
cells were likewise irradiated at 60Gy. After radiation, both PBMC and RMPI-8866 cells
were washed twice in RMPI/10% at 300g for 7 minutes.
2.2 Natural Killer Cell Cloning
2.2.1 Enrichment of Natural Killer Cells
Prior to dilution with PBS, 50μL of RosetteSep Antibody Cocktail (Stemcell
Technologies, Vancouver Canada) per mL of blood was mixed with the blood and the
mixture was incubated for 20 minutes. The RosetteSep Antibody Cocktail is a
combination of bispecific mouse and rat monoclonal antibodies for which one arm of
the antibody is specific for cell surface antigens on human haematopoietic cells (CD3,
CD4, CD19, CD36, CD66b) and the other is specific for glycophorin A on red blood
cells. The antibodies cause non-NK cells to be complexed to red blood cells and then
eliminated by ficoll centrifugation. It is used to deplete blood of T and B lymphocytes,
monocytes, granulocytes and dendritic cells. After incubation, the NK cells were
harvested from the interface of a ficoll gradient as described in section 2.1.2.1.

Chapter 2
41
2.2.2 Natural Killer Cell Cloning
After separation, NK cells were plated out at 20 cells/100μL, 10 cells/100μL, 5 cells/
100μL and 2 cells/100μL by limiting dilutions into 96-well round bottom plates (BD,
Franklin Lakes USA). Irradiated allogeneic PBMC were added to each well at a
concentration of 1x10⁵ cells/100μL. On day 1 (24 hours after plating), 100μL of medium
was removed and replaced with fresh medium containing 400IU/mL IL-2 (Chiron,
Emeryville USA) resulting in a final concentration of 200IU/mL. On day 4, 100μL of
medium was removed and replaced with irradiated PBMC added to each well at a
concentration of 8 x 10⁴ cells/100μL. On day 11, 100μL of medium was removed and
replaced with 100ul fresh medium containing 200IU/mL IL-2, such that the final
concentration was 100IU/mL. On days 14-20 cell growth was monitored by light
microscopy and cells were split if necessary. When splitting cells, 100μL of fresh
medium containing 2 x 10⁴ irradiated RPMI-8866 cells were added to each well. Cells
were screened for NK receptor expression and alloreactivity by flow cytometry and
cytotoxicity, respectively. Once NK clones were fully characterised, selected NK clones
were frozen at a concentration between 1-3 x 10⁶ cells/mL and stored in liquid nitrogen
at -80°C.
2.2.3 Natural Killer Cell Polyclonal Cultures
After isolation, polyclonal NK cells were diluted to a concentration of 3 x 10⁴ cells/mL.
100μL of NK cells were added to each well of a 96-well round bottom tray. 100μL of
irradiated allogeneic PBMC were added to each well at a concentration of 3 x 10⁵
cells/mL. Every 2-3 days, 100μL of medium was removed and replaced with 100μL
fresh medium containing 200IU/mL IL-2, such that the final concentration was
100IU/mL. After 12 days of culture, the polyclonal NK cells were counted and frozen at
a concentration between 2-3 x 10⁶ cells/mL.

Chapter 2
42
2.2.4 Restimulation of Natural Killer Cell Clones and Polyclonal Cultures
NK cells were thawed rapidly in a waterbath at 37°C and immediately transferred to
8mL warm NK medium. The cells were washed at 300g for 7 minutes and resuspended
in 1mL for counting. Cells were diluted 1/2 in trypan blue and counted using a
Neubauer Haemocytometer. The NK cells were diluted to 5 x 10⁴ cells/mL in NK
medium containing 200IU/mL IL-2 and 100μL was added to each well of a 96-well
round bottom tray. 100μL of irradiated RPMI-8866 (section 2.1.2.5) were added to each
well at a concentration of 5x10⁵ cells/mL in NK medium. Every 2-3 days 100μL medium
was removed and 100μL fresh NK medium containing 200IU/mL IL-2 was added. Every
12 days after restimulation the NK cells were subcultured at 5 x 10⁴ cells/mL and fresh
irradiated RMPI-8866 was added to the NK cells at a concentration of 5 x 10⁵ cells/mL.
2.3 Immunophenotyping
2.3.1 Flow Cytometry on Whole Blood
5 – 10μL of the appropriate conjugated antibody (appendix 2) was added to a FACS
tube. 100μL whole blood was added to the tube and incubated at room temperature for
15 minutes. Red cells were lysed after incubation using the Q-Prep Workstation
(Beckman Coulter, Fullerton USA). Flow cytometric analysis was then carried out on a
Coulter XL-EPICSTM Flow Cytometer (Beckman Coulter, Fullerton USA) and the BD
Biosciences FACSCantoTM Flow Cytometer (BD, Franklin Lakes USA).
2.3.2 NK Cell Phenotypying-Labelled Primary Antibodies
104 - 105 NK cells were added to one well of a 96-well round bottom tray and the plate
was washed twice in flow buffer (appendix 1) by centrifugation at 200g for 5 minutes.
50μL of the appropriate conjugated antibody was added to each well and incubated on
ice in the dark for 20 minutes. Cells were than washed twice and resuspended in
Chapter 2
43
100μL of flow buffer with 100μL of 1% paraformaldehyde. Cells were then stored at
4°C in the dark until analysis.
2.3.3 NK Cell Phenotypying and class I HLA Staining-Labelled Secondary
Antibodies
Staining for class I HLA antigens and certain NK cell markers required the use of
unconjugated antibodies which involved a two-step staining process. 105 – 106 cells
were added to FACS tubes. 2mL flow buffer was added and the cells washed twice by
centrifugation at 200g for 5 minutes. 50μL of the appropriate unconjugated antibody
(appendix 2) was added to each FACS tube and incubated on ice in the dark for 20
minutes. After incubation the cells were washed twice. 50ul of the appropriate
secondary antibody (appendix 2) was then added to each FACS tubes and the cells
incubated on ice in the dark for 20 minutes. After incubation the cells were washed
twice and resuspended in a final volume of 400μL containing 1% paraformaldehyde.
2.3.4 Analysis of Flow Cytometry Data
Analysis of flow cytometry was performed using BD FACSDivaTM Software (BD
Biosciences, Franklin Lakes, USA) and FlowJo Software (Tree Star Inc, Ashland USA).
2.4 Natural Killer Cell Cytotoxicity
NK cell cytotoxicity was measured by one of two methods: the 4 hour 51Cr release
assay or the CD107a assay. Briefly, NK cells were incubated with target cells in both
assays. The 4 hour 51Cr release assay involved labelling target cells with 51Cr. Effector
cells (NK cells) killing of the target cell results in the release of 51Cr into the
supernatant. The amount of 51Cr released can be sampled as a measure of
cytotoxicity. The CD107a assay involves the use of an antibody specific for the

Chapter 2
44
lysosomal-associated membrane protein-1 (LAMP-1 or CD107a) which is expressed on
degranulating (cytotoxic) NK cells.
2.4.1 Target Cell Preparation
EBV-transformed B cell lines were used as target cells in the 4 hour 51Cr release
assay. Cell lines were subcultured by making a 1 in 3 dilution two days before the
assay to ensure that they were rapidly growing when labelled with 51Cr. Approximately
16 hours before the start of the assay, the cell lines were counted and resuspended at
5 x 10⁵ cells/mL in a 24-well plate (BD, Franklin Lakes USA). 25uCi 51Cr was added per
0.5 x 10⁶ cells (calculated as 30μL 51Cr). The amount of 51Cr added increased as the
half-life of the radioisotope decreased and the amount added was calculated
proportionately. Target cells were incubated overnight at 37°C in 5% CO2. After
incubation cells were washed three times in RPMI/10% by centrifugation at 300g for 7
minutes. Cells were than counted and resuspended at 5 x 10⁴ cells/mL.
2.4.2 Effector Cell Preparation
NK cell clones or NK cell lines were used as effector cells in the 4 hour 51Cr release
assay. Cells were counted and adjusted to varying concentrations in order to achieve
the appropriate effector: target ratios. A 1:1 ratio was used when screening NK clones
for alloreactivity. All other assays were performed at a 2:1 ratio
2.4.3 4 hour 51Cr Release Assay
Target cells were plated out into a 96-well round-bottom plate. Effector cells were
added at varying ratios (section 2.4.2). Spontaneous release was determined in wells
containing target cells and medium alone without effector cells. Maximum release was
determined by incubating 100μL of target cells with 100μL of 0.5% Triton X-100. Plates
were incubated at 37°C in 5% CO2 for 4 hours. After incubation, plates were

Chapter 2
45
centrifuged at 200g for 3 minutes to pellet cells. 100μL of supernatant was carefully
removed from each well without disturbing the pellet. 51Cr release was then measured
in a 1282 Compugamma Universal Gamma Counter (LKB Wallace, Turku Finland) and
expressed in counts per minute. The relative specific lysis of targets was calculated as:
Relative specific lysis = (specific release (cpm) - background release (cpm)
(maximum release (cpm) - background release)
If blocking of certain NK cell receptors was required, 2μL of receptor specific antibody
or isotype control diluted appropriately (appendix 2) was added to each well. 100μL of
effector cells were added to each well and incubated at 37°C for 20 minutes. After
incubation 100μL of target cells were added to each well and the assay proceeded as
above.
2.4.4 CD107a Assay
105 NK cells were mixed with 105 target cells in a 96 well-round bottom tray at a ratio of
1:1. 5μL of CD107a-FITC antibody was added to each well and the plate was
incubated for 1 hour at 37°C in 5%CO2. 6ug/mL monensin (Golgi-Stop, BD, Franklin
Lakes USA) was added to each well and the cells were incubated for a further 5 hours
at 37°C in 5%CO2. The cells were then either transferred to flow tubes or staining was
continued in the 96 well-round bottom tray. Cells were washed twice in flow buffer by
centrifugation at 200g for 5 minutes. The appropriate KIR antibody (appendix 2) and
CD56-PeCy7 (BD, Franklin Lakes USA) were added to the cells and the tubes or plate
incubated on ice in the dark for 15 minutes. Cells were then washed twice in flow buffer
by centrifugation at 200g for 5 minutes. Cells were resuspended in 300μL flow buffer
and analysed.
X 100
Chapter 2
46
2.5 DNA and RNA
2.5.1 DNA Extraction
DNA was either isolated from 200µL of whole blood or, up to 5 x 10⁶ cells, using the
QIAamp DNA Blood Mini Kit (Qiagen, Valencia USA). After extraction the concentration
of DNA was read by placing 1µl of the sample on the Nanodrop (ND 1000
Spectrophotometer, Biolab, Victoria AUS). DNA was stored in 1.5mL Eppendorf tubes
at 4°C.
2.5.2 RNA Extraction
RNA was extracted from up to 5 x 10⁶ NK cells or EBV-transformed B cell lines using
the RNeasy Protect Mini Kit (Qiagen, Valencia USA) as per the manufacturer’s
instructions. After extraction the concentration of DNA was read by placing 1µl of the
sample on the Nanodrop. RNA was stored in 1.5mL eppendorf tubes at -80°C.
2.5.3 Reverse Transcriptase PCR
cDNA was synthesised from 1μg of mRNA using oligo(dT) (Promega, Madison USA)
and omniscript (Qiagen, Valencia USA) and amplified for 90 minutes at 37°C. cDNA
was stored at -20°C.
2.6 Polymerase Chain Reaction
The polymerase chain reaction (PCR) was used to amplify specific regions of DNA
using sets of oligonucleotides complementary for each DNA strand, which at specific
temperatures, anneal to the DNA. PCR was used throughout the work described in this
thesis to amplify KIR2DL1, KIR2DS1, KIR2DL2 and KIR2DL3 cDNA and KIR3DL1
genomic DNA for allele typing by DNA sequencing. SSP-PCR was also used to
determine complete KIR genotypes. Primer sequences are outlined in appendix 3.
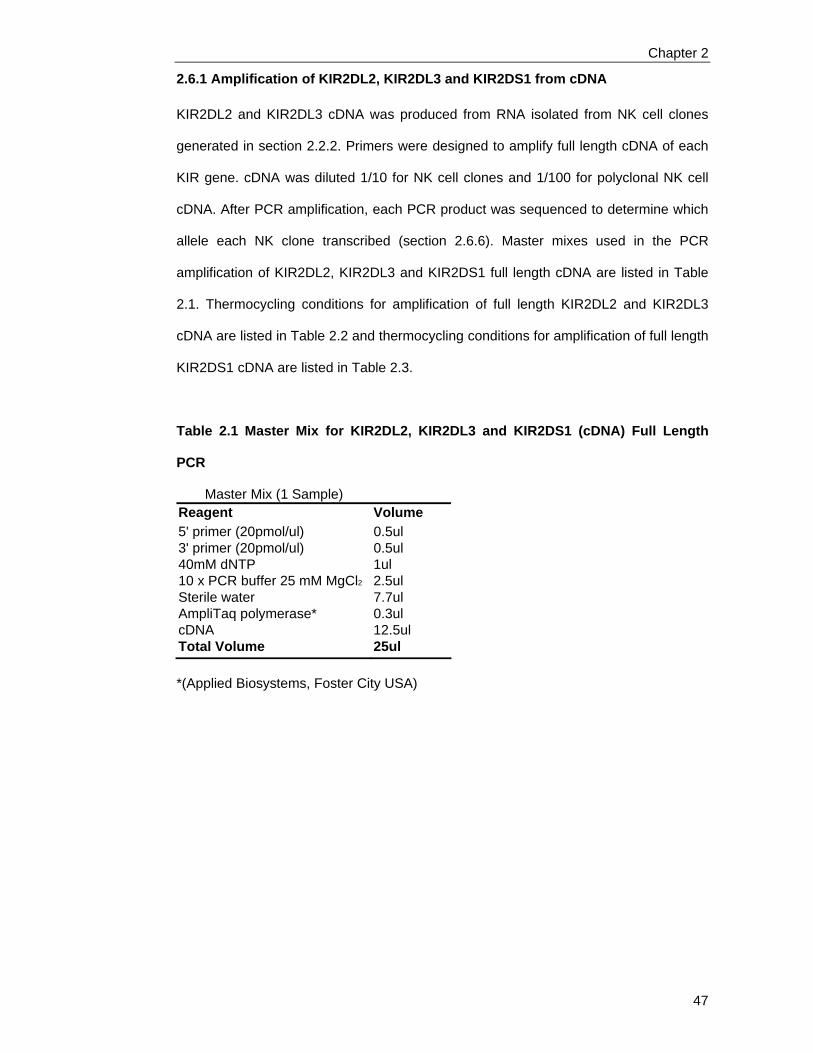
Chapter 2
47
2.6.1 Amplification of KIR2DL2, KIR2DL3 and KIR2DS1 from cDNA
KIR2DL2 and KIR2DL3 cDNA was produced from RNA isolated from NK cell clones
generated in section 2.2.2. Primers were designed to amplify full length cDNA of each
KIR gene. cDNA was diluted 1/10 for NK cell clones and 1/100 for polyclonal NK cell
cDNA. After PCR amplification, each PCR product was sequenced to determine which
allele each NK clone transcribed (section 2.6.6). Master mixes used in the PCR
amplification of KIR2DL2, KIR2DL3 and KIR2DS1 full length cDNA are listed in Table
2.1. Thermocycling conditions for amplification of full length KIR2DL2 and KIR2DL3
cDNA are listed in Table 2.2 and thermocycling conditions for amplification of full length
KIR2DS1 cDNA are listed in Table 2.3.
Table 2.1 Master Mix for KIR2DL2, KIR2DL3 and KIR2DS1 (cDNA) Full Length
PCR
Master Mix (1 Sample) Reagent Volume 5' primer (20pmol/ul) 0.5ul 3' primer (20pmol/ul) 0.5ul 40mM dNTP 1ul 10 x PCR buffer 25 mM MgCl2 2.5ul Sterile water 7.7ul AmpliTaq polymerase* 0.3ul cDNA 12.5ul Total Volume 25ul *(Applied Biosystems, Foster City USA)

Chapter 2
48
Table 2.2 KIR2DL2 cDNA and KIR2DL3 cDNA Full Length PCR Thermocycling
Conditions
KIR2DL2 KIR2DL3 Temperature/Time Cycle Number Temperature/Time Cycle Number 95°C x 5 min 1 95°C x 5 min 1 97°C x 20 s 97°C x 20 s 66°C x 45 s 5 66.6°C x 45 s 5 72°C x 90 s 72°C x 90 s 95°C x 20 s 95°C x 20 s 62°C x 45 s 25 62.6°C x 45 s 25 72°C x 90 s 72°C x 90 s 72°C x 10 min 1 72°C x 10 min 1 4°C HOLD 4°C HOLD Table 2.3 KIR2DS1 Full Length PCR Thermocycling Conditions
Temperature/Time Cycle Number 95°C x 5 min 1 97°C x 20 s 64°C x 45 s 5 72°C x 90 s 95°C x 20 s 60°C x 45 s 25 72°C x 90 s 72°C x 10 min 1 4°C HOLD
2.6.2 SSP-PCR for KIR2DS1 on genomic DNA and SSP-PCR for KIR2DL1 from
cDNA
Detection of KIR2DS1 from genomic DNA and KIR2DL1 from cDNA (chapter 5) was
performed using SSP primers designed by (Uhrberg et al, 1997). The master mix used
in the PCR amplification of KIR2DS1 genomic DNA is listed in Table 2.4 and in Table
2.5 for the amplification of KIR2DL1. Thermocycling conditions for amplification of both
KIR2DS1 genomic DNA and KIR2DL1 cDNA are listed in Table 2.6.
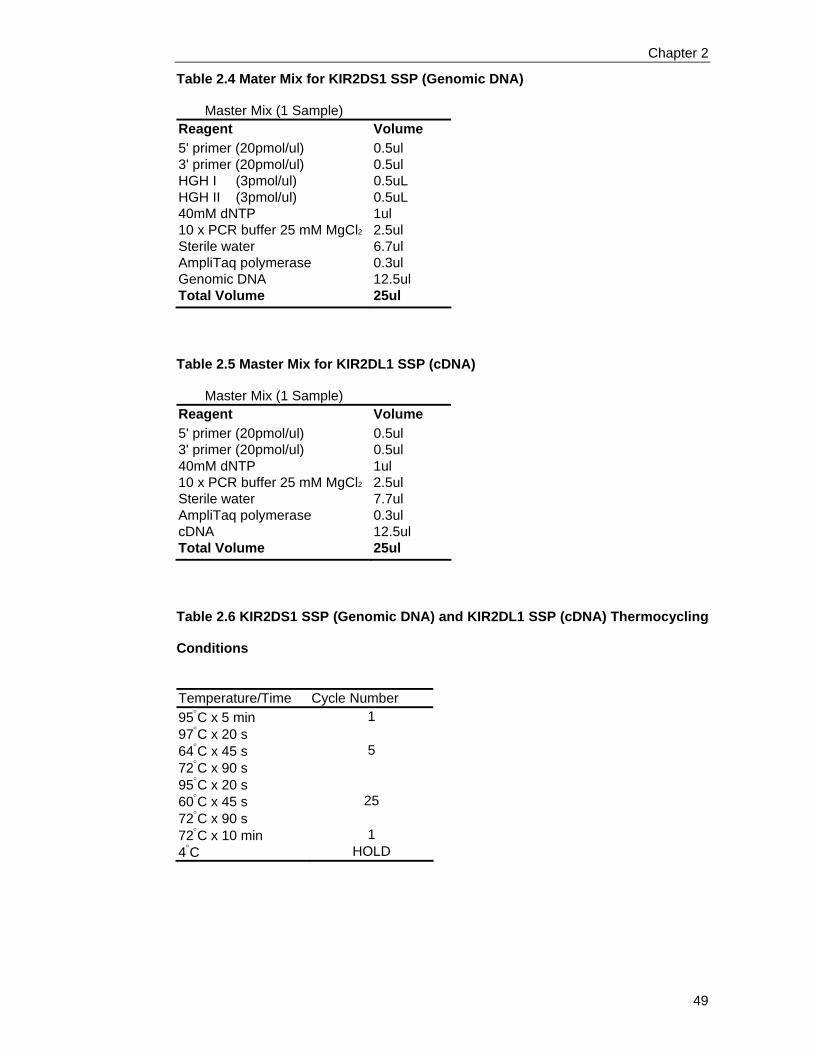
Chapter 2
49
Table 2.4 Mater Mix for KIR2DS1 SSP (Genomic DNA)
Master Mix (1 Sample) Reagent Volume 5' primer (20pmol/ul) 0.5ul 3' primer (20pmol/ul) 0.5ul HGH I (3pmol/ul) 0.5uL HGH II (3pmol/ul) 0.5uL 40mM dNTP 1ul 10 x PCR buffer 25 mM MgCl2 2.5ul Sterile water 6.7ul AmpliTaq polymerase 0.3ul Genomic DNA 12.5ul Total Volume 25ul Table 2.5 Master Mix for KIR2DL1 SSP (cDNA)
Master Mix (1 Sample) Reagent Volume 5' primer (20pmol/ul) 0.5ul 3' primer (20pmol/ul) 0.5ul 40mM dNTP 1ul 10 x PCR buffer 25 mM MgCl2 2.5ul Sterile water 7.7ul AmpliTaq polymerase 0.3ul cDNA 12.5ul Total Volume 25ul Table 2.6 KIR2DS1 SSP (Genomic DNA) and KIR2DL1 SSP (cDNA) Thermocycling
Conditions
Temperature/Time Cycle Number 95°C x 5 min 1 97°C x 20 s 64°C x 45 s 5 72°C x 90 s 95°C x 20 s 60°C x 45 s 25 72°C x 90 s 72°C x 10 min 1 4°C HOLD
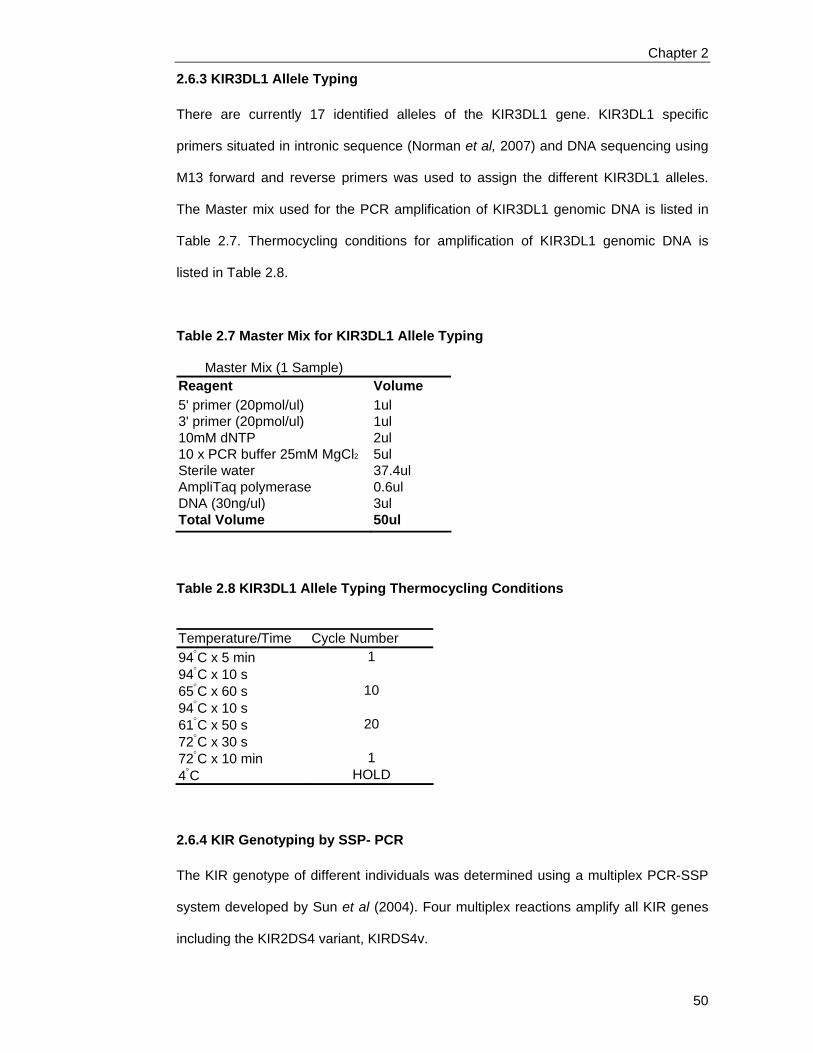
Chapter 2
50
2.6.3 KIR3DL1 Allele Typing
There are currently 17 identified alleles of the KIR3DL1 gene. KIR3DL1 specific
primers situated in intronic sequence (Norman et al, 2007) and DNA sequencing using
M13 forward and reverse primers was used to assign the different KIR3DL1 alleles.
The Master mix used for the PCR amplification of KIR3DL1 genomic DNA is listed in
Table 2.7. Thermocycling conditions for amplification of KIR3DL1 genomic DNA is
listed in Table 2.8.
Table 2.7 Master Mix for KIR3DL1 Allele Typing
Master Mix (1 Sample) Reagent Volume 5' primer (20pmol/ul) 1ul 3' primer (20pmol/ul) 1ul 10mM dNTP 2ul 10 x PCR buffer 25mM MgCl2 5ul Sterile water 37.4ul AmpliTaq polymerase 0.6ul DNA (30ng/ul) 3ul Total Volume 50ul
Table 2.8 KIR3DL1 Allele Typing Thermocycling Conditions
Temperature/Time Cycle Number 94°C x 5 min 1 94°C x 10 s 65°C x 60 s 10 94°C x 10 s 61°C x 50 s 20 72°C x 30 s 72°C x 10 min 1 4°C HOLD
2.6.4 KIR Genotyping by SSP- PCR
The KIR genotype of different individuals was determined using a multiplex PCR-SSP
system developed by Sun et al (2004). Four multiplex reactions amplify all KIR genes
including the KIR2DS4 variant, KIRDS4v.

Chapter 2
51
2.6.5 Visualising PCR Products
After amplification, PCR products were visualised by electrophoresis on a 1% agarose
gel. 3ul of loading buffer was added to 10ul of PCR product and loaded into the wells
within 1% agarose gel containing ethidium bromide. 10ul of 1kb Plus Lambda DNA
ladder (Invitrogen, Carlsbad USA) was also added to one well. The gel was run at 150
volts for 20-30 minutes in an electrophoresis tank containing 0.5 x TBE. PCR products
were visualised on an UV-light transilluminator using a Bio-Rad Gel Doc (Bio-Rad,
Hercules USA). PCR products were analysed using the Quantity One software from
Bio-Rad.
2.6.6 DNA Sequencing
DNA sequencing was carried out using Big Dye terminator technology (Applied
Biosystems, Foster City USA). HLA-A, B and C typing and KIR allele typing was
performed by the Department of Clinical Immunology and Immunogenetics, RPH.
Sequence was analysed using SeqScape Software (Applied Biosystems, Foster City
USA).

Chapter 3
52
Chapter 3
KIR2DL3*001 and KIR2DL3*002 Differ in Their Ability to Interact with C1-group HLA-C Alleles
Chapter 3
53
Chapter 3: KIR2DL3*001 and KIR2DL3*002 Differ in Their Ability
to Interact with C1-group HLA-C Alleles
3.1 Introduction
The NK cell KIR receptor family, recognise allelic epitopes of class I HLA molecules. All
HLA-C alleles are divided into two groups, C1 and C2, based on their amino acids at
position 80 of the α1 domain (Mandelboim et al, 1996). C1-group alleles bind to
KIR2DL2 and KIR2DL3 while C2-group alleles bind to KIR2DL1. Individuals with an
HLA-C allele that includes the C1 epitope and whose KIR repertoire includes KIR2DL2
and/or KIR2DL3 are able to generate NK clones dependent on that receptor alone for
inhibition. In an allogeneic setting these NK clones will lyse cells from donors whose
HLA type lacks the C1 epitope. Likewise, individuals whose HLA-C alleles include the
C2 epitope and whose KIR repertoire includes KIR2DL1 are able to generate NK
clones dependent on that receptor and will lyse allogeneic targets lacking the C2
epitope. If an individual has both the C1 and C2 epitope as well as KIR2DL1 and
KIR2DL2/3, they are able to generate both KIR2DL1 dependent and KIR2DL2/3
dependent NK clones.
Although the amino acid at residue 80 is known for all HLA-C alleles, not all HLA-C
alleles have been shown empirically to bind to the predicted KIR receptor. An example
of an allele that does not behave as expected has been reported. Colonna and
colleagues (1993) demonstrated in chromium release assays that the HLA-C*1402
allele did not inhibit NK clones inhibited by other C1 alleles, despite the fact that HLA-
C*1402 has asparganine at amino acid 80 which would confer the C1 epitope. In
addition to the lack of empirical evidence for many HLA-C alleles, there are currently
five known alleles of KIR2DL2 and seven known alleles of KIR2DL3 (Robinson et al,
2003) and it is not known whether allelic differences between KIR alleles influence their
interactions with HLA-C.

Chapter 3
54
In bone marrow transplant patients, an HLA-C allele that did not interact with its
predicted receptor might confer susceptibility to alloreactive NK cells where it might not
otherwise have existed. Bone marrow transplant donors with such alleles might not be
able to generate NK alloreactivity as expected; eg if HLA-C*1402 is not a ligand for
KIR2DL2/3, it might be predicted that individuals who express HLA-C*1402 as their
only C1 positive allele would not be able to generate alloreactive NK cells dependent
on KIR2DL2/3.
Individual NK cells may express multiple inhibitory and activating receptors. To
examine the interaction of KIR2DL2 and KIR2DL3 with HLA-C alleles having the C1
epitope, NK clones were generated from several individuals to find NK clones
expressing KIR2DL2 or KIR2DL3 as their only inhibitory receptor. KIR2DL2 and
KIR2DL3 dependent NK clones were used to investigate the interaction of the common
HLA-C alleles with KIR2DL2 and KIR2DL3 alleles. The YTS NK cell line transfected
with KIR2DL3 (YTS-2DL3), represents a second approach to examining an individual
KIR receptor. The YTS NK line itself, does not express any endogenous KIR or NKG2-
family receptors. In order to investigate the interaction of different KIR2DL2 and
KIR2DL3 alleles with HLA-C, KIR2DL2 or KIR2DL3 dependent clones and the YTS NK
cell line transfected with KIR2DL3*001, were tested for inhibition of cytotoxicity against
targets expressing the common C1-group and C2-group alleles including HLA-C*1402.
3.2 Materials and Methods
Detailed materials and methods relating to this chapter are described in chapter 2.
Class I HLA typing was performed on each NK donor by the Department of Clinical
Immunology and Immunogenetics, RPH and their full KIR genotype was determined by
myself.

Chapter 3
55
Table 3.1 NK Donor Class I HLA Typing
HLA-A HLA-B HLA-C NK Epitopes
Donor 1 A*03, 68 B*07, 14 C*07, 08 C1 Donor 2 nt nt nt Donor 3 A*02, 33 B*4601, 5801 C*0102, 0302 C1 Bw4 Donor 4 A*02, 1101 B*1501, 35 C*0303, 0401 C1 C2
Donor 2 was a HLA unknown donor from the Red Cross Blood Bank. Table 3.2 NK Donor KIR Genotype
KIR2DL1 KIR2DL2 KIR2DL3 KIR3DL1 KIR2DS1 KIR2DS2 KIR2DS3 KIR3DS1
Donor 1 + - + - + - NT NT Donor 2 + - + + - - - - Donor 3 + + + + - - - + Donor 4 + + - + + + + +
KIR2DS3 and KIR3DS1 typing of Donor 1 was not performed 3.3 Results
3.3.1 Selection of NK Clones
NK clones were generated from several individuals in order to find NK clones
expressing KIR2DL2 or KIR2DL3 as their only inhibitory receptor. Such NK clones
should be alloreactive towards targets not expressing the C1 epitope and be non-lytic
towards targets expressing the C1 epitope. This section outlines the selection and
characterisation of NK clones from four donors (donors 1-4) three of which have at
least one C1 positive HLA-C allele and have KIR2DL2 and/or KIR2DL3 in their KIR
genotype.
Alloreactive NK clones from each donor were screened by testing for cytotoxicity
against a panel of BLCL targets with different C1/C2 epitope expression in the four-
hour 51Cr-release assay. On some occasions, NKG2A-positive clones were excluded
by flow cytometry prior to the 51Cr-release assay. This was due to the fact that all BLCL
used in the screening panel would be expected to express HLA-E, the ligand for the

Chapter 3
56
inhibitory receptor NKG2A. It might therefore be expected that any NK cell clone
expressing NKG2A would be inhibited by all BLCL targets and therefore could not be
used to study the interaction of KIR with HLA-C. Therefore NK clones were screened
for NKG2A expression and positive NK clones were discarded.
All NKG2A negative NK clones were screened against a panel of four BLCL in the 4-
hour 51Cr-release assay at an E:T ratio of 1:1 (Table 3.3). An NK clone was classified
as alloreactive if it was able to lyse the 721.221 cell line (relative specific lysis > 60%),
lyse at least one of the other targets (relative specific lysis > 20%) and was inhibited by
one of the other targets (relative specific lysis < 10%). Following detection of NK
alloreactivity, flow cytometry was used to determine the expression of CD158a
(KIR2DL1/KIR2DS1), CD158b (KIR2DL2/KIR2DL3/KIR2DS2) and KIR3DL1. Receptor
expression was then correlated with the cytotoxicity pattern.
Table 3.3 Class I HLA Typing of Target Cell Panel Used To Screen NK Clones
Target Cell HLA-A HLA-B HLA-C NK Epitopes 721.221 - - - - (IHW 9034) A*0301 B*0702 C*0702 C1 (IHW 9019) A*3002 B*1801 C*0501 C2 (IHW 9004) A*0201 B*2705 C*0102 C1, Bw4
3.3.1.1 Characterisation of Clones from Donor 1
Over 100 NK clones from donor 1 were screened for NKG2A expression by flow
cytometry. Those clones that were negative for NKG2A were tested against the panel
of BLCL target cells in the four-hour 51Cr release assay at an E:T ratio of 1:1. Donor 1’s
HLA type only included one NK epitope, C1, and therefore was expected to generate
only KIR2DL3 dependent NK clones. Nine NK clones were negative for NKG2A and
four of these clones had a cytotoxicity pattern consistent with KIR2DL3 dependence.
That is, they were inhibited by BLCL targets expressing the C1 epitope and lysed BLCL
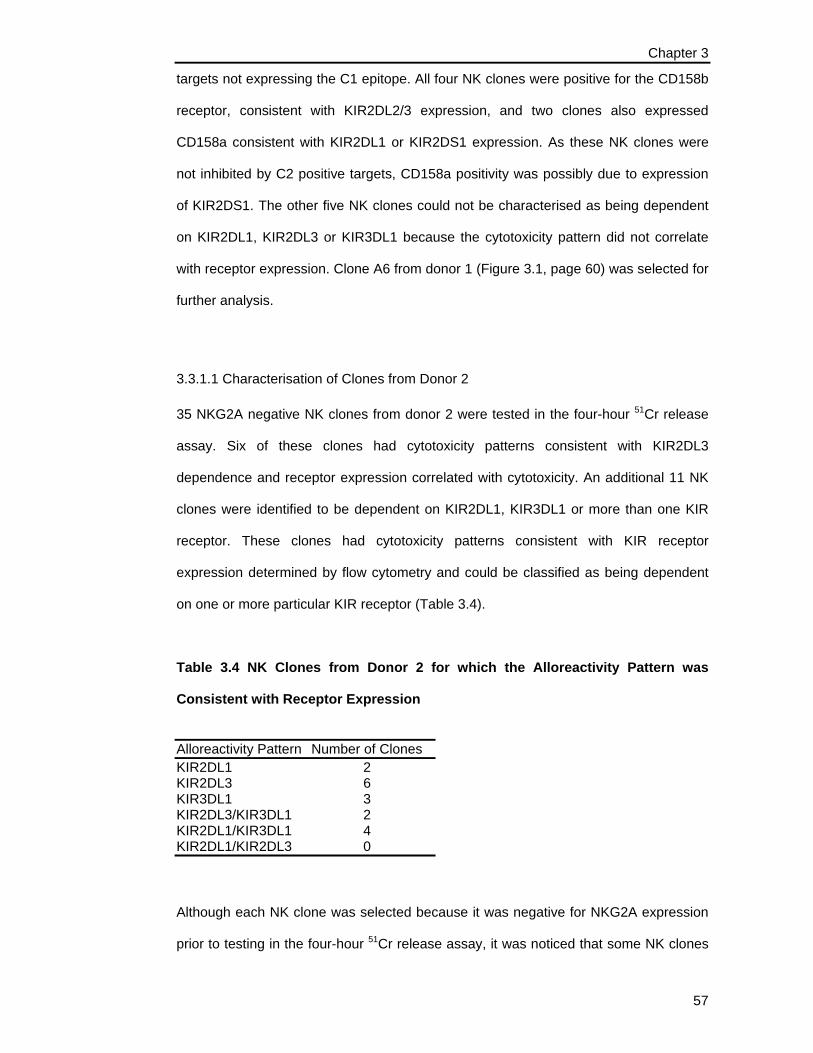
Chapter 3
57
targets not expressing the C1 epitope. All four NK clones were positive for the CD158b
receptor, consistent with KIR2DL2/3 expression, and two clones also expressed
CD158a consistent with KIR2DL1 or KIR2DS1 expression. As these NK clones were
not inhibited by C2 positive targets, CD158a positivity was possibly due to expression
of KIR2DS1. The other five NK clones could not be characterised as being dependent
on KIR2DL1, KIR2DL3 or KIR3DL1 because the cytotoxicity pattern did not correlate
with receptor expression. Clone A6 from donor 1 (Figure 3.1, page 60) was selected for
further analysis.
3.3.1.1 Characterisation of Clones from Donor 2
35 NKG2A negative NK clones from donor 2 were tested in the four-hour 51Cr release
assay. Six of these clones had cytotoxicity patterns consistent with KIR2DL3
dependence and receptor expression correlated with cytotoxicity. An additional 11 NK
clones were identified to be dependent on KIR2DL1, KIR3DL1 or more than one KIR
receptor. These clones had cytotoxicity patterns consistent with KIR receptor
expression determined by flow cytometry and could be classified as being dependent
on one or more particular KIR receptor (Table 3.4).
Table 3.4 NK Clones from Donor 2 for which the Alloreactivity Pattern was
Consistent with Receptor Expression
Alloreactivity Pattern Number of Clones KIR2DL1 2KIR2DL3 6KIR3DL1 3KIR2DL3/KIR3DL1 2KIR2DL1/KIR3DL1 4KIR2DL1/KIR2DL3 0
Although each NK clone was selected because it was negative for NKG2A expression
prior to testing in the four-hour 51Cr release assay, it was noticed that some NK clones

Chapter 3
58
up-regulated expression of NKG2A in culture in between initial cytotoxicity screening
and secondary testing but this did not influence their ability to lyse or be inhibited by
particular target cells. This suggested that screening out of NKG2A expression could
eliminate potentially useful alloreactive NK clones. Therefore in subsequent cloning
experiments flow cytometry for NKG2A was omitted and all clones were screened for
cytotoxicity. The KIR2DL2/3 dependent NK clone, L10 (Figure 3.1, page 60) from donor
2 was selected for further analysis.
3.3.1.1 Characterisation of Clones from Donor 3
132 NK clones from donor 3 were screened in the four-hour 51Cr release assay. NK
clones that had a KIR dependent cytotoxicity pattern were screened for KIR receptor
expression by flow cytometry and correlated with cytotoxicity pattern. Seven NK clones
were identified that were dependent on KIR2DL2/3. Four of these clones co-expressed
NKG2A. An additional 7 NK clones were also identified and their reactivity patterns are
summarised in Table 3.5. Clone J6 (Figure 3.1), from donor 3 was selected for further
analysis.
Table 3.5 NK Clones from Donor 3 for which the Alloreactivity Pattern was
Consistent with Receptor Expression
Pattern of Alloreactivity Number of Clones NKG2A PositiveKIR2DL1 0 0KIR2DL2/3 7 4KIR3DL1 2 2KIR2DL2/3/KIR3DL1 3 1KIR2DL1/KIR3DL1 2 1
3.3.1.1 Characterisation of Clones from Donor 4
The screening of NK clones from donor 4 was performed by another scientist in the
laboratory. Six NK clones were identified with an alloreactive pattern that appeared to
Chapter 3
59
be KIR2DL2 (the donor’s KIR genotype included KIR2DL2 but not KIR2DL3). These
clones were selected for further characterisation. Each NK clone was confirmed by
myself to be KIR2DL2 dependent by testing against the four target cells used for
donors 1-3 and were shown to be CD158b positive by flow cytometry. Clone C9 was
selected for further analysis (Figure 3.1).
3.3.2 Summary of NK Clones
NK clones from four individuals were characterised and KIR2DL2 or KIR2DL3
dependent NK clones were identified from each donor (Donors 1-4). Figure 3.1A shows
NKG2A and CD158 expression of each NK clone selected for further analysis. The
cytotoxicity pattern of each NK clone was consistent with an NK clone dependent on
KIR2DL2 or KIR2DL3 and this pattern was consistent with receptor expression
determined by flow cytometry (Figure 3.1B). Clone A6 also expressed CD158a
(KIR2DL1/KIR2DS1) but was not inhibited by the target expressing the C2 epitope.
Therefore it is more likely that it expressed KIR2DS1 rather than KIR2DL1.
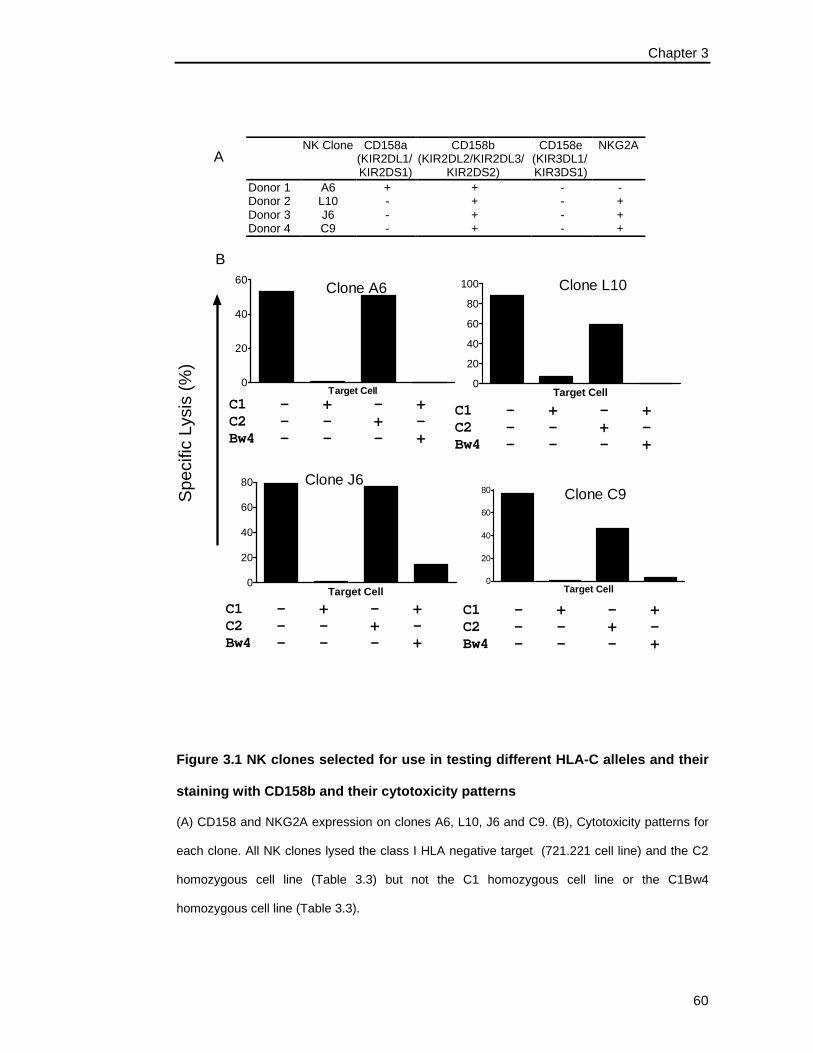
Chapter 3
60
Figure 3.1 NK clones selected for use in testing different HLA-C alleles and their
staining with CD158b and their cytotoxicity patterns
(A) CD158 and NKG2A expression on clones A6, L10, J6 and C9. (B), Cytotoxicity patterns for
each clone. All NK clones lysed the class I HLA negative target (721.221 cell line) and the C2
homozygous cell line (Table 3.3) but not the C1 homozygous cell line or the C1Bw4
homozygous cell line (Table 3.3).
Spe
cific
Lys
is (%
)
0
20
40
60
80
Target Cell
0
20
40
60
Target Cell 0
20
40
60
80
100
Target Cell
0
20
40
60
80
Target Cell
C1 - + - +C2 - - + -Bw4 - - - +
Clone A6
Clone C9Clone J6
Clone L10
A
B
NK Clone CD158a(KIR2DL1/KIR2DS1)
CD158b(KIR2DL2/KIR2DL3/
KIR2DS2)
CD158e(KIR3DL1/KIR3DS1)
NKG2A
Donor 1 A6 + + - -Donor 2 L10 - + - +Donor 3 J6 - + - +Donor 4 C9 - + - +
C1 - + - +C2 - - + -Bw4 - - - +
C1 - + - +C2 - - + -Bw4 - - - +
C1 - + - +C2 - - + -Bw4 - - - +

Chapter 3
61
3.3.3 KIR2DL3 mediated inhibition by the common C1-group and C2-group HLA-
C Alleles
To assess the interaction of different HLA-C alleles with KIR2DL3, a panel of BLCL
target cells was assembled representing all the common C1-group and C2-group HLA-
C alleles (Table 3.6).
Table 3.6 HLA-C Target Cell Panel
Lab Number HLA-A HLA-B HLA-C C1/C2 IHW 9004 0201 2705 0102 C1 IHW 9157 33 5801 0302 C1 IHW 9064 0217 1501 0303 C1 IHW 9069 0201 4001 0304 C1 IHW 9014 2601 0801 0701 C1 IHW 9034 0301 0702 0702 C1 IHW 9055 0301 1402 0802 C1 IHW 9011 0101 5201 1202 C1 IHW 9026 2601 3801 1203 C1 R05 307566X 11, 3101 5101 1402 C1 IHW 9051 2902 4403 1601 C1 IHW 9084 0201 4002 0202 C2 IHW 9068 0201 3501 0401 C2 IHW 9019 3002 1801 0501 C2 IHW 9046 0201 1302 0602 C2 IHW 9016 0204 5101 1502 C2 IHW 9043 0101 4101 1701 C2
Clone A6 (donor 1) and the NK cell line YTS, transfected with KIR2DL3, were selected
for screening against the target cell panel in the four-hour 51Cr-release assay. Clone A6
was selected due to large cell numbers of this clone. The YTS-2DL3 cell line was
selected due to it having expanded sufficiently that cell numbers were not limited and
experiments could be easily repeated. Since the chromium release assay may be
influenced by the fragility of the target cell, specific lysis of a target cell may vary from
cell to cell as a function of fragility rather than KIR:HLA-C interaction. Targets that are
inherently difficult to lyse may be misinterpreted as showing strong HLA-C mediated
inhibition of lysis. In order to derive a better measure of HLA-C mediated inhibition, the

Chapter 3
62
extent to which anti-CD158b blocking antibody increased lysis was used as a measure
of HLA-C mediated inhibition via KIR2DL3. Percentage inhibition was calculated as:
percentage inhibition = ((specific lysis with anti-CD158b - specific lysis with isotype
control)/specific lysis with anti-CD158b))*100
Figure 3.2 shows that clone A6 and YTS-2DL3 were not inhibited by interaction with
any of the C2-group alleles in panel 1. ie. had low percentage inhibition. For clone A6,
all C1-group alleles from panel 1 inhibited NK cell lysis with greater than 80%
percentage inhibition. For the YTS-2DL3 cell line however, inhibition differed amongst
the different C1 alleles. HLA-C*0302, -C*0701, -C*0702 and -C*1601 were all strong
inhibitors of NK cell cytotoxicity. HLA-C*0102, -C*0303, -C*0304 and -C*0802 were all
moderate inhibitors of NK cell cytotoxicity and, of the C1-group alleles, HLA-C*1402
was the poorest inhibitor. It is interesting to note that for clone A6, whilst HLA-C*1402
did strongly inhibit lysis (82%), it was nevertheless the weakest of all C1 alleles.

Chapter 3
63
Figure 3.2 Clone A6 and YTS-2DL3 differ in their interaction with HLA-C alleles
with the C1 epitope
Clone A6 and YTS-2DL3 were tested against the common C1- and C2 -group HLA-C alleles
(Table 3.6) in the four-hour 51Cr-release assay. Clone A6 was tested in triplicate wells. YTS-
2DL3 was also tested in triplicate wells on two different occasions and results for both occasions
are shown. Both clone A6 and YTS-2DL3 lysed all target cells expressing a C2-group allele.
Clone A6 was inhibited by all HLA-C alleles expressing the C1 epitope with percentage of
inhibition being greater then 80% with HLA-C*1402 being the weakest inhibitor at 82%.
Percentage inhibition greater than 100% occurred where specific lysis of the isotype control was
lower than the background. YTS-2DL3 was inhibited equally well by HLA-C*0302, HLA-C*0701,
HLA-C*0702 and HLA-C*1601 and was not inhibited at all by HLA-C*1402. YTS-2DL3 was
moderately inhibited by HLA-C*0102, HLA-C*0303, HLA-C*0304 and HLA-C*0802.
0102 0302 0303 0304 0701 0702 0802 1202 1203 1402 1601 0202 0401 0501 0602 1502 17010
20
40
60
80
100
120
140
A6 (1st Panel)YTS-2DL3 (1st Panel)
HLA-C
Perc
enta
ge In
hibi
tion
C1 C2

Chapter 3
64
The different levels of inhibition of YTS-2DL3 may have been due to differences
between the different HLA-C alleles or other unidentified ligands that differed between
targets. Therefore a second set of C1-group HLA-C alleles was assembled to test the
reproducibility of the different levels of inhibition (Table 3.7).
Table 3.7 HLA-C Target Cell Panel 2
Lab Number HLA-A HLA-B HLA-C C1/C2 IHW 9141 24 54 01 C1 IHW 9156 33 5801 0302 C1 IHW 9099 021701 1501 0303 C1 IHW 9098 3101 4001 0304 C1 IHW 9088 0101 0801 0701 C1 IHW 9065 0301 0702 0702 C1 IHW 9049 3301 1405 0802 C1 IHW 9142 2402 5201 1202 C1 IHW 9008 2501 1801 1203 C1 IHW 9053 3303 4403 1403 C1 IHW 9027 2902 4403 1601 C1
Unfortunately, there were not enough cells from clone A6 to test against this second
target cell panel. Clone J6, from donor 3, was therefore tested alongside YTS-2DL3
against the second HLA-C panel and against the C2-group HLA-C alleles. Clone J6
was also tested against the HLA-C*1402 target from panel 1 (Table 3.6). Figure 3.3
shows that both clone J6 and YTS-2DL3 were not inhibited through interaction with any
of the C2-group alleles in panel 1. Like clone A6, clone J6 was inhibited by all C1-group
alleles from panel 2 with greater than 75% inhibition. There was again variation
amongst the percentage inhibition by different C1 alleles for the YTS-2DL3 cell line.
HLA-C*0302, -C*0701, -C*0702 and –C*1601 were again shown to be strong inhibitors.
HLA-C*0303, -C*0304 and –C*0802 were shown again to be moderate inhibitors. The
fact that targets that had the same HLA-C alleles in panel 1 and panel 2 gave similar
levels of inhibition suggested that it was the HLA-C allele that was responsible for the
differing levels of inhibition. YTS-2DL3 was not tested against HLA-C*1402 again, but
its closest related allele, HLA-C*1403 was tested against both clone J6 and YTS-2DL3.
HLA-C*1403 inhibited clone J6, but was the poorest inhibitor for YTS-2DL3.

Chapter 3
65
Figure 3.3 Pattern of Inhibition is Reproduced with a second panel of C1-group
HLA-C alleles
Clone J6 (donor 3) and YTS-2DL3 were tested in triplicate against the second panel of C1-
group HLA-C alleles (Table 3.7) and the C2-group HLA-C alleles from panel 1 (Table 3.6) in the
four-hour 51Cr-release assay. YTS-2DL3 was tested on two occasions and results for both
occasions shown. Both Clone J6 and YTS-2DL3 lysed targets expressing the C2 epitope. Clone
J6 was inhibited by all C1-group HLA-C alleles with percentage inhibition greater than 75%
similar to clone A6. YTS-2DL3 was strongly inhibited by target cells expressing HLA-C*0302, -
C*0701 and -C*0702 from the second panel and moderately inhibited by HLA-C*0303, -C*0304,
-C*0802 and –C*1203. HLA-C*1403, the closest related allele to HLA-C*1402, weakly inhibited
YTS-2DL3.
0102 0302 0303 0304 0701 0702 0802 1202 1203 1402 1403 1601 0202 0401 0501 0602 1502 17010
20
40
60
80
100
120
140
J6 (2nd Panel)YTS-2DL3 (2nd Panel)
HLA-C
Perc
enta
ge In
hibi
tion
C1 C2
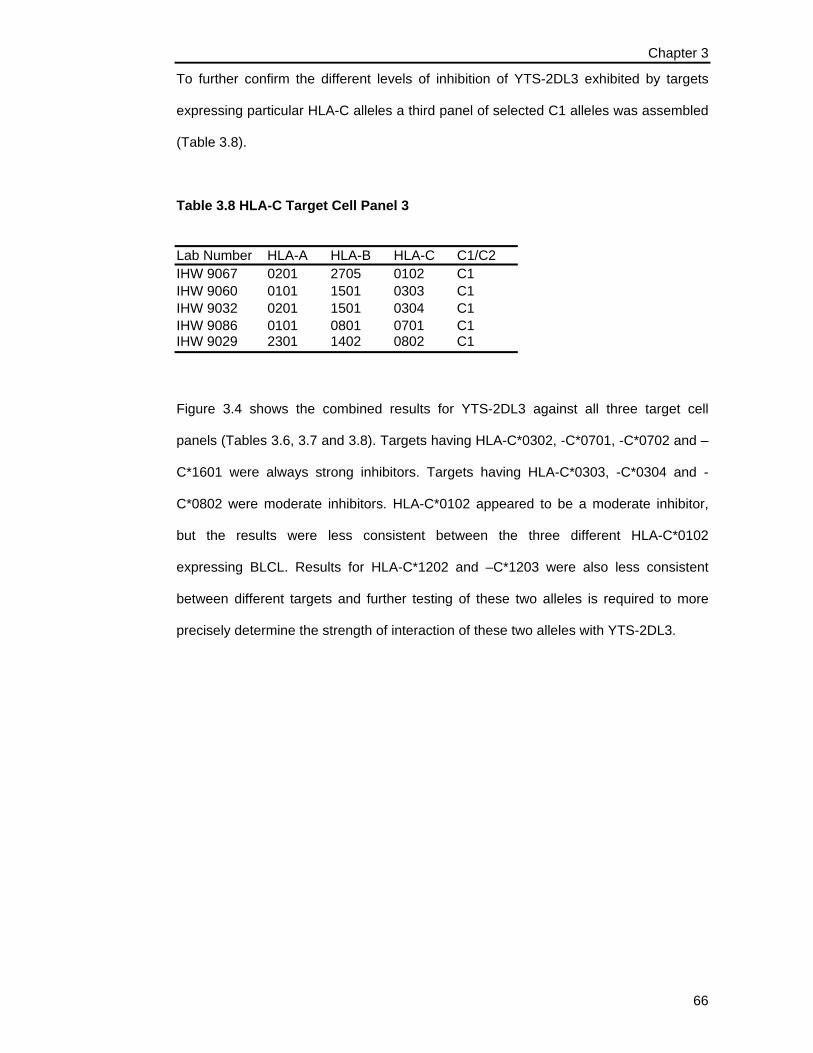
Chapter 3
66
To further confirm the different levels of inhibition of YTS-2DL3 exhibited by targets
expressing particular HLA-C alleles a third panel of selected C1 alleles was assembled
(Table 3.8).
Table 3.8 HLA-C Target Cell Panel 3
Lab Number HLA-A HLA-B HLA-C C1/C2 IHW 9067 0201 2705 0102 C1 IHW 9060 0101 1501 0303 C1 IHW 9032 0201 1501 0304 C1 IHW 9086 0101 0801 0701 C1 IHW 9029 2301 1402 0802 C1
Figure 3.4 shows the combined results for YTS-2DL3 against all three target cell
panels (Tables 3.6, 3.7 and 3.8). Targets having HLA-C*0302, -C*0701, -C*0702 and –
C*1601 were always strong inhibitors. Targets having HLA-C*0303, -C*0304 and -
C*0802 were moderate inhibitors. HLA-C*0102 appeared to be a moderate inhibitor,
but the results were less consistent between the three different HLA-C*0102
expressing BLCL. Results for HLA-C*1202 and –C*1203 were also less consistent
between different targets and further testing of these two alleles is required to more
precisely determine the strength of interaction of these two alleles with YTS-2DL3.

Chapter 3
67
Figure 3.4 C1-group HLA-C alleles differ in their ability to inhibit YTS-2DL3
The YTS-2DL3 cell line was tested against three panels of target cells representing the common
C1-group HLA-C alleles. Duplicate cell lines expressing HLA-C*0302, -C*0701, -C*0702, -
C*1601 demonstrate that these alleles all strongly inhibited YTS-2DL3. Three sets of cell lines
expressing either HLA-C*0102, -C*0303, -C*0304 or –C*0802 were tested and all moderately
inhibited lysis however the results for the three HLA-C*0102 cell lines were less consistent.
Both HLA-C*1402 and -C*1403 weakly inhibited lysis.
0102 0302 0303 0304 0701 0702 0802 120202 1203 1402 1403 16010
20
40
60
80
100
120
140
1st Panel2nd Panel
3rd Panel
HLA-C Allele
Perc
enta
ge In
hibi
tion

Chapter 3
68
3.3.4 HLA-C*1402 Inhibits NK Cells From Some Donors
Both NK clones, A6 and J6, were equally well inhibited by all C1 alleles, whereas the
YTS-2DL3 cell line was inhibited to different degrees by different C1 targets. To
determine whether the behaviour of YTS-2DL3 was an artefact of a transfected cell line
or whether other examples of NK clones might also behave this way, two additional NK
clones (clones L10 from donor 2 and C9 from donor 4) were tested in the four-hour 51Cr
release assay against a target expressing a C1-group allele that strongly inhibited all
NK cells (HLA-C*0702) and a target cell expressing HLA-C*1402. All NK clones and
YTS-2DL3 were inhibited by the HLA-C*0702 target and inhibition was reversed by
addition of anti-CD158b (Figure 3.5). HLA-C*1402 poorly inhibited the YTS-2DL3 cell
line as previously shown and was also found to poorly inhibit clone C9 from donor 4.
Addition of anti-CD158b resulted in only weak reversal of inhibition for clone C9 and
YTS-2DL3 (Figure 3.5B). However, clone A6, L10 and J6 were all inhibited through
interaction with HLA-C*1402 and inhibition was reversed by addition of anti-CD158b.

Chapter 3
69
Figure 3.5 HLA-C*0702 inhibits all NK clones whereas HLA-C*1402 only inhibits
some NK clones.
NK clones from 4 different individuals (donors 1-4) and YTS-2DL3 were incubated with BLCL
target cells expressing either HLA-C*0702 or HLA-C*1402 in the presence of
KIR2DL2/KIR2DL3 blocking antibody (anti-CD158b) or isotype control. (A) All NK clones and
YTS-2DL3 were inhibited by HLA-C*0702 and inhibition was reversed by addition of anti-
CD158b. (B), NK clones, A6, L10 and J6 (donors 1-3) were inhibited by HLA-C*1402 and this
was reversed by addition of anti-CD158b. NK clones C9 (donor 4) and the YTS-2DL3 cell line
were weakly bound to HLA-C*1402 with a slight increase in specific lysis with addition of anti-
CD158b.
YTS-2DL3 Clone A6 Clone L10 Clone J6 Clone C9-10
0
10
20
30
40
50
60 isotype control anti-CD158b
NK Cell Effector
Spe
cific
Lys
is (%
)
YTS-2DL3 Clone A6 Clone L10 Clone J6 Clone C9-10
0
10
20
30
40
50
60 isotype control anti-CD158b
NK Cell Effector
Spe
cific
Lys
is (%
)
A
B
HLA-C*0702 Target
HLA-C*1402 Target

Chapter 3
70
3.3.5 HLA-C*1402 only inhibits NK cells expressing KIR2DL3*002
The survey of targets with different HLA-C alleles and the further investigation of HLA-
C*1402 demonstrated that different NK cells expressing CD158b may not interact with
HLA-C in the same way. To determine if polymorphisms within the KIR gene can
distinguish between NK clones inhibited or not inhibited by HLA-C*1402, mRNA was
extracted from each clone and YTS-2DL3. KIR2DL2 or KIR2DL3 cDNA was amplified
(Figure 3.6) from the mRNA using a generic KIR2D forward primer and a KIR2DL2 or
KIR2DL3 specific reverse primer. Each cDNA PCR product was sequenced to
determine which allele of KIR2DL2 or KIR2DL3 each NK clone transcribed. Clones A6,
L10 and J6, which were all inhibited by HLA-C*1402, all transcribed KIR2DL3*002. The
KIR2DL3 expressed by the YTS cell line was KIR2DL3*001 and clone C9 transcribed
KIR2DL2*001. These results were consistent with the KIR gene repertoires of the
donors as donors 1-3 all had KIR2DL3 while donor 4 had KIR2DL2 and not KIR2DL3.
Figure 3.6 Amplification of KIR2DL2 or KIR2DL3 cDNA from each clone
cDNA was amplified from YTS-2DL3 (lane 1), clones A6 (lane 2), L10 (lane 3) and J6 (lane 4)
using full-length KIR2DL3 primers resulting in the expected 1044bp product. cDNA was
amplified from clone C9 (donor 4) using full length KIR2DL2 primers resulting in the expected
1047bp product.
In order to determine whether the alleles that were inhibited by HLA-C*1402 shared a
polymorphism that was not present in alleles that were not inhibited, the amino acid
sequences were aligned (Table 3.9).
1044b
1 2 31047b
1

Chapter 3
71
Table 3.9 Amino Acid Differences between KIR2DL3*002, KIR2DL3*001 and KIR2DL2*001
Signal D1 D2 stem transmembrane cytoplasmic domain peptide
Inhibited by HLA-C*1402
Examples Tested
-13 16 35 148 199 208 216 225 240 248 254 260 266 268 282 297 312 319
KIR2DL3*002 yes 3 V P Q R T L E V L C V P V R A H T S KIR2DL3*001 no 1 V P Q R T P E V L C V P V R A R T S KIR2DL2*001 no 1 A R E C I P K I F S A S A S T R A F
The amino acid differences between KIR2DL3*002, KIR2DL3*001 and KIR2DL2*001 are shown. The position of each amino acid in the gene is also
shown. KIR2DL3*002 is separated from KIR2DL3*001 at amino acid 208 (bold) in the stem and amino acid 297 (bold) in the cytoplasmic domain.
KIR2DL2*001 is identical to KIR2DL3*001 at these positions.
Chapter 3
72
KIR2DL3*001 and KIR2DL3*002 differ at only two nucleotide positions one in the stem
and one in the cytoplasmic domain. KIR2DL2*001 differs from both KIR2DL3 alleles at
several amino acids, but shares the stem and cytoplasmic amino acids with
KIR2DL3*001 at positions 208 and 297, respectively. Thus, either amino acid 208
(stem) or 297 (cytoplasmic domain) which were shared by both alleles that were not
inhibited by HLA-C*1402 and differed in the allele that was inhibited, could explain the
difference in reactivity with HLA-C*1402.
3.3.6 Do HLA-C alleles that interact weakly with KIR2DL3*001 share amino acid
motifs?
Amino acid 80 in the α1 domain of HLA-C is the critical amino acid in determining
specificity for KIR2DL1 or KIR2DL2 and KIR2DL3. On the KIR molecule, specificity for
C1-group or C2-group HLA-C alleles is determined by the amino acid at position 44.
Neither of these positions would explain why, for example, HLA-C*1402 binds poorly to
KIR2DL3*001 because these positions are conserved in both KIR and HLA-C.
However there are other invariant amino acids in both HLA-C and KIR2DL2/3 that
contribute to KIR:HLA-C interaction (HLA-C amino acids - 69, 75, 145, 146 and 151)
and may determine differences between the different C1 alleles and KIR alleles.
However these amino acids are conserved in both HLA-C and KIR2DL2/3 and are
therefore unlikely to play a role in the differences seen in this study. Section 1.3.2 of
the Literature Review described the role of peptide in influencing KIR binding to HLA-C.
Amino acid residues 7 and 8 of the peptide are thought to be the most critical. In order
to determine whether polymorphisms within the peptide binding pockets could be partly
responsible for differences in HLA-C:KIR interaction, a comprehensive analysis
(Chelvanayagam, 1996) of the amino acids of HLA-C that make up the peptide binding
environment for residue 7 (Table 3.11) and 8 (Table 3.12) of the peptide was therefore
undertaken.

Chapter 3
73
Table 3.11 Residue 7 Binding Environment of Strong, Moderate and Low
Inhibiting HLA-C Alleles
Inhibition conferred by KIR2DL3*001
C* 73 77 97 114 116 133 147 152 155 156
Strong 0701 A S R D S W L A Q L Strong 0702 A S R D S W L A Q L Strong 0302 T S R D S W W E Q L Strong 1601 T S W D S C W A Q Q Moderate 0802 T S R N F W W E Q R Moderate 0303 T S R D Y W W E Q L Moderate 0304 T S R D Y W W E Q L Weak 1402 T S W D S W W E Q R Weak 1403 T S W D S W W E Q R
Table 3.12 Residue 8 Binding Environment of Strong, Moderate and Low
Inhibiting HLA-C Alleles
Inhibition conferred by KIR2DL3*001
C* 73 77 80 97 143 147
Strong 0701 A S N R T L Strong 0702 A S N R T L Strong 0302 T S N R T W Strong 1601 T S N W T W Moderate 0802 T S N R T W Moderate 0303 T S N R T W Moderate 0304 T S N R T W Weak 1402 T S N W T W Weak 1403 T S N W T W
Examination of both groups of amino acids reveals no amino acids unique to the
different inhibitory levels of C1-group HLA-C alleles although the combined peptide 7
and peptide 8 binding environments of HLA-C*1402 and HLA-C*1403 are identical to
each other and not shared with any other allele. Therefore it is more likely that a
combination of polymorphisms confer high, moderate and low binding to KIR2DL3.

Chapter 3
74
3.4 Discussion
Despite extensive polymorphism within the HLA-C locus, only one polymorphic
position, amino acid 80, determines HLA-C specificity for KIR2DL1 or KIR2DL2 and
KIR2DL3. However this study suggests that other positions may influence the
interaction between HLA-C and KIR. KIR2DL2 and KIR2DL3 dependent NK clones
were generated from donors who express the C1 epitope and these clones were used
to test the ability of all the common HLA-C alleles to inhibit NK cell cytotoxicity via
these receptors. The data confirmed a previous report by Colonna and colleagues that
HLA-C*1402 was a poor C1 ligand. However, the data in this thesis show that this was
the case for KIR2DL3*001 and KIR2DL2*001, but not for KIR2DL3*002. As was
expected, HLA-C alleles with the C2 epitope did not inhibit any KIR2DL3 or KIR2DL2
dependent NK cells. In addition to the different reactivities of KIR2DL3*001 and
KIR2DL3*002 with HLA-C*1402, this study also provided evidence that these two
alleles interact differently with other HLA-C alleles. All the common C1-group alleles
inhibited cytotoxicity of NK cells expressing KIR2DL3*002 to a relative uniform degree
whereas different HLA-C alleles differed in their level of inhibition of the YTS-2DL3*001
cell line. Consistent results with multiple examples of each BLCL target expressing
particular HLA-C alleles suggest that the differences observed are more likely to be
due to the C1-group allele expressed rather than other differences between the BLCL.
It is possible the HLA-C expression is lower for alleles that showed weak inhibition. As
there are no monoclonal antibodies specific only for HLA-C this could not be tested
directly. However, since NK clones expressing KIR2DL3*002 are inhibited uniformly by
all C1-group HLA-C alleles this explanation seems unlikely.
The structures of C1-group HLA-C alleles in complex with KIR2DL2, of C2-group HLA-
C alleles in complex with KIR2DL1, and the structures for the receptors KIR2DL3 and
KIR2DL1 alone have been solved by crystallography (Fan et al, 1997; Maenaka et al,
1999; Boyington et al, 2000; Fan et al, 2001). The two-immunoglobulin domains of the

Chapter 3
75
KIR molecules are important in binding to HLA-C and polymorphisms within these
regions could result in differential binding. The two most common KIR2DL3 alleles,
KIR2DL3*001 and KIR2DL3*002, differ at two amino acids: one in the stem region and
one in the cytoplasmic domain. The amino acid at these positions are shared with
KIR2DL3*001 and KIR2DL2*001 both of which interact poorly with HLA-C*1402.
Neither of these would be expected to have a major influence on KIR binding to HLA-C.
However the data in this study suggests that these alleles differ in their ability to bind to
HLA-C*1402. When analysing the crystal structure of KIR2DL1, Fan and colleagues
generated two structures: one comprised of amino acids forming the D1 and D2
domains alone (amino acids 1-200) and one comprised of amino acids forming the D1,
D2 and the stem (amino acids 1-224). They reported an influence of the stem on ligand
binding with higher affinity binding for structures that included the stem. It was
suggested that the stem region improved binding to HLA-C by stabilising dimerisation
of the KIR receptor. KIR2DL3*002 has a leucine at amino acid 208 in the stem region
and KIR2DL3*001 and KIR2DL2*001 have a proline at the same position. Proline, a
relatively small amino acid, contains an imino group rather than an amino group and
thus can not easily substitute for other amino acids. Proline is often found in very tight
turns in protein structure and can introduce kinks into alpha helices (Betts and Russell,
2003). Leucine prefers to be buried in hydrophobic cores and is rarely involved in
protein function. It is uncertain whether a proline at amino acid 208 of the stem region
would alter the ability of KIR2DL3*001 and KIR2DL2*001 to interact with HLA-C.
However, it is possible that it alters the structure of the stem region such that when the
receptor binds to HLA-C the overall structure is weaker than for KIR2DL3*002.
Inhibitory KIR contain two ITIMs in their cytoplasmic domain and are phosphorylated
upon engagement with class I HLA molecules thereby delivering an inhibitory signal
(Burshtyn et al, 1996). Amino acid 297 sits between the ITIMs and is not directly
involved in signalling. Although the possibility that a histidine-arginine substitution at

Chapter 3
76
this position could affect ligand binding cannot be excluded, it seems less likely than
the leucine-proline substitution in the stem region.
Final proof of the importance of this position will require site-directed mutagenesis. This
was attempted during this thesis but successful transfection of the mutant construct
into YTS could not be achieved. Site-directed mutagenesis of the two positions will
need to be performed and the resulting construct transfected into the YTS cell line.
After generating stable cell lines expressing wild-type and mutant KIR2DL3, all
transfected cell lines would be tested against the panel of C1-group and C2-group
alleles in the chromium release assay to determine the effect of each mutation.
HLA-C*1402 was also a poor ligand for KIR2DL2*001. KIR2DL2*001 shares both the
stem and cytoplasmic domain polymorphisms with KIR2DL3*001. Therefore it is
possible that KIR2DL2*001, like KIR3DL1*001, will also show interactions of different
strengths with other C1-group HLA-C alleles, but this requires further investigation.
As not all C1-group alleles are poor ligands for KIR2DL3*001 (and KIR2DL2*001) it is
unlikely that the polymorphisms within the KIR allele are the only positions involved in
poor KIR:HLA-C interaction. Rather, the poor interaction is likely due to a combination
of polymorphisms within both the KIR2DL3*001 (and KIR2DL2*001) and HLA-C alleles.
As described in 3.3.7, the amino acids involved at the KIR:HLA-C interface are
conserved in both genes, but the peptide bound may influence the interaction.
Residues 7 and 8 are the most critical peptide amino acids as KIR receptors directly
contact both (Boyington et al, 2000). Particular amino acids of the HLA-C molecule
make up the binding environment for P7 and P8 and this environment is highly
polymorphic (Chelvanayagam,1996). The C1 alleles were divided into strong, moderate
and weak inhibitors and the amino acids comprising the peptide binding environments
were examined. There were no polymorphisms that could separate the three groups.
This suggests that for these peptide binding environments to influence and result in

Chapter 3
77
differing KIR:HLA-C interaction it is through a group of polymorphisms within HLA-C
rather than a single one. This preliminary data would suggest that polymorphic
differences within both KIR and HLA-C are responsible for the differing levels of
KIR:HLA-C interaction.
As HLA-C*1402 and HLA-C*1403 do not appear to act as ligands for KIR2DL3*001 or
KIR2DL2*001, it could be hypothesised that donors who express one of these KIR
alleles and HLA-C*1402 or –C*1403 as their only C1-group HLA-C allele may not be
able to generate very many NK clones dependent on KIR2DL2 or KIR2DL3. Donors
who expressed either HLA-C*1402 or HLA-C*1403, which is more common in
Japanese populations, as their only C1-group HLA-C allele were sought to determine if
they can generate alloreactive NK clones dependent on KIR2DL2/3. Two donors were
selected however blood could only be obtained from one and after NK cell isolation, the
NK cells failed to expand and therefore could not be tested for their ability to generate
KIR2DL2 or KIR2DL3 dependent NK clones.
The data in this chapter suggests that different HLA-C alleles differ in their ability to
inhibit different alleles of KIR2DL2 and KIR2DL3. It is possible that the apparent
correlation of HLA-C interaction with the different KIR alleles is purely coincidental.
Other receptors expressed by the clones cannot be ignored as possible reasons for the
differences. Although NKG2A appeared to not influence NK alloreactivity in the
screening assay, it is possible that NKG2A may influence reactivity with different target
cells. However, this seems unlikely as HLA-E is expressed by all BLCL used in this
study and therefore uniform inhibition would be expected if NKG2A was functional on
the cell and this was not seen as all targets expressing C2-group HLA-C alleles were
lysed. There may be other receptors expressed by these NK clones or the YTS cell line
that are currently not known that may influence lysis of target cells with particular HLA.
Chapter 3
78
The common HLA-C alleles were analysed for their ability to inhibit two NK clones
expressing KIR2DL3*002 and the YTS cell line transfected with KIR2DL3*001.
Therefore the comparison between the KIR2DL3 alleles was not strictly controlled. It
will be important to replicate this data using NK clones expressing KIR2DL3*001. A
similar screening process also needs to be conducted with NK clones expressing
KIR2DL2 to determine if KIR2DL2 interacts with HLA-C alleles similarly to KIR2DL3. It
will also be important to screen NK clones expressing KIR2DL1 against the C1 and C2
panels to determine if all C2 alleles act as appropriate ligands for KIR2DL1 and also
determine if any C1 alleles interact with KIR2DL1. These additional experiments will
provide important information needed to enable better identification of potential donor
and recipient pairs from HLA and KIR repertoires.

Chapter 4
79
Chapter 4
The Reactivity of Bw4-positive HLA-B and HLA-A Alleles with
KIR3DL1: Implications for Patient and Donor Suitability for
Haploidentical Stem Cell Transplants
Foley BA, De Santis D, van Beelen E, Lathbury LJ, Christiansen FT and Witt CS
Blood 2008 (In Press)
The work in this chapter has been submitted for publication in Blood. It has been
reproduced in whole with one alteration. The materials and methods section has been
simplified to include only the NK cell donors and cell lines used in this chapter. For
other methods refer to chapter 2.

Chapter 4
80
Chapter 4: The Reactivity of Bw4-positive HLA-B and HLA-A
Alleles with KIR3DL1: Implications for Patient and Donor
Suitability for Haploidentical Stem Cell Transplants
4.1 Introduction
Natural killer (NK) cell alloreactivity can be exploited in haploidentical haematopoietic
stem cell transplantation (HSCT) to improve graft survival, reduce graft versus host
disease and decrease leukaemic relapse (Ruggeri et al, 2002). Infusion of alloreactive
NK cells without stem cells has also been shown to result in haematological remission
in AML patients (Miller et al, 2005). NK cells lyse cells that have reduced expression of
class I HLA molecules. In an allogeneic setting, donor NK cells are activated by the
absence of donor (self) class I HLA molecules on recipient cells (Karre et al, 1986;
Ljunggren and Karre 1990), the absence of self-epitopes being detected by inhibitory
killer immunoglobulin-like receptors (KIR) on donor NK cells. HLA-C molecules with an
asparagine at amino acid 80 provide the C1 epitope for the KIR2DL2 and KIR2DL3
inhibitory receptors and those with a lysine at amino acid 80 provide the self-epitope,
C2, for the KIR2DL1 inhibitory receptor. The self-epitope of relevance to the KIR3DL1
receptor is the Bw4 epitope at amino acids 77 – 83 on some HLA-B alleles. All HLA-B
alleles have either the Bw4 or Bw6 epitope. NK cells from donors, whose HLA-B
alleles include the Bw4 epitope, lyse cells lacking the Bw4 epitope because such target
cells cannot supply the ligand for the NK inhibitory receptor KIR3DL1. However, it has
been reported (reviewed in Ruggeri et al, 2006) that only two thirds of donors with Bw4-
positive HLA-B alleles make NK clones that lyse Bw4-negative targets. Therefore,
selecting an NK or stem cell donor for a particular patient currently requires a lengthy,
labour intensive in vitro NK cloning procedure to confirm the donor has NK cells
alloreactive towards the patient (Ruggeri et al, 2002).

Chapter 4
81
It is not clear why some Bw4 positive donors cannot make NK clones that lyse Bw4
negative targets. A likely explanation in some cases is that a common allele of
KIR3DL1 (KIR3DL1*004) is not expressed at the cell surface (Pando et al, 2003).
However, a systematic examination of the ability of HLA-B alleles to bind to KIR3DL1
has not been undertaken. Amino acid 80 in the HLA-B protein critically determines
binding to KIR3DL1 (D'Andrea et al, 1995). Alleles with the Bw6 epitope have
asparagine (N) at this position and do not bind to KIR3DL1 while alleles with Bw4 have
either an isoleucine (I) or threonine (T) and are ligands for KIR3DL1. It has been
reported that alleles with an isoleucine (80I) are stronger ligands than alleles with a
threonine (80T) (Cella et al, 1994; Draghi et al, 2005) whilst other investigators have
noted differences within the Bw4 80I family of alleles (Gumperz et al, 1995) and
peptide-dependent differences in the binding of Bw4 tetramers to different KIR3DL1
variants (Thananchai et al, 2007). Several HLA-A alleles are also known to react with
anti-Bw4 antibodies but their ability to behave as a ligand for KIR3DL1 is controversial
(Cella et al, 1994; Gumperz et al, 1995; Thananchai et al, 2007). These studies utilised
HLA-bare EBV cell lines transfected with individual HLA alleles or tetramers loaded
with individual peptides to compare the effect of different alleles. A related question that
has not been addressed is whether donors with the different forms of Bw4 epitope are
all capable of producing NK clones that lyse cells lacking Bw4.
In order to improve the ability to select donors for haploidentical HSCT or NK cell
infusions based on HLA rather than NK cloning assays, we undertook a systematic
analysis of the ability of common HLA-B alleles and Bw4-positive HLA-A alleles to
inhibit KIR3DL1-dependent NK clones. In addition, we tested the ability of individuals
with Bw4-positive HLA-A alleles to produce KIR3DL1-dependent clones. As it is difficult
to know whether results from HLA-bare cells transfected with single HLA alleles, or
tetramers loaded with single peptides, accurately reflect the complex array of HLA
ligands presented to NK cells (in vivo), we chose to utilise EBV cell lines that express a
normal array of HLA antigens but which were homozygous for the HLA alleles of

Chapter 4
82
interest. Our results confirm that most, but not all, of the common Bw4-positive HLA-B
alleles are ligands for KIR3DL1. In addition, the status of the Bw4-positive HLA-A
alleles is clarified and we demonstrate that individuals with a Bw4-positive HLA-A allele
are able to generate KIR3DL1-dependent clones. These results have implications for
donor selection for haploidentical HSCT.
4.2 Materials and Methods
The materials and methods section has been simplified to include only the NK cell
donors and cell lines used in this chapter. For other methods refer to chapter 2.

Chapter 4
83
Table 4.1 HLA Class I and KIR3DL1 Allele Typing of NK Cell Donors
Donor HLA-A HLA-B Bw4/6 HLA-C C1/2 KIR3DL1 Typing KIR3DL1 Expression
1 0201, 2902 4403, 5703 4 0701, 1601 1 01501/017, 008 high 2 0201, 2601 0702, 3801 4,6 0702, 1203 1 002, 00101 high 3 0101, 2402 0801, 5109 4,6 0102, 0701 1 00501-like, 01502 high, low 4 0201, 3303 4601, 5801 4,6 0102, 0302 1 00501, 01502 high, low 5 1101 1301, 1501 4,6 0304, 0401 1,2 007, 01502 high, low 6 1101 1301, 1501 4,6 0304, 0401 1,2 00501, 007 high, low 7 0301, 3101 1302, 3501 4,6 0401, 0602 2 001/016, 002 high 8 0101, 0301 0801 6 0701 1 nt high 9 0201, 1101 1501, 3501 6 0303, 0401 1,2 nt low
10 0101, 2402 0801, 5501 6 0303, 0701 1 nt high
The KIR3DL1*005-like allele in donor 3 differs from KIR3DL1*005 by a valine to leucine substitution at amino acid 18 in the D0 domain. In all cases,
HLA alleles were assigned on the basis of sequencing of exons 2 and 3. In some cases, the assignment of class I HLA alleles is based on the most
common allele consistent with the sequence in exons 2 and 3 and alleles differing in other exons cannot be excluded. As the signal peptide of KIR3DL1
was not sequenced, KIR3DL1*01501 cannot be distinguished from KIR3DL1*017 in donor 1 and KIR3DL1*001 cannot be distinguished from
KIR3DL1*016 in donor 7. nt = not tested.
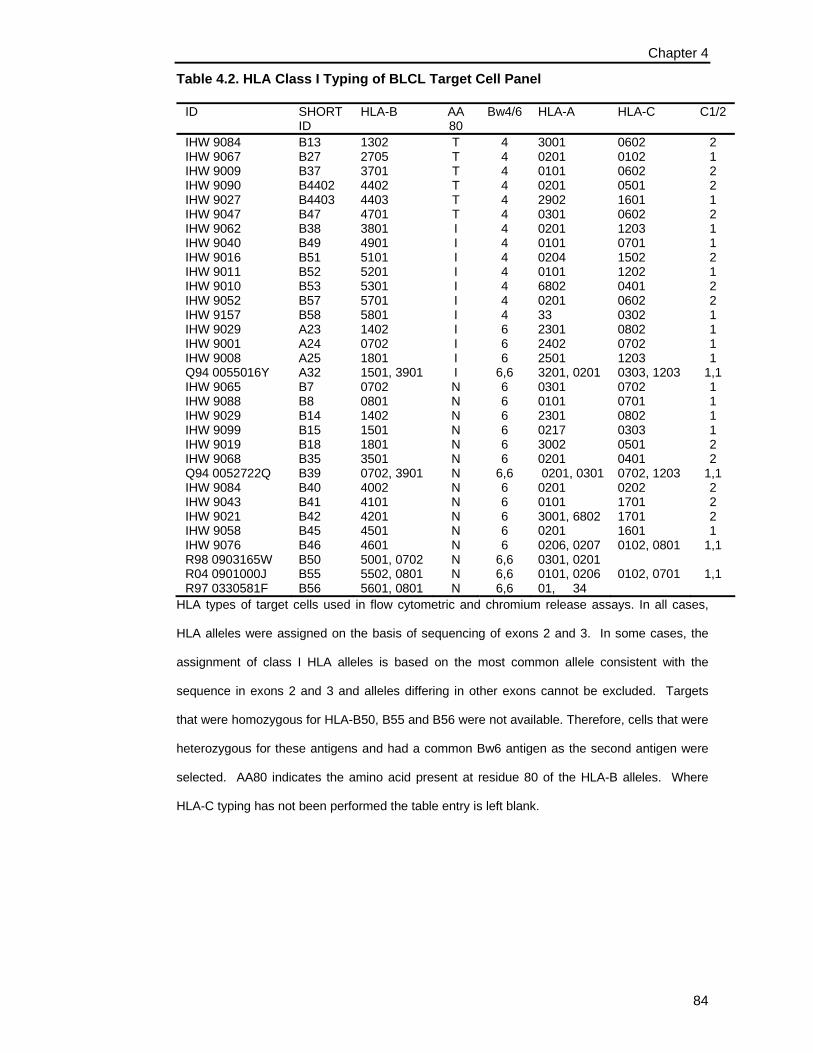
Chapter 4
84
Table 4.2. HLA Class I Typing of BLCL Target Cell Panel
ID SHORT ID
HLA-B AA 80
Bw4/6 HLA-A HLA-C C1/2
IHW 9084 B13 1302 T 4 3001 0602 2 IHW 9067 B27 2705 T 4 0201 0102 1 IHW 9009 B37 3701 T 4 0101 0602 2 IHW 9090 B4402 4402 T 4 0201 0501 2 IHW 9027 B4403 4403 T 4 2902 1601 1 IHW 9047 B47 4701 T 4 0301 0602 2 IHW 9062 B38 3801 I 4 0201 1203 1 IHW 9040 B49 4901 I 4 0101 0701 1 IHW 9016 B51 5101 I 4 0204 1502 2 IHW 9011 B52 5201 I 4 0101 1202 1 IHW 9010 B53 5301 I 4 6802 0401 2 IHW 9052 B57 5701 I 4 0201 0602 2 IHW 9157 B58 5801 I 4 33 0302 1 IHW 9029 A23 1402 I 6 2301 0802 1 IHW 9001 A24 0702 I 6 2402 0702 1 IHW 9008 A25 1801 I 6 2501 1203 1 Q94 0055016Y A32 1501, 3901 I 6,6 3201, 0201 0303, 1203 1,1 IHW 9065 B7 0702 N 6 0301 0702 1 IHW 9088 B8 0801 N 6 0101 0701 1 IHW 9029 B14 1402 N 6 2301 0802 1 IHW 9099 B15 1501 N 6 0217 0303 1 IHW 9019 B18 1801 N 6 3002 0501 2 IHW 9068 B35 3501 N 6 0201 0401 2 Q94 0052722Q B39 0702, 3901 N 6,6 0201, 0301 0702, 1203 1,1 IHW 9084 B40 4002 N 6 0201 0202 2 IHW 9043 B41 4101 N 6 0101 1701 2 IHW 9021 B42 4201 N 6 3001, 6802 1701 2 IHW 9058 B45 4501 N 6 0201 1601 1 IHW 9076 B46 4601 N 6 0206, 0207 0102, 0801 1,1 R98 0903165W B50 5001, 0702 N 6,6 0301, 0201 R04 0901000J B55 5502, 0801 N 6,6 0101, 0206 0102, 0701 1,1 R97 0330581F B56 5601, 0801 N 6,6 01, 34
HLA types of target cells used in flow cytometric and chromium release assays. In all cases,
HLA alleles were assigned on the basis of sequencing of exons 2 and 3. In some cases, the
assignment of class I HLA alleles is based on the most common allele consistent with the
sequence in exons 2 and 3 and alleles differing in other exons cannot be excluded. Targets
that were homozygous for HLA-B50, B55 and B56 were not available. Therefore, cells that were
heterozygous for these antigens and had a common Bw6 antigen as the second antigen were
selected. AA80 indicates the amino acid present at residue 80 of the HLA-B alleles. Where
HLA-C typing has not been performed the table entry is left blank.

Chapter 4
85
4.3 Results
4.3.1 KIR3DL1 Genotype of NK Cells
As different alleles of KIR3DL1 have high or low expression at the cell surface, we
determined the KIR3DL1 alleles and receptor expression pattern on 10 NK donors
(Table 4.1). To compare the behaviour of high and low expressing alleles two donors
with only high expression alleles and two donors heterozygous for high and low
expression alleles (donors 1, 2 and 3, 4 respectively in Table 4.1) were selected. Also,
as the high expressing allele in both donors 3 and 4 was the same (KIR3DL1*01502),
between-donor reproducibility could be assessed. All four donors had at least one
Bw4-positive HLA-B allele (Table 4.1). Interestingly, the low expression receptors in
donors 3 and 4 differed in their level of expression (Figure 4.1). This difference may be
due to the fact that the low expression receptor in donor 3 differed from the low
expression receptor encoded by KIR3DL1*005 in donor 4 by a valine to leucine
substitution at amino acid 18 in the D0 domain.

Chapter 4
86
Figure 4.1 Low level KIR3DL1 expression differs in two donors due to a
nonsynonymous mutation at nucleotide position 115 in exon 3 encoding the D0
domain of the KIR3DL1*005 allele.
NK cells from each donor were stained with anti-KIR3DL1 antibody (DX9) (solid lines) or isotype
control (IgG1) (dotted lines). KIR3DL1 surface expression correlated with KIR3DL1 allele typing,
with donors 1 and 2 having unimodal high level expression and donors 3 and 4 having bimodal
(high and low level) expression. The low level receptor expression differed between donors 3
and 4. Comparison of both KIR3DL1 sequences from donors 3 and 4 revealed a single
nonsynonymous nucleotide mutation at position 115 of the KIR3DL1*005 allele in donor 3.

Chapter 4
87
4.3.2 KIR3DL1 Dependent NK Cells Lyse Cells Lacking the Bw4 Epitope
KIR expression on polyclonally expanded NK cells has been demonstrated not to alter
the frequency of NK cells expressing particular KIR receptors (Draghi et al, 2005). In
order to detect NK cell cytotoxicity towards Bw4-negative targets mediated by
KIR3DL1-dependent clones, polyclonal NK cells from donors 1 to 4 were expanded by
in vitro culture and then incubated with BLCL targets expressing common HLA-B
alleles or the Bw4-positive HLA-A alleles A*2301, A*2402, A*2501 and A*3201 (see
Table 4.2). Cytotoxicity was measured by CD107a expression on KIR3DL1 (DX9)
positive, CD158b (KIR2DL2, KIR2DL3, KIR2DS2) negative NK cells. As all four NK
donors were homozygous for C1-group HLA-C alleles and a significant proportion of
KIR3DL1-positive NK cells co-expressed CD158b, the inhibitory receptor for the C1-
epitope, only KIR3DL1-positive, CD158b-negative cells were examined. KIR3DL1-
positive, CD158b-negative NK cells up-regulated CD107a when incubated with either
the class I HLA negative target (721.221-positive control) or targets homozygous for
the Bw6 epitope (Figure 4.2). Bw4-positive targets tended to inhibit CD107a
expression. Overall, there was little difference between the four donors in terms of the
target cells that showed greatest inhibition of CD107a expression. CD107a expression
was inhibited by all Bw4 expressing targets with four exceptions: those expressing
HLA-B*1302, HLA-B*5101, HLA-A*2301 and HLA-A*2501. There were some small
differences in the ability of the other Bw4 expressing targets to inhibit CD107a
expression but these differences did not relate to the presence of 80I or 80T alleles.

Chapter 4
88
NA
721
B13
B27
B37
B44
02B
4403
B47
B38
B49
B51
B52
B53
B57
B58
A23
A24
A25
A32 B7
B8
B14
B15
B18
B35
B39
B40
B41
B42
B45
B46
B50
B55
B56
0
20
40
60
80
KIR3DL1 high/high
NA
721
B13
B27
B37
B44
02B
4403 B47
B38
B49
B51
B52
B53
B57
B58
A23
A24
A25
A32 B7 B8 B14
B15
B18
B35
B39
B40
B41
B42
B45
B46
B50
B55
B56
0
20
40
60
80
KIR3DL1 high/high
NA
721
B13
B27
B37
B44
02B
4403
B47
B38
B49
B51
B52
B53
B57
B58
A23
A24
A25
A32 B
7B
8B
14B
15B
18B
35B
39B
40B
41B
42B
45B
46B
50B
55B
56
0
20
40
60
80
KIR3DL1 high KIR3DL1 low
NA
721
B13
B27
B37
B44
02B
4403
B47
B38
B49
B51
B52
B53
B57
B58
A23
A24
A25
A32 B
7B
8B
14B
15B
18B
35B
39B
40B
41B
42B
45B
46B
50B
55B
56
0
20
40
60
80
KIR3DL1 high KIR3DL1 lowP
erce
ntag
e of
KIR
3DL1
pos
itive
, 158
b ne
gativ
e ce
lls e
xpre
ssin
g C
D10
7a
Target Cells
80T
80T
80T
80T
80I
80I
80I
80I
Bw4Donor 1
Donor 4
Donor 3
Bw6
Donor 2

Chapter 4
89
Figure 4.2. CD107a expression by KIR3DL1-positive polyclonal NK cells is
inhibited by most Bw4-positive targets.
Polyclonally expanded NK cells from four donors (donors 1-4) were incubated alone (NA), with
a positive control, the class I negative BLCL 721.221 (721) and a range of Bw4 and Bw6
positive targets (Table 4.2) and CD107a expression was measured on KIR3DL1 positive,
CD158b negative NK cells. Donors 3 and 4 had NK cells which showed high or low expression
of DX9 and for each the percentage of CD107a positive cells amongst either the NK cells
bearing the high level (solid bars) or low level (open bars) of DX9 expression are shown. All
donors lysed the 721.221 cell line and all Bw6-homozygous (Bw4-negative) targets. All donors
were inhibited by most of the Bw4-positive targets except for targets B13, B51, A23 and A25.
For donor 3, the low level expression allele was less cytotoxic against Bw6 expressing targets
and not as well inhibited by most Bw4 expressing targets compared to the high expression
allele. By contrast for donor 4, the high and low level expression alleles behaved similarly.

Chapter 4
90
Of the two donors with high KIR3DL1 expression, donor 1 had a higher percentage of
NK cells expressing CD107a in response to Bw4-negative targets and therefore
appeared to better discriminate between Bw4-positive and negative targets. However,
this may simply reflect the fact that donor 1 had a higher proportion of NK cells
dependent on KIR3DL1 for inhibition than donor 2. The high expression KIR3DL1
receptor in donors 3 and 4 and the low expression allele (KIR3DL1*005) in donor 4
behaved in a similar way to NK cells in donor 1. However, in donor 3, NK cells with the
low expression KIR3DL1*005-like variant up-regulated CD107a relatively weakly in
response to Bw6 targets and were less completely inhibited by Bw4 targets such that
there was relatively poor discrimination between the Bw4 and Bw6 targets.
Interestingly, in this donor, those NK cells expressing the KIR3DL1*005-like variant
also exhibited less up-regulation of CD107a in response to the class I bare 721.221
cells than the NK cells expressing the KIR3DL1*01502 allele. These results suggest
that the poor discrimination between Bw4 and Bw6 targets exhibited by the NK cells
expressing the receptor encoded by the KIR3DL1*005-like variant, may be due to
these cells being relatively weakly armed rather than a smaller proportion being
KIR3DL1-dependent for inhibition. Donor 3 was particularly informative in terms of the
Bw4 alleles that are KIR3DL1 ligands. For almost all Bw4 targets, NK cells with the
high expression allele KIR3DL1*01502 were more strongly inhibited than NK cells with
the weakly expressed KIR3DL1*005-like variant. For each Bw6 target, NK cells with
the high expression allele KIR3DL1*01502 were less inhibited than NK cells expressing
the weakly expressed KIR3DL1*005-like variant. In this respect, HLA-B*1302, HLA-
A*2301 and HLA-A*2501, all behaved like Bw6 alleles, reinforcing the conclusion that
these alleles are not KIR3DL1 ligands. Interestingly, in donor 4, the only target that
appeared to discriminate between NK cells expressing KIR3DL1*01502 and
KIR3DL1*005 was the HLA-A*23 target. This suggests that some KIR3DL1 alleles
may provide exceptions to the more general rules.

Chapter 4
91
The ability of the different targets to inhibit CD107a expression on KIR3DL1 expressing
effectors could be related not so much to the affinity of the ligand but rather, differences
in the level of expression of the ligand on the various targets. Therefore the level of
Bw4 expression was checked by staining each target with an anti-Bw4 mAb. As shown
in Figure 4.3, the average CD107a expression induced on KIR3DL1-positive NK cells
was not related to the level of Bw4 expression on the target. The A23, A24 and A32
targets also stained strongly whereas the A25 target did not stain with the Bw4 mAb
and did not inhibit NK cell cytotoxicity despite being known to have the Bw4 motif.
However, this mAb also did not react with two additional cell lines with HLA-A25
indicating that this mAb does not react with the HLA-A25-associated Bw4 epitope. The
B51 target did have reduced HLA-B expression, which could explain the poor inhibition
mediated by this target. However, the B13 target, which was also poorly inhibitory, had
levels of Bw4 expression comparable with the other Bw4 expressing targets. Therefore,
reduced HLA-B expression was not responsible for its lack of inhibition. There was no
correlation between the level of Bw4 expression and ability to suppress CD107a
expression when the HLA-A*2501 and B*5101 targets were excluded (r = -0.13,
p=0.68).
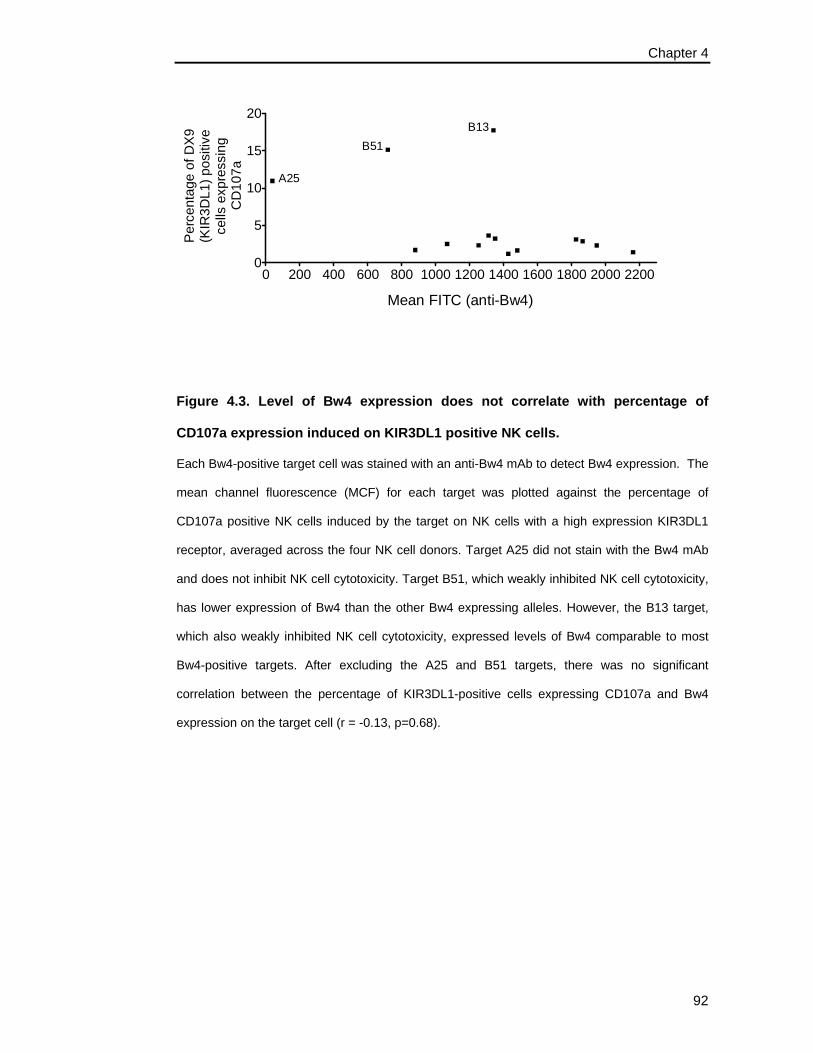
Chapter 4
92
Figure 4.3. Level of Bw4 expression does not correlate with percentage of
CD107a expression induced on KIR3DL1 positive NK cells.
Each Bw4-positive target cell was stained with an anti-Bw4 mAb to detect Bw4 expression. The
mean channel fluorescence (MCF) for each target was plotted against the percentage of
CD107a positive NK cells induced by the target on NK cells with a high expression KIR3DL1
receptor, averaged across the four NK cell donors. Target A25 did not stain with the Bw4 mAb
and does not inhibit NK cell cytotoxicity. Target B51, which weakly inhibited NK cell cytotoxicity,
has lower expression of Bw4 than the other Bw4 expressing alleles. However, the B13 target,
which also weakly inhibited NK cell cytotoxicity, expressed levels of Bw4 comparable to most
Bw4-positive targets. After excluding the A25 and B51 targets, there was no significant
correlation between the percentage of KIR3DL1-positive cells expressing CD107a and Bw4
expression on the target cell (r = -0.13, p=0.68).
0 200 400 600 800 1000 1200 1400 1600 1800 2000 22000
5
10
15
20
A25
B51B13
Mean FITC (anti-Bw4)
Per
cent
age
of D
X9
(KIR
3DL1
) pos
itive
cells
exp
ress
ing
CD
107a

Chapter 4
93
4.3.3 HLA-B*13 is not a KIR3DL1 ligand but HLA-B*5101 is
To confirm the lack of inhibition seen with the targets bearing HLA-B*1302 and HLA-
B*5101, additional examples of BLCL expressing B*1302 and B*5101, and one
expressing B*1301 (Figure 4.4A) were tested in the CD107a assay against NK cells
from donor 1. KIR3DL1-positive NK cells up-regulated CD107a when incubated with
either the positive control (721.221) or the Bw6 control (B8) as expected (Figure 4.4B).
The Bw4 control (B27) inhibited CD107a expression as expected. Both examples of
targets expressing HLA-B*1302 and the single example of a target expressing HLA-
B*1301 failed to inhibit CD107a expression. In contrast, the original HLA-B*5101 target
with reduced HLA-B expression (5101a) inhibited CD107a expression less strongly
than the two additional examples of B*5101 targets. The additional B*13 and B*5101
targets had HLA-B expression comparable to the other Bw4-positive targets as
determined by staining with the Bw4 mAb (data not shown). These data suggest that
the observation in relation to the original B51 target was due to reduced expression of
HLA-B*5101 on that target whereas HLA-B*13 appears to be a poor ligand for
KIR3DL1. Lack of inhibition of cytotoxicity by HLA-B*1302 was confirmed using NK
clones from donors 3 and 4 in a four hour chromium-release assay (Figure 4.4C). Two
KIR3DL1-positive clones (clone C3 with low KIR3DL1 expression from donor 4 and
clone D2 with high KIR3DL1 expression from donor 3) were tested. As shown in
Figure 4.4C, cytotoxicity of clones C3 and D2 against the class I negative cell line
(721.221) and a Bw6 control (B35) (Table 4.2) was not affected by blocking KIR3DL1
with DX9 antibody whereas inhibition of cytotoxicity by a Bw4 control (B57) (Table 4.2)
was reversed by blocking with DX9 (Fig 4.4C). Cytotoxicity against the two HLA-
B*1302 homozygous targets was relatively strong in the absence of blocking antibody
and only weakly enhanced in the presence of DX9, confirming that HLA-B*1302 is a
poor ligand for KIR3DL1.

Chapter 4
94
Donor 3
721.221 B35 B57 1302a 1302b0
20
40
60
80
100 Isotype controlAnti-KIR3DL1
Target Cell
Spec
ific
Lysi
s (%
)
Donor 4
721.221 B35 B57 1302a 1302b0
20
40
60
80
100 Isotype controlAnti-KIR3DL1
Target Cell
Spe
cific
Lys
is (%
)
NA72
1 B8B27
5101
a51
01b
5101
c13
02a
1302
b13
010
10
20
30
40
50
60 Donor 1
Target Cell
Perc
enta
ge o
f KIR
3DL1
posi
tive
cells
expr
essi
ng C
D10
7a
Lab Number Short ID HLA-B AA 80 HLA-A HLA-CIHW 9016 5101a 5101 I 0204 1502R05 0307566X 5101b 5101 I 1101, 3101 1402IHW 9045 5101c 5101 I 0216, 0301 0704, 1502IHW 9084 1302a 1302 T 3001 0602IHW 9093 1302b 1302 T 0201 0602R03 0242430X 1301 1301, 5501 T 0207, 1101 0102, 0304
B
C
A

Chapter 4
95
Figure 4.4. HLA-B*1302 and HLA-B*1301 do not inhibit cytotoxicity of KIR3DL1-
dependent NK cells.
(A) Polyclonally expanded NK cells from donor 1 were incubated with the class I HLA negative
cell line, 721.221, (positive control), a Bw6 control (B8, Table 4.2), a Bw4 control (B27, Table
4.2), two HLA-B*1302 targets, one HLA-B*1301 target and three HLA-B*5101 targets. (B)
CD107a expression was measured on KIR3DL1-positive, CD158b-negative NK cells incubated
with various target cells or alone (NA). CD107a expression was induced by the 721.221 cell line
and the Bw6 control (B8) and not by the Bw4 control (B27) as expected. All targets expressing
either HLA-B*1302 or HLA-B*1301 failed to inhibit CD107a expression. HLA-B*5101 expressing
targets inhibited CD107a expression. (C) Two KIR3DL1-positive NK clones (clone C3 from
donor 4 expressing the low expression KIR3DL1*005 allele and clone D2 from donor 3
expressing the high expression KIR3DL1*01502 allele were used in the four hour 51Cr release
assay against the class I negative cell line (721.221), a Bw6 control (B35, Table 4.2), a Bw4
control (B57, Table 4.2) and two HLA-B*1302 homozygous targets (Table 4A) to confirm lack of
inhibition through KIR3DL1. KIR3DL1 was blocked with anti-DX9 (KIR3DL1) (open bars) and
isotype control (IgG1) (solid bars). Both NK clones lysed 721.221 and the Bw6 control (B35).
Both NK clones were inhibited by the Bw4 control (B57) and inhibition was reversed in the
presence of anti-KIR3DL1 mAb. Neither clone was inhibited by either HLA-B*1302 target with
very little or no reversal of inhibition in the presence of the anti-KIR3DL1 mAb.

Chapter 4
96
4.3.4 HLA-A*2402 and HLA-A*3201 are ligands for KIR3DL1
Four HLA-A alleles react with anti-Bw4 antibodies: HLA-A*23, HLA-A*24, HLA-A*25
and HLA-A*32. When assessed in terms of the ability of target cells expressing these
alleles to inhibit CD107a expression of KIR3DL1 positive NK cells (Figure 4.2), HLA-
A*2402 and HLA-A*3201 were clearly KIR3DL1 ligands whilst HLA-A*2501 appeared
to have some weak inhibitory activity. HLA-A*2301 appeared devoid of inhibitory
activity particularly for NK cells expressing the high level allele (solid bars – Figure 4.2).
Gumperz et al (1995) were unable to show reversibility of HLA-A*24 mediated inhibition
of cytotoxicity using an anti-KIR3DL1 antibody. We therefore investigated the
reversibility of inhibition by HLA-A alleles in a chromium release assay with an NK
clone from donor 4 expressing the KIR3DL1*005 allele. As shown in Figure 4.5, the
HLA bare (721.221) and Bw6-negative control target (B8) were lysed and lysis was not
enhanced by blocking KIR3DL1. The Bw4 control target (B27) completely inhibited
lysis and inhibition was reversed substantially by blocking with mAb. The A24 and A32
targets provided just as effective inhibition as the B27 control and again, inhibition was
blocked by the mAb. In contrast, the A25 target inhibited lysis less effectively and
showed only slightly enhanced lysis after blocking KIR3DL1 suggesting that HLA-
A*2501 may have some weak binding to KIR3DL1. The A23 target provided
intermediate inhibition, which was substantially reversed by blocking the receptor.
Interestingly, in donor 4, A23 was the only target which showed a difference in CD107a
expression between the high and low allele expressing cells suggesting a difference in
the interaction of HLA-A*2301 with these two alleles.

Chapter 4
97
Figure 4.5 Inhibition through Bw4 expressing HLA-A alleles can be reversed by
addition of anti-KIR3DL1.
Clone C3 from donor 4 expressing the low allele KIR3DL1*005 was tested in a four hour 51Cr
release cytotoxicity assay against the class I negative cell line (721.221), a Bw6 control (HLA-
B*0801) (Table 4.2), a Bw4 control (HLA-B*2705) (Table 4.2) and targets expressing one of the
four Bw4 expressing HLA-A alleles, A23, A24, A25 and A32 (Table 4.2). KIR3DL1 was blocked
with either anti-KIR3DL1 antibody (DX9) (open bars) or isotype control (IgG1) (solid bars). Clone
C3 lysed both 721.221 and the Bw6 control, and inhibition was not enhanced by anti-KIR3DL1
antibody. Clone C3 was inhibited by the Bw4 control, the A24, A23 and A32 targets and this
inhibition was reversed by addition of anti-KIR3DL1 antibody. Clone C3 lysed the A25 target
and anti-KIR3DL1 antibody only weakly enhanced specific lysis.
721.221 B8 B27 A24 A23 A25 A32-200
20406080
100 Isotype control Anti-KIR3DL1
Target Cell
Spec
ific
Lysi
s(%
)
Donor 4 (Clone C3 - KIR3DL1*005)

Chapter 4
98
4.3.5 Donors who have HLA-B*1301 or B*1302 can make KIR3DL1 dependent NK
clones but these NK clones are infrequent
As HLA-B*1302 and HLA-B*1301 are poor ligands for KIR3DL1, we asked whether
donors who have HLA-B*13 as their only Bw4-positive allele, can generate KIR3DL1-
dependent NK clones capable of lysing Bw4 negative targets. Using the CD107a
assay, we tested the ability of four donors with the Bw4-positive alleles (donors 1-4,
Table 4.1), three donors with B*1301 or B*1302 as their only Bw4-positive allele
(Donors 5-7, Table 4.1) and two donors with only Bw6 positive alleles (donors 8 and 9,
Table 4.1) to generate KIR3DL1-dependent alloreactive NK clones. NK cells from each
donor were incubated alone, with 721.221, a target lacking only the Bw4 epitope (C1+,
C2+, Bw4-), a target lacking only the C1 epitope (C1-, C2+, Bw4+) and a target lacking
only the C2 epitope (C1+, C2-, Bw4+). KIR3DL1-positive, CD158a,b-negative cells
were selected and CD107a expression measured against the range of target cells.
Representative cytofluorograms of CD107a expression in the presence of 721.221 and
the Bw4-negative target are shown in Figure 4.6A.

Chapter 4
99
1 2 3 4 5 6 7 8 90
25
50
75
100
Donor
Perc
enta
geof
KIR
3DL1
+,C
D15
8a/b
-N
K C
ells
1 2 3 4 5 6 7 8 90123456
Donor
Perc
enta
ge o
fKI
R3D
L1D
epen
dent
NK
Clo
nes
1 2 3 4 5 6 7 8 90
20
40
60Bw4- Target
Donor
Perc
enta
ge o
fKI
R3D
L1 C
ells
Expr
essi
ngC
D10
7a
Bw4 B13 Bw6
30% 70% 46% 54%5% 2%
3%90%
37% 63% 91% 9%7% 9%
59%
25%
Donor 1
Donor 2
721.221 Bw4-
B
C
D
A

Chapter 4
100
Figure 4.6 Donors who express HLA-B*1302 or HLA-B*1301 make very few
KIR3DL1-dependent NK cells.
NK cells from nine donors (donor 1-9) were tested in the CD107a assay to determine their
ability to make KIR3DL1 dependent NK clones. Each donor was incubated with the class I bare
target 721.221, targets lacking either the C1 or C2 epitopes (data not shown) or targets lacking
only the Bw4 epitope (HLA-A*0301, 1101, B*0702, 3501, C*0401, 0702). (A) Representative
examples of flow cytometry showing identification of KIR3DL1-positive, CD158a,b negative NK
cells and their subsequent CD107a expression when incubated with 721.221 or the Bw4-
negative target. (B) Following incubation with the Bw4-negative target, the proportion of
KIR3DL1-positive, 158a,b-negative NK cells that were CD107a-positive did not distinguish
donors with HLA-B*13 from donors with other Bw4-positive alleles and donors homozygous for
Bw6. (C) The proportion of KIR3DL1-positive, CD158a,b-negative NK cells does not distinguish
HLA-B*13 donors from donors with other Bw4-positive alleles and donors homozygous for Bw6.
(D) The proportion of KIR3DL1 dependent NK clones out of the total NK cell population
distinguishes HLA-B*13 donors from donors with other Bw4-positive alleles. 2-3% of NK cells
from donors with other Bw4-positive alleles are KIR3DL1-dependent whereas this is true of less
then 1% of NK cells from HLA-B*13 donors. Less than 0.5% of NK clones from donors
homozygous for Bw6 are KIR3DL1 dependent, slightly less than donors with HLA-B13.
Chapter 4
101
As shown in Figure 4.6B, among the donors with Bw4 alleles other than B*13, donors 1
and 4 up regulated CD107a expression on a large proportion of KIR3DL1-positive NK
cells in response to the Bw4-negative target (KIR3DL1-dependent) whereas for donors
2 and 3, a much lower percentage of KIR3DL1-positive NK cells were KIR3DL1-
dependent. In fact, donors 2 and 3 had similar proportions of KIR3DL1-dependent NK
cells to the three HLA-B*13 and the two Bw6 homozygous donors. Thus, by this
measure, HLA-B*13 donors were not distinguishable from some donors expressing
other Bw4 alleles. However, as shown in Figure 4.6C, the proportion of KIR3DL1-
positive, CD158a,b-negative NK cells also differed considerably between donors.
When the proportion of KIR3DL1-positive, CD158a,b-negative NK cells that were
KIR3DL1-dependent (Figure 6B) was multiplied by the proportion of all NK cells that
were KIR3DL1-positive, CD158a,b-negative (Figure 4.6C) to determine the percentage
of all NK cells from each donor that were KIR3DL1-dependent (Figure 4.6D), HLA-B*13
positive donors could be distinguished from other Bw4 positive donors. Donors with
Bw4 alleles other than HLA-B*13 had 2-3% KIR3DL1-dependent NK clones whereas
donors with HLA-B*13 or homozygous for Bw6 had less than 0.5%. Donors with HLA-
B*13 were, however, able to generate C1-dependent and C2-dependent clones (data
not shown).
4.3.6 Donors who lack Bw4 expressing HLA-B alleles but express HLA-A*2402
can make KIR3DL1 dependent NK clones
As HLA-A*2402 appears to be a ligand for KIR3DL1, we asked whether donors who
lack Bw4 expressing alleles other than HLA-A*2402 are able to make KIR3DL1-
dependent NK clones which could be exploited in haploidentical transplantation. A total
of 129 NK clones were generated from a C1 homozygous, Bw6 homozygous, HLA-
A*2402 positive donor (donor 10, Table 4.1). Each NK clone was tested against four
targets: 721.221 (positive control), a C1+, C2-, Bw4- target (IHW 9065), a C1-, C2+,
Bw4- target (IHW 9019) and a C1+, C2-, Bw4+ target (IHW 9157) in the four hour 51Cr

Chapter 4
102
release assay. 14% of all NK clones killed the targets in a pattern consistent with
KIR2DL2/KIR2DL3-dependent NK clones and expressed CD158b by flow cytometry
indicating that this donor could make KIR2DL2/KIR2DL3-dependent clones. None of
the clones killed targets in a KIR2DL1-dependent manner, as would be expected for an
individual who does not have a C2-positive HLA-C allele. However, a further 12.5% of
all NK clones killed the targets in a pattern consistent with KIR3DL1-dependent NK
clones (killed both Bw4–negative targets but not the Bw4-positive target) and
expressed KIR3DL1 by flow cytometry. Thus, donors who express HLA-A*2402 and
lack Bw4-positive HLA-B alleles can generate KIR3DL1 dependent NK clones.
4.4 Discussion
Our data confirm that KIR3DL1-dependent NK cells lyse targets that are homozygous
for common Bw6 alleles but do not lyse targets with most of the common Bw4 alleles.
These findings are consistent with the rule that the amino acid at position 80 of HLA-B
molecules has the predominant influence on specificity for KIR3DL1 (Cella et al, 1994;
D'Andrea et al, 1995). It has been reported that Bw4 alleles with an isoleucine at
position 80 (80I) are better inhibitors of KIR3DL1 mediated lysis than those with a
threonine at position 80 (80T) (Cella et al, 1994). In particular, class I HLA-bare cells
transfected with HLA-B*5801 (80I) have been reported to be stronger inhibitors of
KIR3DL1-dependent clones than cells transfected with HLA-B*2705 and HLA-B*3701
(80T) (O'Connor et al, 2007). We were unable to confirm these findings. The
interpretation of the data from Cella and colleagues may have been complicated by the
fact that most of the targets used in their study were not homozygous at the HLA-B
locus. In addition, the difference between 80I and 80T alleles was only apparent when
the Bw4 expressing HLA-A alleles were included. It is also possible that the effector
cells used in their study had a KIR3DL1 allele that does interact differently with 80I or
80T and was not represented in our study. Nevertheless, our study included five high
and two low expression alleles of KIR3DL1, including the common KIR3DL1*001, *015
and *005 alleles, and no evidence for an 80I/80T effect was observed. Whilst the
Chapter 4
103
hierarchy of different Bw4-positive HLA-B alleles reported in earlier publications may
well exist if analysed by the particular read outs used in those studies, our data suggest
that these subtleties may not be significant for target cells expressing a normal array of
ligands and polyclonal NK cells.
Among Bw4-positive HLA-B alleles, we found only HLA-B*1302, and B*1301 which is
more common in oriental populations, to be poor KIR3DL1 ligands. Three individuals,
in whom HLA-B*1302 or B*1301 was the only Bw4-positive allele, had a very low
frequency (<0.5%) of alloreactive NK cells dependent on KIR3DL1 compared to donors
with other Bw4-positive alleles (2-3%). These flow cytometric estimates of clonal
frequency are comparable with data from Ruggeri and colleagues obtained by direct
NK cloning (Ruggeri et al, 2006). HLA-B*1301 and HLA-B*1302 are unique among
HLA-B and HLA-C alleles in having a leucine rather than arginine at position 145, a
position that is important in salt bridge formation between HLA-C and KIR (Boyington et
al, 2000). Mutation of asparagine 135 of KIR2DL2, which forms the salt bridge with
arginine 145 of HLA-C, lowered HLA binding affinity by twenty-fold relative to the wild-
type receptor, suggesting a vital role for proper salt bridge formation in stabilising
KIR/HLA interaction. Whilst the structure of the KIR3DL1/HLA-B complex has not been
solved, it is thought that KIR3DL1 interaction with HLA-B may be similar to KIR2DL2
interaction with HLA-C, as many of the positions important in KIR recognition of HLA
are conserved amongst HLA-B and HLA-C alleles (Boyington et al, 2000). It is
possible that the leucine at position 145, which prefers to be buried within the protein
hydrophobic core and which also has a non-reactive side-chain, may not form an
adequate salt bridge with KIR3DL1.
In the initial screen of common Bw4-positive and Bw6-positive HLA alleles, HLA-
B*5101 poorly inhibited NK cell cytotoxicity. This weak inhibition could be low
expression of HLA-B*5101 and hence, low expression of Bw4 on the 5101a cell. When
additional examples of HLA-B*5101 were tested along with the original cell line

Chapter 4
104
B5101a, all three inhibited NK cell cytotoxicity albeit with the original example of B51
giving the weakest inhibition of the three. It is unclear why B5101a exhibited somewhat
better inhibition in the second experiment. However it may be relevant that in the initial
screen, the standard error was large for this target.
Conclusions from previous reports addressing the role of Bw4 positive HLA-A alleles as
ligands for KIR3DL1 have been inconsistent (Cella et al, 1994; Gumperz et al, 1995;
Thananchai et al, 2007). In particular, Gumperz et al (1995) observed inhibition of a
KIR3DL1 positive NK clone by HLA-A*2501 and HLA-A*2403 but inhibition was not
reversed by blocking with anti-KIR3DL1. Our data agree with the findings of
Thananchai et al (2007) showing that HLA-A*2402 (the common subtype of HLA-A24)
is an effective ligand. We show that inhibition by HLA-A24 is reversed by blocking with
anti-KIR3DL1 and furthermore show that an individual whose only Bw4-positive allele
was HLA-A*2402 was able to generate KIR3DL1-dependent NK clones indicating that,
at least in this individual, A*2402 was an effective ligand and capable of “arming” NK
cells for effector function. HLA-A*3201 is also an effective ligand. The status of HLA-
A*2301 and -A*2501 is less clear. HLA-A*2501 expressing targets exhibited, at best, a
weak inhibitory effect in both the CD107a and chromium release assays. The
interaction of HLA-A*2301 with KIR3DL1 is particularly interesting. The A23 target was
virtually ineffective in the CD107a assay with NK cells expressing the KIR3DL1 high
allele but was the only target which clearly showed greater inhibition of NK cells
expressing KIR3DL1*005 than those expressing KIR3DL1*01502 in donor 4. The
inhibitory capacity of HLA-A*2301 for the KIR3DL1*005 allele was confirmed in the
chromium release assay using an NK clone expressing KIR3DL1*005 from this same
donor. These data suggest that the effectiveness of HLA-A*2301 as a KIR3DL1 ligand
may be more dependent on the KIR3DL1 allele than other Bw4 alleles. However
studies using additional A23 targets and further examples of NK cells expressing
KIR3DL1*005 and other alleles are required before definitive conclusions can be
drawn.

Chapter 4
105
Other groups have reported that different KIR3DL1 alleles interact with Bw4 to differing
degrees (Carr et al, 2005; Draghi et al, 2005; Yawata et al, 2006; O'Connor et al,
2007). For alleles other than HLA-A*2301 we found little difference between the
behaviour of the high expression allele KIR3DL1*01502 and the low expression
KIR3DL1*005 allele in donor 4. This result is consistent with the findings of Draghi et al
(2005), except they compared KIR3DL1*005 with KIR3DL1*002 rather than
KIR3DL1*01502. (KIR3DL1*002 differs from KIR3DL1*01502 by a single amino acid in
the D2 domain). However for donor 3, there was a clear difference between the NK
cells expressing the high expression and low expression alleles. The KIR3DL1*005-
like variant differs from KIR3DL1*005 by a single non-synonymous mutation at
nucleotide position 115, is weakly expressed, and the mutation appears to alter the
ability of this receptor to interact with Bw4. Not only is it poorly inhibited by Bw4 alleles,
but NK cells expressing this allele only weakly lyse cells lacking Bw4. Thus KIR3DL1-
dependent clones in donors whose only KIR3DL1 allele is the KIR3DL1*005-like
variant, may be weakly armed and may not be particularly effective alloreactive NK
cells.
One third of Bw4-positive potential stem cell donors cannot make KIR3DL1- dependent
clones. Many of these may have the KIR3DL1*004 allele which is not expressed at the
cell surface. However, our data suggest additional explanations. For example, our data
suggest that individuals with HLA-B*1301 or -B*1302 as their only Bw4-positive allele
will make relatively few KIR3DL1-dependent clones and may therefore be a poor
choice of donor for a haploidentical transplant. On the other hand, individuals who have
HLA-A*2402 or -A*3201 may well be suitable. The influence of KIR3DL1 polymorphism
is also likely to be relevant. Our data suggesting KIR3DL1 polymorphism influences
the arming of NK cells on the one hand and the effectiveness of HLA-A*2301 as a
ligand on the other hand is consistent with reports of others demonstrating KIR3DL1

Chapter 4
106
allele-dependent variation in strength of interaction with different Bw4 alleles (Carr et
al, 2005; Draghi et al, 2005; Yawata et al, 2006; O'Connor et al, 2007).
The exploitation of alloreactive NK cells in haploidentical transplants requires both a
patient amenable to such therapy and a suitable donor. In addition to Bw4, the HLA-
C1 and –C2 epitopes can also mediate NK allorecognition through their corresponding
KIR receptor (Ruggeri et al, 2006). Only cells from patients who lack either Bw4 and or
the C1 or C2 ligand can be lysed by alloreactive NK cells. Only donors who have the
corresponding epitope are capable of NK mediated alloreactivity. The changed status
of HLA-B*13, -A*24 and -A*32 shown in our study means that a number of individuals
(patients and donors) will need reclassification. Individuals currently classified as Bw4
negative (Bw6 homozygous) would now be classified as Bw4 positive if they have HLA-
A24 or –A32 whilst those whose only Bw4 positive allele is HLA-B13 would now be
classified as Bw4 negative. Although we do not have a database of HLA-C typed,
haploidentical pairs in which to directly analyse these effects, we can make some
predictions from the general population. In a database of 200 Caucasian Western
Australians typed at HLA-A, -B and –C, by sequencing, based on the current definition
of Bw4 positivity and the HLA-C alleles present, 28% of individuals would have all three
NK cell epitopes (Bw4, C1, C2) and thus not be amenable to NK allotherapy. However,
HLA-A24, -A32 and –B13 have frequencies of 20%, 6% and 6%, respectively in this
population resulting in 15% of individuals (thus patients and donors) requiring
reclassification. The net effect when examined empirically in this population is such
that the proportion of individuals (and thus patients) who would now be considered to
have all three NK cell epitopes will increase from 28% to 32%. However, for Bw4
negative patients an additional 11% of individuals (and thus donors) would now be
expected to be Bw4 positive and therefore suitable donors. Such effects will also be
evident to varying degrees in other ethnic groups depending upon the frequencies of
the relevant alleles. HLA-B13 for instance, has a frequency of 25% in some Chinese
populations (www.allelefrequencies.net).

Chapter 4
107
Until the rules governing the interaction of HLA alleles and KIR3DL1 alleles are better
understood, methods to accurately estimate the frequency of alloreactive clones are
required. Our data indicate that the simple flow cytometric assay we have used can do
this allowing faster identification of donors suitable for haploidentical transplants and
other NK allo-therapeutic applications. A formal evaluation of the CD107a assay for
detecting C1, C2 and Bw4-dependent alloreactive clones is currently underway.
Chapter 5
108
Chapter 5
KIR2DS1-Mediated Activation Overrides NKG2A-Mediated Inhibition in
HLA-C C2 Negative Individuals
Foley B, De Santis D, Lathbury L, Christiansen F and Witt, C.
International Immunology Accepted 23rd January 2008 This chapter is presented in the form accepted for publication with one alteration. The
materials and methods section has been simplified to include only the NK cell donors
and cell lines used in this chapter. For more detailed methods refer to chapter 2.
Chapter 5
109
Chapter 5: KIR2DS1-Mediated Activation Overrides NKG2A-
Mediated Inhibition in HLA-C C2 Negative Individuals
5.1 Introduction
Natural killer (NK) cell cytotoxicity is controlled by a balance of both activating and
inhibitory signals. To prevent autoreactivity, NK cells do not become competent for
cytotoxicity (armed or licensed) unless they express at least one inhibitory receptor
recognising self-ligands (Raulet et al, 2001; Kim et al, 2005). As the ligands for some
NK inhibitory receptors are allelic epitopes on class I HLA molecules, NK cell clones
that depend on such receptors for inhibition exhibit alloreactivity. It is thought that the
inhibitory signal mediated by these receptors under normal conditions are dominant
over signals generated by activating receptors (Biassoni et al, 1997; Vales-Gomez et
al, 1998)
The killer immunoglobulin-like receptors (KIR) recognise allelic epitopes present on
HLA-A, HLA-B or HLA-C molecules. HLA-C alleles can be divided into two groups, C1
and C2, based on their amino acid sequences in the α1 helix. C1-group alleles have
the amino acid serine (Ser) at residue 77 and asparagine (Asn) at residue 80 whereas
C2-group alleles have the amino acid Asn at residue 77 and Lysine (Lys) at residue 80
(Colonna et al, 1993). The inhibitory receptor KIR2DL1 recognises C2-group alleles
while KIR2DL2 and KIR2DL3 (CD158b) recognise C1-group alleles. Although the
amino acid sequences of activating KIR (KIR2DS1, KIR2DS2, KIR3DS1) suggest that
they might bind to similar ligands as their inhibitory counterparts (KIR2DL1, KIR2DL2/3,
KIR3DL1), it has been difficult to show that activating receptors bind to these ligands.
Alloreactive NK clones from C1 homozygous individuals lyse C2 homozygous EBV-
transformed B lymphoblastoid cell lines (BLCL). These clones have been shown to be
alloreactive due to expression of the inhibitory receptor KIR2DL2 or KIR2DL3
Chapter 5
110
(CD158b) for which the C2 homozygous targets cannot supply the C1 self-ligand, that
is they recognise “missing-self” (Moretta et al, 1995). However, it has been shown that
some NK clones that lyse C2 expressing targets lack CD158b and react with the anti-
CD158a antibody which recognises KIR2DL1 or KIR2DS1. Moreover, activation of
these NK clones by C2 homozygous targets was abolished by addition of anti-CD158a
suggesting that these NK clones mediate alloreactivity by recognition of C2 ligands by
the activating receptor KIR2DS1 (Moretta et al, 1995). Despite this early data there has
been little additional evidence of activation of NK cells through KIR2DS1 recognition of
the C2 ligand. Stewart and colleagues in 2005 (Stewart et al, 2005), used KIR2DL1
and KIR2DS1 tetramers to determine whether these receptors bound to C2. KIR2DL1
tetramers bound to C2 positive uninfected B cells and EBV-infected B cells. In contrast,
KIR2DS1 tetramers were found to bind only to C2 positive B cells after EBV infection. It
was postulated that this difference in KIR2DS1 binding was due to increased HLA-C
density on the surface of EBV-infected cells.
In 2007, Chewning and colleagues provided evidence to support the earlier work of
Moretta and colleagues that KIR2DS1 binding could be responsible for NK cell lysis of
C2 positive BLCL target cells showing that such lysis could be blocked by anti-CD158a
antibody.
Here we provide further evidence supporting the findings of Chewning et al, that
KIR2DS1 positive NK clones are activated by recognition of C2 on BLCL targets. In
addition we show that the activation signal generated by engagement of KIR2DS1
overrides the inhibitory signal generated by engagement of CD94/NKG2A in these
clones. Furthermore we report that C2 homozygous targets undergo greater cell lysis
than C1/C2 heterozygous targets consistent with the idea that activation through
KIR2DS1 is dependent on class I density at the cell surface. We also demonstrate that
KIR2DS1 activated cells can lyse PHA blasts in addition to EBV-transformed cells from
the same individual, indicating that non-transformed cells express enough HLA-C to
Chapter 5
111
activate NK cells through KIR2DS1 highlighting a potential role for these NK clones in
mediating NK alloreactivity.
5.2 Materials and Methods
The materials and methods section has been simplified to include only the NK cell
donors and cell lines used in this chapter. For more detailed methods refer to chapter
2.

Chapter 5
112
Table 5.1. Class I HLA Typing and NK Epitopes of BLCL Target Cell Panel
Cell Identifier HLA-A HLA-B HLA-C NK Epitopes 721.221 - - - - IHW9034 A*0301 B*0702 C*0702 C1 Q94056412J A*0201, 1101 B*0702 C*0702 C1 IHW9065 A*0301 B*0702 C*0702 C1 IHW9157 A*3301 B*5801 C*0302 C1, Bw4 R050307566X A*1101, 3101 B*5101 C*1402 C1, Bw4 R020349726A A*0301, 1101 B*07, 35 C*0401, 0702 C1, C2 R020358799H A*0201 B*4402, 5101 C*0501, 1402 C1, C2, Bw4 Q9454288T A*01, 0301 B*2705, 4403 C*04, 0102 C1, C2, Bw4 R97349692S A*0301, 1101 B*4001, 5701 C*0304, 0602 C1, C2, Bw4 IHW9019 A*3002 B*180101 C*0501 C2 IHW9084 A*0201 B*4002 C*0202 C2 IHW9090 A*0201 B*4402 C*0501 C2, Bw4 IHW9016 A*0201 B*5101 C*1502 C2, Bw4 Q95050308M A*0201 B*4402 C*0501 C2, Bw4 HLA types of target cells used in flow cytometric and chromium release assays unless otherwise stated in the figure legend. In all cases, HLA alleles
were assigned on the basis of sequencing of exons 2 and 3. Cell lines from the 10th International Histocompatibility Workshop are identified with their
workshop identification, all other EBV cell lines are described in Chapter 2.1.1.

Chapter 5
113
Table 5.2. HLA Typing NK Epitopes and KIR Typing of NK Cell Donors
Donor HLA-A HLA-B HLA-C NK Epitopes
KIR2DL1 KIR2DL2 KIR2DL3 KIR3DL1 KIR2DS1
1 A*24, 32 B*18, 51 C*07, 1402 C1, Bw4 + + + + + 2 A*03, 68 B*07, 14 C*07, 08 C1 + - + - + 3 A*1102, 2410 B*1802, 4601 C*01, 07 C1 + + + + + 4 A*01, 03 B*08 C*07 C1 + + + + - 5 A*02, 1101 B*1501, 35 C*0303, 0401 C1, C2 + + - + +
In all cases, HLA alleles were assigned on the basis of sequencing of exons 2 and 3. Full KIR gene repertoire was performed as described in Chapter
2.6.4 for all donors however only relevant KIR genes are shown.

Chapter 5
114
5.3 Results
5.3.1 Alloreactive NK Clones Expressing CD158a Lyse C2 Expressing Targets
As expected, we found that individuals who express the C1 epitope have alloreactive
NK clones expressing KIR2DL2 or KIR2DL3 (CD158b) which are inhibited by BLCL
targets expressing C1 and lyse targets which lack C1. Of the122 NK clones tested from
a C1 homozygous donor (Donor 1), 28 NK clones lysed C1 negative (C2 homozygous)
targets. 26 of these 28 clones expressed CD158b. However, 2 clones (clone C9 and
E11) were CD158b negative (Figure 5.1) suggesting that another receptor must explain
their alloreactivity. Similarly, 4 out of 100 NK clones from another C1 homozygous
donor (Donor 2) lysed C1 negative (C2 homozygous) targets. Of these, 3 were CD158b
positive but 1 (clone P10) was CD158b negative, suggesting that another receptor
must explain its alloreactivity. All three CD158b negative NK clones expressed CD158a
(KIR2DL1 or KIR2DS1). Clones C9 and E11 also expressed NKG2A and clones C9
and P10 also expressed CD158k (KIR3DL2).

Chapter 5
115
Figure 5.1. Receptor expression and cytotoxicity pattern of CD158b negative
clones showing specificity for C2 positive targets.
(A) Receptor expression on NK clones C9, E11 and P10. (B) Flow cytometry histograms
showing NK receptor expression on representative NK clone C9 showing expression of NKG2A
and KIR3DL2. (C) Initial screen cytotoxicity patterns of the three CD158a positive (CD158b
negative) clones. Each NK clone lysed the class I HLA negative target (721.221 cell line) and
the C2 homozygous BLCL target (IHW9019) but not the C1 homozygous BLCL target
(IHW9034) (Table 5.1).
0
20
40
60
80
Target Cell
Spec
ific
Lysi
s(%
)
0
20
40
60
80
Target Cell
0
20
40
60
Target CellC1 - + -C2 - - +Bw4 - - -A3 - + -
C1 - + -C2 - - +Bw4 - - -A3 - + -
C1 - + -C2 - - +Bw4 - - -A3 - + -
Clone C9 Clone P10
Donor Clone NKG2A/B CD158b(KIR2DL2/KIR2DL3/
KIR2DS2)
CD158a(KIR2DL1/KIR2DS1)
CD158e(KIR3DL1)
CD158k(KIR3DL2)
1 C9 + - + - +1 E11 + - + - ND2 P10 - - + - +
Count
NKG2A/B CD158aKIR2DL1/KIR2DS1
CD158bKIR2DL2/KIR2DL3/
KIR2DS2
CD158eKIR3DL1
CD158kKIR3DL2
Clone E11
A
B
C

Chapter 5
116
5.3.2 The Allospecificity of Clone C9 cannot by Explained by KIR3DL2
It has been reported that KIR3DL2 recognises HLA-A*0301 and HLA-A*1101 but not
HLA-A*0201 (Gavioli et al, 1996; Pende et al, 1996). As the C1 homozygous target (C2
negative) used for screening NK clones also expressed HLA-A3 and the C2
homozygous target (C1 negative) did not, we considered the possibility that the lack of
cytotoxicity against the C1 homozygous target was due to HLA-A3 mediated inhibition
through KIR3DL2. NK clone C9 was therefore tested against 6 HLA-A3 homozygous
and 6 HLA-A2 homozygous (ie. HLA-A3 negative) BLCL targets (Figure 5.2). All of
these targets lacked the C2 epitope. Whilst clone C9 lysed the HLA class I negative
cell line, 721.221, it was inhibited by all A*0301 and A*0201 homozygous cell lines
indicating that KIR3DL2 mediated inhibition was unlikely to explain this clone’s
allospecificity.

Chapter 5
117
Figure 5.2. Despite expression of KIR3DL2, clone C9 was inhibited equally well
by HLA-A*0301 and HLA-A*0201 homozygous BLCL target.
(A) NK clone C9 was tested against a target cell panel of 12 BLCL including six targets
homozygous for HLA-A*0301 and six targets homozygous for HLA-A*0201. All targets were
homozygous for the C1 epitope (ie. lacked the C2 epitope). (B) HLA alleles of the BLCL panel.
-101030507090
Target CellSp
ecifi
c Ly
sis
(%)
A*0301 A*0201 721.221
Identifier HLA-A HLA-B HLA-CR8612350C A*0301 B*0702 C*0702R8612340F A*0301 B*1402 C*0802R8612319W A*0301 B*0702 C*0702R8612298B A*0301 B*0702 C*0702R8612318Y A*0301 B*0702 C*0702R8612302Q A*0301 B*0702 C*0702R8612343Z A*0201 B*4501 C*1601R8612289C A*0201 B*2705 C*0102R8612317A A*0201 B*1501 C*0304R8612347R A*0201 B*3801 C*1203R8612346T A*0201 B*1801 C*0702R8612323F A*0201 B*1801 C*0701
Class I HLA Alleles of BLCL Target Panel
A
B

Chapter 5
118
5.3.3 The Allospecificity of Clone C9 is Determined by the Presence of the C2
epitope in a Dose Dependent Manner
To further characterise the allospecificity of clone C9 we tested a more comprehensive
panel of BLCL including C1 homozygous, C2 homozygous and C1/C2 heterozygous
targets (Table 5.1). Clone C9 lysed all five C2 positive targets and none of the C2
negative targets (Figure 5.3). Interestingly, cytotoxicity was stronger against C2
homozygous targets than the C1/C2 heterozygous targets.
Figure 5.3. NK clone C9 only lyses C2 positive BLCL targets and shows a C2
dose effect.
NK clone C9 was tested against a panel of BLCL target cells (IHW9090, IHW9019,
Q95050308M, R020358799H, R020349726A, IHW9034, R050307566X, IHW9157 and
Q94056412J) in the four-hour 51Cr release assay at an E:T ratio of 2:1. NK clone C9 strongly
lysed the HLA class I negative 721.221 cell line (positive control), and the BLCL targets
homozygous for HLA-C group 2. C1/C2 heterozygous targets were moderately lysed
whereas C1 homozygous targets were essentially negative.
0
25
50
75
100
Target Cell
Spec
ific
Lysi
s (%
)
C1 - - + +C2 - + + -
C1-C2-
C1+C2-
C1+C2+
C1-C2+

Chapter 5
119
5.3.4 Clone C9 Expresses KIR2DS1*002
We postulated that the alloreactivity of clone C9 was conferred by the activating
receptor KIR2DS1 (CD158a) interacting with the C2 epitope. In order to confirm that
clone C9 transcribes a functional KIR2DS1 gene, cDNA was prepared from clone C9
and KIR2DS1 was amplified using KIR2DS1 sequence-specific primers (Uhrberg et al,
1997) (Figure 5.4) and primers that would amplify the full length KIR2DS1 cDNA (data
not shown).
Figure 5.4. NK clone C9 transcribes KIR2DS1*002.
Genomic DNA from donor 1 (lane 1), cDNA from NK clone c9 (lane 2) and cDNA from a
CD158a negative NK clone (Donor 2) (lane 3) were amplified with KIR2DS1 specific primers
(Uhrberg et al, 1997). The genomic DNA resulted in an expected 1800bp product (growth
hormone amplification control shown as a 433bp product) confirming the presence of KIR2DS1.
The cDNA resulted in a 353bp product as expected.
The sequence-specific primers detected KIR2DS1 transcript. The full length KIR2DS1
PCR product was also amplified and sequenced. The sequence was identical to
KIR2DS1*002. Since CD158a stains both KIR2DS1 and it’s inhibitory counterpart
KIR2DL1, we also tested the mRNA using KIR2DL1-specific primers. Clone C9 did not
transcribe KIR2DL1 although a KIR2DL1 transcript could be amplified from a positive
control (data not shown).

Chapter 5
120
5.3.5 Activation by C2 Positive Targets is Mediated by KIR2DS1 and Over-rides
NKG2A Mediated Inhibition
In order to prove that lysis of C2 positive targets by the CD158b negative, CD158a
positive clone C9 was mediated by KIR2DS1, we determined the effect on cytotoxicity
of blocking KIR2DS1 using anti-CD158a mAb. The addition of anti-CD158a completely
abolished lysis of C2 positive targets and had no effect on the lysis of C2 negative
targets confirming the role of KIR2DS1 (Figure 5.5). Clone C9 also expressed the NK
inhibitory receptor NKG2A. As all the BLCL target cells used in these experiments
express HLA class I alleles that provide the necessary leader peptides for expression
of HLA-E, NKG2A on clone C9 might be expected to bind to its ligand HLA-E and
inhibit lysis of the target cell. To determine whether NKG2A was functional in clone C9,
we used mAb z199 to block any NKG2A mediated inhibition. As shown in Figure 5.5,
the addition of anti-NKG2A had no effect on lysis of the class I deficient control
(721.221 cell line) but moderately enhanced lysis of 6 out of 7 target cells, indicating
that NKG2A was functional. This data indicates that in the absence of blocking mAbs,
KIR2DS1 mediated activation over-rides NKG2A mediated inhibition. Interestingly,
blocking of NKG2A did not result in enhanced lysis of one of the C1 homozygous target
cells (IHWS 9034). Blocking with the pan-HLA class I mAb, W6/32 resulted in lysis of
this target (data not shown) suggesting that the ligand inhibiting NK cell lysis of this
target cell is an HLA class I molecule but not HLA-E.

Chapter 5
121
Figure 5.5 Target cell lysis by NK clone C9 is enhanced by anti-NKG2A antibody
and inhibited by anti-CD158a (anti-KIR2DL1/KIR2DS1).
NK clone C9 was tested against the class I negative control (721.221 cell line) and a panel of
BLCL target cells with various C1 and C2 combinations (from left-right IHW9019, IHW9084,
IHW9016, R020358799H, R020349726A, IHW9034 and R050307566X). NKG2A and KIR2DS1
receptors were blocked with mAb z199 (NKG2A) (grey bars) and HP-3E4 (CD158a) (open
bars), respectively and isotype control (solid bars). Addition of anti-CD158a blocked lysis of C2
positive targets but had no effect on C2 negative targets. Addition of ant-NKG2A resulted in
moderate enhanced lysis of 6 of the 7 targets.
-10
10
30
50 anti-NKG2Aanti-CD158a
isotype
Target CellSpec
ific
Lysi
s (%
)
C1 - - - - + + + +C2 - + + + + + - -

Chapter 5
122
5.3.6 KIR2DS1 Activated NK Clones Represent 1% of all NK Cells in C1
Homozygous Individuals
To determine the frequency of NK clones that are activated by KIR2DS1 and whether
this varies amongst individuals of different HLA-C and KIR genotype we determined
CD107a expression on CD158a positive NK cells when incubated with C2 positive
BLCL targets. Polyclonal NK cells from a C1 homozygous, KIR2DS1 positive donor
(Donor 3), a C1 homozygous, KIR2DS1 negative donor (Donor 4) and a C1/C2
heterozygous, KIR2DS1 positive donor (Donor 5) were incubated with C1 homozygous
and C2 homozygous BLCL targets and the percentage of CD107a positive cells
determined. C2 positive targets were predicted to induce CD107a expression only on
CD158a positive NK cells from subjects who have the KIR2DS1 gene and in whom C2
is not a self-epitope (ie. C1 homozygous donors). As shown in Figure 5.6A, C2 positive
(either homozygous or heterozygous) targets induced CD107a expression on CD158a
positive NK cells only from the C1 homozygous, KIR2DS1 positive donor.
Representative cytofluorograms are shown in Figure 5.6, B1-6. Figure 5.6, B1-3 show
that a C1 homozygous target cell induced very little CD107a expression on CD158a
positive cells from a C1 homozygous, KIR2DS1 positive donor (1.9% of CD158a
positive cells Figure 5.6, B2) whereas CD107a expression was induced on 33.8% of
CD158a positive cells by a C2 homozygous target (Figure 5.6, B3). These represent
some 0.8% of all NK cells. Neither C1 homozygous nor C2 homozygous targets
induced CD107a expression on CD158a positive cells from a C1 homozygous
KIR2DS1 negative donor (Figure 5.6, B4-6). We performed similar experiments using
C2 homozygous, KIR2DS2 positive individuals and HLA-Bw6 homozygous, KIR3DS1
positive individuals to determine if NK cells could be activated by the C1 or Bw4 (both
80I and 80T) epitopes through KIR2DS2 or KIR3DS1, respectively. We were unable to
detect NK cell activation in such experiments (data not shown).

Chapter 5
123
0
10
20
30
40C1+ 2DS1+C1+ 2DS1-C1+C2+ 2DS1+
Target Cell
Perc
enta
ge o
f CD
158a
cells
exp
ress
ing
CD
107a
C1 - - + +C2 - + + -
NKAlone
721.221 C1+C2-
C1+C2+
C1-C2+
Genotype ofNK Donor
16.7%
70.5%
4.6%
8.2%36.6%
60.9%1.8%
0.7%
C1 HomozygousTarget
C2 HomozygousTarget
2.3%
11.3%
76.5%
10.0%
NK Donor C1+KIR2DS1+
8.4%
85.0%
6.4%
0.2%9.7%
87.7%
2.5%
0.1%1.6%
15.1%
81.6%
1.7%
NK Donor C1+KIR2DS1-
B1 B2 B3
B4 B6B5
A
B

Chapter 5
124
Figure 5.6. NK cell activation through KIR2DS1 (CD158a) only occurs in C2
negative, KIR2DS1 positive individuals.
(A) NK cells from three donors, Donor 3 (C1+C2- KIR2DS1+:solid bars), Donor 4 (C1+C2-
KIR2DS1-:grey bars) and Donor 5 (C1+C2+ KIR2DS1+:open bars) were incubated with 721.221
cell line (positive control), two C2 homozygous cell lines (IHW9019, IHW9084), two C1/C2
heterozygous cell lines (Q9454288T, R97349692S) and two C1 homozygous cell lines
(IHW9034, IHW9065) and CD107a expression was quantified on the CD158a positive
population. All three NK donors lyse 721.221 cells, but only the C1 homozygous, KIR2DS1
positive donor lyses C2 homozygous BLCLs and to a lesser extent C1/C2 heterozygous BLCLs.
NK cells from all donors are inhibited by the C1 homozygous (C2 negative) BLCL targets. (B)
Representative flow cytometric plots for the C1 homozygous, KIR2DS1 positive (Fig 5.6, B1-3)
donor and the C1 homozygous, KIR2DS1 negative (Fig 5.6, B4-6) donor with the percentage of
cells in each quadrant shown. After incubation with target cells, CD158b negative cells were
identified (B1, B4). CD107a and CD158a staining of the CD158b negative NK cells (selected
from B1 or B4) are shown after incubation with a C1 homozygous target (B2, B5) or C2
homozygous target (B3, B6) are shown. CD158a positive cells from the C1 positive, KIR2DS1
positive donor show CD107a staining (8.2% of the CD158a positive cells) only after incubation
with the C2 homozygous target (B3) but not the C1 homozygous target (0.7% of the CD158a
positive cells). The CD158a positive cells from the C1 homozygous, KIR2DS1 negative donor
do not show CD107a staining when incubated with C1 or C2 homozygous targets (0.1% and
0.2% of CD158a cells respectively).

Chapter 5
125
5.3.7 NK Cells Activated by C2 Kill EBV non-infected Targets
As it has been shown that KIR2DS1 binds to EBV-infected cells, but not to uninfected
cells (Stewart et al, 2005), we tested the ability of KIR2DS1 activated NK cells to kill
PHA blasts and EBV BLCL from the same individual. Polyclonally expanded NK cells
from a C1 homozygous, KIR2DS1 positive individual (Donor 3) were incubated with C1
homozygous, C2 homozygous and C1/C2 heterozygous PHA blasts and BLCL targets,
and CD107a expression measured on CD158a positive cells. CD107a expression was
induced on CD158a positive NK cells from Donor 3 by both C2 positive BLCL and PHA
blasts (Figure 5.7), although in all cases, C2 positive BLCL induced CD107a in a higher
percentage of NK cells than PHA blasts from the same individual. As expected CD107a
expression was not induced on CD158a positive NK cells from a KIR2DS1 positive
C1/C2 heterozygous donor (Donor 5) by either C2 positive BLCL or PHA target cells
(Figure 5.7). To determine whether the difference in the ability of BLCL and PHA blasts
to induce CD107a expression on NK cells might reflect differences in the level of class I
expression, BLCL and PHA blasts were stained using the class I HLA specific
monoclonal antibody W6/32. The mean fluorescence intensity of class I HLA
expression was 20-50% higher on BLCL then PHA blasts (data not shown).

Chapter 5
126
Figure 5.7. C2 positive EBV transformed and PHA blast cells both activate
CD158a positive NK cells.
Polyclonally expanded NK cells from a C1+ KIR2DS1+ donor (Donor 3) and a C1+C2+
KIR2DS1+ donor (Donor 5) were used in the CD107a assay against a panel of EBV
transformed BLCL and PHA blasts from the same individuals. (A) HLA typing and NK epitopes
of the BLCL and PHA blast donors. (B) CD158a positive (CD158b negative) NK cells from both
donors expressed CD107a when incubated with the 721.221 cell line (positive control). Only NK
cells from the C1+ KIR2DS1+ donor (Donor 3 solid bars) expressed CD107a in the presence of
both the C2 homozygous and C1/C2 heterozygous BLCL and PHA blasts but, as expected, not
in the presence of the C1 homozygous BLCL or PHA blasts. By contrast the CD158a positive
cells from the C1+C2+ KIR2DS1+ donor (Donor 5 open bars) did not express CD107a in the
presence of any of the target pairs.
0
10
20
30
40
C1+ 2DS1+C1+ C2+ 2DS1+
Target Cell
Perc
enta
ge o
f CD
158a
cel
lsex
pres
sing
CD
107a
C1 - - - + +C2 - + + + -
NKAlone
721 C1C1C2C2(a) C2(b) Genotype ofNK Donor
NK Epitope Cell Identifier HLA-A HLA-B HLA-CC2 (a) R020106262S A*1101, 68 B*1301, 1401 C*04C2 (b) R030309974F A*02, 3001 B*1302, 5701 C*0602C1C2 R030152571S A*0205, 24 B*1503, 3502 C*04, 1203C1 R030316728W A*02, 1101 B*0702, 27 C*0102, 0303
A
B
EBV PHA EBV PHAEBV PHAEBV PHA
Chapter 5
127
5.4 Discussion
We have demonstrated in this study that the specificity of alloreactive NK cells can be
determined by the activating receptor KIR2DS1. These results confirm the results of
other studies providing evidence that NK cells can be activated by KIR2DS1
recognition of the C2 epitope (Moretta et al, 1995; Stewart et al, 2005 and Chewning et
al, 2007). The current data also confirms the finding of Chewning et al, that only C1
homozygous (ie. C2 negative), KIR2DS1 positive individuals are capable of generating
such alloreactive NK clones dependent on KIR2DS1. This is intuitively logical as
KIR2DS1 activated clones would be autoreactive in individuals whose HLA-C alleles
include the C2 epitope. Thus, C1 homozygous individuals produce alloreactive NK
clones dependent on KIR2DL2/3 which are activated by the absence of the C1 epitope,
and also KIR2DS1 positive clones that are activated by the presence of the C2 epitope.
The latter population of cells represents approximately 1% of all NK cells in C1
homozygous individuals. Thus, in addition to detecting “missing-self”, NK cells are
capable of detecting “non-self”.
It is generally believed that under normal conditions inhibitory signals are dominant
over activating signals in controlling NK cell activation. NK cells are only “licensed” for
cytotoxicity if they express an inhibitory receptor for ‘self’. The majority of KIR2DS1
expressing NK clones characterised in this study, and in the studies by Moretta et al
and Chewning et al co-expressed NKG2A suggesting that KIR2DS1 dependent
alloreactive NK cells are “licensed” by NKG2A interaction with self. Our data suggests
that the interaction of activating receptors for non-self ligands, such as NK cells from a
KIR2DS1 positive, C2 negative individual interacting with C2, can over-ride NKG2A-
mediated inhibition. It has previously been reported that under cellular stress the
activating receptor NKG2D can over-ride inhibitory signals to allow NK cells to
eliminate tumour or infected cells (Bauer et al, 1999) but our data is the first evidence
of an activating KIR behaving in a similar manner. Why the inhibitory signal generated
through NKG2A does not suppress the activation signal generated through KIR2DS1 is
Chapter 5
128
unclear. It has been speculated that the ability of inhibitory signals to dominate over
activating signals is due to the low affinity with which activating receptors bind to their
ligand compared with their inhibitory counterparts (Vales-Gomez et al, 1999; Lopez-
Botet et al, 2000). The kinetics of NKG2A binding to HLA-E are similar to those for
inhibitory KIR binding to HLA-C (Vales-Gomez et al, 1999) so it seems unlikely that our
current data showing the inability of NKG2A to over-ride KIR2DS1 can be explained by
low affinity binding of NKG2A to HLA-E.
This study only examined one allele of KIR2DS1 in detail, KIR2DS1*002, which is
expressed by clone C9 and we do not know the KIR2DS1 alleles expressed by the
other donors. Four alleles of KIR2DS1 have been reported (Robinson et al, 2003).
KIR2DS1*001 and KIR2DS1*004 differ from KIR2DS1*002 at positions 70 and 90 of
the first immunoglobulin domain, respectively. KIR2DS1*003 differs from KIR2DS1*002
only in the leader sequence. Differences in the immunoglobulin domains may result in
different binding affinities. Therefore we cannot be sure that KIR2DS1*001 and
KIR2DS1*004 would behave like KIR2DS1*002 whereas it seems likely that
KIR2DS1*003 would have similar specificity to KIR2DS1*002 in its interaction with its
C2 ligand.
Stewart and colleagues (Stewart et al, 2005) demonstrated that KIR2DS1 tetramers
only bound to C2 on EBV-infected cells compared with normal B cells and B cells
infected with members of the human Herpesvirus family and postulated that this was
due to an increase in class I HLA expression induced by EBV infection. In the current
study lysis of C1/C2 heterozygous BLCL was weaker than for C2 homozygous BLCL,
suggesting that increased target cell density of HLA-C enhances KIR2DS1 mediated
activation. We also found that BLCL were more susceptible to lysis than PHA blasts
from the same person and that this correlated with lower class I HLA expression.
Nevertheless, KIR2DS1 activated NK cells were able to lyse PHA activated T cells

Chapter 5
129
(non-EBV infected) from both C2 homozygous and heterozygous individuals despite
lower class I expression than on BLCL from the same individuals.
It is unclear as to whether other activating KIR (KIR2DS2, KIR2DS3, KIR2DS4,
KIR2DS5 and KIR3DS1) can mediate NK alloreactivity. While we and others (Moretta
et al, 1995; Winter et al, 1998; Saulquin et al, 2003; Stewart et al, 2005; Chewning et
al, 2007) have been unable to demonstrate that NK cell activation mediated through
KIR2DS2 interacting with C1, or through KIR3DS1 interacting with Bw4 (O'Connor et
al, 2007), it is possible that this may be due to the fact that these epitopes are simply
not the cognate ligands for these receptors. Therfore furtherwork is required to resolve
this issue.
It is not surprising that KIR2DS1 dependent NK clones, which only arise in C1
homozygous individuals, have been largely overlooked. When considering potential
donors for haploidentical stem cell transplants (HSCT), C1 homozygous donors are
rarely considered because all haploidentical recipients would also express C1 thereby
preventing any inhibitory receptor-mediated NK alloreactivity by such donors.
Leukaemia patients with all three ligands (C1, C2 and Bw4) for inhibitory KIR are
thought to be unable to benefit from NK-mismatched SCT as all inhibitory KIR on
haploidentical donor NK cells would be inhibited by HLA ligands on the recipient’s cells.
The data described in this report suggest that it may be possible for patients with all
three epitopes to benefit from the use of alloreactive NK cells. NK cells from a C1
homozygous sibling donor sharing one haplotype with a C1/C2 heterozygous recipient
may provide an anti-leukaemic effect (and reduced graft versus host disease (GvHD))
through KIR2DS1 activated NK clones. Such NK cells may also be evident in HSCT
using an unrelated donor where the donor has KIR2DS1 and the recipient has C2.
Indeed there is evidence to suggest that C1/C2 heterozygous BMT recipients who
receive a transplant from a KIR2DS1 positive donor have a lower risk of developing
acute GvHD compared to the same transplant in a C1 homozygous recipient

Chapter 5
130
(McQueen et al, 2007). These findings have potentially important implications in the
selection of HSCT donors.

Chapter 6
131
Chapter 6
Final Discussion and Conclusions

Chapter 6
132
Chapter 6 Final Discussion and Conclusions
6.1 The Aims of this Thesis
Whilst it is clear that KIR recognise allelic epitopes present on class I HLA molecules,
there has not been a systematic survey to determine whether the common C1, C2 or
Bw4 positive HLA alleles bind to the expected KIR receptor. Therefore, in
haploidentical BMT, one cannot rely on HLA typing and KIR genotyping of the donor
and HLA typing of the recipient to predict the donor’s NK cells will be alloreactive
towards the recipient. The current protocol for selection of suitable donors for a given
recipient involves lengthy and labour intensive in vitro cloning of the donor’s NK cells to
determine whether they will lyse the recipient’s cells. A better understanding of HLA
and KIR interactions will enable selection of donors and recipient’s from HLA type and
KIR genotype.
6.2 Summary of New Data on HLA:KIR Interaction Provided in this Thesis
6.2.1 KIR2DL2/3 and HLA-C
The survey of common HLA-C alleles undertaken in chapter 3 suggests that the current
understanding of the interaction of HLA-C alleles with KIR2DL2 and KIR2DL3 requires
some revision. Consistent with current dogma, all C2 group alleles failed to inhibit, and
all C1 group alleles inhibited NK cells expressing KIR2DL3*002 to the same degree.
However, the NK cell line, YTS, transfected with KIR2DL3*001 was inhibited to
different degrees by different C1 group alleles. Furthermore, HLA-C*1402 and –C*1403
showed no inhibitory activity for NK cells expressing KIR2DL3*001 or KIR2DL2*001.
Whilst only amino acid 80 in the HLA-C molecule is thought to determine KIR2DL1,
KIR2DL2 and KIR2DL3 specificity, these studies suggest that other positions may
influence HLA-C affinity for KIR2DL2 and KIR2DL3.
Chapter 6
133
6.2.2 KIR3DL1 and Bw4
The survey of common HLA-B alleles undertaken in chapter 4 suggests that the current
understanding of the interaction of HLA-B alleles with KIR3DL1 requires some revision.
It was found that KIR3DL1 positive NK cells lysed target cells homozygous for all
common Bw6 positive HLA-B alleles as expected. Most Bw4 positive HLA-B alleles
inhibited NK cells expressing KIR3DL1 but HLA-B*1301 and –B*1302 were important
exceptions to this rule. The inability of HLA-B*13 to act as a ligand for KIR3DL1 was
confirmed by the inability of HLA-B*13 positive donors to make KIR3DL1 dependent
clones. There are 23 subtypes of HLA-B*13 and all but two subtypes (HLA-B*1303 and
–B*1304) share the lysine at position 145. This position, which is important in salt
bridge formation between KIR and HLA, encodes an arginine in all other HLA-B and
HLA-C alleles. HLA-B*1303 and –B*1304 also express an arginine at this position and
therefore may be expected to bind to KIR3DL1 whereas the other HLA-B*13 alleles
may not.
The controversy surrounding Bw4 positive HLA-A alleles was clarified. HLA-A*2402
and A*3201 clearly inhibited NK cells expressing KIR3DL1 and HLA-A*2402 positive
donors were shown to be capable of making KIR3DL1 dependent NK cells. HLA-
A*2301 and HLA-A*2501 did not appear to be ligands for KIR3DL1 although there was
a suggestion that this may be influenced by the particular KIR3DL1 allele in the case of
HLA-A*2301. 80I and 80T alleles were shown to inhibit equally well.
6.2.3 KIR2DS1 and C2 group HLA-C alleles
Until recently, NK alloreactivity has been attributed to the function of inhibitory KIR.
The ligands and biological function of activating KIR have been unclear. Chapter 5
described the activation of alloreactivity in KIR2DS1 positive NK clones by HLA-C
alleles with the C2 epitope. Such NK cells were only found in individuals whose HLA-C
alleles did not include the C2 epitope as might be predicted if autoaggression is to be
Chapter 6
134
avoided. KIR2DS1 dependent NK clones were shown to occur at a frequency of around
1% in such individuals. Furthermore, KIR2DS1 engagement with its ligand C2 could
override the inhibitory signal generated from NKG2A engagement with its ligand, HLA-
E.
6.3 Limitations to the Conclusions Drawn in this Thesis
The NK cell line, YTS, transfected with KIR2DL3*001 was used to screen the common
C1 group and C2 group HLA-C alleles and conclusions regarding the interaction of
KIR2DL3*001 with HLA-C alleles were based solely on this effector cell. The YTS
transfected cell line has undergone extensive laboratory culture and genetic
manipulation. Therefore it is possible that YTS-2DL3 may not function in exactly the
same way as an NK clone expressing the same allele even though the gene was re-
sequenced and shown not to be mutated. For that reason conclusions concerning the
function of KIR2DL3*001 should be replicated with NK clones expressing the same
receptor. During the course of these studies attempts to generate KIR2DL3*001
dependent NK clones were made but these were unsuccessful.
The conclusion that different alleles of KIR2DL2 and KIR2DL3 interact differently with
HLA-C*1402 were based on results from four NK clones and YTS-2DL3. It is possible
that although lysis of target cells expressing HLA-C*1402, appeared to correlate with
alleles of KIR2DL2 and KIR2DL3, this correlation may be purely coincidental and large
numbers of clones representing these receptors should be analysed. It is possible that
the differences observed between clones was due to other receptors that are
expressed on some NK clones and not others (eg NKG2A). These receptors could
modify responses on those particular clones. Target cells might inhibit NK cells
expressing NKG2A to varying degrees due to differences in HLA-E expression and the
interaction of NKG2A with HLA-E is known to be peptide dependent. Additional
examples of each KIR allele are required to confirm that different reactivities are due to
the allelic differences in the KIR receptors.

Chapter 6
135
While all but one Bw4 positive HLA-B allele tested was a ligand for KIR3DL1, there are
many other subtypes of each broad HLA-B allele that were not tested. It cannot be
assumed that each of these alleles will also be ligands for KIR3DL1. Likewise, HLA-
A*2402 was demonstrated to be a ligand for KIR3DL1, but it is not known whether
other HLA-A*24 subtypes interact with KIR3DL1. Similarly, not all alleles of KIR3DL1
were tested for their ability to interact with Bw4 and different alleles may interact to
differing degrees. In chapter 4 the following alleles were represented: KIR3DL1*001,
*002, *00501, *00501-like, *008, *01501 and *01502, although only KIR3DL1*01502,
*005 and the *005-like allele could be observed in isolation from the influence of other
alleles. Therefore only the ability of these alleles to interact with Bw4 is clear. Other
alleles of KIR3DL1 with appreciable population frequencies, such as KIR3DL1*007 and
*009, are yet to be assessed for their ability to interact with Bw4.
The results in chapter 5 demonstrated that NK clones expressing KIR2DS1*002 can
mediate NK alloreactivity. This study only investigated KIR2DS1*002 in detail and it is
not known whether the other alleles of KIR2DS1 will also interact with C2 to the same
degree (chapter 5.4). Similarly, a formal evaluation of the common C2 alleles was not
performed to assess their ability to interact with KIR2DS1. However in different
experiments, target cells expressing HLA-C*0202, -C*0401, -C*0501, -C*0602 and –
C*1502 all activated NK cells expressing KIR2DS1. These alleles account for the vast
majority of C2 alleles. The only other C2 allele with an appreciable population
frequency is HLA-C*1701.
The ability of a donor to generate alloreactive NK clones is routinely determined by NK
cloning and the chromium release assay. The preliminary data in chapters 4 and 5
suggest that the CD107a assay may be used to detect NK alloreactivity. However,
CD107a expression, a marker of NK cell degranulation, is associated with both
cytotoxicity and IFNγ secretion (Alter et al, 2004). Since IFNγ secretion may not be an

Chapter 6
136
effective alloresponse in a transplant setting, there is a need to distinguish cytokine
secretion from cytotoxicity. Alter and colleagues (2004) demonstrated that following
incubation of NK cells with class I HLA negative targets, CD107a expression correlated
quantatively with NK cell mediated lysis of the target cell using the chromium release.
They also showed that CD107a expression is associated with IFNγ production as less
than 1% of NK cells that secreted IFNγ did not co-express CD107a. However, although
CD107a was expressed both by cells secreting IFNγ and cytotoxic cells, the majority of
NK cells expressed CD107a without secreting IFNγ. Therefore whilst there was a
proportion of cells expressing CD107a that also secrete IFNy, the majority of CD107a
positive cells in that system were cytotoxic. It seems likely that this will also be the
situation in systems measuring KIR dependent alloreactivity, although this remains to
be proven.
The CD107a assay was used in chapter 4 to assess the ability of nine donors to
generate KIR3DL1 dependent NK clones. 2-3% of all NK cells were demonstrated to
be KIR3DL1 dependent, a frequency which correlates with the frequency of KIR3DL1
dependent cytotoxic clones determined by NK cloning and the chromium release assay
(Ruggeri at al, 2006). This supports the idea that the CD107a assay detects cytotoxic
allroeactive NK cells.
6.4 Further Studies
To enable accurate prediction of NK cell alloreactivity from KIR and HLA genetics it will
be necessary to catalogue each exception to the general rules. These studies have
investigated in detail the relationship between KIR3DL1 and Bw4 positive HLA alleles,
and between KIR2DL3 and C1-group HLA-C alleles. Further work is required to
document the interaction between different C1-group HLA-C alleles and KIR2DL2.
Whilst KIR2DL2*001, like KIR2DL3*001, was not inhibited by HLA-C*1402, it is not
clear how KIR2DL2*001 and other alleles of KIR2DL2 interact with the other C1 alleles.

Chapter 6
137
A systematic analysis of the interaction between KIR2DL1 and HLA-C alleles is also
required. It will be of interest to determine why HLA-C*1402 does not interact with
KIR2DL3*001 and KIR2DL2*001. Two polymorphisms in these receptors, one in the
stem and one in the cytoplasmic domain, may influence the interaction. Site-directed
mutagenesis of KIR2DL3*001 will enable the precise residue that determines the
degree of interaction between KIR and HLA-C to be determined. While HLA-C*1402
has no single amino acid that is unique among HLA-C alleles, site-directed
mutagenesis should reveal which amino acid or combination of amino acids influence
interaction with these KIR receptors.
NK clones dependent on KIR2DS1 were shown to mediate NK alloreactivity. The role
of the other activating KIR (KIR2DS2, KIR2DS3, KIR2DS4, KIR2DS5 and KIR3DS1) in
mediating alloreactivity is unknown. The study of the other activating KIR is
complicated by the lack of defined ligands for each of the receptors. It is believed that
C1 may act as a ligand for KIR2DS2, but no one (chapter 5.4) has been able to
demonstrate this interaction. Likewise, until very recently (Alter et al, 2007) no one has
been able to demonstrate a functional interaction between KIR3DS1 and Bw4.
Although the studies in this thesis could not detect KIR2DS2 or KIR3DS1 mediated NK
alloreactivity (considering C1 and Bw4 as their respective ligands), the possibility that
these activating KIR can mediate alloreactivity cannot be excluded. However it will first
be necessary to identify their ligands. When screening donors for NK alloreactivity
using the CD107a assay, any cytotoxicity that cannot be explained by known
receptor:ligand systems warrants further investigation. Investigation of these
alloreactive NK cells could reveal potential ligands for the other activating KIR.
6.5 Implications for Haploidentical HSCT
The findings in this thesis have several implications for the selection of donors for
haploidentical HSCT. KIR2DL3*001, KIR2DL3*002 and KIR2DL2*001 have been

Chapter 6
138
shown to interact differently with HLA-C*1402. This should be taken into consideration
when selecting donors. For example, donors who are homozygous for KIR2DL3*001
and express HLA-C*1402 as their only C1 ligand, may not generate NK clones
dependent on KIR2DL3 and therefore may not be capable of mounting an alloresponse
in vivo. Likewise, as demonstrated in chapter 4, donors who express HLA-B*1301 or
HLA-B*1302 as their only Bw4 positive HLA allele may not a significant number of
KIR3DL1-dependent NK clones and therefore would not be suitable donors to mediate
NK alloreactivity on the basis of Bw4 in vivo. On the other hand, recipients who
express HLA-B*1301 or HLA-B*1302 as their only Bw4 positive HLA allele could be
amenable to treatment with KIR3DL1 dependent alloreactive NK cells. Both HLA-
A*2402 and HLA-A*3201 appear to be strong ligands for KIR3DL1 and it has been
demonstrated that donors with HLA-A*2402 can generate KIR3DL1 dependent NK
clones (chapter 4.3.6). Therefore, expression of these Bw4 positive HLA-A alleles must
also be taken into consideration. HLA-A*2501 and HLA-A*2301 did not inhibit all alleles
of KIR3DL1 tested, and further investigation is still required to determine the interaction
of these alleles with different alleles of KIR3DL1 and therefore there influence on NK
alloreactivity.
Recipients whose HLA type includes all ligands (C1, C2 and Bw4) for the inhibitory KIR
are currently considered to be not amenable to treatment with alloreactive NK cells. as
any donor alloreactive NK cells. The finding that individuals who are homozygous for
the C1 epitope can generate KIR2DS1 dependent NK clones capable of lysing cells
expressing C2 suggests that these patients may actually be amenable to treatments
depending on NK alloreactivity. However, the ability to generate alloreactive NK cells
may not be an “all or nothing” phenomenon and it is not known how frequent
alloreactive clones must be in order to elicit a therapeutic effect in a stem cell
transplant. KIR2DS1 dependent NK clones represent only 1% of NK cells and it
remains to be seen if such small numbers of alloreactive NK cells can elicit a beneficial
alloresponse in a stem cell transplant.
Chapter 6
139
This thesis clarifies several aspects of the interaction of HLA alleles with KIR receptors
and will improve the ability of clinicians and scientists to more correctly identify suitable
donor and recipient pairs for haploidentical HSCT.

References
140
Chapter 7
References

References
141
Chapter 7 References
All author names are provided where there are fewer than 7: for 7 or more, the first 3
authors are listed followed by et al.
Alter, G., Malenfant, J. M. and Altfeld, M. (2004) CD107a as a functional marker for the
identification of natural killer cell activity J Immunol Methods 294(1-2): 15-22
Alter, G., Martin, M. P., Teigen, N., et al (2007) Differential natural killer cell-mediated
inhibition of HIV-1 replication based on distinct KIR/HLA subtypes J Exp Med 204(12):
3027-36
Andoniou, C. E., Andrews, D. M. and Degli-Esposti, M. A. (2006). Natural killer cells in
viral infection: more than just killers. Immunol Rev 214: 239-50.
Arnon, T. I., Achdout, H., Levi, O., et al. (2005). Inhibition of the NKp30 activating
receptor by pp65 of human cytomegalovirus. Nat Immunol 6(5): 515-23.
Arnon, T. I., Lev, M., Katz, G., Chernobrov, Y., Porgador, A. and Mandelboim, O.
(2001). Recognition of viral hemagglutinins by NKp44 but not by NKp30. Eur J
Immunol 31(9): 2680-9.
Atkinson, K., Cooley, M., Farrelly, H., O'Flaherty, E., Ashby, M. and Biggs, J. (1987).
CD4+ T cells appear capable of initiating graft-versus-host disease across non-major
histocompatibility complex (MHC) barriers in man. Bone Marrow Transplant 2(1): 79-
84.

References
142
Aversa, F., Tabilio, A., Velardi, A., et al. (1998) Treatment of high-risk acute leukemia
with T-cell-depleted stem cells from related donors with one fully mismatched HLA
haplotype N Engl J Med 339(17): 1186-93
Barnes, D. W., Corp, M. J., Loutit, J. F. and Neal, F. E. (1956). Treatment of murine
leukaemia with X rays and homologous bone marrow; preliminary communication. Br
Med J 2(4993): 626-7.
Bauer, S., Groh, V., Wu, J., et al. (1999). Activation of NK cells and T cells by NKG2D,
a receptor for stress-inducible MICA. Science 285(5428): 727-9.
Betts, M. and Russell, R. (2003). Amino acid properties and consequences of
subsitutions. Hoboken New Jersey, Wiley.
Biassoni, R.,Cantoni, C., Falco, M., et al. (1996) The human leukocyte antigen (HLA)-
C-specific "activatory" or "inhibitory" natural killer cell receptors display highly
homologous extracellular domains but differ in their transmembrane and
intracytoplasmic portions J Exp Med,183(2): 645-50
Biassoni, R., Pessino, A., Malaspina, A., et al. (1997). Role of amino acid position 70
in the binding affinity of p50.1 and p58.1 receptors for HLA-Cw4 molecules. Eur J
Immunol 27(12): 3095-9.
Bosi, G. and Griffiths, G. (1999). Degranulation plays an essential part in regulating
cell surface expression of Fas ligand in T cells and natural killer cells Nature Medicine
5: 90-96.
Bottino, C., Castriconi, R., Moretta, L. and Moretta, A. (2005). Cellular ligands of
activating NK receptors. Trends Immunol 26(4): 221-6.

References
143
Boyington, J. C., Motyka, S. A., Schuck, P., Brooks, A. G. and Sun, P. D. (2000).
Crystal structure of an NK cell immunoglobulin-like receptor in complex with its class I
MHC ligand. Nature 405(6786): 537-43.
Boyington, J. C. and Sun, P. D. (2002). A structural perspective on MHC class I
recognition by killer cell immunoglobulin-like receptors. Mol Immunol 38(14): 1007-21.
Braud, V. M., Allan, D. S., O'Callaghan, C. A., et al. (1998). HLA-E binds to natural
killer cell receptors CD94/NKG2A, B and C. Nature 391(6669): 795-9.
Brown, D., Trowsdale, J. and Allen, R. (2004). The LILR family: modulators of innate
and adaptive immune pathways in health and disease. Tissue Antigens 64(3): 215-25.
Buckley, R. (2003). Transplantation immunology: Organ and bone marrow Journal of
Allergy and Clinical Immunology 111: S733-44.
Burshtyn, D. N., Scharenberg, A. M., Wagtmann, N., et al. (1996). Recruitment of
tyrosine phosphatase HCP by the killer cell inhibitor receptor. Immunity 4(1): 77-85.
Butturini, A. and Gale, R. P. (1988). T cell depletion in bone marrow transplantation for
leukemia: current results and future directions. Bone Marrow Transplant 3(3): 185-92.
Carr, W. H., Pando, M. J. and Parham, P. (2005). KIR3DL1 polymorphisms that affect
NK cell inhibition by HLA-Bw4 ligand. J Immunol 175(8): 5222-9.
Cella, M., Longo, A., Ferrara, G. B., Strominger, J. L. and Colonna, M. (1994). NK3-
specific natural killer cells are selectively inhibited by Bw4-positive HLA alleles with
isoleucine 80. J Exp Med 180(4): 1235-42.

References
144
Chelvanayagam, G. (1996). A roadmap for HLA-A, HLA-B, and HLA-C peptide binding
specificities. Immunogenetics 45(1): 15-26.
Chewning, J. H., Gudme, C. N., Hsu, K. C., Selvakumar, A. and Dupont, B. (2007).
KIR2DS1-positive NK cells mediate alloresponse against the C2 HLA-KIR ligand group
in vitro. J Immunol 179(2): 854-68.
Ciccone, E., Viale, O., Pende, D., et al. (1988). Specific lysis of allogeneic cells after
activation of CD3- lymphocytes in mixed lymphocyte culture. J Exp Med 168(6): 2403-
8.
Ciccone, E., Colonna, M., Viale, O., et al. (1990) Susceptibility or resistance to lysis by
alloreactive natural killer cells is governed by a gene in the human major
histocompatibility complex between BF and HLA-B Proc Natl Acad Sci U S A 87 (24):
9794-7
Colonna, M., Spies, T., Strominger, J. L., et al. (1992) Alloantigen recognition by two
human natural killer cell clones is associated with HLA-C or a closely linked gene Proc
Natl Acad Sci U S A 89 (17): 7983-5
Colonna, M., Brooks, E. G., Falco, M., Ferrara, G. B. and Strominger, J. L. (1993).
Generation of allospecific natural killer cells by stimulation across a polymorphism of
HLA-C. Science 260(5111): 1121-4.
Colonna, M. and Samaridis, J. (1995) Cloning of immunoglobulin-superfamily members
associated with HLA-C and HLA-B recognition by human natural killer cells Science
268 (5209): 405-8
References
145
Colonna, M., Navarro, F., Bellon, T., et al. (1997). A common inhibitory receptor for
major histocompatibility complex class I molecules on human lymphoid and
myelomonocytic cells. J Exp Med 186(11): 1809-18.
Cudkowicz, G. and Bennett, M. (1971). Peculiar immunobiology of bone marrow
allografts. I. Graft rejection by irradiated responder mice. J Exp Med 134(1): 83-102.
D'Andrea, A., Chang, C., Franz-Bacon, K., McClanahan, T., Phillips, J. H. and Lanier,
L. L. (1995). Molecular cloning of NKB1. A natural killer cell receptor for HLA-B
allotypes. J Immunol 155(5): 2306-10.
Deng, L. and Mariuzza, R. A. (2006). Structural basis for recognition of MHC and
MHC-like ligands by natural killer cell receptors. Semin Immunol 18(3): 159-66.
Dicke K, van Hooft J, and van Bekkum D (1968) The selective elimination of
immunologically competent cells from bone marrow and lymphatic cell mixtures
Transplantation 6: 562-70
Dohring, C. and Colonna, M. (1996). Human natural killer cell inhibitory receptors bind
to HLA class I molecules. Eur J Immunol 26(2): 365-9.
Dohring, C., Scheidegger, D., Samaridis, J., Cella, M. and Colonna, M. (1996). A
human killer inhibitory receptor specific for HLA-A1,2. J Immunol 156(9): 3098-101.
Draghi, M., Yawata, N., Gleimer, M., Yawata, M., Valiante, N. M. and Parham, P.
(2005). Single-cell analysis of the human NK cell response to missing self and its
inhibition by HLA class I. Blood 105(5): 2028-35.

References
146
Farag, S. S., Fehniger, T. A., Ruggeri, L., Velardi, A. and Caligiuri, M. A. (2002) Natural
killer cell receptors: new biology and insights into the graft-versus-leukemia effect
Blood 100(6): 1935-47
Farrell, H., Degli-Esposti, M., Densley, E., Cretney, E., Smyth, M. and Davis-Poynter,
N. (2000) Cytomegalovirus MHC class I homologues and natural killer cells: an
overview Microbes Infect 2(5):521-32
Fan, Q. R., Long, E. O. and Wiley, D. C. (2001). Crystal structure of the human natural
killer cell inhibitory receptor KIR2DL1-HLA-Cw4 complex. Nat Immunol 2(5): 452-60.
Fan, Q. R., Mosyak, L., Winter, C. C., Wagtmann, N., Long, E. O. and Wiley, D. C.
(1997). Structure of the inhibitory receptor for human natural killer cells resembles
haematopoietic receptors. Nature 389(6646): 96-100.
Ferlazzo, G. and Munz, C. (2004). NK cell compartments and their activation by
dendritic cells. J Immunol 172(3): 1333-9.
Ferrara, J. L., Guillen, F. J., van Dijken, P. J., Marion, A., Murphy, G. F. and Burakoff,
S. J. (1989). Evidence that large granular lymphocytes of donor origin mediate acute
graft-versus-host disease. Transplantation 47(1): 50-4.
Ferrara, J. L., Levy, R. and Chao, N. J. (1999) Pathophysiologic mechanisms of acute
graft-vs.-host disease Biol Blood Marrow Transplant 5(6): 347-56
Gardiner, C. M., Guethlein, L. A., Shilling, H. G., et al. (2001). Different NK cell surface
phenotypes defined by the DX9 antibody are due to KIR3DL1 gene polymorphism. J
Immunol 166(5): 2992-3001.

References
147
Gavioli, R., Zhang, Q. J. and Masucci, M. G. (1996). HLA-A11-mediated protection
from NK cell-mediated lysis: role of HLA-A11-presented peptides. Hum Immunol 49(1):
1-12.
Gerosa, F., Baldani-Guerra, B., Nisii, C., Marchesini, V., Carra, G. and Trinchieri, G.
(2002). Reciprocal activating interaction between natural killer cells and dendritic cells.
J Exp Med 195(3): 327-33.
Ghayur, T., Seemayer, T. A., Kongshavn, P. A., Gartner, J. G. and Lapp, W. S. (1987).
Graft-versus-host reactions in the beige mouse. An investigation of the role of host and
donor natural killer cells in the pathogenesis of graft-versus-host disease.
Transplantation 44(2): 261-7.
Gumperz, J. E., Litwin, V., Phillips, J. H., Lanier, L. L. and Parham, P. (1995). The Bw4
public epitope of HLA-B molecules confers reactivity with natural killer cell clones that
express NKB1, a putative HLA receptor. J Exp Med 181(3): 1133-44.
Halfpenny, I. A., Middleton, D., Barnett, Y. A. and Williams, F. (2004). Investigation of
killer cell immunoglobulin-like receptor gene diversity: IV. KIR3DL1/S1. Hum Immunol
65(6): 602-12.
Hansen, J. A., Yamamoto, K., Petersdorf, E. and Sasazuki, T. (1999). The role of HLA
matching in hematopoietic cell transplantation. Rev Immunogenet 1(3): 359-73.
Herberman, R. B. (1986). Natural killer cells. Annu Rev Med 37: 347-52.
Hill, G. R. and Ferrara, J. L. (2000). The primacy of the gastrointestinal tract as a
target organ of acute graft-versus-host disease: rationale for the use of cytokine shields
in allogeneic bone marrow transplantation. Blood 95(9): 2754-9.

References
148
Horowitz, M. M., Gale, R. P., Sondel, P. M., et al. (1990). Graft-versus-leukemia
reactions after bone marrow transplantation. Blood 75(3): 555-62.
Karre, K., Ljunggren, H. G., Piontek, G. and Kiessling, R. (1986). Selective rejection of
H-2-deficient lymphoma variants suggests alternative immune defence strategy.
Nature 319(6055): 675-8.
Kagi, D., Vignaux, F., Ledermann, B, et al. (1994) Fas and perforin pathways as major
mechanisms of T cell-mediated cytotoxicity Science 265(5171): 528-30
Kernan, N. A., Bartsch, G., Ash, R. C., et al (1993) Analysis of 462 transplantations
from unrelated donors facilitated by the National Marrow Donor Program N Engl J Med
328(9): 593-602
Kiessling, R., Klein, E. and Wigzell, H. (1975). "Natural" killer cells in the mouse. I.
Cytotoxic cells with specificity for mouse Moloney leukemia cells. Specificity and
distribution according to genotype. Eur J Immunol 5(2): 112-7.
Kim, S., Poursine-Laurent, J., Truscott, S. M., et al. (2005). Licensing of natural killer
cells by host major histocompatibility complex class I molecules. Nature 436(7051):
709-13.
Lanier, L. L., Le, A. M., Civin, C. I., Loken, M. R. and Phillips, J. H. (1986) The
relationship of CD16 (Leu-11) and Leu-19 (NKH-1) antigen expression on human
peripheral blood NK cells and cytotoxic T lymphocytes. J Immunol 136(12): 4480-6
References
149
Lanier, L. L., Corliss, B. C., Wu, J., Leong, C. and Phillips, J. H. (1998).
Immunoreceptor DAP12 bearing a tyrosine-based activation motif is involved in
activating NK cells. Nature 391(6668): 703-7.
Lanier, L. L. and Phillips, J. H. (1992). Natural killer cells. Curr Opin Immunol 4(1): 38-
42.
Lazetic, S., Chang, C., Houchins, J. P., Lanier, L. L., and Phillips, J. H. (1996) Human
natural killer cell receptors involved in MHC class I recognition are disulfide-linked
heterodimers of CD94 and NKG2 subunits J Immunol 157(11): 4741-5
Litwin, V., Gumperz, J., Parham, P., Phillips, J. H. and Lanier, L. L. (1994). NKB1: a
natural killer cell receptor involved in the recognition of polymorphic HLA-B molecules.
J Exp Med 180(2): 537-43.
Ljunggren, H. G. and Karre, K. (1990). In search of the 'missing self': MHC molecules
and NK cell recognition. Immunol Today 11(7): 237-44.
Lopez-Botet, M., Bellon, T., Llano, M., Navarro, F., Garcia, P. and de Miguel, M.
(2000). Paired inhibitory and triggering NK cell receptors for HLA class I molecules.
Hum Immunol 61(1): 7-17.
Martin A, Kulski J, Witt C, Pontarotti P and Christiansen F (2002). Leukocyte Ig-like
receptor complex (LRC) in mice and men. Trends in Immunology 23(2): 81-88.
Martin, M. P., Gao, X., Lee, J. H., et al (2002) Epistatic interaction between KIR3DS1
and HLA-B delays the progression to AIDS Nat. Genet. 31(4): 429-34

References
150
Maenaka, K., Juji, T., Stuart, D. I. and Jones, E. Y. (1999). Crystal structure of the
human p58 killer cell inhibitory receptor (KIR2DL3) specific for HLA-Cw3-related MHC
class I. Structure 7(4): 391-8.
Mandelboim, O., Lieberman, N., Lev, M., et al. (2001). Recognition of haemagglutinins
on virus-infected cells by NKp46 activates lysis by human NK cells. Nature 409(6823):
1055-60.
Mandelboim, O., Reyburn, H. T., Vales-Gomez, M., et al. (1996). Protection from lysis
by natural killer cells of group 1 and 2 specificity is mediated by residue 80 in human
histocompatibility leukocyte antigen C alleles and also occurs with empty major
histocompatibility complex molecules. J Exp Med 184(3): 913-22.
Matzinger, P. (1997). The immune system's role in graft loss: theoretic considerations.
Transplant Proc 29(8A): 11S-12S.
McQueen, K. L., Dorighi, K. M., Guethlein, L. A., Wong, R., Sanjanwala, B. and
Parham, P. (2007). Donor-recipient combinations of group A and B KIR haplotypes
and HLA class I ligand affect the outcome of HLA-matched, sibling donor
hematopoietic cell transplantation. Hum Immunol 68(5): 309-23.
Meyaard, L., Adema, G. J., Chang, C., et al. (1997). LAIR-1, a novel inhibitory receptor
expressed on human mononuclear leukocytes. Immunity 7(2): 283-90.
Middleton, D., Curran, M. and Maxwell, L. (2002). Natural killer cells and their
receptors. Transpl Immunol 10(2-3): 147-64.

References
151
Miller, J. S., Soignier, Y., Panoskaltsis-Mortari, A., et al. (2005). Successful adoptive
transfer and in vivo expansion of human haploidentical NK cells in patients with cancer.
Blood 105(8): 3051-7.
Moretta, A., Bottino, C., Pende, D., et al. (1990) Identification of four subsets of human
CD3-CD16+ natural killer (NK) cells by the expression of clonally distributed functional
surface molecules: correlation between subset assignment of NK clones and ability to
mediate specific alloantigen recognition J Exp Med 172 (6): 1589-98
Moretta, A., Vitale, M., Bottino, C., et al. (1993) P58 molecules as putative receptors for
major histocompatibility complex (MHC) class I molecules in human natural killer (NK)
cells. Anti-p58 antibodies reconstitute lysis of MHC class I-protected cells in NK clones
displaying different specificities J Exp Med 178(2): 597-604
Moretta, A., Sivori, S., Vitale, M., et al. (1995). Existence of both inhibitory (p58) and
activatory (p50) receptors for HLA-C molecules in human natural killer cells. J Exp
Med 182(3): 875-84.
Moretta, L., Biassoni, R., Bottino, C., Mingari, M. C. and Moretta, A. (2000) Human NK-
cell receptors Immunol Today 21(9): 420-2
Muller, C. A., Engler-Blum, G., Gekeler, V., Steiert, I., Weiss, E. and Schmidt, H.
(1989). Genetic and serological heterogeneity of the supertypic HLA-B locus
specificities Bw4 and Bw6. Immunogenetics 30(3): 200-7.
Murphy, W. J., Kumar, V. and Bennett, M. (1987). Rejection of bone marrow allografts
by mice with severe combined immune deficiency (SCID). Evidence that natural killer
cells can mediate the specificity of marrow graft rejection. J Exp Med 165(4): 1212-7.
References
152
Norman, P. J., Abi-Rached, L., Gendzekhadze, K., et al. (2007). Unusual selection on
the KIR3DL1/S1 natural killer cell receptor in Africans. Nat Genet 39(9): 1092-9.
O'Connor, G. M., Guinan, K. J., Cunningham, R. T., Middleton, D., Parham, P. and
Gardiner, C. M. (2007). Functional polymorphism of the KIR3DL1/S1 receptor on
human NK cells. J Immunol 178(1): 235-41.
Pando, M. J., Gardiner, C. M., Gleimer, M., McQueen, K. L. and Parham, P. (2003).
The protein made from a common allele of KIR3DL1 (3DL1*004) is poorly expressed at
cell surfaces due to substitution at positions 86 in Ig domain 0 and 182 in Ig domain 1.
J Immunol 171(12): 6640-9.
Pende, D., Biassoni, R., Cantoni, C., et al. (1996). The natural killer cell receptor
specific for HLA-A allotypes: a novel member of the p58/p70 family of inhibitory
receptors that is characterized by three immunoglobulin-like domains and is expressed
as a 140-kD disulphide-linked dimer. J Exp Med 184(2): 505-18.
Peruzzi, M., Wagtmann, N. and Long, E. O. (1996) A p70 killer cell inhibitory receptor
specific for several HLA-B allotypes discriminates among peptides bound to HLA-
B*2705 J Exp Med 184 (4): 1585-90
Petersdorf, E. W., Mickelson, E. M., Anasetti, C., Martin, P. J., Woolfrey, A. E. and
Hansen, J. A. (1999) Effect of HLA mismatches on the outcome of hematopoietic
transplants Curr Opin Immunol 11(5): 521-6
Poynton, C. H. (1988). T cell depletion in bone marrow transplantation. Bone Marrow
Transplant 3(4): 265-79.

References
153
Raulet, D. H., Vance, R. E. and McMahon, C. W. (2001). Regulation of the natural
killer cell receptor repertoire. Annu Rev Immunol 19: 291-330.
Reddy, P. and Ferrara, J. L. (2003). Immunobiology of acute graft-versus-host
disease. Blood Rev 17(4): 187-94.
Rhoades, J. L., Cibull, M. L., Thompson, J. S., et al. (1993) Role of natural killer cells in
the pathogenesis of human acute graft-versus-host disease Transplantation 56 (1):
113-20
Riddell, S. R., Berger, C., Murata, M., Randolph, S. and Warren, E. H. 2003 The graft
versus leukemia response after allogeneic hematopoietic stem cell transplantation
Blood Rev 17(3): 153-62
Robinson, J., Waller, M. J., Parham, P., et al. (2003). IMGT/HLA and IMGT/MHC:
sequence databases for the study of the major histocompatibility complex. Nucleic
Acids Res 31(1): 311-4.
Roitt I, Brostoff J and Male, D (2001) Immunology. London, Harcourt Publishers
Rojo, S., Wagtmann, N. and Long, E. O. (1997). Binding of a soluble p70 killer cell
inhibitory receptor to HLA-B*5101: requirement for all three p70 immunoglobulin
domains. Eur J Immunol 27(2): 568-71.
Ruggeri, L., Capanni, M., Casucci, M., et al. (1999). Role of natural killer cell
alloreactivity in HLA-mismatched hematopoietic stem cell transplantation. Blood 94(1):
333-9.

References
154
Ruggeri, L., Capanni, M., Urbani, E., et al. (2002). Effectiveness of donor natural killer
cell alloreactivity in mismatched hematopoietic transplants. Science 295(5562): 2097-
100.
Ruggeri, L., Mancusi, A., Burchielli, E., et al. (2006). Natural killer cell recognition of
missing self and haploidentical hematopoietic transplantation. Semin Cancer Biol
16(5): 404-11.
Saulquin, X., Gastinel, L. N. and Vivier, E. (2003). Crystal structure of the human
natural killer cell activating receptor KIR2DS2 (CD158j). J Exp Med 197(7): 933-8.
Seaman, W. E. (2000). Natural killer cells and natural killer T cells. Arthritis Rheum
43(6): 1204-17.
Shlomchik, W. D., Couzens, M. S., Tang, C. B., et al. (1999). Prevention of graft
versus host disease by inactivation of host antigen-presenting cells. Science
285(5426): 412-5.
Sivori, S., Pende, D., Bottino, C., et al. (1999) NKp46 is the major triggering receptor
involved in the natural cytotoxicity of fresh or cultured human NK cells. Correlation
between surface density of NKp46 and natural cytotoxicity against autologous,
allogeneic or xenogeneic target cells Eur J Immunol 29 (5): 1656-66
Snell, G. D. (1976). Recognition structures determined by the H-2 complex.
Transplant Proc 8(2): 147-56.
Spits, H., Lanier, L. L. and Phillips, J. H. (1995). Development of human T and natural
killer cells. Blood 85(10): 2654-70.

References
155
Stewart, C. A., Laugier-Anfossi, F., Vely, F., et al. (2005). Recognition of peptide-MHC
class I complexes by activating killer immunoglobulin-like receptors. Proc Natl Acad
Sci U S A 102(37): 13224-9.
Storkus, W. J., Howell, D. N., Salter, R. D., Dawson, J. R. and Cresswell, P. (1987) NK
susceptibility varies inversely with target cell class I HLA antigen expression J Immunol
138 (6): 1657-9
Storkus, W. J., Salter, R. D., Alexander, J., Ward, et al. (1991) Class I-induced
resistance to natural killing: identification of nonpermissive residues in HLA-A2 Proc
Natl Acad Sci U S A 88 (14): 5989-92
Sun, J.Y., Galdulis, L., Miller, M.M., et al (2004) Development of a multiplex PCR-SSP
method for Killer-cell immunoglobulin-like receptor genotyping Tissue Antigens 64:
462-68
Suto, Y., Ishikawa, Y., Kasahara, M., et al. (1998). Gene arrangement of the killer cell
inhibitory receptor family on human chromosome 19q13.4 detected by fiber-FISH.
Immunogenetics 48(4): 235-41.
Sviland, L. (2000). The Pathology of Bone Marrow Transplantation. Current
Diagnostic Pathology 6: 242-250.
Tabbara, I. A., Zimmerman, K., Morgan, C. and Nahleh, Z. (2002) Allogeneic
hematopoietic stem cell transplantation: complications and results Arch Intern Med
162(14): 1558-66
References
156
Thananchai, H., Gillespie, G., Martin, M. P., et al. (2007). Cutting Edge: Allele-specific
and peptide-dependent interactions between KIR3DL1 and HLA-A and HLA-B. J
Immunol 178(1): 33-7.
Trinchieri, G. (1995). Natural killer cells wear different hats: effector cells of innate
resistance and regulatory cells of adaptive immunity and of hematopoiesis. Semin
Immunol 7(2): 83-8.
Uhrberg, M., Valiante, N. M., Shum, B. P., et al. (1997). Human diversity in killer cell
inhibitory receptor genes. Immunity 7(6): 753-63.
Uphoff, D. E. (1958). Perclusion of secondary phase of irradiation syndrome by
inoculation of fetal hematopoietic tissue following lethal total-body x-irradiation. J Natl
Cancer Inst 20(3): 625-32.
Vales-Gomez, M., Reyburn, H. T., Erskine, R. A., Lopez-Botet, M. and Strominger, J. L.
(1999). Kinetics and peptide dependency of the binding of the inhibitory NK receptor
CD94/NKG2-A and the activating receptor CD94/NKG2-C to HLA-E. Embo J 18(15):
4250-60.
Vales-Gomez, M., Reyburn, H. T., Erskine, R. A. and Strominger, J. (1998).
Differential binding to HLA-C of p50-activating and p58-inhibitory natural killer cell
receptors. Proc Natl Acad Sci U S A 95(24): 14326-31.
Valiante, N. M., Uhrberg, M., Shilling, H. G., et al. (1997). Functionally and structurally
distinct NK cell receptor repertoires in the peripheral blood of two human donors.
Immunity 7(6): 739-51.

References
157
Vilches, C., Pando, M. J. and Parham, P. (2000a). Genes encoding human killer-cell
Ig-like receptors with D1 and D2 extracellular domains all contain untranslated
pseudoexons encoding a third Ig-like domain. Immunogenetics 51(8-9): 639-46.
Vilches, C. and Parham, P. (2002). KIR: diverse, rapidly evolving receptors of innate
and adaptive immunity. Annu Rev Immunol 20: 217-51.
Vilches, C., Rajalingam, R., Uhrberg, M., Gardiner, C. M., Young, N. T. and Parham, P.
(2000b). KIR2DL5, a novel killer-cell receptor with a D0-D2 configuration of Ig-like
domains. J Immunol 164(11): 5797-804.
Vivier, E. (2006). What is natural in natural killer cells? Immunol Lett 107(1): 1-7.
Wagtmann, N., Biassoni, R., Cantoni, C., et al (1995) Molecular clones of the p58 NK
cell receptor reveal immunoglobulin-related molecules with diversity in both the extra-
and intracellular domains Immunity 2 (5): 439-49
Warren, E. H., Greenberg, P. D. and Riddell, S. R. (1998). Cytotoxic T-lymphocyte-
defined human minor histocompatibility antigens with a restricted tissue distribution.
Blood 91(6): 2197-207.
Watzl, C. (2003). The NKG2D receptor and its ligands-recognition beyond the "missing
self"? Microbes Infect 5(1): 31-7.
Weiden, P. L., Flournoy, N., Thomas, E. D., et al. (1979). Antileukemic effect of graft-
versus-host disease in human recipients of allogeneic-marrow grafts. N Engl J Med
300(19): 1068-73.

References
158
Weiden, P. L., Sullivan, K. M., Flournoy, N., Storb, R. and Thomas, E. D. (1981).
Antileukemic effect of chronic graft-versus-host disease: contribution to improved
survival after allogeneic marrow transplantation. N Engl J Med 304(25): 1529-33.
Winter, C. C., Gumperz, J. E., Parham, P., Long, E. O. and Wagtmann, N. (1998).
Direct binding and functional transfer of NK cell inhibitory receptors reveal novel
patterns of HLA-C allotype recognition. J Immunol 161(2): 571-7.
Winter, C. C. and Long, E. O. (1997). A single amino acid in the p58 killer cell
inhibitory receptor controls the ability of natural killer cells to discriminate between the
two groups of HLA-C allotypes. J Immunol 158(9): 4026-8.
Witt, C. S., Dewing, C., Sayer, D. C., Uhrberg, M., Parham, P. and Christiansen, F. T.
(1999). Population frequencies and putative haplotypes of the killer cell
immunoglobulin-like receptor sequences and evidence for recombination.
Transplantation 68(11): 1784-9.
Yawata, M., Yawata, N., Draghi, M., Little, A. M., Partheniou, F. and Parham, P.
(2006). Roles for HLA and KIR polymorphisms in natural killer cell repertoire selection
and modulation of effector function. J Exp Med 203(3): 633-45.
Yabe, T., McSherry, C., Bach, F. H., et al. (1993) A multigene family on human
chromosome 12 encodes natural killer-cell lectins Immunogenetics 37(6): 455-60
Yokoyama, W. M. (1998). Natural killer cell receptors. Curr Opin Immunol 10(3): 298-
305.

Appendices
159
Appendices
Appendix 1: Solutions and Buffers
Appendix 2: Antibodies
Appendix 3: Primer Sequences

Appendices
160
Appendix 1 Solutions and Buffers
Cell Lines and Tissue Culture
Heat Inactivated Foetal Calf Serum (FCS).
FCS (ThermoTrace, Melbourne AUS) was incubated at 56°C with shaking for 30
minutes, aliquoted and stored at –20°C.
2-Mercaptoethanol (2-ME)
2-ME (ICN Biochemicals, OH USA) was diluted 1:250 in RPMI and stored at –20°C. A
1:1000 dilution of this stock was then added to Iscoves's Modified Dulbecco's Medium
(IMDM) and NK cell culture medium.
RPMI 1640
RPMI 1640 (Invitrogen, Carlsbad USA) supplemented with 500U/mL penicillin,
500μg/mL streptomycin, 2mM L-glutamine and 10% sterile FCS.
Iscoves's Modified Dulbecco's Medium (IMDM)
IMDM (1X) (Invitrogen, Carlsbad USA), liquid contains L-glutamine, 25mM HEPES
buffer, 3,024 mg/L sodium bicarbonate, supplemented with 2-ME and 1μg/mL
puromycin for transfectants.
NK Cell Culture Medium
RPMI 1640 supplemented with 500U/mL penicillin, 500μg/mL streptomycin, 2mM L-
glutamine, 0.1mM non-essential amino acids, 1mM pyruvate, 2-ME and 10% sterile
FCS.
Appendices
161
1 x PBS
17g NaCl, 2.68g Na2HPO42H2O (disodium hydrogen orthophosphate) and 0.78g
NaH2PO42H2O (sodium dihydrogen orthophosphate) were dissolved in 2L MilliQ water
and the pH adjusted to 7.2. Stored at room temperature.
Freezing Medium
Freezing medium was always made freshly with 10% DMSO (BDH, Poole UK) added
to 90% heat-inactivated FCS. Added to the cells drop-wise and always on ice.
Trypan Blue
0.5g Trypan Blue (ICN Biochemicals, Ohio USA) was dissolved in 100mL 1 x PBS. The
solution was sterilised using a 0.22μM filter and stored at room temperature.
Immunophenotyping
Flow Buffer 1%FCS and 0.2% sodium azide was mixed with 1 x PBS to make flow buffer and
stored at 4°C
4% Paraformaldehyde
4g of paraformaldehyde were dissolved in 100mL 1xPBS at 65°C with gentle shaking
to dissolve. Stored at 4°C.
Cytotoxicity Reagents
51Cr (Amersham, Buckinghamshire UK)
74MBq (2mCi) 51-Chromium sodium chromate in a sodium chloride solution was
stored at 4°C and used for up to 12 weeks.

Appendices
162
Triton X-100 (SigmaUltra, USA)
Triton X-100 was diluted 1 in 1000 in distilled water to obtain 0.1% Triton X-100.
PCR Reagents
40mM deoxynucleotide triphosphates (dNTPs) (Invitrogen, CA USA) 40mM dNTPs dATP 200μl dCTP 200μl dGTP 200μl dTTP 200μl Sterile Water 1200μl Total Volume 2000μl PCR Buffer Stock Solutions 1 M MgCl2 20.3g MgCl2.6H2O in 100ml sterile deionised water 1M Tris-HCl 60.6g Trizma Base in 500ml + concentrated HCl to
pH8.3 1 M KCl 37.3g KCl in 500ml sterile deionised water 20mg/ml gelatin 2g gelatin in 100ml sterile deionised water 10 x PCR Buffer (25mM MgCl2)
Stock Solution Volume of Stock Solution (mL)
Final Concentration of Stock
1 M MgCl2 0.625 25mM 1 M Tris-HCl (pH8.3) 2.5 100mM 1 M KCl 12.5 500mM 20mg/ml gelatin 0.125 0.1mg/ml Sterile deionised water 9.25 Total 25
10 x PCR Buffer (20mM MgCl2)
Stock Solution Volume of Stock
Solution (mL) Final Concentration of
Stock 1 M MgCl2 0.5 20mM 1 M Tris-HCl (pH8.3) 2.5 100mM 1 M KCl 12.5 500mM 20mg/mL gelatin 0.125 0.1mg/mL Sterile deionised water 9.38 Total 25

Appendices
163
0.5 x TBE 10 x TBE was initially prepared as follows: 215.6g of Trizma Base was added to 110g
of boric acid and 16.4g of EDTA. This was then diluted 1 in 20 to make 0.5 x TBE.
1% Agarose Gel
4g of agarose (Invitrogen, CA USA) was added to 400mL 0.5 x TBE. The agarose was
dissolved by heating in a microwave for 7 minutes. After heating 40ul of ethidium
bromide was added.
Type IV DNA Loading Buffer
5g of Ficoll 400 (Amersham Pharmacia Biotech, Sweden) and 400μl of 0.25%
bromophenol blue were dissolved in 10mL of sterile distilled water.
1kb Plus Lambda Ladder
1mL of 1kb Plus DNA ladder (Invitrogen, CA USA) was added to 2mL of Type IV DNA
loading buffer and 7mL of sterile, deionised water.

Appendices
164
Appendix 2 Antibodies
Antibody Fluorochrome Isotype Clone Dilution Concentration Supplier Use CD56 PC5 IgG1 N901(NKH1) 1/20 - Beckman Coulter Phenotyping CD56 PeCy7 IgG1 B159 1/40 - BD Biosciences CD107a assay CD158a PE IgG1 EB6B 1/10 - Beckman Coulter Phenotyping CD158b PE IgG1 GL183 1/10 - Beckman Coulter Phenotyping CD158a APC IgG1 EB6B 1/25 - Beckman Coulter CD107a assay CD158b APC IgG1 GL183 1/25 - Beckman Coulter Phenotyping/CD107a Assay CD158a PE IgM HP-3E4 1/10 - BD Biosciences Phenotyping/CD107a Assay CD158b PE IgG2B CH-L 1/10 - BD Biosciences Phenotyping/CD107a Assay CD158e PE IgG1 z27.3.7 1/10 - Beckman Coulter Phenotyping NKB1 PE IgG1 DX9 1/10 - BD Biosciences Phenotyping/CD107a Assay NKG2A PE IgG2b z199 1/20 - Beckman Coulter Phenotyping ILT-2 PE IgG2b GH1/75 1/10 - BD Biosciences Phenotyping W6/32 unconjugated IgG2a - neat - gift from McCluskey HLA expression Bw4 unconjugated IgG2a - neat - gift from McCluskey HLA expression Bw6 unconjugated IgG2a - neat - gift from McCluskey HLA expression CD158a unconjugated IgM HP-3E4 1/100 10μg/ml BD Biosciences Receptor blocking CD158b unconjugated IgG2B CH-L 1/500 2μg/ml BD Biosciences Receptor blocking Q66 unconjugated IgM Q66 neat - gift from Pende Phenotyping/receptor blocking NKB1 unconjugated IgG1 DX9 1/400 2.5μg/ml BD Biosciences Receptor blocking NKG2A unconjugated IgG2b z199 1/100 10μg/ml gift from M. Lopez-Botet Receptor blocking IgG isotype IgG1 679.1Mc7 1/20 - Beckman Coulter Isotype control IgG FITC IgG 1/100 - Chemicon Secondary antibody IgG isotype IgG1 1/100 10μg/ml eBiosciences Receptor blocking IgG2a isotype IgG2a 7T4-1F5 1/100 - Beckman Coulter Isotype control IgG2b unconjugated IgG2b 1/100 10μg/ml eBiosciences Receptor blocking IgM isotype IgM GC323 1/100 - Beckman Coulter Isotype control IgM isotype IgM 1/100 10μg/ml eBiosciences Receptor blocking IgM PE IgM GC323 1/100 - Beckman Coulter Secondary antibody CD107a FITC IgG1 H4A3 1/20 - BD Biosciences CD107a assay

Appendices
165
Appendix 3 – Primer Sequences
Primer Sequence 5' - 3' Target Sequence Reference KIR2DL3F CACCATGTCGCTCATGGTCGTCAGC full length KIR2DL3 cDNA In house KIR2DL3R CAGGAAACAGCTATGACCCAGGACAACTTTGGATCA SSP reverse primer Uhberg et al, 1997 KIR2DL2F CACCATGTCGCTCATGGTCGTCAGC full length KIR2DL2 cDNA In house KIR2DL2R CAGGAGACAACTTTGGATCTGGA full length KIR2DL2 cDNA In house KIR2DS1F TGTAAAACGACGGCCAGTATGTCGCTCAYGGTCGTC full length KIR2DS1 cDNA In house KIR2DS1R CAGGAAACAGCTATGACCGTGAAAACACAGTGATCCAA full length KIR2DS1 cDNA In house KIR2DS1(D)F TGTAAAACGACGGCCAGTTCTCCATCAGTCGCATGAR SSP primer used for genomic DNA Uhberg et al, 1997 KIR2DS1(D)R CAGGAAACAGCTATGACCAGGGCCCAGAGGAAAGTT SSP primer used for genomic DNA Uhberg et al, 1997 KIR2DL1(R)F TGTAAAACGACGGCCAGTGCAGCACCATGTCGCTCT SSP primer used for cDNA Uhberg et al, 1997 KIR2DL1(R)R CAGGAAACAGCTATGACCGTCACTGGGAGCTGACAC SSP primer used for cDNA Uhberg et al, 1997 3DL13D0F TGTAAAACGACGGCCAGTCTTCTGGGCACTGGGAGT KIR3DL1 exon 3 Norman et al, 2007 3DL13D0R CAGGAAACAGCTATGACCACAGTGAGAAGCCCAGACG KIR3DL1 exon 3 Norman et al, 2007 3DL14D1F TGTAAAACGACGGCCAGTAGGAGAGAGACAGACACG KIR3DL1 exon 4 Norman et al, 2007 3DL14D1R CAGGAAACAGCTATGACCTGTCCCAGTGACAATGAGAAC KIR3DL1 exon 4 Norman et al, 2007 3DL15D2F TGTAAAACGACGGCCAGTAAAGGTAGAAGGAGGAAACAGAT KIR3DL1 exon 5 Norman et al, 2007 3DL15D2R CAGGAAACAGCTATGACCGGAAGCTCCTTAGCTAAGGATT KIR3DL1 exon 5 Norman et al, 2007 3DL17-9F TGTAAAACGACGGCCAGTCTTGTCCGAAAGAGATGCTGTAA KIR3DL1 exons 7-9 Norman et al, 2007 3DL17-9R CAGGAAACAGCTATGACCAAGCAAGAGAGAGGCACCA KIR3DL1 exons 7-9 Norman et al, 2007 M13F TGTAAAACGACGGCCAG sequence tags In house M13R CAGGAAACAGCTATGAC sequence tags In house HGHI CAGTGCCTTCCCAACCATTCCCTTA internal primers for KIR SSP In house HGHII ATCCACTCACGGATTTCTGTTGTGTTTC internal primers for KIR SSP In house

Appendices
166