the impact of the introduction of …shodhganga.inflibnet.ac.in/bitstream/10603/29475/15/15_chapter...
TRANSCRIPT
THE IMPACT OF THE INTRODUCTION OFCOMPOUNDING IN AGRICULTURAL INCOME TAX ON
TAXATION OF AGRICULTURAL SECTOR
Johnson Thomas “Agricultural taxation in Kerala: A study of the performance and cost effectiveness” Thesis. Department of Economics, Dr. John Matthai Centre, University of Calicut, 2004
CHAPTER V11 THE IMPACT OF THE INTRODUCTION OF
COMPOUNDING IN AGRICULTURAL INCOME TAX ON TAXATION OF AGRICULTURAL SECTOR
7.1 Introduction
Many changes have taken place recently in the tax laws of the agricultural
sector. Here we make an attempt to assess the impact of these changes on the
performance of agricultural taxes in Kerala. The most important change was the
introduction of compounding in the Agricultural Income tax. Agricultural Income
Tax Act 1991 permitted the cultivators to opt for compounding for the purpose of
Agricultural Income Tax. In that case tax liability of the cultivators would be
assessed on the basis of the size of holding and crop cultivated.
Report of the Committee on Taxation of Agricultural Wealth and Income
(Raj Committee Report) had suggested the introduction of Agricultural holdings
tax (AHT) as far back in 1972. This was an attempt to assess the tax liability of the
cultivator on the basis of the rateable value of his holding. (Details of the
recommendations are given in Chapter 11).
The Committee for Restructuring Agricultural Income Tax Laws in 1988
appointed by the Kerala state Government (Kaleeswaran Committee) went in
detail to the way the proposed tax law should be fiamed to facilitate the
agricultural sector to pay agricultural income tax on the basis of the size of holding
of a cultivator and crop cultivated in the land (Details of the recommendations are
given in Chapter 11). Any one who possessed 20 hectares of land could opt for this
and all who possessed 3 or more than 3 standard hectares of land had to pay
Agricultural Income Tax.
The content of the Act 1991 was much different fiom the above two Reports
and this difference had its impact on Agricultural Income tax collection. First we
would give a brief account of the content of the Act and then a comparison among
the three documents. This is necessary to assess the impact of the introduction of
compounding and after on the tax collection fiom the agricultural sector in Kerala.
7.2.1 Act 15 of 1991: The Kerala Agricultural Income Tax Act 1991
Act 150f 1991 namely The Kerala Agricultural Income Tax Act 1991 led to
the compounding of agricultural income for tax purpose. Important provisions of
the Act are given below.
Assessee is defined to be a person by whom any tax or any other sum of
money is payable. Any person who holds landed property within the state
extending to not more than twenty hectares and deriving agricultural income will
be permitted to compound the agricultural income and pay tax as per the given
rates. The permission once granted will be in force for three years unless opted
otherwise by the assessee.
Crops such as paddy, tapioca, plantain, ginger, ragi, pulses, sesamum,
vegetable, sweet potato, tubers, sugarcane, jack, mango, pine apple, orchid,
vanilla, turmeric and guava are exempted from tax. Also identified the following
crops such as Coffee, cardamom, cashew, tea, pepper, clove, cinchona, nutmug,
cinnamon, coconut, rubber, cocoa, and arecanut as those that are to pay
agricultural Income Tax.
No tax is payable by any crop on the first 3 hectares of cultivation. No tax
payable on the replanted area till the plants in this area starts yielding. When there
is change in the extent of land during the previous year the maximum extent of

land held for not less than 180 days during the previous year shall be deemed to be
the extent of land held during the previous year.
Agricultural Income Tax Officer has to satisfjr himself and then permit the
application for deductions. People who were compounding their income can re-opt
to the income based tax system under certain conditions.
Charitable or religion institutions with more than 20 hectares also can go for
compounding (Section 13.7). There are provisions in the Act to exempt these
institutions (section 1 6) from Agricultural Income Tax.
Any person who is permitted to pay compounding of tax be exempted from
paying plantation tax. When there are more than one crop in a land the principal
crop will be the basis for the tax. There is provision for saving the tax payee fiom
double taxation (section 15):
Any person who is a partner of a firm, or member of an association of person
or body of individuals is not liable to pay tax on the share of agricultural income
which he received fiom such firm as a partner or member of such association of
persons or body of individuals on which tax was levied and paid by such firm,
association of persons or body of individuals under certain conditions. Tax
payable on such total agricultural income shall be calculated in accordance with
the provisions of this Act after deducting the share of tax payable by him as
partner or member out of the tax levied on the agricultural income of such firm.
Government. has the power to change the tax rate, allow exemption etc. by
notification in the Gazette. Income of individual is to include income of spouse,
minor child etc. Rate structure of the tax etc., are given in the next section.
7.2.2 Assessment of the Act in the light of the Reports of the Committees, which recommended compounding
Kaleeswaran Committee, which recommended compounding of income up to
20 standard hectares of land was influenced by Raj Committee Report's concept of
AHT (Agricultural Holdings Tax). Kaleeswaran Committee Report was supposed
to be the reference point of the Agricultural income Tax Act 199 1. But a close
scrutiny of the three documents reveals that the Agricultural income Tax Act 199 1
absorbed only very little fiom the above mentioned studies, which were more
professional and academic in their nature and approach. Kaleeswaran Committee
Report though more bureaucratic in its content tried to be as rational as possible as
the Raj Committee Report. The Agricultural income Tax Act 1991, had diluted
many of the recommendations of the official committees and were more political
in its content. Let us consider some major areas of departures and which have a
direct bearing on the Agricultural Income tax system and tax collection.
Raj Committee wanted to classifj every holding on the basis of productivity
and crops grown in a region and estimate its income considering variations in
price. Agricultural holdings with a rateable value of Rs. 6001- or above in 1972
would be assessed and an appropriate rate would be applied to find out the taxes to
be paid by each holding. There are strict norms for arriving at the rateable value
of each holding (pp 106, 107 and 108). This led to a lot of complexities and
arbitrariness. In order to make assessment simpler Kaleeswaran Committee tried
to standardize each holding on the basis of the crops grown and difference in the
productivity of land in various regions (for cardamom). The Committee
recommended two systems of taxes -
One, compounding of income up to 20 standard hectares. Here income is not
assessed but a rate is fixed assuming a given income fiom every standard hectare
of land on the basis of the type of crop cultivated and second, income based

assessment for holdings above 20 standard hectares and for companies, other
corporate bodies and co-operative societies. .
The Agricultural Income Tax Act 1991 changed the concept of standard
hectares to ordinary hectares and individual holdings up to 20 hectares are
permitted to have compounding; trusts for charitable or religion purposes also are
allowed to avail of this provision.
The shift fiom standard hectares to ordinary hectares is a major change with
lasting impact on tax collection in a state like Kerala where land reform measures
are successfU1 and as a result size of holding has come down sharply. For example
one hectare of rubber plantation, according to Kleeswaran committee ,would be
equal to 1.5 standard hectares and one hectare of cardamom in A zone equal to 3
standard hectares. But the Act did not differentiate between standard and ordinary
hectares. This has considerably reduced area of land that could be taxed.
Tax exemption provided to holdings below 3 hectares as against 3 standard
hectares of Kaleeswaran Committee recommendations should be evaluated in this
context. This is in the backdrop of Raj Committee recommending to tax at Re.
llper holdings with a rateable value of less than Rs. 6001- per year.
The Kaleeswaran Committee allowed a rebate of 2.5 per cent annually for re-
plantation but did not allow tax holiday for the immature plants. The Agricultural
Income Tax Act 1991 declared tax holiday for the immature plants. The
recommendation of the Raj Committee allowed non-payment of Agricultural
Holdings Tax by unyielding land or plants.
The Kaleeswaran Committee's standardisation of land permitted uniform tax
rate for similar holdings and a progressive rate for larger holdings. The element of
arbitrariness was less here. The Act fixed different rates for different crops
without any scientific basis and without considering the level of prices of different
crops.
Raj Committee recommended to consider family holding as one unit and
levy the charges, where as the Kaleeswaran Committee was for individual
holdings to be assessed and the Act 1991 followed the Kaleeswaran Committee
recommendations. Raj Committee recommendations if followed would have
increased the tax burden of the family and this would have been an injustice at
least for the middle class families, which would have many members whose only
source of livelihood is the family property. This is in contrast to the personal
income tax where it is the income of the persons and not the family that is
assessed; in a family where both the spouses are employed it is not the income of
the family that is assessed for income tax but the income of both assessed
separately and taxed. So Kaleeswaran Committee was more reasonable in this
respect and the Act 199 1 did what was right.
In the case of Charitable and Religious Trusts, Raj Committee (Sect. 3.45)
and Kaleeswaran Committee (7.5 p.40) were against giving any special treatment
and recommended to tax them properly. But the Act 1991 (1 6.1, p. 18) exempted
the agricultural income earned by them from Agricultural Income tax under
certain conditions.
Therefore, the Act 1991 diluted many of the recommendations of the Raj
Committee and Kaleeswaran Committee, which put forward the idea and
modalities for compounding the agricultural income on the basis of the size of
holding of the agriculturalist. This could be one of the reasons for the falling
collection of Agricultural Income Tax ever since compounding was introduced in
1991.
One of the main objectives of the Agricultural Holdings Tax and
compounding system of tax was to avoid the harassment of agriculturists by
officers but the Act 1991 underlines the importance of tax officials' personal
verifications of the farms and harassment has not disappeared. Agricultural
Income Tax offices still have high clout and tax procedures are not simplified
fully.
7.3.1 Compounding and After
As mentioned in the preceding section, compounding of agricultural income
was allowed for Agricultural Income Tax purposes for individuals whose holding
was below 20 hectares of land through Agricultural Income Tax Act 1991 and it
came into practice on April 1, 1991 .Tax liability of a cultivator is assessed on the
basis of the area of land he owns and crop that is cultivated on it.
The rate fixed in the Act is given in Table 7.1. The Act envisages that there
be periodic revision of the rate1 considering the fluctuations in price and the
changes in the agricultural sector. There had been a lot of changes in the
agricultural sector of Kerala ever since 1990-9 1. The Act has undergone a number
of changes. Agricultural prices moved very sharply. The prices of almost all
crops except tea skyrocketed till 1997-98 and nose-dived since then till 2000-01.
Now the price of many crops except those of tea, areca nut, coffee and cardamom
show upward trend, rubber showing the highest increase.
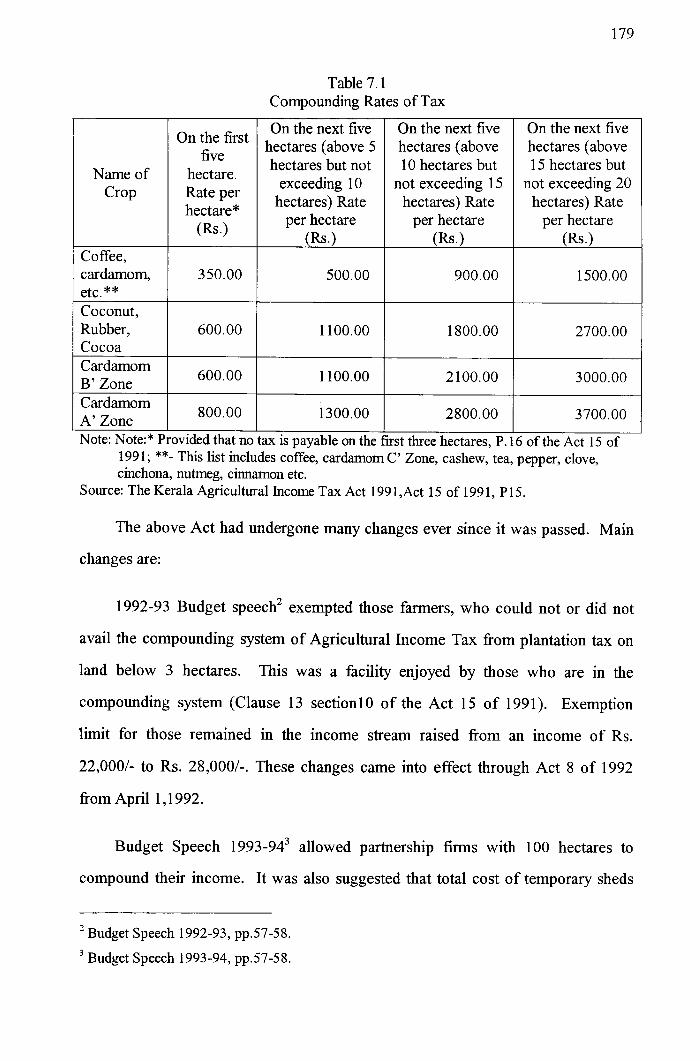
Table 7.1 Compounding Rates of Tax
Name of Crop
On the first five
hectare. Rate per hectare* (h.)
Coffee, cardamom, etc.** Coconut, I Rubber, 1 600.00 Cocoa 1 600.0; B' Zone
Card-om 1 800.00 A' Zone
On the next five hectares (above 5 hectares but not
exceeding 10 hectares) Rate
per hectare (b.)
On the next five hectares (above 10 hectares but
not exceeding 15 hectares) Rate
per hectare (Rs.1
On the next five hectares (above 15 hectares but
not exceeding 20 hectares) Rate
per hectare (h.)
I I I I I Note: Note:* Provided that no tax is payable on the first three hectares, P. 16 of the Act 15 of
199 1 ; **- This list includes coffee, cardamom C' Zone, cashew, tea, pepper, clove, cinchona, nutmeg, cinnamon etc.
Source: The Kerala Agricultural Income Tax Act 199 1 ,Act 15 of 199 1, P 15.
The above Act had undergone many changes ever since it was passed. Main
changes are:
1992-93 Budget speech2 exempted those farmers, who could not or did not
avail the compounding system of Agricultural Income Tax from plantation tax on
land below 3 hectares. This was a facility enjoyed by those who are in the
compounding system (Clause 13 section1 0 of the Act 15 of 1991). Exemption
limit for those remained in the income stream raised from an income of Rs.
22,0001- to Rs. 28,0001-. These changes came into effect through Act 8 of 1992
from April 1,1992.
Budget Speech 1993-943 allowed partnership firms with 100 hectares to
compound their income. It was also suggested that total cost of temporary sheds
2 Budget Speech 1992-93, pp.57-58.
3 Budget Speech 1993-94, pp.57-58.
constructed and gratuity and bonus paid be deducted from agricultural income for
purposes of Agricultural Income Tax. This was implemented through Act 13 of
1993.
Budget Speech 1994-954 extended the facility of compounding to tenants in
common with the condition that all tenants should opt for it and the share of each
tenant together with his individual property shall not exceed the limit prescribed
for compounding. Plantation companies were allowed to deduct 50 per cent of
income from taxable income if invested in industrial concerns in the state for five
years and these investments should not be in agricultural sector. These were
implemented through Act 19 of 1994.
1995-96 Budget speech exempted coconut from Agricultural Income Tax for
one year and the exemption limit increased to Rs. 40,0001- from Rs. 28,0001- for
Agricultural Income Tax. Act 5 of 1995 shows that there was also a revision of
tax rate.
Budget Speech 1998-99 proposed a rate slashing for rubber and Act 14 of
1998 shows that rate reduction was made also for cardamom as follows5. The rate
of Agricultural Income Tax for domestic companies reduced from 65 per cent to
60 per cent.
Budget Speech 1999-00 extended the compounding facility to all including
companies holding an area up to 500 hectares. But this will not be provided to
those who split the existing companies and form new companies. It was made
effect through Act 23 of 1999~. Rates reduced for all crops in all slabs of
compounding. New rates are given in the following table.
Budget Speech 1994-95, p.56
Act 14 of 1998, p. 184. 6 Act 23 of 1999, p. 548.

Rubber up to 20 hectares exempted from Agricultural Income Tax for this
financial year.
Table 7.2 New Rates of Agricultural Income Tax Erom 1999
Crop
Cashew, Clove Pepper Coconut,
I Coffee I
Nil I 700 1 1000 I 1800 1 3000 Source: Act 23 of 1999, Annexure - l .
First 3 hect.
cocoa, Rubber Cardamom B Cardamom A Arecanut Tea
Budget Speech 2000-01 allowed rubber up to 20 hectares to enjoy exemption
fiom Agricultural Income Tax for another year. Coffee up to 20 hectares also was
Nil Nil Nil
exempted for one year. Budget Speech also proposed to exempt all farmers
possessing up to 5 hectares from Agricultural Income Tax with effect fiom 2000-
0 1 accounting year. These proposals were implemented through Act 7 of 200 1 7 .
Next 5 hect.
Nil Nil Nil Nil
7.3.2 The Impact of the Changes
300 400 500
Introduction of compounding and the changes effected to it must have its
impact on the Agricultural Income Tax collection in the state. We are trylng to
analyse the impact of changes to the Agricultural Income tax system mainly on the
Next 5 hect.
550 750 750 3 50
revenue collection, changes in the cost of collection and responsiveness of tax
collection to various determinants of the tax.
450 600
1000
It is difficult to establish a one-to-one relation between changes in the
Next 5 hect.
1000 1200 1200 500
collection of Agricultural Income Tax and introduction of compounding and the
changes there after. This is because of the fact that there are many factors that
Next 500 hect.
800 1000 1700
1400 1750 2500
2000 2700 2700 900
2800 3500 3500 1500

affect tax collection and compounding was permitted at first only to those persons
having land up to 20 hectares. People having land over and above this had to
continue with the income-assessment scheme already in practice.
But, the only major change that occurred and that will have an impact on
Agricultural Income Tax collection was the Act 1991 and amendments to it.
Therefore, one can reasonably attribute the changes (if any) in tax front to the
switch over from income stream to the compounding stream of assessment
brought about by the Act.
We are depending on secondary and primary data for evaluating the
performance of Agricultural Income Tax situation in the nineties. Tools like
compound growth rate, tax income ratio, per cultivator tax collection, ratio of
Agricultural Income tax to Total revenue, Total tax revenue, State's own tax
revenue, and Own revenue are used to evaluate the change before and after the
introduction of compounding. Responsiveness of the tax system was studied in
relation to Agricultural Income by working out the elasticity. Response of the
Agricultural Income Tax to price variation, cost of cultivation, terms of trade, net
cropped area are studied by comparing the growth rates of the above variables
with that of Agricultural Income Tax. Simple and multiple regression are also
done to analyse the data.
Secondary data are used for:
(a) finding the compound growth rate of Agricultural Income Tax
immediately preceding and succeeding years of compounding to see
whether there is considerable change in the growth rate,
(b) working out ratios to see whether relative share of Agricultural Income
Tax in various revenue and tax variables have undergone considerable
variation before and after the introduction of compounding system,
(c) analysing whether the responsiveness of the tax system have undergone
tremendous change in the period.
Secondary data on size of holdings are used to establish whether the
exemption provided to land holdings up to 3 hectares (as against the Kaleeswaran
Committee recommendations of 3 standard hectares) from paying Agricultural
Income Tax had any impact. This is done by the analysis of the size of holdings in
the state. Primary data collected through the family survey are used to examine
whether cultivators have resorted to fake partition and division of land for evading
Agricultural Income Tax. Family survey gives data on the partition of land since
1993
In order to study the change in the cost of tax collection, data is collected
from the files of the agricultural Income Tax offices. (A detailed discussion of
how data collection from Agricultural Income Tax offices is done, and is given in
Chapter-V1 on cost effectiveness).
Agricultural income Tax in the Nineties
This section deals with major variations occurred to Agricultural Income Tax
collection and try to analyse the role played by compounding system in these
changes.
(a) Growth Rate:
The compound growth rate of Agricultural Income Tax is taken in ten- year
periods to see whether nineties are different from the earlier decades. Table 7.3
gives compound growth rate of Agricultural Income Tax in decades starting from
196 1-7 1. Last one is the average growth rate in the 41 years from 1960 to 200 1.

Table 7.3 Compound Growth Rate of AIT
The decade 199 1-200 1 has a growth rate of 1.27 per cent in the Agricultural
Income Tax collection. This is in comparison to the tax collection in the eighties
where the growth rate was 4.12 and an overall average growth rate of 7.09 per cent
from 1960 to 2001. Growth rate had declined from 17.93 per cent in seventies to
4.12 in the eighties. The fall in the growth rate in the nineties is very grave. Thus
it is clear that the nineties had a dismal growth rate compared to the all year
growth rate (7.09) and also compared to all other decades.
Years 1961-1971
l 1960-200 1
This is a period when prices of agricultural commodities showed tremendous
fluctuation, increasing to the peak in 1998-99 and falling there after to the slump
by the end of the decade 1999-2000. Therefore, fall in price and income cannot be
considered as the reason for fall in the average growth rate in this period.
Growth rate 3.98
7.09
(b) Per Cultivator Agricultural Income Tax:
Source: Compiled fromvarious issues of R.B.1 Bulletin.
Agricultural Income Tax per cultivator is found out by dividing the total
agricultural income tax collected by the number of cultivators (both male and
female) in that year. Census Reports provide data on the number of cultivators
only for 199 1 and 200 1 and not for the interim years. The number of cultivators in
199 1 was 10 15983 and in 200 1 it was 740403. Table 7.4 shows the per-cultivator
Agricultural Income Tax in Kerala. It was Rs. 235.61- in 1991 and Rs. 337.651- in
200 1. Per cultivator Agricultural Income Tax seem to increase even in the nineties,
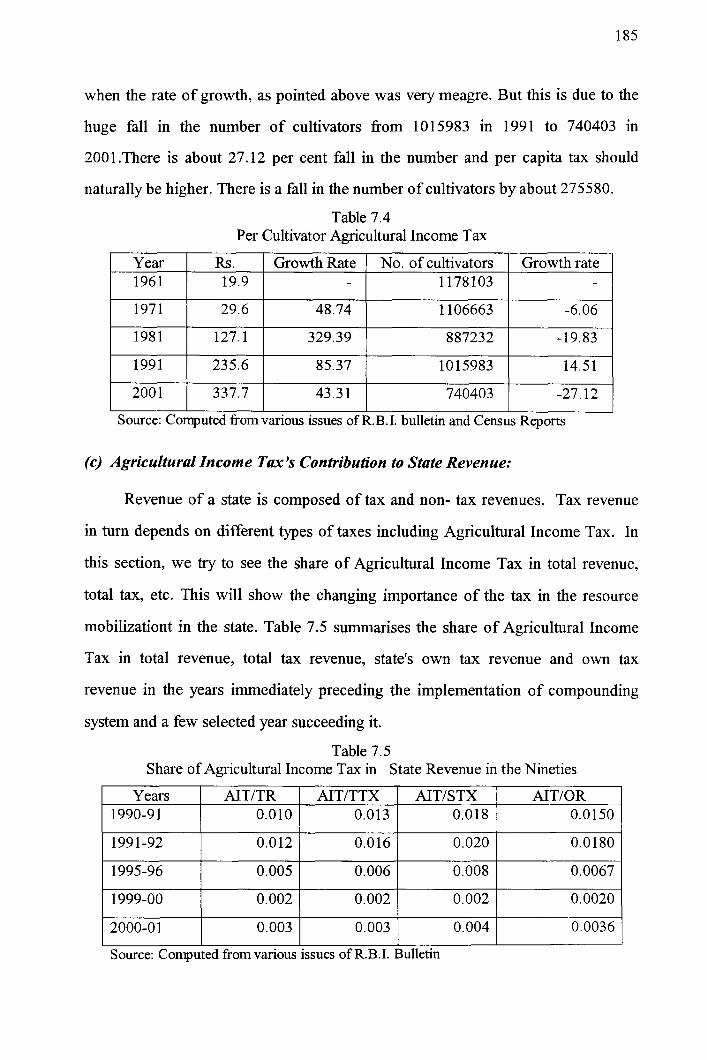
when the rate of growth, as pointed above was very meagre. But this is due to the
huge fall in the number of cultivators fiom 1015983 in 1991 to 740403 in
200 1 .There is about 27.12 per cent fall in the number and per capita tax should
naturally be higher. There is a fall in the number of cultivators by about 275580.
Table 7.4 Per Cultivator Agricultural Income Tax
1 I I I I I Source: Computed from various issues of R.B.I. bulletin and Census Reports
Year 196 1
(c) Agricultural Zncom e Tax's Contribution to State Revenue:
Revenue of a state is composed of tax and non- tax revenues. Tax revenue
Rs. 19.9
in turn depends on different types of taxes including Agricultural Income Tax. In
this section, we try to see the share of Agricultural Income Tax in total revenue,
Growth Rate -
total tax, etc. This will show the changing importance of the tax in the resource
mobilizationt in the state. Table 7.5 summarises the share of Agricultural Income
No. of cultivators 1178103
Tax in total revenue, total tax revenue, state's own tax revenue and own tax
Growth rate -
revenue in the years immediately preceding the implementation of compounding
system and a few selected year succeeding it.
Table 7.5 Share of Agricultural Income Tax in State Revenue in the Nineties
Years I AITITR I AITITTX I AITISTX I AITIOR
2000-0 1
Source: Computed from various issues of R.B.I. Bulletin
As the table shows, the share of Agricultural Income Tax in the total revenue
in all the above years are very little, always around or less than 0.01 per cent.
Even this little contribution came down further, since the introduction of
compounding to 0.005 in 1995-96 and then to 0.003 in the last year of the decade.
The share decreased to less than 50 per cent of what it was in 1990-9 1.
This is true for the share of Agricultural Income Tax in total tax (AITITTX)
also, as the share fell from 0.013 to 0.002 and 0.003 in 1999-2000 and 2000-01
respectively. Share of Agricultural Income Tax in state's own taxes (AITISTX)
also is not different. It was 0.01 8 in 1990-91, 0.02 in 1991 -92 and fell to 0.008 in
1995-96 and hrther to 0.002 and 0.004 in the last two years of study. The
percentage of Agricultural Income Tax in own revenue (AITIOR) also tells the
same story: a fall from 0.015 in 199091 to 0.0067 in 1995-96 and to 0.002 and
to0.0036 in 1999-2000 and 2000-0 1 respectively.
Agricultural Income tax's contribution to Total tax revenue of the state in
2000-01 is only 23.07 per cent of what it was in 1990-91. Its contribution to the
State's own tax revenue is only 22.22 per cent of what it was in 1990-91.
Agricultural Income tax's contribution to State' Own revenue in 2000-01 is only
24 per cent of what it was in 1990-91.
Table 7.6 presents the averages of the above shares in the last four decades of
the revenue history of state. The average share of Agricultural Income Tax in total
revenue (AITITR) in the 1960s was 0.033 and it fell sharply to 0.0048 in the
nineties. This means that Agricultural Income Tax was about 3.33 per cent of the
total revenue in the sixties and it fell considerably and it is only 0.48 per cent in
the nineties.
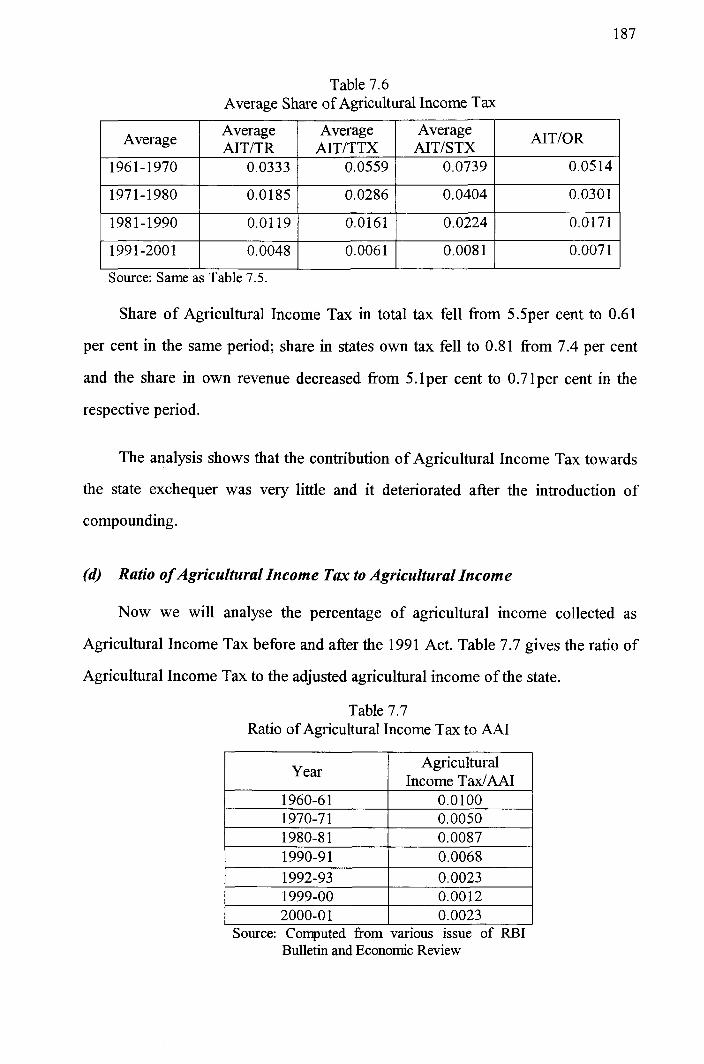
Table 7.6 Average Share of Agricultural Income Tax
Source: Same as Table 7.5.
Share of Agricultural Income Tax in total tax fell from 5.5per cent to 0.61
per cent in the same period; share in states own tax fell to 0.81 from 7.4 per cent
and the share in own revenue decreased from 5.lper cent to 0.7lper cent in the
respective period.
The analysis shows that the contribution of Agricultural Income Tax towards
the state exchequer was very little and it deteriorated after the introduction of
compounding.
(d) Ratio of Agricultural Income Tax to Agricultural Income
Now we will analyse the percentage of agricultural income collected as
Agricultural Income Tax before and after the 1991 Act. Table 7.7 gives the ratio of
Agricultural Income Tax to the adjusted agricultural income of the state.
Table 7.7 Ratio of Agricultural Income Tax to AA1
x r - - - ( Agricultural I
1999-00 2000-0 1
0.0012 0.0023
Source: Computed from various issue of RBI Bulletin and Economic Review
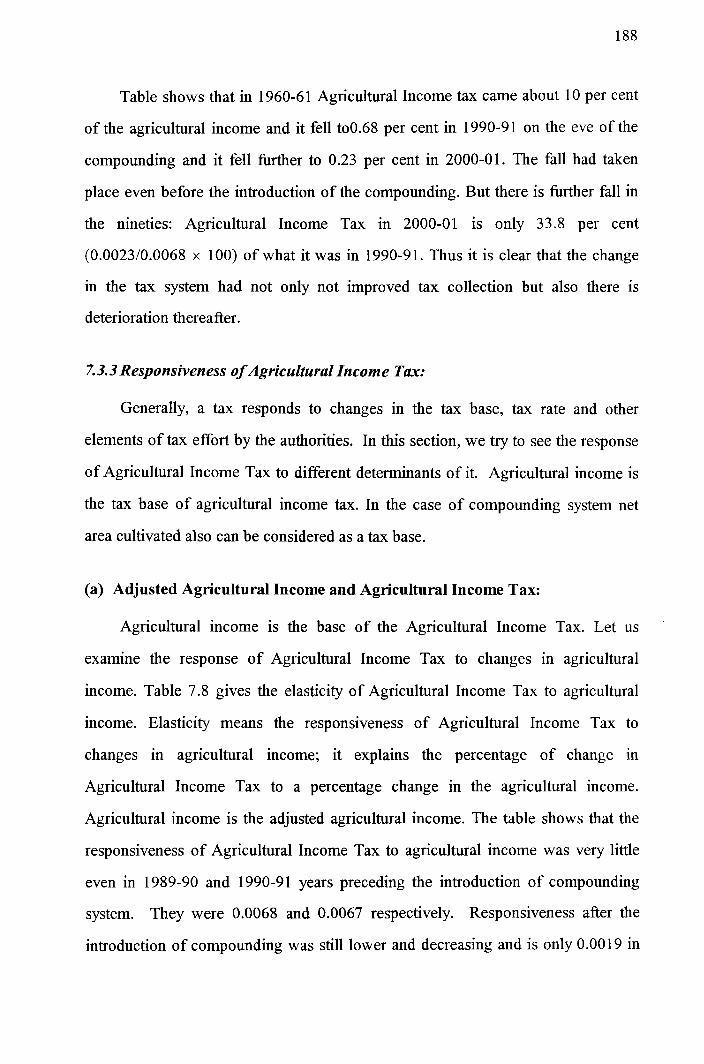
Table shows that in 1960-61 Agricultural Income tax came about 10 per cent
of the agricultural income and it fell to0.68 per cent in 1990-91 on the eve of the
compounding and it fell further to 0.23 per cent in 2000-01. The fall had taken
place even before the introduction of the compounding. But there is further fall in
the nineties: Agricultural Income Tax in 2000-01 is only 33.8 per cent
(0.002310.0068 x 100) of what it was in 1990-91. Thus it is clear that the change
in the tax system had not only not improved tax collection but also there is
deterioration thereafter.
7.3.3 Responsiveness of Agricultural Income Tax:
Generally, a tax responds to changes in the tax base, tax rate and other
elements of tax effort by the authorities. In this section, we try to see the response
of Agricultural Income Tax to different determinants of it. Agricultural income is
the tax base of agricultural income tax. In the case of compounding system net
area cultivated also can be considered as a tax base.
(a) Adjusted Agricultural Income and Agricultural Income Tax:
Agricultural income is the base of the Agricultural Income Tax. Let us
examine the response of Agricultural Income Tax to changes in agricultural
income. Table 7.8 gives the elasticity of Agricultural Income Tax to agricultural
income. Elasticity means the responsiveness of Agricultural Income Tax to
changes in agricultural income; it explains the percentage of change in
Agricultural Income Tax to a percentage change in the agricultural income.
Agricultural income is the adjusted agricultural income. The table shows that the
responsiveness of Agricultural Income Tax to agricultural income was very little
even in 1989-90 and 1990-91 years preceding the introduction of compounding
system. They were 0.0068 and 0.0067 respectively. Responsiveness after the
introduction of compounding was still lower and decreasing and is only 0.0019 in

1999-2000. Rubber and Coffee cultivation below 20 hectares were given tax
holiday fiom 1999-00 and 2000-01 respectively. There fore a considerable section
of the cultivators have gone out of the tax net. Similarly cultivators with less than
5 hectares of land are exempted fiom Agricultural Income Tax. This also has
caused a fall in the number of cultivators in the tax net. Negative elasticity in
2000-01 is due to the fact that there is fall in the adjusted agricultural income in
the year and Agricultural Income tax collection increased.
Table 7.8 Elasticity of AIT to AA1
Years 1989-90
This is the case in respect of average elasticity also in the decades (Table
Elasticity 0.0068
I 2000-0 1
7.9). 1961-70 had an average elasticity of 0.0071 and in the nineties it declined to
-6.0340
a mere 0.0027.
Source: Computed fiom various issues of R.B.1 bulletin and Economic Review.
Table 7.9 Average Elasticity
Source: Same as Table 7.8
Years 1961-1970
197 1 - 1980
1981-1990
199 1-2000
Thus, increase in agricultural income has not led to an equal or proportionate
increase in agricultural income tax collection not only in the nineties but also even
Average Elasticity 0.00710
0.00699
0.00670
0.00270
before that. But the impact of increase in agricultural income on Agricultural
Income Tax was all the more lower in the nineties
(b) Agricultural Income Tax and Net Area Cultivated
Another important variable that could influence agricultural income tax is net
area cultivated because tax was assessed on the extent of the area cultivated by a
person, i.e., the change in net area cultivated should influence the tax collection.
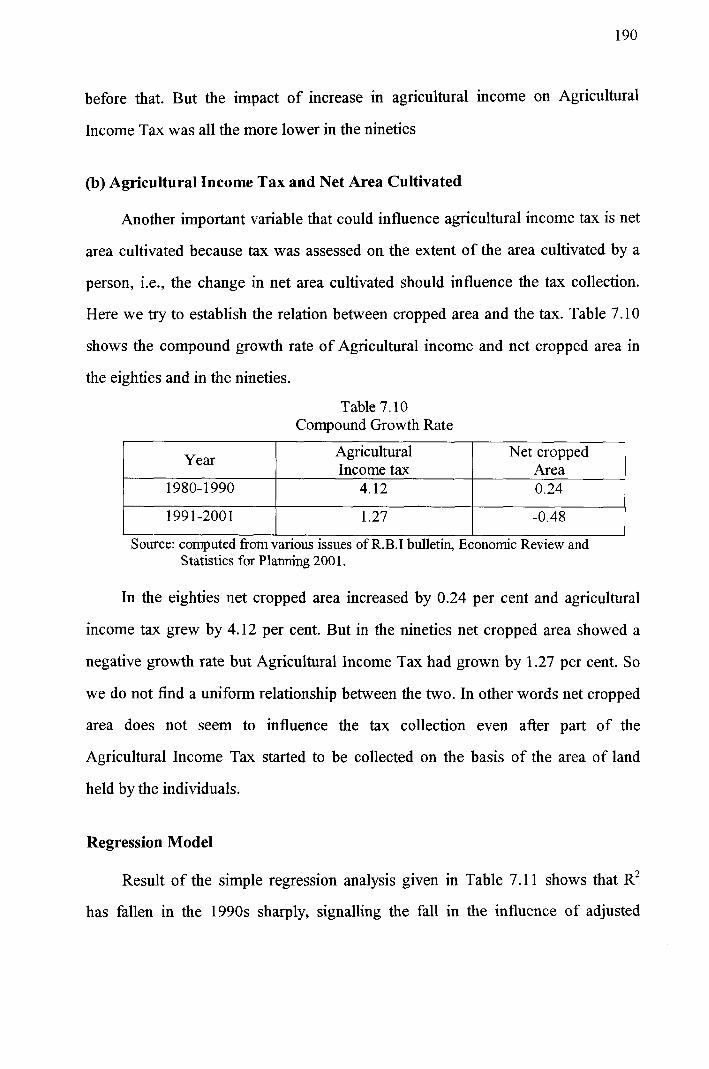
Here we try to establish the relation between cropped area and the tax. Table 7.10
shows the compound growth rate of Agricultural income and net cropped area in
the eighties and in the nineties.
Table 7.10 Compound Growth Rate
Year -
1980- 1990
In the eighties net cropped area increased by 0.24 per cent and agricultural
income tax grew by 4.12 per cent. But in the nineties net cropped area showed a
199 1-2001
negative growth rate but Agricultural Income Tax had grown by 1.27 per cent. So
we do not find a uniform relationship between the two. In other words net cropped
Agricultural Income tax
4.12
area does not seem to influence the tax collection even after part of the
Agricultural Income Tax started to be collected on the basis of the area of land
held by the individuals.
Net cropped Area 0.24
Source: computed fromvarious issues of R.B.1 bulletin, Economic Review and Statistics for Planning 2001.
1.27
Regression Model
-0.48
Result of the simple regression analysis given in Table 7.1 1 shows that
has fallen in the 1990s sharply, signalling the fall in the influence of adjusted
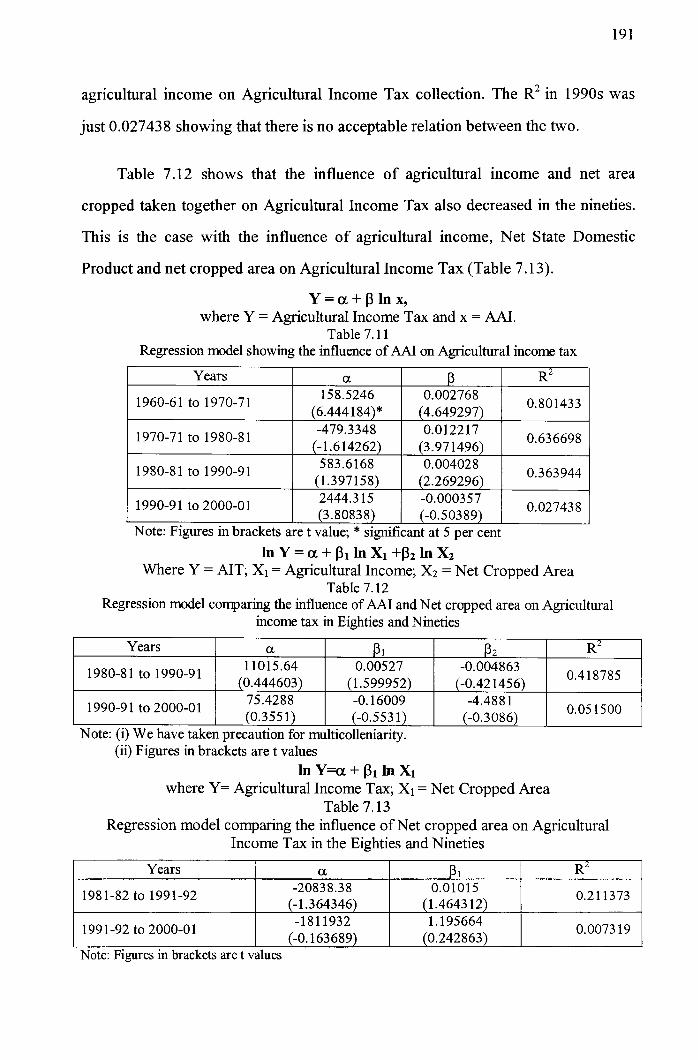
agricultural income on Agricultural Income Tax collection. The in 1990s was
just 0.027438 showing that there is no acceptable relation between the two.
Table 7.12 shows that the influence of agricultural income and net area
cropped taken together on Agricultural Income Tax also decreased in the nineties.
This is the case with the influence of agricultural income, Net State Domestic
Product and net cropped area on Agricultural Income Tax (Table 7.13).
Y = a + p l n x , where Y = Agricultural Income Tax and X = AAI.
Table 7.1 1 Regression model showing the influence of AA1 on Agricultural income tax
Years
1960-61 to 1970-71
1970-71 to 1980-81
1980-81 to 1990-91
1990-9 1 to 2000-0 1
lnY=a+pl lnXl+P21nX2 Where Y = AIT; XI = Agricultural Income; X2 = Net Cropped Area
Table 7.12 Regression model comparing the influence of AA1 and Net cropped area on Agricultural
income tax in Eighties and Nineties
Note: Figures in brackets are t value; * significant at 5 per cent
a 158.5246
(6.444 184)* -479.3348
(-1.614262) 583.6168
(1.397158) 2444.3 15 (3.80838)
Years
1980-8 1 to 1990-91
1990-91 to 2000-01
Regression model comparing the influence of Net cropped area on Agricultural Income Tax in the Eighties and Nineties
Years
1981-82 to 1991-92
199 1-92 to 2000-0 1
P 0.002768
(4.649297) 0.012217
(3.97 1496) 0.004028
(2.269296) -0.000357 (-0.50389)
Note: (i) We have taken precaution for multicolleniarity. (ii) Figures in brackets are t values
InY=a+p1InX1 where Y= Agricultural Income Tax; XI = Net Cropped Area
Table 7.1 3
a 11015.64 0.444603 75.4288 (0.355
R2
0.801433
0.636698
0.363944
0.02743 8
Note: Figures in brackets are t values
a -20838.38
(-1.364346) -1811932
(-0.163689)
1
0.00527 (1.599952) -0.16009 (-0.553 1)
1
0.01015 (1.4643 12) 1.195664
(0.242863)
2
-0.004863 (-0.421456)
-4.488 1 (-0.3086)
R2
0.21 1373
0.0073 19
0.4 18785
0.05 1500
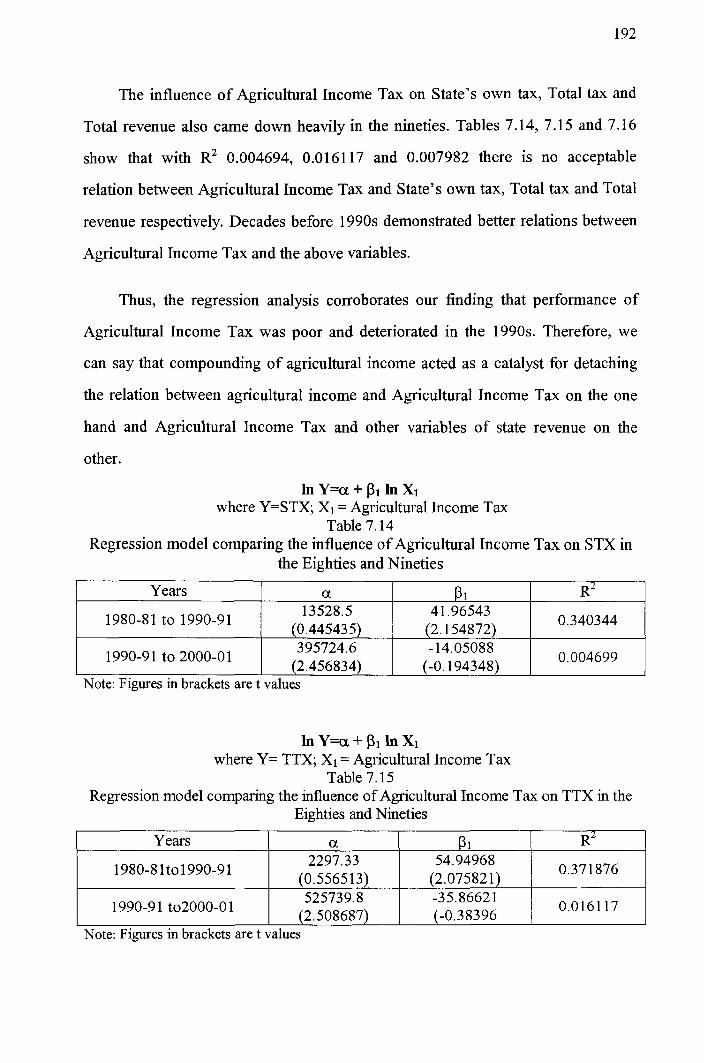
The influence of Agricultural Income Tax on State's own tax, Total tax and
Total revenue also came down heavily in the nineties. Tables 7.14, 7.1 5 and 7.1 6
show that with 0.004694, 0.0161 17 and 0.007982 there is no acceptable
relation between Agricultural Income Tax and State's own tax, Total tax and Total
revenue respectively. Decades before 1990s demonstrated better relations between
Agricultural Income Tax and the above variables.
Thus, the regression analysis corroborates our finding that performance of
Agricultural Income Tax was poor and deteriorated in the 1990s. Therefore, we
can say that compounding of agricultural income acted as a catalyst for detaching
the relation between agricultural income and Agricultural Income Tax on the one
hand and Agricultural Income Tax and other variables of state revenue on the
other.
l n Y = a + p l l n x l where Y=STX; XI = Agricultural Income Tax
Table 7.14 Regression model comparing the influence of Agricultural Income Tax on STX in
the Eighties and Nineties
Years
1980-81 to 1990-91
lnY=a+pl lnx l where Y= TTX; XI = Agricultural Income Tax
Table 7.15 Regression model comparing the influence of Agricultural Income Tax on TTX in the
Eighties and Nineties
1990-9 1 to 2000-0 1
Years N R f
a 13528.5
(0.445435)
Vote: Figures in brackets are t values
Note: Figures in brackets are t values
395724.6 (2.456834)
P 1
4 1.96543 (2.154872)
R~
0.340344
-14.05088 (-0.194348) 0.004699
lnY=a+pl lnx l where Y= TR; XI = Agricultural Income Tax
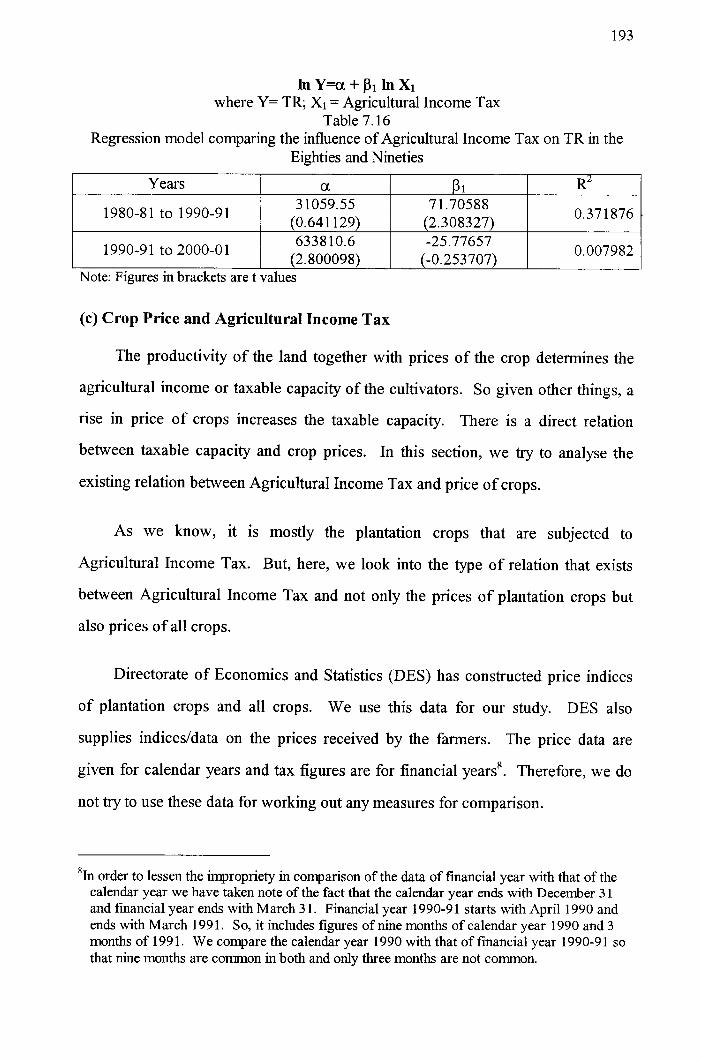
Table 7.16 Regression model comparing the influence of Agricultural Income Tax on TR in the
Eighties and Nineties
(c) Crop Price and Agricultural Income Tax
Years
1980-81 to 1990-91
1990-9 1 to 2000-0 1
The productivity of the land together with prices of the crop determines the
agricultural income or taxable capacity of the cultivators. So given other things, a
rise in price of crops increases the taxable capacity. There is a direct relation
between taxable capacity and crop prices. In this section, we try to analyse the
existing relation between Agricultural Income Tax and price of crops.
As we know, it is mostly the plantation crops that are subjected to
Agricultural Income Tax. But, here, we look into the type of relation that exists
between Agricultural Income Tax and not only the prices of plantation crops but
also prices of all crops.
Note: Figures in brackets are t values
a 3 1059.55
(0.641 129) 6338 10.6
(2.800098)
Directorate of Economics and Statistics (DES) has constructed price indices
of plantation crops and all crops. We use this data for our study. DES also
supplies indicesldata on the prices received by the farmers. The price data are
given for calendar years and tax figures are for financial years8. Therefore, we do
not try to use these data for working out any measures for comparison.
8 In order to lessen the impropriety in comparison of the data of financial year with that of the calendar year we have taken note of the fact that the calendar year ends with December 3 1 and financial year ends with March 3 1. Financial year 1990-9 1 starts with April 1990 and ends with March 199 1. So, it includes figures of nine months of calendar year 1990 and 3 months of 1 99 1. We compare the calendar year 1 990 with that of financial year 1 990-9 1 so that nine months are common in both and only three months are not common.
P 1
71.70588 (2.308327) -25.77657
(-0.253707)
0.371876
0.007982
Similarly, price data are indices that take into account various crops' prices.
But these indices are capable of shedding light on the general trend of the price
behaviour.
Therefore, here we attempt for just a comparison of the trend of price and
trend of the Agricultural Income Tax. This will help us to conclude whether
prices do influence the tax collection or not.
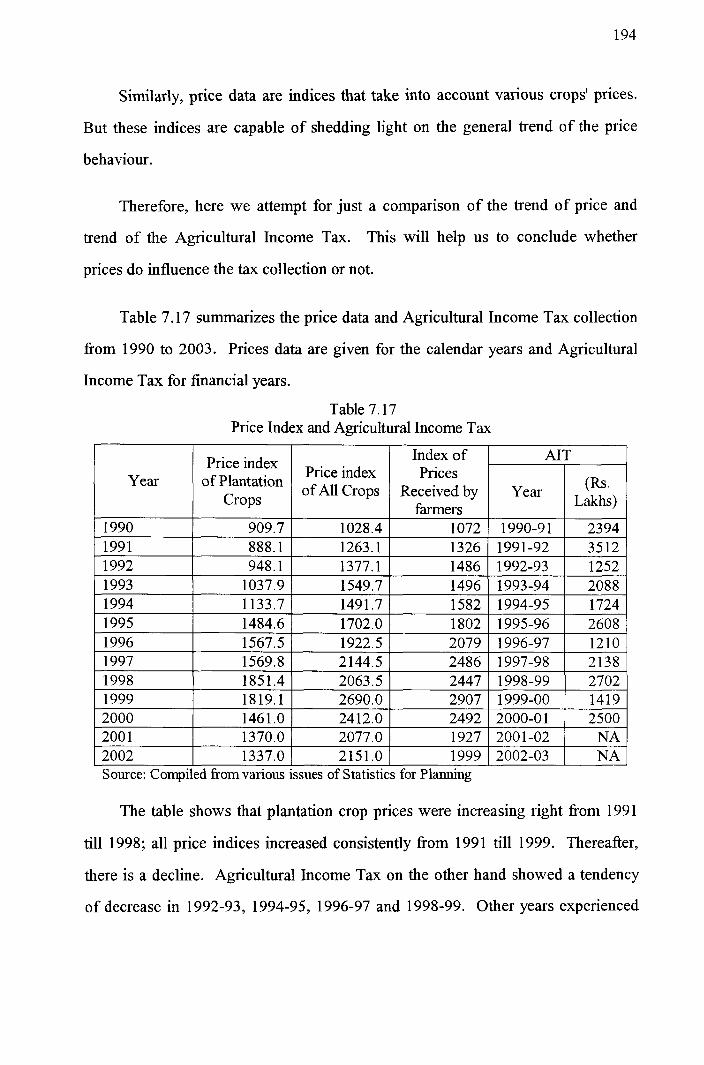
Table 7.17 summarizes the price data and Agricultural Income Tax collection
from 1990 to 2003. Prices data are given for the calendar years and Agricultural
Income Tax for financial years.
Table 7.17 Price Index and Agricultural Income Tax
1 2002 1337.0 1 2151.0 1 1999 1 2002-03 1 NA I Source: Compiled fromvarious issues of Statistics for Planning
Year
The table shows that plantation crop prices were increasing right fiom 1991
till 1998; all price indices increased consistently fiom 199 1 till 1999. Thereafter,
Price index of Plantation
Crops
there is a decline. Agricultural Income Tax on the other hand showed a tendency
of decrease in 1992-93, 1994-95, 1996-97 and 1998-99. Other years experienced
Price index of All Crops
Index of Prices
Received by farmers
AIT
Year (b. Lakhs)
increase. This shows that Agricultural Income Tax had unstable and zigzag type
behaviour.
Increase in the price index on plantation crops from 1991 to 2002 was 50.55
per cent; all crops price index increased by 70.31 per cent, average farm prices
received increased by 50.75 per cent over the same period (2002 over 1991). But,
Agricultural Income Tax increased only by 4.42 per cent from 1991-92 to 2002-
03.
Growth rate of the prices of plantation crops from 199 1 to 1999 (the year up
to which prices increased) was 104.84 per cent, 63.4 per cent for all crops and
119.24 for average farm prices received, where as Agricultural Income Tax
showed a mere 4.42 per cent increase.
The above analysis proves that Agricultural Income Tax had a peculiar trend
(determined by exogenous factors), unaffected by prices of the agricultural
commodities.
A year-to-year comparison confirms this finding. For example, all indices of
farm prices showed an increase in 1992 over the previous year where as
Agricultural Income Tax decreased sharply form Rs. 35 12/- lakhs in 1 99 1-92 to
Rs. 12521- lakhs in 1992-93. Similarly, price indices of plantation crops and all
crops declined from 1998 and 1999 respectively. Agricultural Income Tax on the
other hand showed an increase in 1998-99, decline in 1999-00 and increase in the
following year. So our study confirms that changes in prices of the agricultural
commodities do not influence Agricultural Income Tax
(d) Cost of Cultivation and Agricultural Income Tax
One of the important factors that affect the taxable capacity of agricultural
sector is the cost of cultivation because cost of cultivation influences the net
income of the cultivator. Other things remaining the same, capacity to pay tax falls
as cost of production increases. In other words, there is an inverse relation
between them. Now, we move on to see the type of relation that exists between
cost of cultivation and Agricultural Income Tax.
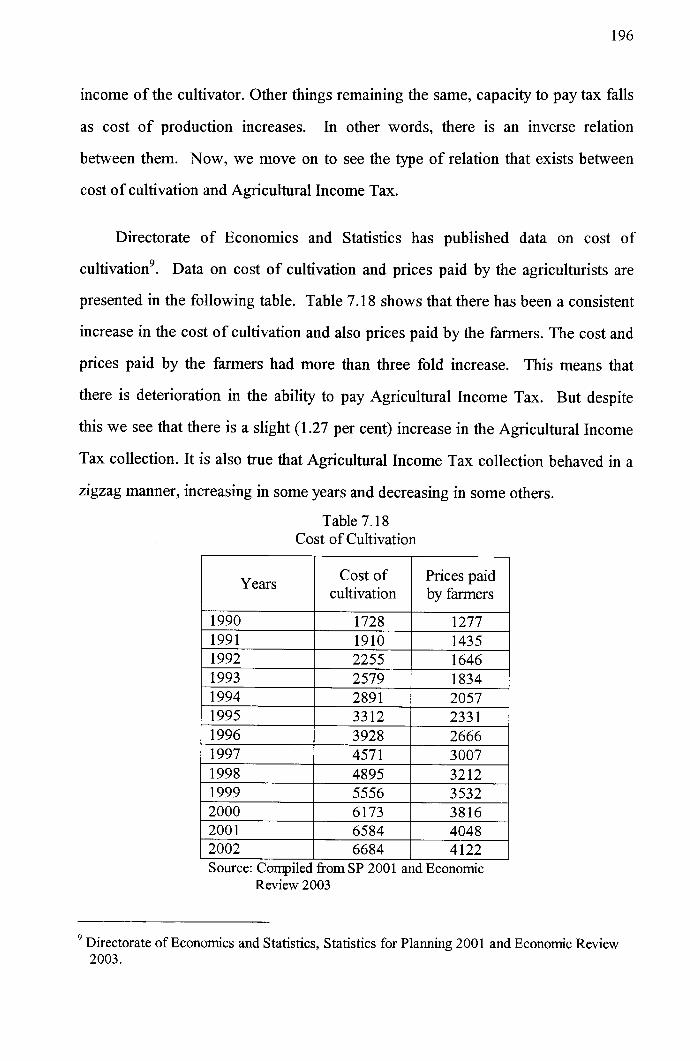
Directorate of Economics and Statistics has published data on cost of
cultivationg. Data on cost of cultivation and prices paid by the agriculturists are
presented in the following table. Table 7.18 shows that there has been a consistent
increase in the cost of cultivation and also prices paid by the farmers. The cost and
prices paid by the farmers had more than three fold increase. This means that
there is deterioration in the ability to pay Agricultural Income Tax. But despite
this we see that there is a slight (1.27 per cent) increase in the Agricultural Income
Tax collection. It is also true that Agricultural Income Tax collection behaved in a
zigzag manner, increasing in some years and decreasing in some others.
Table 7.18 Cost of Cultivation
Source: Compiled fi-om SP 2001 and Economic Review 2003
Cost of Years 1 cultivation
9 Directorate of Economics and Statistics, Statistics for Planning 2001 and Economic Review 2003.
Prices paid by farmers
Thus, we see that Agricultural Income Tax is not responsive to cost of
cultivation and prices paid by the farmers.
(e) Terms of Trade and Agricultural Income Tax
We have seen that Agricultural Income Tax did not decrease even when cost
of production increased, which should be the case under normal condition. But,
this need not occur if the earning of the farmers increased more than the increase
in cultivation cost leading to an increase in the taxable capacity of the farmers. In
this section an attempt is made to see if the earning of the farmers increased or not.
For this, we resort to the changes in the terms of trade of the cultivators for the
period under study. Terms of trade of the cultivators mean ratio of prices received
by the farmers to the prices paid by the farmers. It gives us a picture of the change
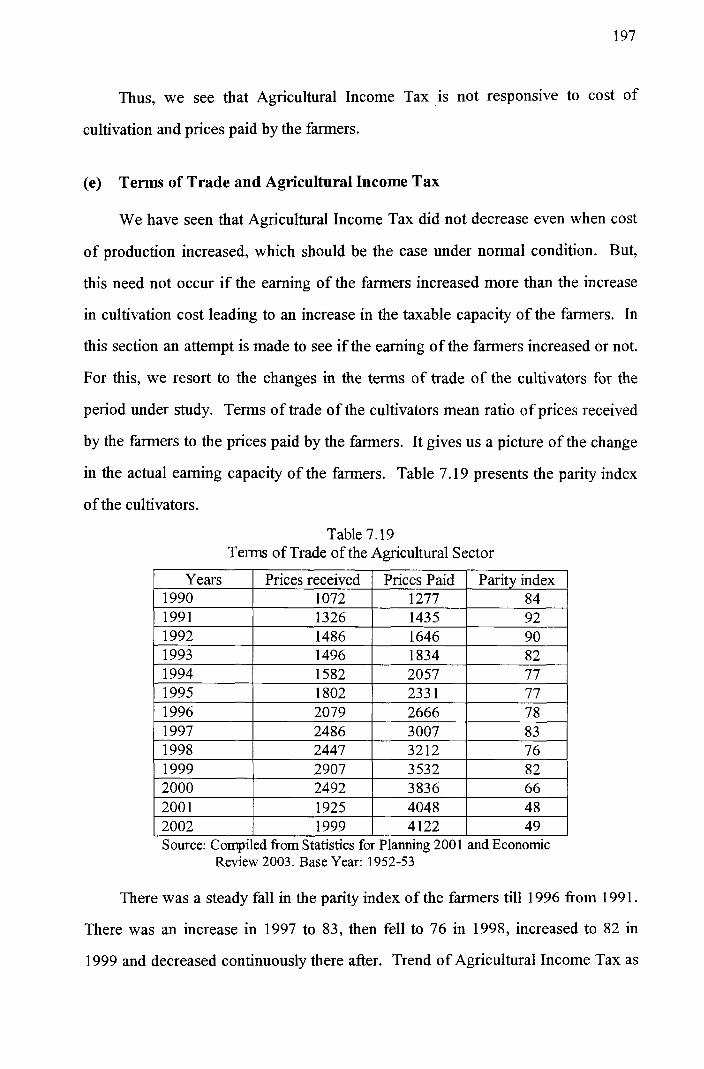
in the actual earning capacity of the farmers. Table 7.1 9 presents the parity index
of the cultivators.
Table 7.19 Terms of Trade of the Agricultural Sector
Source: Compiled from Statistics for Planning 2001 and Economic Review 2003. Base Year: 1952-53
Years 1990
There was a steady fall in the parity index of the farmers till 1996 from 1991.
There was an increase in 1997 to 83, then fell to 76 in 1998, increased to 82 in
1999 and decreased continuously there after. Trend of Agricultural Income Tax as
Prices received 1072
Prices Paid 1277
Parity index 84
we said earlier did not conform to this behaviour of the terms of trade. It increases
in some years and fall in some others. Terms of trade almost halved from 92 in
1991 to 49 in 2002. But Agricultural Income Tax showed a mild increase in the
same period.
It should also be borne in mind that parity index was always less than 100
during the period under study meaning that the terms of trade has moved against
the farm sector. If the productivity of land does not compensate this fall in terms
of trade actual earning of the farm sector is to decline.
7.3.4 Compounding and Cost of Collection
Since the cost of collection of agricultural taxes in Kerala especially
Agricultural Income Tax is discussed in a separate chapter1" we limit this
discussion only to the administrative cost, which is also called collection cost
since the introduction of compounding in Kerala agriculture.
One of the main objectives of new tax system, as specified by the
Kaleeswaran Committee was to simplifl the assessment procedure so that
arbitrariness in assessment eliminated. This would have led to cost reduction as
the role of the tax officials in the assessment process would be brought down. But
the Act 1991, though provided for the assessment of tax on the basis of the area of
cultivation, the role of Agricultural Income Tax officer did not decrease much as
he has to be personally satisfied as to the type of crop in a piece of land, change in
the crop over the years, land kept idle, area of land with unyielding crops etc.
Therefore, Agricultural Income Tax offices had to be maintained not only for
employment purposes, as the trade union demand but also for tax collection
purposes.
10 Chapter V.
In the following section, we analyse the cost of collection of Agricultural
Income Tax after the introduction of compounding in 1991. Agricultural Income
Tax is collected by the Agricultural Income Tax and Commercial taxes
Department and data on cost of collection incurred by Agricultural Income Tax
officials alone is not officially published. Therefore, we had to visit all the
Agricultural Income Tax offices in the state with prepaid questionnaire and collect
data.
As presented in Chapter VI, before the introduction of compounding cost of
collection was comparatively lower ranging between 15.6 per cent and 39.6 per
cent of the gross tax collected in each office. Now in recent years, cost as
percentage of gross collection has increased much but 6 of the offices still spend
less than the revenue collected by them and 6 spending much more than what they
collect. Now in 2002-03 the collection cost ranges between 18.62 and 343.4 per
cent of the tax collected.
The increase in cost as percentage of gross tax collection is not due to the
introduction of compounding alone but due to various other factors. One
important factor responsible for this phenomena, which is associated with
compounding is the fall in gross collection in each office as a result of exemption
granted to persons holding up to 3 hectares of land, from paying Agricultural
Income Tax and raising the exemption limit M h e r to 5 hectares.
Another reason is the lack of interest among the officers. Since size of
holding is a major determinant of Agricultural Income Tax, the officers do not
have much to do with assessment. Arbitrariness is taken away to an extent. Some
of the more socially conscious officers confide that agriculturists are poor
compared to 'big sharks' among the business community, who easily evade tax. So
'they feel' that there is no meaning in squeezing the hardworking fanners. So
collection does not catch up with increase in income and so on.
Another important cause for high cost is the existence of still redundant
offices which collect only as little as Rs.2540001- per year and spending Rs.
7480001- on administrative expenses. There is another office, which collects only
Rs. 89000/- per year. It is true that many are merged into nearby offices
transferring all the files and work. But still there are offices which handle only
very few files.
7.3.5 Size of Holding and Agricultural Income Tax
A major aspect of the Agricultural Income Tax Act 199 1 is that it exempted
people with 3 hectares of land or less from paying this tax and the exemption is
extended to 5 hectares through the Budget speech 2000-01and is implemented
through Act 7 of 2001 .lt . This is a change, which has long lasting and important
impact on the tax collection in a state like Kerala where land reforms are very
successful. As a result of land reforms, high density of population and the
prevalence of the nuclear family system, size of holdings in Kerala is very small.
Economic soundness of this decision of exemption is dealt with in the
chapter discussing the taxable capacity of the agricultural sector. As we pointed
out earlier this decision was against the recommendation of Raj committeet2 and
Kaleeswaran Committee, which wanted exemption to be given to those possessing
less than 3 standard hectares of land. The difference between 3 standard hectares
and 3 hectares is geatt3.
'l Act7of2001p.119 12 Report of the committee on Taxation of Agricultural Wealth and Income, Op. Cit., pp.50-5 1
13 Report of the committee for Restructuring Agricultural Income Tax Laws, Op.Cit., p 17.
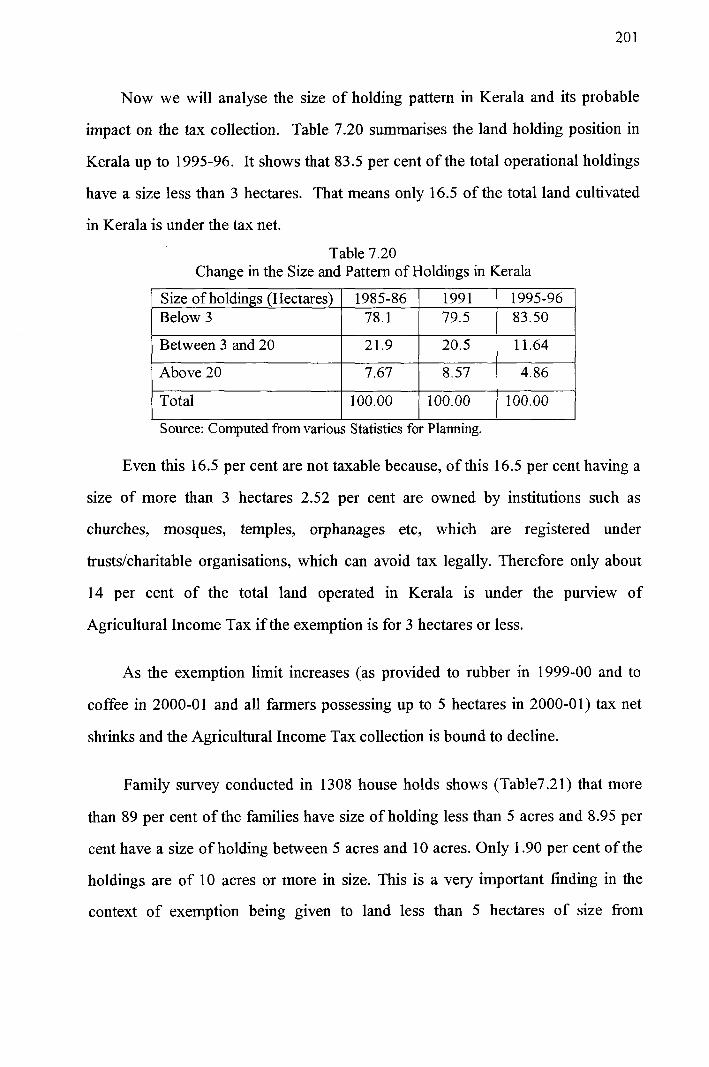
Now we will analyse the size of holding pattern in Kerala and its probable
impact on the tax collection. Table 7.20 summarises the land holding position in
Kerala up to 1995-96. It shows that 83.5 per cent of the total operational holdings
have a size less than 3 hectares. That means only 16.5 of the total land cultivated
in Kerala is under the tax net.
Table 7.20 Change in the Size and Pattern of Holdings in Kerala
Size of holdings (Hectares) Below 3
I Above 20 I I I
1 7.67 1 8.57 1 4.86 \
I I I
Total 1 100.00 1 100.00 1 100.00
1985-86 78.1
Between 3 and 20
l Source: Computed fromvarious Statistics for Planning.
Even this 16.5 per cent are not taxable because, of this 16.5 per cent having a
size of more than 3 hectares 2.52 per cent are owned by institutions such as
churches, mosques, temples, orphanages etc, which are registered under
trustslcharitable organisations, which can avoid tax legally. Therefore only about
14 per cent of the total land operated in Kerala is under the purview of
Agricultural Income Tax if the exemption is for 3 hectares or less.
199 1 79.5
21.9
As the exemption limit increases (as provided to rubber in 1999-00 and to
coffee in 2000-01 and all fanners possessing up to 5 hectares in 2000-01) tax net
shrinks and the Agricultural Income Tax collection is bound to decline.
1995-96 83.50
Family survey conducted in 1308 house holds shows (Table7.21) that more
than 89 per cent of the families have size of holding less than 5 acres and 8.95 per
cent have a size of holding between 5 acres and 10 acres. Only 1.90 per cent of the
holdings are of 10 acres or more in size. This is a very important finding in the
context of exemption being given to land less than 5 hectares of size from
20.5 11.64

Agricultural Income Tax. In that case there will be only a very few assessees of
Agricultural Income Tax in the state.
Table 7.21 Size of Holdings of the Sample Families
% of the total 35.86
42.20
Size of land Less than 50 cents
Between 50 and 300 cents
Between 300 and 500 cents
Between 500 and 1000 cents
1000 cents and above
Source: Household Survey
No. of Holdings 469
552
I
7.3.6 Number of Tax Payers and Assessees
145
117
2 5
When we evaluated the performance of Agricultural Income Tax offices, it
was clear that there is a sharp decrease in the number of tax payers (Table 6.4) and
assesses (Table 6.5) in the nineties. This is quite natural because cultivators
having 3 hectors (subsequently increased to 5 hectors) were exempted fiom
Agricultural Income Tax by the Act 1991.
11.09
8.95
1.90
100.00 Total
7.3.7 Compounding and Partition of Land
1308
Survey also tried to extract information on the number of partitions in the
state in the last 10 years fiom 1993 to verifjr the allegation that farmers are
resorting to artificial partitions of land to evade tax since Agricultural Income Tax
is levied only on those who have land above 3 hectares in 1991 and 5 hectares
since 2001. But the study showed that there were only 42 cases of partitions in the
entire 642 agricultural families in the last 10 years, and only 20 cases of partitions
in which more than two acres of land was handed over. In non- agricultural
families there were only 29 cases of partition, of these there are only 7 cases of
partition involving more than 2 acres of land. Thus, number of partition of land
involving more than two hectares of land were 27 and total number of partitions
were 7 1 in the last 10 years in 1308 families. From this it may be concluded that
artificial partitions are not many in Kerala to escape from the Agricultural Income
Tax.
7.4 Conclusion
The introduction of compounding in1991 and the changes there after to the
Agricultural Income Tax laws have not improved tax collection: but by reducing
the arbitrary powers enjoyed by the tax officials, harassment of farmers came
down considerably. The analysis shows that revenue collection through
agricultural income tax as percentage of total revenue, total tax revenue, state's
own tax revenue, own revenue etc. have decreased in the 1990s. There is only a
mild rate of growth (1.27 per cent) of the revenue collection.
One important aspect of agricultural income taxation is that it is not
responsive either to agricultural income, net area cropped, prices received by the
farmers, cost of cultivation, deterioration in the terms of trade etc. Increase in the
per-cultivator tax collection is chiefly due to the fall in the number of cultivators in
Kerala. There is no sound economic reason for the exemption given to the farmers
having land holding up to 3 hectares irrespective of the type of crop cultivated.
This must have resulted in the lack of buoyancy in tax collection in a state like
Kerala where land reforms have been very successful and 83 per cent of the area
of holding is in the category of less than 3 hectares. The study also unveils the fact
that there isn't any attempt by the farmers to resort to fake partition of land among
the members of the family to evade Agricultural Income Tax.