the implementation of six sigma process improvement …
TRANSCRIPT

SAIIE25 Proceedings, 9th – 11th of July 2013, Stellenbosch, South Africa © 2013 SAIIE
584-1
THE IMPLEMENTATION OF SIX SIGMA PROCESS IMPROVEMENT IN A SMALL FLEXIBLE ENTERPRISE WITH LIMITED RESOURCES
M. Papsch1 and K. von Leipzig2
1Department of Industrial Engineering University of Stellenbosch, South Africa
2Department of Industrial Engineering University of Stellenbosch, South Africa
ABSTRACT
A small manufacturer in Cape Town with 60 employees successfully supplies low volume, specialized socks to its South African customers through fast delivery and high quality. Although the quality delivered to the customer is mostly very good, due to extensive visual inspection before the customer shipment, the processes within the company can be improved.
The Six Sigma process improvement methodology is often used in large corporations to improve complex processes, whereby trained experts titled as Six Sigma belts support the implementation. It is yet unknown if this system can be effectively implemented in a small, responsive enterprise with a low average level of education and extensive resource constraints.
The real-world implementation of the Six Sigma Methodology will show the strengths and weaknesses of the method within a SME and an environment as described. Depending on the process identified and the time needed for improvement, metrics will be measured to validate the effects of the Six Sigma implementation. In addition to this the feedback of Industry experts will be used to confirm the legitimacy of the results.

SAIIE25 Proceedings, 9th – 11th of July 2013, Stellenbosch, South Africa © 2013 SAIIE
584-2
1 INTRODUCTION TO SIX SIGMA
The practical implementation according to [1] and [2] and the analysis of the results gained thereby, will form the focal point of the abstract.
In this chapter a short description of the Six Sigma Methodology will serve as the introduction.
1.1 Origin
Six Sigma was formed by Motorola in the early 1980’s with the intention of improving product reliability tenfold over a five year period. By 1988, the methodology had proved so successful that the company was awarded the Malcom Baldridge National Quality Award. Following this tribute, Motorola (Bob Galvin) decided to share Six Sigma with other companies in the world and it was rapidly adopted by other large manufacturers; most famously General Electric CEO Jack Welsh [3][4].
1.2 Definition
The content of Six Sigma varies within the different schools worldwide, as does the definition. A few examples in the literature are quoted in the following:
‘The Six Methodology is a structured tool with techniques of quality management. It is an effectiveness approach that uses mathematic techniques to understand, measure, and reduce process variation. The core function is process improvement by striving for perfection’ [5].
Originally the statistical definition included that a process could shift 1,5 sigma without detection. Therefore, a 1.5 sigma drift margin was built into the standard definition. If a Six Sigma process shifts 1.5 sigma units from the process mean to left or right, the process would be 99.97% defect free, having 3.4 defects per million opportunities (See Figure 1) [6].
Figure 1 - Process shift of 1.5 Sigma units
1.3 Goal
The goal of Six Sigma is to minimize the number of defects that will cost more to correct in the long term than it would to prevent them from the start. Defects are not only limited to measurable errors, but are defined as anything that stops the process from running at a high quality from the perspective of the customer. These factors are regarded to be critical to quality (CTQ). A large amount of CTQ defects will lead to lost customers and reduced profitability [7][8].
1.4 Metrics
Six Sigma primarily uses three metrics to measure the effectiveness of a given process. These are:

SAIIE25 Proceedings, 9th – 11th of July 2013, Stellenbosch, South Africa © 2013 SAIIE
584-3
Defects per million opportunities (DPMO’s): Number of CTQ factors that are defective per million opportunities. When measuring, this value is extrapolated by sampling and it is not necessary that one million measurements be completed.
Error free yield (EFY): EFY is the percentage of a process that is free of defects.
Sigma Level (σ): σ is the Greek lowercase symbol for Sigma. The higher the sigma value, the lower the number of defects. This relation is described in Figure 2.
Provided one of these metrics is known, the others can be determined.
Figure 2 - Sigma Level & Error-Free Yield
1.5 Six Sigma Process
The steps of the DMAIC roadmap can be generally described as follows:
‘Define a project's purpose and scope, especially the output's CTQ factors;
Measure by creating a performance baseline against which data evidencing errors can he compared, both leading to a more precise refining of the problem statement;
Analyse root causes quantified by actual data;
Improve performance by implementing procedures to eliminate the root causes of errors;
Control the process by evaluating performance both before and after attempting improvement; initiating a monitoring system to reduce future errors; and documenting results, recommendations and lessons learned’ [7]
Within these phases the tools as described by [2] as well as those described by [1], will be used where possible at Sockit Manufacturing and described in detail.

SAIIE25 Proceedings, 9th – 11th of July 2013, Stellenbosch, South Africa © 2013 SAIIE
584-4
2 PRELIMINARY EXPLORING
Before the practical implementation of the Six Sigma approach could be started, a basic understanding of the processes at Sockit had to be acquired. This was critical as the Six Sigma Methodology would be implemented without prior work experience in quality management or the textile industry and ideally the ‘belt’ implementing the methodology should be an employee with experience in the given company.[9]
To partially aquire this experience and trust the of the employees two weeks were spent creating a software supporting the label creation in the factory and linear programming was used to understand where the profit is made at Sockit better. A value stream map and an organogram shown in Figure 3 were created too.
Figure 3 - Organogram

SAIIE25 Proceedings, 9th – 11th of July 2013, Stellenbosch, South Africa © 2013 SAIIE
584-5
3 DEFINE
A better understanding of Sockit Manufacturing as a company had been acquired. The aforementioned also assisted in building a relationship with the employees and their trust. Therefore the implementation of the Six Sigma Methodology could now begin by starting with the first Phase of the DMAIC process: Define.
3.1 Project Charter
The Project Charter is the first tool of the Define phase according to [1][2].
It was finalised at Sockit Manufacturing as shown below (Table 1Error! Reference source not found.) after all the steps of the Define Phase were completed. Prior to this point no clear overview of the failure modes was known and the specific process problems to be solved were unclear.
At Sockit Manufacturing the project team consisted of all the key personnel per department. The CEO was selected as the champion and the author would fill the role of the belt.
Table 1- Project Charter
Project DescriptionProject Nr.CompanyDepartmentAwarding Authority/ ChampionProcess OwnerStart 10.09.2012 End 12.11.2012
Product / ProcessProblem DescriptionSituation the company is in.
The Problem Definition at the Project Kick-OffProject Goal
Direct Cost SavingIndirect Cost SavingDirect Additional RevenueIndirect Additional Revenue
Advantages that do not influence the Revenue
Problem definition for future process improvements documented in the Define Phase.
Advantage for the External Customer
Project FocusInternal MetricsExcluded from Project
Project Manager Markus Papsch Working Time in % 100%Mark Working Time in % 10%Abe Working Time in % 10%Shiftleaders Working Time in % 10%
Working Time in %
Support RequiredWhich resources are needed? E.g. Hardware, Software, Material, Equipment, Support of Experts Completion Date DefineCompletion Date MeasureCompletion Date AnalyzeCompletion Date ImproveCompletion Date Control
Awarding Authority Projectmanager
The Uptime in the knitting department is too lowSockit is less responsive and efficient due to too low uptime.
Knitting DepartmentStellenbosch University / Eugen DohmMark
Business SituationKnitting Process
Project Charter
Optimisation of the Sock Production ProcessSix Sigma AnalysisSockit Manufacturing
Problem and Project Goal
Project Benefits
Project Focus and Framework
Accurate data is not available yet. It is visible that the Knitting machines are often standing still for half a day due to unplanned maintenance. They are also standing for shorter intervalls Decrease the downtime which still has to be measured in order to be more specific.
Missed deliveries, high inventory, direct maintenance cost (parts, labour etc.), additional Yarn storarge cost, logistics, administration
Comments
Roles and Milestones
Team Members
Knitting machine data read outs, Konrad von Leipzig and Eugen Dohm
Milestones
28.09.1217.10.1224.10.1231.10.12Open
Load, Unload, Rework, Inspection, planned process maintenance, unplanned process Downtime on the toeclosing and forming machines is not relevant for this project.
increased sales-
Faster delivery
Knitting Process

SAIIE25 Proceedings, 9th – 11th of July 2013, Stellenbosch, South Africa © 2013 SAIIE
584-6
3.2 Stakeholder Analysis Matrix
The Stakeholder Analysis Matrix (Table 2)[2] indicates the importance and attitude of the stakeholders towards the Six Sigma Project. Herein the current attitude of the stakeholders and the required attitude for the project to be successful are indicated. The usual discrepancy at this point leads to the Strategy to Influence the Stakeholders (Table 3)[2].
Table 2 – Stakeholder Analysis Matrix
In the strategy to influence the stakeholders, the effects of the Six Sigma Methodology that will influence the stakeholders positively are mentioned (Table 3). These simple points proved to be very effective as soon as they were consciously used to influence the stakeholders. The support gained from the stakeholders became stronger, and in addition to this influenced them to motivate their colleges to support the project too.
Table 3 – Strategy to Influence Stakeholders
3.3 SIPOC Map
The SIPOC-Map (Supplier, Input, Process, Output, Customers) (Table 4) is an identification- and communication tool. The identification of the departments involved in the processes, and the definition of the supplier-customer relationships over the process-inputs and –outputs is achieved.
The SIPOC would serve as a communication tool in the Define Step [1] and ensure a uniform understanding of the process.
Which groups or persons are relevant?Is the stakeholder
internal or external?
How relevant/what weighting/which
Influence does the stakeholder have
towards the project?
Are there possibly additional comments?
Classification Importanceopposing strongly
partially opposing
Neutral partially supportive
supporting strongly
-- - 0 + ++
1 CEO Eugeninternal
6 O/X Is not aware of a lot of the problems and wants to find out more
2 Knitting Department Lead Mark internal 6 O X3 Maintenance Abe internal 6 O X4 Shiftleader Raphael internal 5 O X5 Shiftleader … internal 5 O X6 Shiftleader … internal 5 O X7 Shiftleader … internal 5 O X8 Raw Material purchasing Desire internal 4 O X9 Yarnstore Responsible Patrick internal 4 O X
current state OSoll-Zustand Xbeides O/X
Stakeholder AnalysisProcessdescription
How can the stakeholder be judged concering their attitude/behaviour(O) and where should they stand in future (X)?
Nr. StakeholderAttitude towards the project
Commentinternal / external
relatively unimportant (1) -
of great importance (6)
Which groups or persons are relevant?Is the stakeholder internal
or external?
How relevant/what weighting/which
Influence does the stakeholder have
towards the project?
What attitudes exist in detailWhere is the
starting point for influencing?
Who should influence the stakeholder?
How shall the stakeholder be influenced?
Nr. Stakeholder Classification Importance Expectation / Worries Leverage1 Knitting Department Lead Mark internal 6 more work less frustration Markus easier control over department by measuring
2 Maintenance Abe internal 6 more work, competence is measuredimportance of maintenance Mark
more time for maintenance made available in future if lack thereof is proven
3 Shiftleader Raphael internal 5 more work, competence is measured smoother work flow Markexplain possible improvements by measuring and analysing
4 Shiftleader … internal 5 more work, competence is measured smoother work flow Markexplain possible improvements by measuring and analysing
5 Shiftleader … internal 5 more work, competence is measured smoother work flow Markexplain possible improvements by measuring and analysing
6 Shiftleader … internal 5 more work, competence is measured smoother work flow Markexplain possible improvements by measuring and analysing
Strategy to Influence StakeholdersProcess Description
Strategy to Influence

SAIIE25 Proceedings, 9th – 11th of July 2013, Stellenbosch, South Africa © 2013 SAIIE
584-7
Table 4 – SIPOC Map
3.4 Brainstorming
Although the use of brainstorming to determine problems within the process is not discussed in the book by ‘[2]’ it is implemented at Sockit as defined by [1]’. This can be explained, as the practical example of [2] was implemented at an established company, with a higher average skill level and where current problem areas were clearer.
At Sockit Manufacturing there were concerns with regards to implementing the Murphy’s analysis, as the staff members might be afraid to speak about issues in their department in front of their colleges. Quite a few feared losing their jobs if they mentioned any problems. For this reason the employees were interviewed on an individual basis, so their comments could be questioned directly. Hereby it would be more difficult for the person to withhold his opinion and the discussion could also be guided towards the problem source more. Additionally, worries about the consequences of the problem analysis could be discussed individually. By only interviewing one staff member at a time it also had minimal impact on operations and was in line with the target to be minimum resource intensive.
After interviews with the most experienced staff members were completed a first attempt was made to sort the answers into the problem categories [1]. At this stage it was still very difficult to prioritise and correctly allocate the problems to root causes. The issues were numerous and seemed chaotically spread over process steps in the different departments.
Therefore an attempt to use the Murphy’s Analysis was made nonetheless, as it serves to structure the root causes of the failure modes and should help to identify further failure modes.
3.5 Murphy’s Analysis
To summarise how a Murphy’s Analysis is usually completed, it is described with the following steps [1].
1) Show SIPOC map and define the goal of the process:
Polydye, Spintex, Elasticos, 1 Good yarn Starting Point: Good quality yarn 1 Knitting, ToeclosingBG International, TRM 2 Bad yarn Rejected yarn 2 SupplierNot:Meagre, Martilon, Millchem 3 Wax Wax 3Upstairs Office, Yarn Store, 1 Order, Productionsheet, Open socks, Seemless socks 1 Toeclosing
2 Tickets Used Yarn, Empty cones, Norm 2 Boarding3 Good yarn, wax 1 Receive Yarn 3
Yarn store, Knitting 1 Yarn 2 Knitting Closed Socks, Cutoffs, 1 Forming2 Open socks 3 Toeclosing Waste from Errors 23 4 Forming 3
Knitting, Toeclosing 1 Seemless socks 5 Labelling Boarded socks, water 1 Headercards, Seconds2 Closed socks 6 Packing in plastic Waste from errors 2 Packaging, 3 7 Packing in boxes 3 Replenishment Nike
N&R, Labels Incorporated 1 Header cards 8 Delivery Labelled socks, 1 Packaging in plasticInternational Trimmings, 2 Formed socks Waste from errors 2Alton Press 3 Kimbals, hooks 3Preffpack 1 Plastic Packaged Socks 1 Socks in boxesLabelling 2 Labelled, not labelled socks 2
3 3Yarnstore 1 Boxes Socks in boxes 1 Nike, Adidas, Edgars, Packaging in Plastic 2 Socks in plastic 2 Foshini, ReebokCustomers 3 Buf tape, company name tape 3 Factory shopJessy 1 Invoice Socks in boxes 1 Eugens VanDespatch 2 Packed Socks 2 Courier service
3 3Final Step:
6
7
8
1
2
3
4
5
Sockboxes at Customer
2 Operation bzw. Aktivität
3
4
5
6
Order
7
8
1
S uppliers I nput P rocess (High Level) Output Customers
SIPOCSock Manufacturing
Who are the Suppliers?How do the Suppliers contribute to
my Process? Overview of Process StepsWhich Product or which Service does
the Process deliver. Who are the Customers?
SAIIE25 Proceedings, 9th – 11th of July 2013, Stellenbosch, South Africa © 2013 SAIIE
584-8
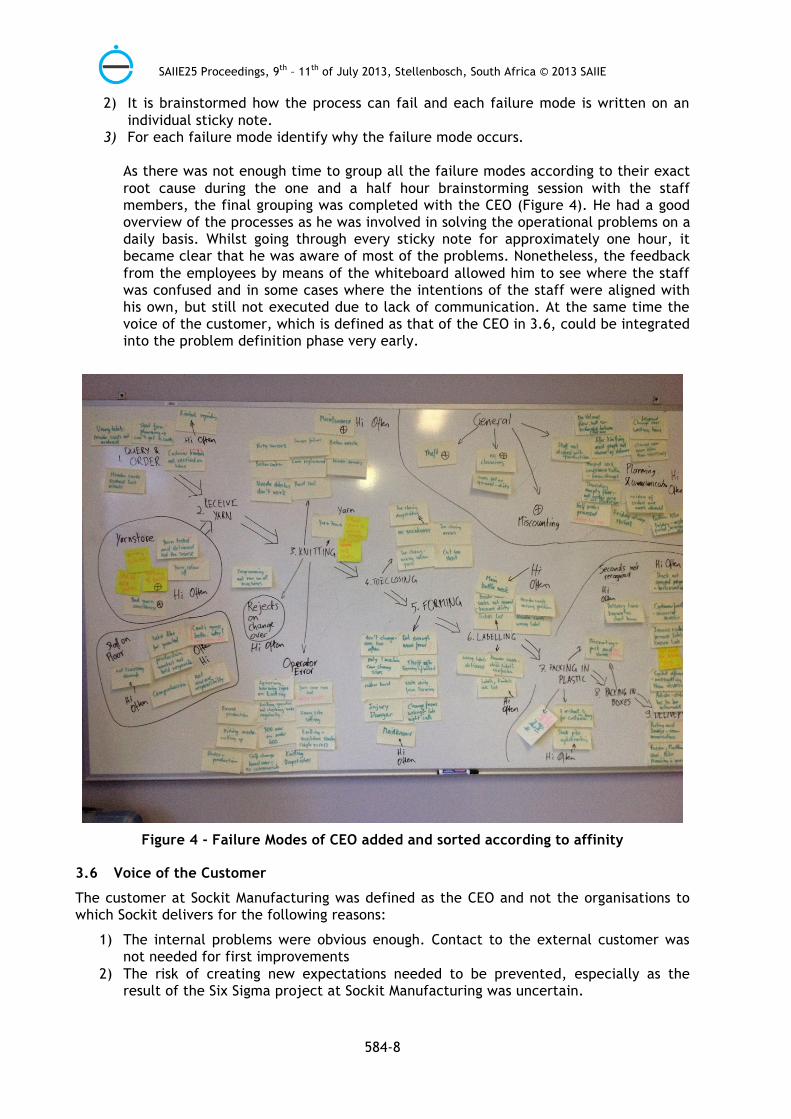
2) It is brainstormed how the process can fail and each failure mode is written on an individual sticky note.
3) For each failure mode identify why the failure mode occurs. As there was not enough time to group all the failure modes according to their exact root cause during the one and a half hour brainstorming session with the staff members, the final grouping was completed with the CEO (Figure 4). He had a good overview of the processes as he was involved in solving the operational problems on a daily basis. Whilst going through every sticky note for approximately one hour, it became clear that he was aware of most of the problems. Nonetheless, the feedback from the employees by means of the whiteboard allowed him to see where the staff was confused and in some cases where the intentions of the staff were aligned with his own, but still not executed due to lack of communication. At the same time the voice of the customer, which is defined as that of the CEO in 3.6, could be integrated into the problem definition phase very early.
Figure 4 - Failure Modes of CEO added and sorted according to affinity
3.6 Voice of the Customer
The customer at Sockit Manufacturing was defined as the CEO and not the organisations to which Sockit delivers for the following reasons:
1) The internal problems were obvious enough. Contact to the external customer was not needed for first improvements
2) The risk of creating new expectations needed to be prevented, especially as the result of the Six Sigma project at Sockit Manufacturing was uncertain.

SAIIE25 Proceedings, 9th – 11th of July 2013, Stellenbosch, South Africa © 2013 SAIIE
584-9
3) The Six Sigma Methodology was implemented successfully at Roeko Kaffeegenuss GmbH [2], without direct contact to the customers outside the company.
3.7 Knitting Department VOC-2-CTQ-Matrix
In the Voice of the Customer to Critical to Quality Analysis (VOC-2-CTQ) the CTQ’s show the properties of the process that influence how the customer sees the quality of the process. It was possible to define the problem categories [1]. These are defined as the key issues in accordance to [2].
The problems to be improved were narrowed down to those in the knitting department, as most of the errors occurring here influence all the downstream processes in the factory. From the twenty-five problem categories the following three (Figure 5) were selected as the Key Issues in the knitting department.
Figure 5 - VOC-2-CTQ Matrix
3.7.1 % Uptime of Process is too low in the Knitting Department
From the three Key Issues that were found, the problem category “% Uptime too low” was selected as the core issue for the Six Sigma Analysis at Sockit Manufacturing for the following reason:
It was unclear, why many of the machines were standing for longer periods in regular intervals. It was assumed that this was mainly due to too much unplanned maintenance, but this could not be proven.
This point will automatically be considered when looking at the downtime, as it will lead to the definition of one of the following problem categories with a high likelihood [1].
Load, unload, setup- or change-over time is too long Re-work time or inspection time is too high Too much unplanned maintenance Planned maintenance takes too long Scheduled workforce breaks
4 MEASURE
The problem category was defined so the Measure phase could begin. The first step to solve this process problem is to complete a Measurement System Analysis. As no data was being taken at this time, a measurement system had to be set up. The best option would have been to purchase a software system from the knitting machine supplier which could automatically log the downtime on a central computer. As it was too expensive an alternative manual measuring system had to be found.
What did the customer
say?
Who is the customer? Is he internal or
external?
How did you get this
information?Critical to...? What is the
key issue?
In which SI-unit is the
requirement measured?
What is the target value?
VOC/VOB Customer Source of information Driver Key issue? SI-unit Target value?
Errors in knitting, rejects on change over
CEO
Interview in front of Murphy's Analysis
QualityProcess defects too high
Rolled Throughput Yield (RTY) or First Time Right
Defects, Accuracy, Scrap, Rework Issues % 90
The knitting machines are standing still too often.
CEO
Interview in front of Murphy's Analysis
Knitting machine uptime too low
Value Adding Uptime % 90
Theft, half used bobbins, unused yarn types
CEO
Interview in front of Murphy's Analysis
Process waste/loss is too high
Raw Material Losses
∑Inputs(kg) - ∑Outputs(kg)∑Inputs(kg) % 90
VOC-2-CTQ-Matrix
What is the requirement in a measureable form?
CTQs
Business

SAIIE25 Proceedings, 9th – 11th of July 2013, Stellenbosch, South Africa © 2013 SAIIE
584-10
4.1 Manual Measurement of Downtime
For this purpose a downtime sheet was created.
4.1.1 Downtime Sheet
The shift leaders were asked to log the type of downtime with start- and end-time. The types of downtime were defined as follows: Loading Yarn, Unloading Yarn, Rework, Inspection of Machine, Planned Maintenance, Unplanned Maintenance, Break Downs, Scheduled Breaks, and Scheduled-Process-Downtime of any form, Change-over time and Setup time. It was important to communicate to the staff that whenever the machine stood still, it was defined as downtime.
4.2 MSA Downtime
As there was no variable data but just attribute data, a classical MSA showing the influence of the measuring device (repeatability), the variance caused by the operator (reproducibility) and the variation caused by the part adding up to the total variation, could not be shown.
4.2.1 Validation
To validate the attribute data logged by the shift leaders, a second method in parallel had to be implemented [1]. Therefore, a second sheet was created to monitor the Rate of Production on the machines. On this sheet, Time of Day, Nr of Socks and Cycle Time should be logged in regular intervals.
After a first test-run where the author measured the production speed to control the logged downtime, the following results were gained. For each drop in production, the cause was found in the downtime sheet and is noted below the graph as shown in Figure 6 for the machines 11-K.
Figure 6 - Rate of Production Machine 11 – L
09:00: Machine 13 had a mechanical error that caused the pattern on the sock to be faulty. Unplanned maintenance was needed to repair the error.
14:00: A new sock type is produced on machine L
0
50
100
150
200
250
300
8:38 9:50 11:02 12:14 13:26 14:38 15:50 17:02
11
12
13
14
15
16
17
18
19

SAIIE25 Proceedings, 9th – 11th of July 2013, Stellenbosch, South Africa © 2013 SAIIE
584-11
4.2.2 Validation Result
After the first measurements were completed it became visible that the different kinds of downtime had to be measured over a minimum of one week to draw valid conclusions.
During this phase it was also noticed that the operators were able to change the sock-count on the machines manually. However this did not have an influence on the validation, as the theoretically possible sock count could be compared to the amount that should be produced with the cycle time that was logged from the machines. After logging and doing the calculation, a method had been found to monitor the production performance by hand.
After discussing the diagrams the department head agreed to this method measuring.
4.2.3 Measuring by the Fixers
After a few weeks, it became apparent that the method to monitor the downtime was not being completed accurately by the fixers. They were well aware that they were measuring their own performance and that it would require effort to write down all the data. Even after repeated explanation the data was still not logged accurately. At this point, it became clear that the manual logging of data might be possible over the short-term under very tight supervision, but was not a long term solution.
4.2.4 Automatic Measurement of Downtime
As mentioned previously, the machine supplier did offer software that would enable a central computer, connected to the machines to monitor the downtime. The cost of this system was too high and would only be considered for purchase when the benefit it would have for Sockit and its 43 machines could be proven.
Therefore, the measurement data could not be validated and the problem category “Uptime of process too low” could not be further analysed for the machines with the current measuring method.
4.2.5 Advantages resulting from the Measurement Method
Although the measured data was not accurate enough for the Six Sigma Improvement Methodology, it became clear that the continued logging of downtime and production volume improved the process.
Before this time, there had been very little measurement tools in place for this process, which made the supervising function of the shift leaders more difficult. Even if the data was not valid and accurate enough for the Six Sigma analysis, it did help to show the major errors that did occur on the machines. The fixers that had to log the sock-count were informed at 3h intervals, which machines were standing still. Therefore they could take counter measures earlier.
As the production workers were now being visibly monitored, the head of the knitting department noticed a definite increase in productivity too.
Unfortunately, as this could not be measured at this time, it could not be proven.
4.3 Measuring Downtime on new machines only
Although a measuring system was not in place to measure the downtime for all the machines, a few of the latest machines on the floor were able to automatically log the last 70 failures. The type and duration of the failure could be measured. The task of writing down every value that the machine logged over the last two to three days was a big effort and would not be viable over the long term. Nonetheless one set of the latest data was enough to make the next attempt to continue with the DMAIC process on the latest machines.

SAIIE25 Proceedings, 9th – 11th of July 2013, Stellenbosch, South Africa © 2013 SAIIE
584-12
4.4 Measurement System Analysis Downtime on New Machines
4.4.1 Validity
A perfect Attribute Measurement System would classify every entity of downtime correctly. Unfortunately this is not the case for the failure statistic. For example if the machine is paused or switched off manually, this is not logged, as it is not a failure. Another problem with the failure statistic is that the same error message can mean several different things. For example Broken Yarn H Sensor N. x indicates that that there is no yarn passing a specific sensor. This could be caused by low quality yarn tearing or the unavoidable situation of when the bobbin runs out of yarn.
The Ishikawa Diagram which will be discussed later would create further clarity on the number of causes for each error type logged by the knitting machine.
4.4.2 Reliability
The automatic logging system is reliable according to the machine specifications.
5 CONTINUING WITH THE AVAILABLE DATA
As the last 70 values spanned over different times on the different machines, only the data over 24 hours was used, because all machines covered this period. By repeated copying of the data from the machines into an Excel sheet, further data could have been acquired, but this was not done due to lack of time.
It was unfortunate that only the downtime on the newest machines was logged. These would most likely have the least technical problems and therefore create a distorted picture of the real situation.
Nonetheless, with the knowledge that more extensive data could be acquired in future, the Six Sigma process was continued. The current data was sufficient to draw conclusions for the newest machines and could serve as a training run for the repeated implementation of the Analyse, Improve and Control Phase on other data in future.
6 ANALYSE
6.1 Baseline Capability Study
The baseline for the downtime with the different causes logged by the knitting machine for a 24 hour period is:
Table 5 - Baseline Capability: Downtime within 24h
As mentioned previously the machine does not log the times when it is switched off, which will typically be done during setup or after a break-down. Therefore this output is not complete.
Failure Type Effect (min)Broken yarn H sensor N.x 373Stop elastic 2 133End bobbin scaffolding 26Stop heel and toe take up 25Yarn not cut H sensor N.x 18Dial not at zero!! Manual. Reset obliged. 12Phase displacement encoder sinker cap posit. Motor 12Stop Dial jacks enter 1 9Stop yarn creel 9Other 37.4

SAIIE25 Proceedings, 9th – 11th of July 2013, Stellenbosch, South Africa © 2013 SAIIE
584-13
6.2 Process Variables Map
The Process Variables Map is a graphical representation of the process that should be analysed. It is important to find the inputs (x’s) influencing the output metrics (y’s) that are important for the customer.
6.3 Pareto Chart
The Pareto Chart can be applied at any point in the project and helps to focus the attention on key areas when there are large amounts of data. With its help, the main downtime causes of the Baseline Capability (Table 5) were graphically displayed for further analysis.
6.4 Ishikawa Diagram
To identify the influencing factors for these main failures the Ishikawa Diagram was used in two separate discussions with the head of the knitting department and the maintenance technician. A diagram was created for each of the first five most common failures detected by the automatic logging system of the new machines. For example Figure 7 – Broken Yarn Sensor.
Figure 7 - Broken: Yarn H Sensor Nx
7 TEAM SUPPORT
At this point the implementation of Six Sigma with the team had to be aborted, as the time period of two months which had been dedicated to the project at the factory, had been completed.
8 CONCLUSION
8.1 Six Sigma Effects
The methodology definitely helped to identify some of the core problems experienced at Sockit Manufacturing (3.7 Knitting Department VOC-2-CTQ-Matrix).
8.1.1 Implementation in Sequence
During the implementation it was noticed, that the Six Sigma tools were intuitively understood and also helped to identify issues and gather ideas from the employees in a

SAIIE25 Proceedings, 9th – 11th of July 2013, Stellenbosch, South Africa © 2013 SAIIE
584-14
constructive manner. Even as an outsider to the company it was possible to gain a good overview rapidly, by implementing the steps of the methodology in the correct sequence. If these quality tools had been picked and chosen without the methodology, they would not have supported each other as effectively. Lastly there was no experience required to implement the tools at the right moment in the improvement process.
8.1.2 Dangers
Care had to be taken when documenting the opinions of the staff. In many interviews problems were brought up that would shift the blame to other departments. Many of them would also not mention the problems in their own department, as they were worried that their performance would be judged to their disadvantage. Convincing the staff that the Six Sigma Process would be good for them and the company, was essential.
8.1.3 Knitting Process
For the knitting process specifically, the manual measurement of the downtime could be performed by a green belt [10], to improve the reliability of the results. Although the Hawthorne effect would play a role here, this would not change the major causes of the downtime, which would be expected to be technical issues (Error! Reference source not found. Error! Reference source not found.). Additionally, the duration of the measurements could be increased to one or two weeks, improving the validity of the results even further. The belt would also be able to log the data on the laptop directly, making the data analysis more efficient.
After acquiring the results, the team members could be included in the Analyse, Improve and Control Phase. By doing so, a drastic improvement in the results would be expected, as the knowledge of the person close to the process could be utilised.
8.1.4 Innovation Management Capability Improvement
By continuing the implementation of the Six Sigma Methodology permanently, the innovation management capability of Sockit Manufacturing could be improved at a cost, which should be continuously monitored. The company would move from a level 2: ‘Know they need to change, but not how or where to get resources’ to a level 3 organisation ‘Know they need to change and have some abilty to generate and absorb technology’.
8.2 Research Question
Can Six Sigma be used to improve the processes of Sockit Manufacturing with limited resources?
The following comments were made by the head of the knitting department:
Lower downtime periods are being achieved as the fixers are more aware of the issues due to logging the production rate of each machine in three hour intervals.
Improved concentration of the operators as their performance is measured by the new downtime sheet and the production rate sheet.
The awareness of problems in the knitting department by the head of the knitting department has increased, due to the documentation of downtime and production rate.
For these reasons the downtime sheet and production rate sheet are still in use after the Six Sigma project was completed.
When discussing the results of the Pareto Chart with the head of the knitting department and the maintenance technician, these were confirmed to be major causes for the downtime across all the machines.

SAIIE25 Proceedings, 9th – 11th of July 2013, Stellenbosch, South Africa © 2013 SAIIE
584-15
Feedback from the industry experts confirms that the Six Sigma approach helped to identify some of the core problems within the knitting department, even without having had substantial experience within the company. However, due to the time constraints, the Six Sigma Improvement project could not be completed in its entirety and the full advantage therefore not measured.
9 REFERENCES
[1] I. D. Wedgwood, Lean Sigma - A Practitioner’s Guide. Upper Saddle River: Pearson Education, Inc., 2007.
[2] R. Jochem, D. Geers, and M. Giebel, Six Sigma Leicht Gemacht. Duesseldorf: Symposium Publishing GmbH, 2011.
[3] D. Drickhamer, “Continuous Improvement,” Industry Week, Penton Publishing, 2004.
[4] M. G. Aboelmaged, “Six Sigma quality: a structured review and implications for future research,” International Journal of Quality & Reliability Management, vol. 27, no. 3, pp. 268–317, 2010.
[5] A. M. Kuo, E. Borycki, A. Kushniruk, and T. Lee, “A Healthcare Lean Six Sigma System for Postanesthesia Care Unit Workflow Improvement,” Quality Management in Health Care, vol. 20, no. 1, pp. 4–14, 2011.
[6] D. Woo and H. Wong, “An Application of Lean Six Sigma To Improve The Assembly Operations At A Wireless Mobile Manufacturing Company,” University of Toronto, 2007.
[7] D. I. Samuels and F. L. Adomitis, “Six Sigma can meet your revenue-cycle needs,” Healthcare Financial Management, no. November, pp. 70–76, 2003.
[8] J. Antony, “Design for six sigma: a breakthrough business improvement strategy for achieving competitive advantage,” Work Study, vol. 51, no. 1, pp. 6–8, 2002.
[9] T. Savolainen and A. Haikonen, “Dynamics of organizational learning and continuous improvement in six sigma implementation,” The TQM Magazine, vol. 19, no. 1, pp. 6–17, 2007.
[10] J. Antony, M. Kumar, and C. N. Madu, “Six sigma in small- and medium-sized UK manufacturing enterprises: Some empirical observations,” International Journal of Quality & Reliability Management, vol. 22, no. 8, pp. 860–874, 2005.
[11] B. P. Gupta and J. Zawacki, “Six Sigma Deployment,” Springs, no. December, pp. 15–19, 2002.

SAIIE25 Proceedings, 9th – 11th of July 2013, Stellenbosch, South Africa © 2013 SAIIE
584-16