the informal economy in greater buenos aires: a statistical
TRANSCRIPT

The Informal Economy in Greater Buenos Aires: A Statistical ProfileValeria Esquivel
WiEgo Working Paper (Urban Policies) No 8 December 2010
WIEGO Working Papers* The global research-policy-action network Women in Informal Employment: Globalizing and Organizing (WIEGO) Working Papers feature research that makes either an empirical or theoretical contribution to existing knowledge about the informal economy especially the working poor, their living and work environments and/or their organizations. Particular attention is paid to policy-relevant research including research that examines policy paradigms and practice. This series includes statistical profiles of informal employment and critical analysis of data collection and classification methods. Methodological issues and innovations, as well as suggestions for future research, are considered. All WIEGO Working Papers are peer reviewed by the WIEGO Research Team and/or external experts. The WIEGO Publication Series is coordinated by the WIEGO Research Team. This report was commissioned under the Inclusive Cities Project by WIEGO’s Urban Policies Programme Director Caroline Skinner, who is based at the African Centre for Cities at the University of Cape Town.
About the Author: Dr Valeria Esquivel is a researcher and assistant professor of economics based at Universidad Nacional de General Sarmiento, Argentina. She coordinated the technical teams of the Argentinean Ministry of Labour (MTESS), the National Statistical Office (INDEC), and the World Bank (BM) during the design stages of the Informal Labour Module, which was collected in 2005. She has published in the areas of labour market regulation and informal labour, poverty and income distribution, time-use methodologies, and the care economy.
Publication date: December 2010 ISBN number: ISBN 978-92-95095-10-6
Published by Women in Informal Employment: Globalizing and Organizing (WIEGO) A Charitable Company Limited by Guarantee – Company No. 6273538, Registered Charity No. 1143510
WIEGO Secretariat WIEGO LimitedHarvard Kennedy School, 521 Royal Exchange79 John F. Kennedy Street Manchester, M2 7EN, Cambridge, MA 02138, USA United Kingdomwww.wiego.org
Copyright © WIEGO.
This report can be replicated for educational and organizing purposes as long as the source is acknowledged.
Photo courtesy of proyectosurchaco.blogspot.com. For non Spanish speakers “Salarios dignos” means “Dignifying (or sufficiently high) wages and “Paguen los aportes” means “Make social security contributions”
* This paper was first published in the Urban Policies Research Report Series. In May 2012 WIEGO launched this Working Paper Series incorporating all the Urban Policies Research Reports.

ContentsExecutive Summary ...................................................................................................................................1
Introduction ..............................................................................................................................................2
The Informal Economy: A Conceptual Framework ........................................................................................3 From the “Informal Sector” to “Informal Employment” ..........................................................................3 The Informal Economy .........................................................................................................................3
Previous Measures of the Informal Sector in Argentina ...............................................................................5
The Informal Labour Module (ILM) .............................................................................................................7 The EPH ..............................................................................................................................................7 The Methodological Approach in the Informal Labour Module ...............................................................7 The Informal Labour Module as a Tool to Inform the Debate Around Informality in Argentina .................9
Informal Employment in Greater Buenos Aires (2005) ...............................................................................11 Overview ............................................................................................................................................11 Formal and Informal Employees .........................................................................................................13 Formal and Informal Independent Workers .........................................................................................21
Personal Characteristics of Formal and Informal Workers in Greater Buenos Aires .....................................28 Formal and Informal Employees .........................................................................................................28 Formal and Informal Independent Workers .........................................................................................33
Earnings .................................................................................................................................................36 Formal and Informal Wage Earners .....................................................................................................36 Formal and Informal Independent Workers .........................................................................................39 An Aggregate View on Labour Earnings ...............................................................................................40
Conclusions ............................................................................................................................................41
References .............................................................................................................................................43
WIEGO Working Paper (Urban Policies) No 8

WIEGO Working Paper (Urban Policies) No 8
1
Executive SummaryThis report interrogates the nature of the informal economy in Greater Buenos Aires – the city of Buenos Aires and its surroundings. It takes advantage of the existence of a unique dataset, the Informal Labour Module (ILM), which was collected in 2005 as a module of Encuesta Permanente de Hogares (EPH). Among ILM’s objectives were characterizing informal employment, particularly through tackling the extent and reasons of wage employment; understanding the various ways in which the formality of the production unit relates to the formality of employment; and ultimately, to inform the debate and policy on informal employment in Argentina.
Informal employment is an extensive phenomenon in Greater Buenos Aires. Forty-five per cent of its 5.3 million workers are informal, as per the information collected by the ILM module in 2005. Informal employment is far more extensive than employment in the informal sector, which explained 20 per cent of total employment. In other words, less than half of all informal employment was found in the informal sector. Almost 7 out of 10 workers work for formal production units, as defined by the proxy variables used in the ILM. But working for a formal production unit does not guarantee being a formal worker: following the same example, roughly five out of these seven workers are formal, but two workers are not, even when the production unit they work for is formal. Lastly, as many as 8.2 per cent of workers in Greater Buenos Aires work for households, most of them in informal positions.
Women are more likely to be in informal employment than men: half of women workers are informal workers, while this proportion is 42 per cent among men. More than one third of informal female workers are domestic workers, employed by households; and roughly one sixth each works for formal (13.8%) or informal enterprises (14.1%). Men’s informal employment is more related to informal production units than women’s, as over half of all informal male workers work for informal enterprises.
Informal employees and independent workers who work in informal production units, which constitute the informal sector, are in the most vulnerable position, and account for almost half of total informal employment. They are likely to be men, semi-skilled or unskilled, and concentrated in construction and trade (and transport, if they are informal employees). Their mean monthly earnings are only half the mean earnings of their counterparts (with the same status in employment), although informal independent workers are relatively better off than their waged counterparts.
Informal workers employed by formal enterprises account for a third of informal employment. Women are relatively more likely to belong to this group than men, with a high incidence of semi-skilled workers, and a concentration in manufacturing and trade. Although they are unprotected by the Labour Law, these workers’ mean monthly and hourly earnings are higher than informal employees in informal enterprises.
The remaining group of informal workers is female domestic workers, employed by households. De jure and de facto discriminated against, these women have the lowest educational credentials and have the lowest monthly earnings among informal employees. They constitute a group of highly vulnerable female workers, for whom specific policies should be designed and implemented.
Both this report and previous analyses based on the ILM point to the fact that the informal economy is highly heterogeneous in Greater Buenos Aires, and that policy measures should differ according to the existing groups of informal workers within the informal economy.

WIEGO Working Paper (Urban Policies) No 8
2
IntroductionThis report interrogates the nature of the informal economy in Greater Buenos Aires – the city of Buenos Aires and its surroundings. It takes advantage of the existence of a unique dataset, the Informal Labour Module (ILM).1 The ILM was collected as a module of Encuesta Permanente de Hogares (EPH), the Argentinean urban labour force survey, in the last quarter of 2005. The ILM was a one-time endeavour, which sought to expand existing knowledge on the size and the dynamics of the informal economy in Greater Buenos Aires. Although both informal workers (who may work in formal or informal enterprises) and informal enterprises comprise the informal economy, the ILM’s main contribution was to help characterize formal and informal enterprises – something that cannot be done based on EPH routine data collection – thus providing information on the link between the formality of employment and the formality of the enterprise, unexplored before in the Argentinean context.
This report presents new tables and analyses that enrich those already published by the Argentinean Ministry of Labour (MTESS/BM, 2007 and 2008). All tables are disaggregated by sex, in order to understand women’s and men’s different informality profiles. Tables distinguish between formal and informal employees and independent workers (own account workers and employers) characterizing the enterprises (or households, in the case of paid domestic workers) for which they work.2 This report also identifies two of the three worker groups that the Inclusive Cities Project is concerned with: street traders and home-based workers. Regrettably, there is no way to identify waste pickers, as there is not such an activity in the national classification of activities (and neither EPH nor ILM show the job description as declared by the respondent).
The report is structured as follows. Section 2 lays out the framework for collecting information on the informal economy, proposed by the International Labour Organization (ILO) (2003). Section 3 reviews previous measures of the informal sector in Argentina, paying attention to the methodological approaches used to make these calculations. Section 4 describes the ILM approach to measuring informal employment, including a section on the political motivations that informed its design.
The key findings of this report are presented in sections 5, 6, and 7. Section 5 provides an overview of the extent of informal employment in Greater Buenos Aires, as well as a characterization of formal and informal wage/salary employment and independent employment according to industry, job qualification, and hours worked. This section also presents the limited information there is on street vendors and home-based workers.
Section 6 presents personal characteristics of formal and informal workers, including age profiles, position in household, and educational attainment. Section 7 focuses on earnings, and also presents multivariate analyses of hourly earnings for employees and for independent workers. A final section concludes.
1 The ILM was a joint project by the Argentinean Ministry of Labour, Employment and Social Security (MTESS) and the World Bank. The database is available at http://web.worldbank.org/WBSITE/EXTERNAL/BANCOMUNDIAL/EXTSPPAISES/LACINSPANISHEXT/ARGENTINAINSPANISHEXT/0,,contentMDK:21111327~pagePK:141137~piPK:141127~theSitePK:500337,00.html
(accessed 26 February 2010). 2 In this report, unpaid family workers are included in all analyses of the size of informal employment.

WIEGO Working Paper (Urban Policies) No 8
3
The Informal Economy: A Conceptual Framework
From the “Informal Sector” to “Informal Employment”
There is a long standing tradition of research on the informal economy in Latin America. Following the approach taken by the ILO’s Kenya Report (1972), PREALC (Programa Regional de Empleo para América Latina y el Caribe) defined the informal sector as economic units with little or no capital that use primitive technologies and unskilled labour and have low productivity (Orsatti and Calle 2003). As a result, informal sector units tended to provide workers with very low income, usually not enough to lift these workers and their households out of poverty. At the time it was understood that the informal sector had its roots in the inability of the formal sector (which was undergoing a process of rapid industrialization) to absorb the ever-growing labour force. It was thus believed that the informal sector would fade away with the development process.
By the end of the 1980s, however, it was clear that the informal sector was contradicting those predictions. Two competing hypotheses emerged to explain how the informal sector had become a “structural” feature of Latin American economies. Some contributions emphasized the strong relationship between formal enterprises and their informal counterparts. They argued that by subcontracting informal enterprises, formal enterprises were able to reduce their costs, in the face of the opening up of the economy and the competitive pressures brought about by globalization (Portes, Castells and Benton 1989). Others (most notably de Soto 1987) emphasized the entrepreneurial skills and capitalist behaviour of informal enterprises, blaming excessive government regulations for their lack of formality.
In parallel, Latin America saw the surge of non-standard, precarious, or unregistered forms of wage work – wage employment relationships that do not comply with labour legislation. Workers’ lack of registration for social security is generally associated with low wages, job instability, underemployment, and the lack of social protection. The most striking feature of this type of informal employment is that it occurs both within and outside the informal sector. Specific groups of employees are more likely to be informal than others, either because they work in industries with high incidence of informal enterprises (e.g. the garment industry) or because labour regulations are weaker or difficult to enforce (e.g. domestic workers). Formal workers, on the other hand, are typically more prevalent in public employment and in large formal enterprises.
The Informal Economy
The ILO (2003) has recently coined the broader informal economy concept to capture the two dimensions of informality reviewed above – the informal sector and informal employment. As Figure 1 shows, this means making operational both dimensions according to the observation unit: the informal sector is defined following the type of production unit (rows), while informal employment is defined according to the job status in employment (columns) and coverage of social protection. An important feature of this new broader framework is that informal employment can be found both within and outside the informal sector. Likewise, employment in the informal sector comprises all jobs in informal enterprises, irrespective of their workers’ employment status.

WIEGO Working Paper (Urban Policies) No 8
4
Figure 1.A Conceptual Framework: The Informal Economy
Production units by type
Job by status in employment
Own account workers
EmployersContributing
family workers
EmployeesMembers of producers’
cooperatives
Informal Formal Informal Formal Informal Informal Formal Informal Formal
Formal sector enterprises 1 2
Informal sector enterprises(a)
3 4 5 6 7 8
Households(b) 910
(a) As defined by the Fifteenth International Conference of Labour Statisticians (excluding households employing paid domestic workers).(b) Households producing goods exclusively for their own final use and households employing paid domestic workers.
Note: Cells shaded in dark grey refer to jobs, which, by definition, do not exist in the type of production unit in question. Cells shaded in light grey refer to formal jobs. Un-shaded cells represent the various types of informal jobs.
Informal employment: Cells 1 to 6 and 8 to 10. Employment in the informal sector: Cells 3 to 8. Informal employment outside the informal sector: Cells 1, 2, 9 and 10.
Source: Hussmanns (2004)
With reference to the matrix shown in Figure 1, the informal sector comprises own account workers and employers employed in their own informal enterprises (cells 3 and 4), and contributing family members, employees and members of producer cooperatives working for informal enterprises (cells 5, 6, 7 and 8). Informal employment, in turn, includes cells 1 to 6 and 8 to 10. Note that contributing family workers are always informal (cells 1 and 5), as are own account workers and employers working for informal sector enterprises (cells 3 and 4). Informal employees are informal when they hold wage jobs that are outside the framework of regulations, therefore unprotected by labour legislation. In turn, informal sector enterprises are defined as production units operated by single individuals or households that are not constituted as separate legal entities (they are not incorporated enterprises), and that do not have a set of financial accounts that clearly distinguishes the enterprise from their owners.
Informal employees have generally been identified in Latin America using the existence of social security contributions as an indicator of registration (Orsatti and Calle, 2003). Registration in social security thus operates as a proxy variable for the full compliance of the Labour Law, which regulates employees’ rights, including sick leaves, vacations and annual bonuses.3 Informal wage work is thus comprised of employees who work for informal sector enterprises (cell 6), as well as some who work for formal sector enterprises (cell 1) or households (cell 10). Note that the social security criterion could also be applied to own account workers and employers, who might contribute to social security by themselves, but this is not the criterion followed by the ILO, given social security does not play the proxy variable role indicated above.
Informal sector enterprises have been identified in some Latin American studies by establishing a certain size threshold in terms of number of workers, below which it can be assumed that separation does not hold and that the enterprise is characterized by little capital accumulation and low productivity. Alternatively, it can be opera-tionalized by following the enterprise registration criteria (namely, establishing whether the enterprise complies with business regulatory frameworks and legislation). However household surveys typically provide no informa-tion on enterprises. In Argentina, measures of the informal sector have generally defined informal production units to be “family units” (those operated by non-professional own account workers with or without contributing family workers) and “microenterprises,” defined as productive units with no more than five employees.
3 Evidence supports this is the case in Argentina (MTESS/BM, 2007: 47).
WIEGO Working Paper (Urban Policies) No 8
5
Previous Measures of the Informal Sector in ArgentinaStudies of the informal sector in Argentina have emphasized its heterogeneity and have differentiated it from the traditional Latin American urban informal sector, associated with low productivity units and low-paying unstable jobs. Within the Argentine informal sector, such jobs have coexisted with relatively high-productivity units with long and stable trajectories. Small production units in the manufacturing industry, trade, and personal services accompanied Argentinean post-war development and supported the consolidation of a non-professional middle class, representing a viable way of making a living. In contrast, during the second part of the 1970s and in a context of stagnant formal employment demand, the informal sector was characterized by “refuge” behaviour, increasing its share in total employment by almost five percentage points (from 29.4% in 1975 to 34.2% in 1980) (Carpio and Novacovsky 1999:14).
A 1980 survey of independent workers (employers of microenterprises and own account workers), collected as a module of EPH in Greater Buenos Aires, illustrated this mixed picture. Half of respondents reported having been in their current occupation for at least 10 years, and a quarter for at least 20 years, while most of them were between 40 and 59 years old. Those who had entered these occupations after 1976 were mostly women (or not household heads) and engaged predominantly in trade-related activities. When compared to formal sector workers, independent workers’ average educational credentials were similar; their average income was higher, but their income distribution was less concentrated (showed greater variability) than comparable (same sector) employees. The study also reports that most of the independent workers were voluntary, in that only 7 per cent attributed the reasons for being independent to low chances of becoming an employee. Among the reasons for being independent, there were “expectations of greater income, desire for greater labour independence and desire to make better use of own qualifications” (Dirección Nacional de Políticas y Programas Laborales 1981: 182).
A similar survey conducted in 1988 shows relatively few changes for an economy that stagnated during that decade, probably due to the low overall productivity and the slow growth in labour force participation. However, one notable difference was that the loss of, or difficulties related to, wage jobs was the main reason cited for becoming independent. This survey also showed that 54 per cent of active independent workers did not contribute to social security (Carpio and Novacovsky 1999).
During the early 1990s the size of the informal sector increased from 35.3 per cent in 1990 to 38.5 per cent in 1993. However, the sector decreased its share of total employment from that point onwards, returning by 1998 to the 1980s’ size (29%) (Carpio and Novacovsky 1999). In a context of increasing unemployment, this trend contradicts the countercyclical role historically attributed to the informal sector – the claim that the informal sector will expand when formal employment contracts. This combination of increasing unemployment, stable informal sector employment, and increased informality among employees has been attributed to a decline in manufacturing industry microenterprise, small-scale trade activities and social services.
In 1999, Monza used an alternative definition of the informal sector, excluding employment in households (domestic workers), public sector employment (considered formal by definition), selected industries (assumed to be formal), high-skilled own account workers; and employees in firms other than microenterprises (irrespective of whether they were registered for social security). He also inferred the number of employers based on existing information on employees, and adjusted for hourly income. Using this (more restricted) definition and based on EPH, Monza estimated that Argentine’s urban informal sector went from 18.2 per cent of total employment in 1991 to 20.5 per cent in 1995; and declined to 19.1 per cent of total employment in 1998. These figures are close to half those presented by Carpio and Novacovsky (1999) due to the alternative definition used, but show the same upward trend in the first half of the decade and downward trend in the second half.
WIEGO Working Paper (Urban Policies) No 8
6
A study based on the 1997 Encuesta de Desarrollo Social (or Social Development Survey) shows a larger informal sector than that of the equivalent EPH-based estimations. This study found 39.9 per cent of private employment was in the informal sector. This consisted predominantly of non-professional own account workers (50.1% of those working informally) and employees in microenterprises (36.6% of those working informally). A very small percentage of these workers were recorded as microenterprise employees (7.3%) and family workers (5.8%). The authors report that although 50 per cent of all income earners in the first quintile were informal, 30 per cent were informal in the fifth quintile. Given that not all participants who work in the informal sector are found to be poor, the authors conclude that Argentina’s informality remained very heterogeneous (with a quasi-formal strata within it, particularly among employers). Informal workers were mostly men (71%) and poorly educated (68% reported having less than a secondary school education). Informal sector workers reported a relatively long duration in the occupation (over 10 years) and long-working hours (Siempro 2001).
Using 1991 Census data, Beccaria, Carpio and Orsatti (1999) calculated that family units accounted for 28.4 per cent of total employment, and microenterprises represented 19.1 per cent of it, resulting in an informal sector estimate of 47.5 per cent of total employment in 1991. This estimate, like those previously mentioned, is highly dependent on the definition selected by the authors and the information source. This case represents an upper bound for informal sector size in 1991, in contrast to Monza’s lower-bound estimate for that year of 18.2 per cent.
More recently, Pok and Lorenzetti (2004) elaborated a definition of informality linked to income, enterprise size, social security contributions, and type of labour contract. Based on the last non-continuous EPH observation (May 2003),4 they calculate that informal employment reached 45.8 per cent of total urban employment. If domestic workers were added, informal employment reached 52.5 per cent of total urban employment.
Using the same sources, the Ministry of Labour estimated that non-registered wage employment comprised 53.4 per cent of total private sector employment and 10.1 per cent of public sector employment (MTESS 2004). The same study shows that a fifth of unregistered public sector employees contribute to social security themselves, as if they were own account workers. Among private sector informal workers, the study singles out three groups of informal employees, which together constitute the bulk of private informal employment: domestic workers (24%), employees in microenterprises (49%), and employees in firms other than microenterprises (27%).
Lastly, the World Bank (2006) took advantage of the 2001 Population Census information on social security payments for all individuals employed irrespective of their job status to estimate that 4 out of 10 workers in Argentina are informal. Informal employment is comprised of (in percentages of total employment): unregistered employees (21.8%); non-professional own account workers (13.5%); microenterprises’ employers (3.1%); and family workers (2.4%). The 2001 Population Census is the only source of information on rural employment, which in Argentina amounts to less than 5 per cent of total employment. According to the World Bank, informality reaches 39 per cent of total employment in urban areas; 50.1 per cent in semi-rural areas and 63.9 per cent in scattered rural areas.
Although non-comparable – as the ways of defining and operationalizing informality, as well as the sources of information, have varied greatly – these studies have shown the peculiar characteristics of the informal sector in Argentina, pointing to its heterogeneity and its long-term stability. Lately, the emphasis has shifted from measuring the informal sector to measuring informal employment. According to different sources, between 40 per cent and fully half of total employment is informal in Argentina – a proportion that exceeds any previous measure of the size of the informal sector. This increase has prompted the need to understand the different dynamics that could be behind this phenomenon. The ILM module was an attempt to fill this information gap.
4 For details on EPH methods, see below.

WIEGO Working Paper (Urban Policies) No 8
7
The Informal Labour Module (ILM)5
The EPH
The Encuesta Permanente de Hogares (EPH) is the main household survey in Argentina. It is collected by the National Institute of Statistics and Census (INDEC). The EPH has been conducted regularly in Greater Buenos Aires (GBA) since 1980 and in a wider selection of urban areas of the country since 1992. Its aim is to measure changes in employment indicators, as well as to compile socio-demographic data, including gender, age, marital status, migration, and education among others. It covers 31 large urban areas which are home to 71 per cent of the Argentine urban population. Since the population share of urban areas in Argentina is 87.1 per cent, the sample of the EPH represents around 62 per cent of the total population of the country.
A major change in the EPH took place in 2003 when a new questionnaire and survey schedule were introduced. The new survey is carried out continuously over the whole year, rather than in two rounds (May and October) like the old EPH. The new questionnaire improved the way the survey captures the job category, and the reporting of labour variables and incomes.
The EPH collects information on variables relevant for identifying and characterizing informal employment. In particular, EPH provides important information on the characteristics of employment (job status in employment, qualifications, monthly earnings), and of employer enterprises (size and industry). From the 1980s, information has been collected on social security contributions, allowing differentiation between registered and non-registered employees.
In 2003, EPH improved the collection of variables that help characterize independent workers, including information on their expenditures and capital, the number and kind of clients they cater to, the legal status of enterprise, and the existence of partners. It however does not collect information on the registration status of independent workers, nor on their enterprises’ compliance with existing business regulations.
Also in 2003, EPH expanded the information it collects on employees, in particular the type of contract (whether employees were on probation6 or provided with on-the-job training); and type of employer (private enterprise, the state, or households). The EPH also expanded the information it provides on domestic workers, who are by definition considered employees (INDEC 2003).
The Methodological Approach in the Informal Labour Module
The ILM was collected as a module of the EPH in the last quarter of 2005. It was administered to all the employed (irrespective of their status in employment).
The objectives of the Informal Labour Module were:a) to inform debate and policy on informal employment in Argentina; b) to characterize informal employment, particularly through tackling the extent and reasons for informal
wage employment; c) to understand the various ways in which the formality of the production unit relates to the formality of
employment.
Conceptually, the ILM follows the new ILO framework for identifying informal employment based on the type of production unit (the rows in Figure 1) and the characteristics of job status in employment (the columns in Figure 1).
5 For a detailed discussion on the ILM design issues, see Esquivel (2006).6 During the first three months of any new wage job, employees are on probation and can be dismissed with lower costs than would
be incurred in standard employment relationships.

WIEGO Working Paper (Urban Policies) No 8
8
The main innovation of the ILM is the characterization of the formality of the production unit (formal and informal enterprises, and households) for which workers work. This posed a particularly challenging endeavour in a module attached to a labour force survey in which workers, but not enterprises, are the unit of analysis. The ILM relies on the knowledge workers have of the characteristics of the enterprise they work for, even though employees might have only a very general sense of whether the enterprises are formal or not.
In the case of employees working for private enterprises, the existence of a set of accounts (or whether the enterprise uses some accountancy service), and the question of whether the enterprise provides receipts when selling its product (i.e. an indication that the enterprise pays value added tax) were used as a proxy for enterprise formality (the fact that the enterprise complies with business regulations and does not evade business taxes). Informal private enterprises were those in which none of these proxies had a positive answer, and where no employees were registered with social security.
In the case of employees working for public sector institutions, it was assumed that these production units (whether enterprises or not) are formal by definition. Following Figure 1, households that employ domestic workers are a separate type of productive units (neither formal nor informal enterprises).
In the case of independent workers, the question on the formality of the production unit was directly posed to own account workers and employers, although in very schematized terms. A set of pre-established answers was offered to respondents in order to identify whether the enterprise had been registered and regularly paid business taxes (“I registered the enterprise and regularly pay;” “I registered the enterprise but I do not regularly make payments;” “I never registered the enterprise because…”). Only the latter (never registered) are considered informal.
As noted previously, the criterion of being registered for social security was used as a proxy for compliance with labour regulations and therefore as the main variable to identify informal wage work. The same criterion was applied to own account workers and employers with respect to themselves, also as a proxy variable but in this case for their compliance with business regulations. In Argentina, own account workers and employers in small businesses can pay a fixed rate with thresholds, depending on the size of their businesses (measured by annual sales). This “unique tax” (“Monotributo”) covers these workers’ social security payments, health, and business taxes. (Bigger businesses pay their social security contributions and business taxes separately.) Therefore, the formality of the enterprise was also approached by identifying whether independent workers regularly make social security payments (“Do you pay your social security contributions…?”; With “Monotributo?”; “On your own?”; “You don’t pay because…?”). If independent workers did not make these payments (i.e. if they regularly evaded their social security and business tax obligations) they, as well as their businesses, were considered informal.
The EPH questionnaire is designed according to status in employment (employers, own account workers, employees and family workers), and information on each is collected through different “tracks.” The ILM consisted of two modules, designed to match these tracks. Module “A” was administered to independent workers – employers, own account workers and own account workers who work for a single “client.”7 Module “B” was administered to employees with specific questions depending on whether they were registered or not.
Both modules follow the same structure: i) identification and specific questions; ii) motivations to be employee/independent; iii) questions related to the productive unit, which in the case of independent workers included information regarding the origin of the enterprise, its development and perspectives; iv) worker social security status.8
7 These workers, typically subcontractors, are considered “masked” informal employees by EPH.8 Each module also included a section on “transitions,” aimed at replacing the lack of long-term panel data. The analysis of that
section is beyond the scope of this report.

WIEGO Working Paper (Urban Policies) No 8
9
The Informal Labour Module as a Tool to Inform the Debate Around Informality in Argentina
The previous analysis, summarized above, indicated that informal employment in Argentina is a pervasive and multifaceted phenomenon that extends beyond what could be safely attributed to the employment generated by the informal sector. There are, however, competing views about why informal employment is so prevalent in Argentina, and therefore about appropriate policy responses.
Many have argued that informal wage employment within the formal sector is caused by excessive labour regulations and high labour taxes (including social security contributions). It should be noted that within the Argentinean labour regulatory framework, employers are responsible for paying both employees’ contributions to social security on their behalf (which are “deducted” from wages) and employers’ contributions to social security, as well as for paying other labour taxes (which are calculated based on wages). 9 In other words, employees cannot pay their social security contributions themselves. The supporters of the view that social security payments are “too high” would see the avoidance of social security and other wage-related payments as representing the outcome of a negotiation between employers and employees, with the latter sacrificing their labour rights in exchange for higher wages.
For this reason, a specific question on whether such negotiation had taken place at the onset of the employment relationship was introduced in the ILM (Module “B”). Almost all (95%) of informal employees reported that they had no choice but to accept informal working conditions in order to get their jobs (MTESS/BM 2007:48). Thus, according to the ILM, there is no evidence whatsoever that informal employment is related to a bargain in which employees trade labour protection for higher wages. Moreover, there is ample literature showing that in Argentina, lack of registration is the main dimension that explains lower hourly wages and earnings among employees, both in the case of women and of men (see for example Beccaria et al. 2005; Esquivel 2007; and section 7, below).
Regarding the informal sector, all previous analyses stressed its heterogeneity, and the fact that it is not necessarily linked to poverty in the Argentinean context. At the same time, all previous measures of the informal sector had been indirect, resorting to variables other than the registration of the enterprise to identify the informal sector, due to lack of data. The ILM allows testing of the overlap between the formality of the enterprise and the dimensions traditionally used to approach it – in particular, enterprise size, and employers’ and own account workers’ formal qualifications. Evidence collected by the ILM generally supports such overlap, although with a relatively high error margin. Only 30.8 per cent of unskilled/semi-skilled own account workers are formal, while this proportion reaches 63.1 per cent among skilled/professional own account workers and 88.5 per cent among employers (Apella and Casanova 2008: 130).
Apella and Casanova (2008: 142 – 145) find that formality among independent workers is positively related to: being male, older and more educated; being an employer (as opposed to being own account worker); working in commerce or services (but not in manufacturing industry, agriculture or in other sectors); having longer years of service in the occupation; and satisfaction with being independent (as opposed to the desire to be an employee). Being a formal independent worker is also strongly and positively related to labour income.
In the same vein, Waisgrais and Sarabia (2008: 188) find two groups among informal independent workers. One is formed predominantly by male migrants, those who live in the city outskirts, those with very
9 Note that it is not possible to pay social security contributions but not to pay other wage-related taxes. If social security contributions are paid, all other contributions are paid as well.

WIEGO Working Paper (Urban Policies) No 8
10
low educational credentials, and those with low skills. For this group of workers, informality and poverty are strongly related, and being an informal independent worker becomes the only alternative to unemployment, given their limited chances of finding a wage job. The other group is formed predominantly by women, who live in the city of Buenos Aires, are skilled and hold university degrees. In this case, informality is not associated with poverty, but with other reasons. The authors speculate that these workers are “at the margin of informality” – i.e., they are similar to formal independent workers and could easily become formal (Waisgrais and Sarabia 2008: 203).
These results support the view that policy measures should differ according to these different groups of informal independent workers within the informal sector. For those on the verge of poverty, simplified tax and social security contributions schemes have been implemented. For those “at the margin of formality,” improved tax controls have been suggested. The ILM has also helped envision policies directed towards sectors where a particularly high incidence of informality was reported, for example in construction, transportation and commerce (Novick et al. 2008; Waisgrais and Sarabia 2008).

WIEGO Working Paper (Urban Policies) No 8
11
Informal Employment in Greater Buenos Aires (2005)None of the analyses based on the information provided by the ILM reviewed in the previous section focused explicitly on the gender dimensions of informality, even though gender proved a significant dimension to explain both the incidence of informality and the different characteristics of informal workers. Thus, sections 5, 6 and 7 in this report complement published analyses by presenting sex-disaggregated tables describing women’s and men’s informality profiles and sex-disaggregated multivariate analyses of labour earnings.
Overview
Informal employment is an extensive phenomenon in Greater Buenos Aires. Forty-five percent of its 5.3 million workers are informal, as per the information collected by the ILM module in 2005. Informal employment is far more extensive than employment in the informal sector, which explained 20 per cent of total employment. In other words, less than half of all informal employment was found in the informal sector. Almost 7 out of 10 workers work for formal production units, as defined by the proxy variables used in the ILM. But working for a formal production unit does not guarantee being a formal worker: following the same example, roughly five out of these seven workers are formal, but two workers are not, even when the production unit they work for is formal. Lastly, as much as 8.2 per cent of workers in Greater Buenos Aires work for households. As is clear from Table 1, almost all of these workers are informal, and women.
Table 1: The Informal Economy. Greater Buenos Aires 2005
Workers
Production UnitsFormal Informal Households Not classified Total
%Number of
persons%
Number of persons
%Number of
persons%
Number of persons
%Number of
persons
TotalFormal 52.1 2,749,877 0.0 - 0.3 16,222* 0.9 48,843 53.3 2,814,942
Informal 13.7 724,282 19.9 1,049,164 7.9 418,341 3.6 192,289 45.1 2,384,076
Not classified - - - - - - 1.6 83,686 1.6 83,686
ToTAL 65.8 3,474,159 19.9 1,049,164 8.2 434,563 6.1 324,818 100.0 5,282,704
MenFormal 54.2 1,671,328 - - 0.1 2,495* 1.3 40,705* 55.6 1,714,528
Informal 13.7 421,720 24.0 738,762 1.1 33,454 3.7 112,893 42.4 1,306,829
Not classified - - - - - - 2.0 63,097 2.0 63,097
ToTAL 67.9 2,093,048 24.0 738,762 1.2 35,949 7.0 216,695 100.0 3,084,454
WomenFormal 49.1 1,078,549 - - 0.6 13,727* 0.4 8,138* 50.1 1,100,414
Informal 13.8 302,562 14.1 310,402 17.5 384,887 3.6 79,396 49.0 1,077,247
Not classified - - - - - - 0.9 20,589* 0.9 20,589*
ToTAL 62.8 1,381,111 14.1 310,402 18.1 398,614 4.9 108,123 100.0 2,198,250
Source: EPH/ILM, IV Quarter 2005. Note: (*) Coefficients of variation equal or greater than 20 per cent.
Women’s and men’s informality profiles differ somewhat. Women are more likely to be in informal employment than men: half of women workers are informal workers, while this proportion is 42 per cent

WIEGO Working Paper (Urban Policies) No 8
12
for men. More than one third of informal female workers are domestic workers employed by households; and roughly one sixth works each for formal (13.8%) or informal enterprises (14.1%). Men’s informal employment is more related to informal production units than women’s, as over half of all informal male workers work for informal enterprises (Table 1).
Table 2 shows the high proportion of wage work that characterizes employment in Greater Buenos Aires. Seventy-five percent of all workers are employees, a proportion that reaches 78.6 per cent among women. There are few employers (3.5%, most of whom are men) and very few unpaid family workers (1.1%, almost all of whom are women).
Table 2: Employment by Job Category, Formality, and Sex. Greater Buenos Aires 2005
Job category
WorkersFormal Informal Not specified Total
%Number of
persons%
Number of persons
%Number of
persons%
Number of persons
Total
Employees 42.9 2,263,766 32.0 1,692,779 - - 74.9 3,956,545
Independent workers
Employers 2.9 154,735 0.4 20,103 * 0.2 10,594 * 3.5 185,432
own account workers 7.5
396,441 11.6
614,900 1.4
73,092 20.5
1,084,433
Family workers - - 1.1 56,294 - - 1.1 56,294
ToTAL 53.3 2,814,942 45.1 2,384,076 1.6 83,686 100.0 5,282,704
Men
Employees 43.3 1,336,555 28.9 892,765 - - 72.3 2,229,320
Independent
Employers 4.0 121,876 0.5 14,949 * 0.3 9,260 * 4.7 146,085
own account workers 8.3 256,097 12.4 381,954 1.7 53,837 22.4 691,888
Family workers - - 0.6 17,161 * - - 0.6 17,161 *
ToTAL 55.6 1,714,528 42.4 1,306,829 2.0 63,097 100.0 3,084,454
Women
Employees 42.2 927,211 36.4 800,014 - - 78.6 1,727,225
Independent workers
Employers 1.5 32,859 * 0.2 5,154 * 0.1 1,334 * 1.8 39,347 *
own account workers 6.4
140,344 10.6
232,946 0.9
19,255*17.9
392,545
Family workers - - 1.8 39,133 * - - 1.8 39,133 *
ToTAL 50.1 1,100,414 49.0 1,077,247 0.9 20,589* 100.0 2,198,250
Source: EPH/ILM, IV Quarter 2005. Note: (*) Coefficients of variation equal or greater than 20 per cent.

WIEGO Working Paper (Urban Policies) No 8
13
Given the high proportion of wage employment, it is not surprising that almost three quarters of informal employment is informal wage employment (71%), while the remaining quarter is explained primarily by own account workers (26%) (Figure 2). As much as 30 per cent of informal employment (and close to half of all informal wage employment) is wage employment in formal production units. Therefore, almost a third of all informal employment is generated by enterprises that comply with some of their business and tax regulations, but who evade their (and their employees’) contributions to social security and related labour tax obligations. In contrast, 44 per cent of informality is explained by independent workers (27%) and employees (17%) who own or work for production units that do not comply with any regulations. The fact that almost a fifth of informal employment is generated by households adds to this complexity, as the policy initiatives to bring protection to workers are potentially different for these three types of informal workers.
Figure 2: Informal Employment, by Job Category and Type of Production Unit
Source: EPH/ILM, IV Quarter 2005.
Table 2 also highlights that the distribution of informal employees and informal independent workers differs for women and men. Women are more likely than men to be informal employees – 36 per cent of women workers compared to 28.9 per cent of men, a fact that is partly explained by the weight of informal domestic work (see below). Men, on the other hand, are more likely to be informal own account workers than women. Note that employers are more likely to be formal than own account workers. Regrettably, that does not guarantee that their enterprises offer formal employment opportunities.
Formal and Informal Employees
From the previous account, it is clear that a substantial share of informal employment is explained by informal wage employment, i.e. employees who are not protected by labour regulations because they are not registered for social security. Forty-three per cent of employees are informal, a proportion that reaches 46 per cent among female employees, and 40 per cent among male employees. Informal wage employment in informal production units is more prevalent among men (15.3%) than among women (4.2%). While both women and men employees are equally likely to be informal in formal production units (between 17.5% and 18.9%), informality among female employees is in part explained by domestic work (employees who work for households).
Own account workers informal
26%
Employers in enterprise 1%
Employees in enterprise 17%
Family Employees
household 18%
Employees data on the enterprise 6%
Employees in enterprise 30%

WIEGO Working Paper (Urban Policies) No 8
14
Table 3: Formal and Informal Employees, by Sex
Women Men Total
Employees %Number of
persons%
Number of persons
%Number of
persons
Formal in formal production units 52.4 905,346 58.0 1,293,355 55.6 2,198,701
Formal (production unit n.e.c.) 0.5 8,138 * 1.8 40,705 1.2 48,843
Formal in households 0.8 13,727 * 0.1 2,495 * 0.4 16,222 *
Informal in formal production units 17.5 302,562 18.9 421,720 18.3 724,282
Informal in informal production units 4.2 72,302 15.3 341,859 10.5 414,161
Informal (production unit n.e.c.) 2.3 40,263 4.3 95,732 3.4 135,995
Informal in households 22.3 384,887 1.5 33,454 * 10.6 418,341
ToTal 100.0 1,727,225 100.0 2,229,320 100.0 3,956,545
Source: EPH/ILM, IV Quarter 2005. Note: (*) Coefficients of variation equal or greater than 20 per cent.
As shown in Table 4, 91 per cent of employees in households are women, and 97 per cent of these women are domestic workers. Almost all of these domestic workers (96.6%) are informal. In 95 per cent of cases, their job is unskilled, and 20 per cent of them have not completed primary school, while 40 per cent have only completed primary school. The explanation behind the high incidence of informality among domestic workers is complex; it is as much related to the weak position of domestic workers to negotiate working conditions with the employer household as it is to an outdated and discriminatory regulation framework for domestic work, which grants fewer rights than the Labour Law – thus reinforcing lack of registration.10
Table 4: Employees in Households, by occupation and Sex
occupation
Employees in householdsFormal Informal Total
% Number of persons % Number of
persons % Number of persons
Total
Domestic service 3.2 13,727* 90.0 390,968 93.1 404,695
other 0.6 2,495* 6.3 27,373 * 6.9 29,868 *
ToTal 3.7 16,222* 96.3 418,341 100.0 434,563
Men
Domestic service - - 46.0 16,528 * 46.0 16,528 *
other 6.9 2,495* 47.1 16,926 * 54.0 19,421 *
ToTal 6.9 2,495* 93.1 33,454 * 100.0 35,949 *
Women
Domestic service 3.4 13,727* 93.9 374,440 97.4 388,167
other - - - 10,447 * 2.6 10,447 *
ToTal 3.4 13,727* 93.9 384,887 100.0 398,614
Source: EPH/ILM, IV Quarter 2005. Note: (*) Coefficients of variation equal or greater than 20 per cent.
10 In Argentina, domestic work is regulated by the Domestic Service Personnel Statute (Decree 326/1956). This statute covers employees’ working period of one month or more, at least four hours per day and no less than four days per week for the same employer. Workers be-low this threshold are not considered employees but, rather, own account workers, and their employers are not required to register them. The labour rights granted to domestic workers within this legal framework are not on a par with other employees. At best, their rights are only a portion of those granted to formal employees, as is the case with severance pay, sick leaves, and annual vacations. To make matters worse, domestic workers completely lack some important rights, like the right to state-funded maternity leave and to family allowances. This makes them particularly vulnerable when they become pregnant or have children (Esquivel 2010).

WIEGO Working Paper (Urban Policies) No 8
15
Table 5 summarizes the industry distribution of formal and informal employees who work for production units (including public sector administration but excluding households). (All percentages are calculated in terms of the overall total for women, and men.) Overall, disregarding the formal/informal distinction, employees work primarily in manufacturing and electricity (20%), trade (15.1%), financial sector (11.6%), education (8.9%), and public administration (7.9%). Men are more prevalent in manufacturing and electricity (23.1%), trade (16.1%), transport (12%), financial sector (10.2%), and construction (9.7%). In contrast, women are prominent in care-related sectors with a high component of public employment, such as education (17.7%) and health and social services (13.1%). Women also commonly working in the financial sector (14.1%), in manufacturing and electricity (14.1%), and in trade (13.3%).
These differences in the industry distribution of wage work contribute to differing informality profiles between women and men. The exclusion of domestic work, and the focus on production units, “improves” females employees’ profile, as 70 per cent of them are formal in formal production units – precisely those who work in education, the financial sector, manufacturing and electricity, and public administration. Female employees are more likely to be informal if they work in trade, in manufacturing, and in community services – all sectors with relatively higher informality incidence. Noticeably, informality among female employees is more linked to the lack of labour registration in formal production units (23.6%) than to being clustered in non-registered, informal production units (5.6%).
Male employees working in production units are more informal than their female counterparts, as only 59 per cent are formal working in formal units. These formal male workers work in formal production units in manufacturing and electricity (14.7%), and in trade (7.8%), the financial sector (7.2%) and public administration (7%). The first two industries also concentrate informal male employees working in formal production units. In contrast, a third of all male employees working in informal production units do so in construction (5.3%) – an almost completely male sector that mirrors women’s domestic work, as its regulation provides less protection than the Labour Law.11 Transport (3.2%) and trade (2.9%) are also prevalent among the industries which offer employment in informal sector units.
Table 6 looks again at formal and informal employees who work for production units (including public sector administration but excluding households), this time focusing on job skills. Although job skills are a job characteristic, they parallel to some extent workers’ educational attainment (see section 6). Over a third of women employees but only a quarter of male employees hold professional or skilled jobs. Approximately three quarters of them are formal, while the remaining quarter is informal in formal production units. In contrast, almost all informal men and women employees working in informal production units hold semi-skilled or not-skilled jobs.
11 Construction workers can be dismissed at any time, without the right to severance pay established by the Labour Law. Instead, once dismissed, they have the right to withdraw a sum of money that employers deposit monthly in an individual account (12% of workers’ wage).

WIEGO Working Paper (Urban Policies) No 8
16
Tabl
e 5:
Indu
stry
Dis
trib
utio
n of
Em
ploy
ees,
by
Type
of P
rodu
ctio
n U
nit a
nd S
ex
Indu
stry
Form
al in
form
al
prod
uctio
n un
itsFo
rmal
(pro
duct
ion
unit
not c
lass
ified
)In
form
al in
form
al
prod
uctio
n un
itsIn
form
al in
info
rmal
pr
oduc
tion
units
Info
rmal
(pro
duct
ion
unit
not c
lass
ified
)To
tal
%Nu
mbe
r of
pers
ons
%Nu
mbe
r of
pers
ons
%Nu
mbe
r of
pers
ons
%Nu
mbe
r of
pers
ons
%Nu
mbe
r of
pers
ons
%Nu
mbe
r of
pers
ons
Tota
lag
ricul
ture
and
min
ing
0.5
16
,811
*-
-
0.2
5,
315 *
0.1
3,
253 *
-
- 0.
7
25,3
79 *
Man
ufac
turin
g an
d el
ectri
city
12.1
42
7,23
3 0.
2
8,77
7 *4.
2
149,
254
2.2
77
,959
1.
2
42,3
81
20.0
70
5,60
4
Cons
truct
ion
1.7
60
,439
0.
2
5,67
5 *0.
7
25,5
11 *
3.3
11
7,30
7 0.
4
12,3
72 *
6.3
22
1,30
4
Who
lesa
le/re
tail
trade
7.2
25
2,55
9 0.
3
9,65
4 *4.
5
158,
778
2.3
80
,928
0.
8
28,3
72 *
15.1
53
0,29
1
Hote
ls a
nd re
stau
rant
s2.
6
91,6
59
0.1
3,
165 *
1.5
52
,060
0.
3
11,9
83 *
0.3
9,
563 *
4.8
16
8,43
0
Tran
spor
t4.
7
166,
956
0.1
3,
685 *
1.8
63
,597
2.
1
73,4
67
0.5
17
,257
*9.
2
324,
962
Fina
ncia
l8.
1
286,
464
0.2
5,
299 *
2.5
89
,380
0.
6
20,1
06 *
0.2
6,
470 *
11.6
40
7,71
9
Publ
ic a
dmin
istra
tion
7.0
24
4,92
4 -
-
0.9
30
,260
*0.
1
3,18
6 *-
-
7.9
27
8,37
0
Educ
atio
n8.
3
291,
514
-
- 0.
5
18,3
84 *
0.1
2,
667 *
0.0
1,
239 *
8.9
31
3,80
4
Heal
th a
nd s
ocia
l ser
vice
s4.
9
172,
299
0.1
2,
382 *
1.6
56
,648
0.
1
3,41
2 *0.
0
1,28
2 *6.
7
236,
0 23
othe
r com
mun
ity s
ervi
ces
4.3
15
0,01
2 0.
2
8,11
6 *1.
9
66,9
29
0.5
17
,141
*0.
4
12,6
90 *
7.2
25
4,88
8
othe
r0.
5
17,9
26 *
-
- 0.
1
5,01
1 *0.
12,
752*
-
- 0.
7
25,6
89 *
Mis
sing
indu
stry
0.6
19
,905
*0.
1
2,09
0 *0.
1
3,15
5 *0.
0
- 0.
1
4,36
9 *0.
8
29,5
19 *
ToTa
l62
.4 2
,198
,701
1.
4
48,8
43
20.6
72
4,28
2 11
.8
414,
161
3.9
13
5,99
5 10
0.0
3,5
21,9
82
Men
agric
ultu
re a
nd m
inin
g0.
4
9,03
3 *-
-
0.2
5,
315 *
0.1
2,
147 *
-
- 0.
8
16,4
95 *
Man
ufac
turin
g an
d el
ectri
city
14.7
32
2,83
8 0.
3
7,29
0 *4.
5
99,4
31
2.3
51
,049
1.
1
25,1
10 *
23.1
50
5,71
8
Cons
truct
ion
2.3
50
,974
0.
3
5,67
5 *1.
2
25,5
11 *
5.3
11
7,30
7 0.
6
12,3
72 *
9.7
21
1,83
9
Who
lesa
le/re
tail
trade
7.8
17
0,30
7 0.
4
9,65
4 *4.
0
86,7
10
2.9
64
,000
1.
0
21,5
74 *
16.1
35
2,24
5
Hote
ls a
nd re
stau
rant
s2.
7
58,6
91
0.1
3,
165 *
1.5
32
,408
*0.
3
7,39
5 *0.
2
4,85
6 *4.
9
106,
515
Tran
spor
t5.
6
122,
198
0.2
3,
685 *
2.3
49
,922
3.
2
71,1
09
0.8
17
,257
*12
.0
264,
171
Fina
ncia
l7.
2
157,
895
0.2
3,
772 *
2.1
45,4
750.
5
11,1
22
0.3
6,
470 *
10.2
22
4,73
4
Publ
ic a
dmin
istra
tion
7.0
15
4,12
8 -
-
0.7
15
,494
*0.
1
1,59
3 *-
-
7.8
17
1,21
5

WIEGO Working Paper (Urban Policies) No 8
17
Indu
stry
Form
al in
form
al
prod
uctio
n un
itsFo
rmal
(pro
duct
ion
unit
not c
lass
ified
)In
form
al in
form
al
prod
uctio
n un
itsIn
form
al in
info
rmal
pr
oduc
tion
units
Info
rmal
(pro
duct
ion
unit
not c
lass
ified
)To
tal
%Nu
mbe
r of
pers
ons
%Nu
mbe
r of
pers
ons
%Nu
mbe
r of
pers
ons
%Nu
mbe
r of
pers
ons
%Nu
mbe
r of
pers
ons
%Nu
mbe
r of
pers
ons
Men
(con
td.)
Educ
atio
n3.
4
74,8
91
-
- 0.
3
7,39
1 *
0.1
2,
667
*-
-
3.9
84
,949
Heal
th a
nd s
ocia
l ser
vice
s2.
2
48,6
74 *
-
- 0.
9
18,7
31 *
0.0
1,
033
*-
-
3.1
68
,438
othe
r com
mun
ity s
ervi
ces
4.5
98
,967
0.
2
5,37
4 *1.
3
28,3
86 *
0.4
9,
685
*0.
3
6,64
0 *6.
8
149,
052
othe
r0.
8
16,5
87 *
-
- 0.
2
5,01
1 *
0.1
2,
752
*-
-
1.1
24
,350
*
Mis
sing
indu
stry
0.4
8,
172
*0.
1
2,09
0 *0.
1
1,93
5 *
-
- 0.
1
1,45
3 *0.
6
13,6
50 *
ToTa
l59
.0 1
,293
,355
1.
9
40,7
05
19.2
421,
720
15.6
34
1,85
9 4.
4
95,7
32
100.
0 2
,193
,371
Wom
en
agric
ultu
re a
nd m
inin
g0.
6
7,77
8 *
-
- -
-
0.1
1,
106
*-
-
0.7
8,
884 *
Man
ufac
turin
g an
d el
ectri
city
8.1
10
4,39
5 -
-
3.9
49
,823
2.
1
26,9
10 *
-
- 14
.1
181,
128
Cons
truct
ion
0.7
9,
465
*-
-
-
- -
-
-
- 0.
7
9,46
5 *
Who
lesa
le/re
tail
trade
6.4
82
,252
-
-
5.6
72
,068
1.
3
16,9
28 *
-
- 13
.3
171,
248
Hote
ls a
nd re
stau
rant
s2.
6
32,9
68 *
-
- 1.
5
19,6
52 *
0.4
4,
588
*-
-
4.5
57
,208
Tran
spor
t3.
5
44,7
58
-
- 1.
1
13,6
75 *
0.2
2,
358
*-
-
4.7
60
,791
Fina
ncia
l10
.0
128,
569
-
- 3.
4
43,9
05
0.7
8,
984
*-
-
14.1
18
1,45
8
Publ
ic a
dmin
istra
tion
7.1
90
,796
-
-
1.2
14
,766
*0.
1
1,59
3 *
-
- 8.
3
107,
155
Educ
atio
n16
.9
216,
623
-
- 0.
9
10,9
93 *
-
- -
-
17.7
22
7,61
6
Heal
th a
nd s
ocia
l ser
vice
s9.
6
123,
625
0.2
2,
382 *
3.0
37
,917
*0.
2
2,37
9 *
0.1
1,
282 *
13.1
16
7,58
5
othe
r com
mun
ity s
ervi
ces
4.0
51
,045
-
-
3.0
38
,543
*0.
6
7,45
6 *
-
- 7.
6
97,0
44
othe
r0.
1
1,33
9 *
-
- -
-
-
- -
-
0.1
1,
339 *
Mis
sing
indu
stry
0.9
11
,733
*-
-
0.1
1,
220
*-
-
-
- 1.
0
12,9
53 *
ToTa
l70
.5
905,
346
0.2
2,
382
23.6
30
2,56
2 5.
6
72,3
02
0.1
1,
282
100.
0 1
,283
,874
Sour
ce: E
PH
/ILM
, IV
Qua
rter
200
5. N
ote:
(*)
Coe
ffici
ents
of v
aria
tion
equa
l or
grea
ter
than
20
per
cent
.
Tabl
e 5
cont
inue
d

WIEGO Working Paper (Urban Policies) No 8
18
Tabl
e 6:
Job
Qua
lifica
tion
of E
mpl
oyee
s, b
y Ty
pe o
f Pro
duct
ion
Uni
t and
Sex
Job
qual
ifica
tion
Form
al in
form
al
prod
uctio
n un
itsFo
rmal
(pro
duct
ion
unit
not c
lass
ified
)In
form
al in
form
al
prod
uctio
n un
itsIn
form
al in
info
rmal
pr
oduc
tion
units
Info
rmal
(pro
duct
ion
unit
not c
lass
ified
)To
tal
%Nu
mbe
r of
pers
ons
%Nu
mbe
r of
pers
ons
%Nu
mbe
r of
pers
ons
%Nu
mbe
r of
pers
ons
%Nu
mbe
r of
pers
ons
%Nu
mbe
r of
pers
ons
Tota
l
Prof
essi
onal
6.9
24
4,27
2 0.
0
1,52
7 *
1.8
62
,525
0.
1
2,62
4 *
0.1
2,
569
*8.
9
313,
517
Skill
ed13
.7
483,
405
0.2
6,
053
*2.
2
76,3
45
0.5
16
,359
*0.
3
9,05
3 *
16.8
59
1,21
5
Sem
i-ski
lled
32.9
1,
159,
838
0.8
28
,253
*10
.5
371,
366
7.5
26
5,64
8 2.
0
71,9
85
53.9
1,
897,
090
Not s
kille
d8.
4
296,
898
0.3
12
,212
*6.
1
214,
046
3.7
12
9,53
0 1.
3
44,0
70
19.8
69
6,75
6
othe
r (no
t spe
cifie
d)0.
4
14,2
88 *
0.0
79
8 *
- -
- -
0.2
8,
318
*0.
7
23,4
04
ToTa
l62
.4
2,19
8,70
1
1.4
48
,843
20.6
72
4,28
2
11.8
41
4,16
1
3.9
13
5,99
5
100.
0
3,52
1,98
2
Men
Prof
essi
onal
6.4
14
0,00
3 -
-1.
6
33,9
98 *
--
0.1
1,28
7 *
8.0
17
5,28
8
Skill
ed9.
1
198,
651
0.2
3,
671
*1.
7
38,3
51 *
0.5
11
,023
*0.
4
7,81
4 *
11.8
25
9,51
0
Sem
i-ski
lled
36.0
78
8,57
0 1.
2
26,7
46 *
10.5
22
9,57
9 10
.3
226,
719
2.5
53
,795
60
.4
1,32
5,40
9
Not s
kille
d7.
1
155,
683
0.4
9,
490
*5.
5
119,
792
4.7
10
4,11
7 1.
3
27,4
34 *
19.0
41
6,51
6
othe
r (no
t spe
cifie
d)0.
5
10,4
48 *
0.0
79
8 *
- -
- -
0.2
5,
402
*0.
8
16,6
48
ToTa
l59
.0
1,29
3,35
5
1.9
40
,705
19.2
42
1,72
0
15.6
34
1,85
9
4.4
9
5,73
2 10
0.0
2
,193
,371
Wom
en
Prof
essi
onal
7.8
104,
269
0.1
1,
527
*2.
1
28,5
27 *
0.2
2,
624
*0.
1
1,28
2 *
10.4
13
8,22
9
Skill
ed21
.428
4,75
40.
2
2,38
2 *
2.9
37
,994
*0.
4
5,33
6 *
0.1
1,
239
*25
.0
331,
705
Sem
i-ski
lled
27.9
371,
268
0.1
1,
507
*10
.7
141,
787
2.9
38
,929
*1.
4
18,1
90 *
43.0
57
1,68
1
Not s
kille
d10
.614
1,21
50.
2
2,72
2 *
7.1
94
,254
1.
9
25,4
13 *
1.3
16
,636
*21
.1
280,
240
othe
r (no
t spe
cifie
d)0.
338
40*
-
- -
- -
-
0.2
2,
916
*0.
5
6,75
6 *
ToTa
l68
.1 9
05,3
46
0.6
8,
138
*22
.8
302,
562
5.
4
72,3
02
3.
0
40,2
63
10
0.0
1,
328,
611
Sour
ce: E
PH
/ILM
, IV
Qua
rter
200
5. N
ote:
(*)
Coe
ffici
ents
of v
aria
tion
equa
l or
grea
ter
than
20
per
cent
.

WIEGO Working Paper (Urban Policies) No 8
19
Table 7 summarizes the distribution of hours worked by formal and informal employees (reported number of hours worked per week in the person’s main job), according to the type of production unit that employs them. A relatively high proportion of employees work a full working week (from 35 to 45 hours) (36.5%). However, the distribution of hours worked varies by gender. Men tend to be overrepresented among those who work long hours: 30.9 per cent of men work from 46 to 60 hours a week, and a further 14.8 per cent over 60 hours a week. The distribution of women’s workers hours, in contrast, is skewed towards shorter hours, as 28.5 per cent of them work from 15 to 34 hours a week. Hours worked are generally shorter for informal workers than formal workers. A small number of informal female employees in formal production units work less than 15 hours a week (5.2% of all female employees). Among informal men, those who work shorter hours (less than the regulated working week) work for both formal and informal production units.

WIEGO Working Paper (Urban Policies) No 8
20
Tabl
e 7:
Hou
rs W
orke
d by
Em
ploy
ees,
by
Type
of P
rodu
ctio
n U
nit a
nd S
ex
Hour
s wo
rked
Form
al in
form
al
prod
uctio
n un
itsFo
rmal
(pro
duct
ion
unit
not c
lass
ified
)In
form
al in
form
al
prod
uctio
n un
itsIn
form
al in
info
rmal
pr
oduc
tion
units
Info
rmal
(pro
duct
ion
unit
not c
lass
ified
)To
tal
%Nu
mbe
r of
pers
ons
%Nu
mbe
r of
pers
ons
%Nu
mbe
r of
pers
ons
%Nu
mbe
r of
pers
ons
%Nu
mbe
r of
pers
ons
%Nu
mbe
r of
pers
ons
Tota
l
Up to
14
hour
s3.
8
134,
867
0.0
1,
507 *
2.8
98
,096
1.2
43,7
67
0.4
13,7
73*
8.3
29
2,01
0
From
15
to 3
4 ho
urs
9.3
32
7,90
5 0.
2
6,49
4 *5.
6
198,
176
2.
693
,218
0.
724
,818
*18
.5
650,
611
From
35
to 4
5 ho
urs
26.9
94
5,89
4 0.
3
10,2
11 *
5.3
18
6,90
7
2.8
99,5
76
1.2
42,8
89
36.5
1,
285,
477
From
46
to 6
0 ho
urs
17.0
59
8,42
1 0.
7
24,4
67 *
4.6
16
2,65
5 2.
587
,984
0.9
32,3
94*
25.7
90
5,92
1
60 h
ours
or m
ore
5.4
19
0,31
9 0.
2
6,16
4 *
2.1
74
,196
2.
589
,616
0.5
16,1
59*
10.7
37
6,45
4
Unkn
own
0.0
1,
295
*-
-
0.1
4,
252
*-
-
0.2
5,96
2*0.
3
11,5
09 *
ToTa
l62
.4
2,19
8,70
1 1.
4
48,8
43
20.6
72
4,28
2
11.8
414,
161
3.9
135
,995
10
0.0
3,
521,
982
Men
Up to
14
hour
s2.
5
55,3
81
0.1
1,
507
*1.
3
28,9
45 *
1.4
31,
139*
0.4
8,73
1*5.
7
125,
703
From
15
to 3
4 ho
urs
4.2
91
,071
0.
2
3,99
1 *
4.5
98
,532
3.
065
,718
0.6
12,1
57*
12.4
27
1,46
9
From
35
to 4
5 ho
urs
24.4
53
5,72
1 0.
4
8,68
4 *
5.4
11
9,00
9 3.
984
,845
1.8
38
,870
*35
.9
787,
129
From
46
to 6
0 ho
urs
20.4
44
6,90
1 0.
9
20,3
59 *
4.9
10
7,81
9 3.
883
,274
0.9
20,1
94*
30.9
67
8,54
7
60 h
ours
or m
ore
7.5
16
4,28
1 0.
3
6,16
4 *
3.0
64
,804
3.
576
,883
0.6
12,7
34*
14.8
32
4,86
6
Unkn
own
-
-
- -
0.1
2,
611
*-
-
0.1
3,04
6*0.
3
5,65
7 *
ToTa
l59
.0
1,29
3,35
5 1.
9
40,7
05
19.2
42
1,72
0
15.6
341
,859
4.
4 9
5,73
2 10
0.0
32
4,86
6
Wom
en
Up to
14
hour
s6.
0
79,4
86
-
-
5.2
6
9,15
1
1.0
12,6
28*
0.4
5,0
42*
12.5
16
6,30
7
From
15
to 3
4 ho
urs
17.8
23
6,83
4 0.
2
2,50
3 *
7.5
99
,644
2.
127
,500
*1.
012
,661
*28
.5
379,
142
From
35
to 4
5 ho
urs
30.9
41
0,17
3 0.
1
1,52
7 *
5.1
67
,898
1.
114
,731
*0.
34,
019*
37.5
49
8,34
8
From
46
to 6
0 ho
urs
11.4
15
1,52
0 0.
3
4,10
8 *
4.1
54
,836
0.
44,
710*
0.9
12,2
00*
17.1
22
7,37
4
60 h
ours
or m
ore
2.0
26
,038
*-
-
0.7
9,
392
*1.
012
,733
*0.
33,
425*
3.9
51
,588
Unkn
own
0.1
1,
295
*-
-
0.1
1,
641
*-
-
0.2
2,91
6*0.
4
5,85
2 *
ToTa
l68
.1
905,
346
0.6
8,
138 *
22.8
30
2,56
2
5.4
72,3
02
3.0
40,
263
100.
0
1,32
8,61
1
Sou
rce:
EP
H/IL
M, I
V Q
uart
er 2
005.
Not
e: (
*) C
oeffi
cien
ts o
f var
iatio
n eq
ual o
r gr
eate
r th
an 2
0 pe
r ce
nt.

WIEGO Working Paper (Urban Policies) No 8
21
Formal and Informal Independent Workers
Informality among independent workers is also extensive, as it accounts for at least 50 per cent of all independent employment.12 Even though women are less likely to be independent than men, they are more informal than men when they are independent (55% as compared to 47%). This is particularly the case when women are own account workers (almost 60% of whom are informal). As mentioned before, men are more likely to be employers and less likely to be informal than independent women workers. Men are also notably less prone than women to provide information on the registration of their production units: in 7.5 per cent of the cases, it was not possible to identify whether their production unit was registered.
Table 8: Independent Workers, by Job Category and Type of Production Unit
Production Units
Formal Informal Not classified Total
% Number of persons % Number of
persons % Number of persons % Number of
persons
Total
Employers 12.2 154,735 1.6 20,103 * 0.8 10,594 * 14.6 185,432
own account workers 31.2 396,441 48.4 614,900 5.8 73,092 85.4 1,084,433
ToTal 43.4 551,176 50.0 635,003 6.6 83,686 100.0 1,269,865
Men
Employers 14.5 121,876 1.8 14,949 * 1.1 9,260 * 17.4 146,085
own account workers 30.6 256,097 45.6 381,954 6.4 53,837 82.6 691,888
ToTal 45.1 377,973 47.4 396,903 7.5 63,097 100.0 837,973
Women
Employers 7.6 32,859 * 1.2 5,154 * 0.3 1,334 * 9.1 39,347 *
own account workers 32.5 140,344 53.9 232,946 4.5 19,255 * 90.9 392,545
ToTal 40.1 173,203 55.1 238,100 4.8 20,589 * 100.0 431,892
Source: EPH/ILM, IV Quarter 2005. Note: (*) Coefficients of variation equal or greater than 20 per cent.
12 Production units that are not classified – the result of having not answered the specific question about registration – are quite likely also informal in the case of independent workers.
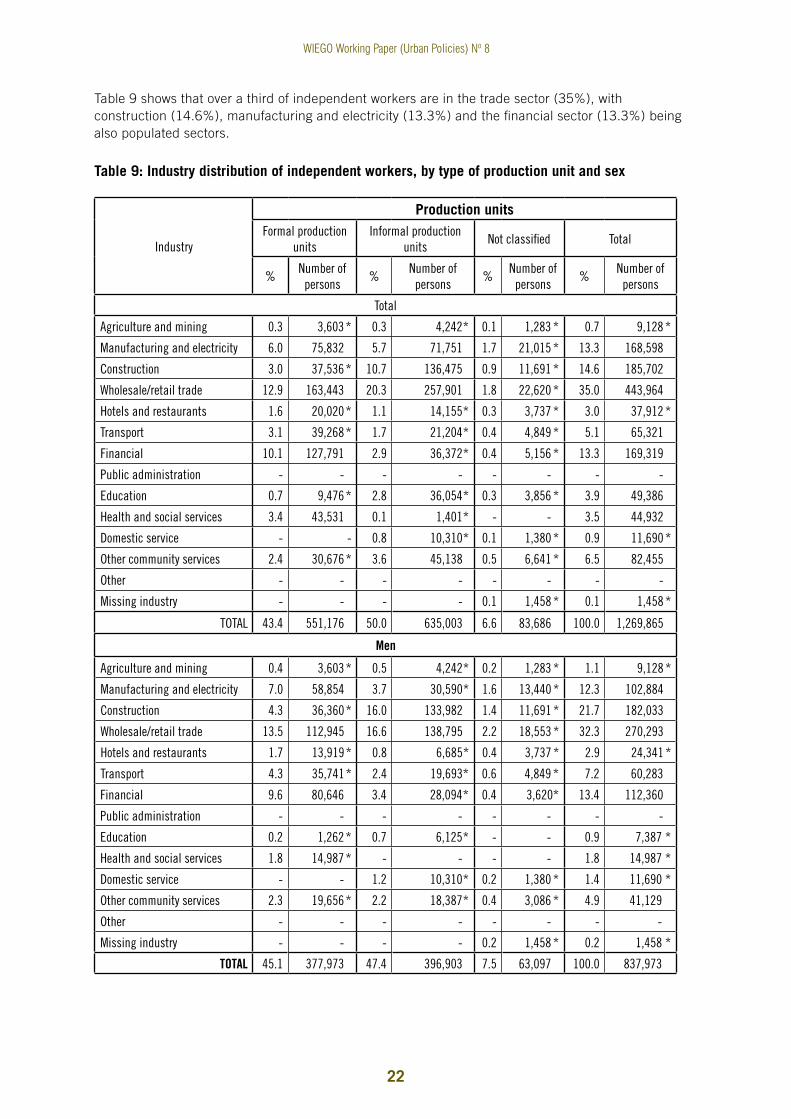
WIEGO Working Paper (Urban Policies) No 8
22
Table 9 shows that over a third of independent workers are in the trade sector (35%), with construction (14.6%), manufacturing and electricity (13.3%) and the financial sector (13.3%) being also populated sectors.
Table 9: Industry distribution of independent workers, by type of production unit and sex
Industry
Production unitsFormal production
unitsInformal production
unitsNot classified Total
%Number of
persons%
Number of persons
%Number of
persons%
Number of persons
Total
agriculture and mining 0.3 3,603 * 0.3 4,242 * 0.1 1,283 * 0.7 9,128 *
Manufacturing and electricity 6.0 75,832 5.7 71,751 1.7 21,015 * 13.3 168,598
Construction 3.0 37,536 * 10.7 136,475 0.9 11,691 * 14.6 185,702
Wholesale/retail trade 12.9 163,443 20.3 257,901 1.8 22,620 * 35.0 443,964
Hotels and restaurants 1.6 20,020 * 1.1 14,155 * 0.3 3,737 * 3.0 37,912 *
Transport 3.1 39,268 * 1.7 21,204 * 0.4 4,849 * 5.1 65,321
Financial 10.1 127,791 2.9 36,372 * 0.4 5,156 * 13.3 169,319
Public administration - - - - - - - -
Education 0.7 9,476 * 2.8 36,054 * 0.3 3,856 * 3.9 49,386
Health and social services 3.4 43,531 0.1 1,401 * - - 3.5 44,932
Domestic service - - 0.8 10,310 * 0.1 1,380 * 0.9 11,690 *
other community services 2.4 30,676 * 3.6 45,138 0.5 6,641 * 6.5 82,455
other - - - - - - - -
Missing industry - - - - 0.1 1,458 * 0.1 1,458 *
ToTal 43.4 551,176 50.0 635,003 6.6 83,686 100.0 1,269,865
Men
agriculture and mining 0.4 3,603 * 0.5 4,242 * 0.2 1,283 * 1.1 9,128 *
Manufacturing and electricity 7.0 58,854 3.7 30,590 * 1.6 13,440 * 12.3 102,884
Construction 4.3 36,360 * 16.0 133,982 1.4 11,691 * 21.7 182,033
Wholesale/retail trade 13.5 112,945 16.6 138,795 2.2 18,553 * 32.3 270,293
Hotels and restaurants 1.7 13,919 * 0.8 6,685 * 0.4 3,737 * 2.9 24,341 *
Transport 4.3 35,741 * 2.4 19,693 * 0.6 4,849 * 7.2 60,283
Financial 9.6 80,646 3.4 28,094 * 0.4 3,620* 13.4 112,360
Public administration - - - - - - - -
Education 0.2 1,262 * 0.7 6,125 * - - 0.9 7,387 *
Health and social services 1.8 14,987 * - - - - 1.8 14,987 *
Domestic service - - 1.2 10,310 * 0.2 1,380 * 1.4 11,690 *
other community services 2.3 19,656 * 2.2 18,387 * 0.4 3,086 * 4.9 41,129
other - - - - - - - -
Missing industry - - - - 0.2 1,458 * 0.2 1,458 *
ToTal 45.1 377,973 47.4 396,903 7.5 63,097 100.0 837,973
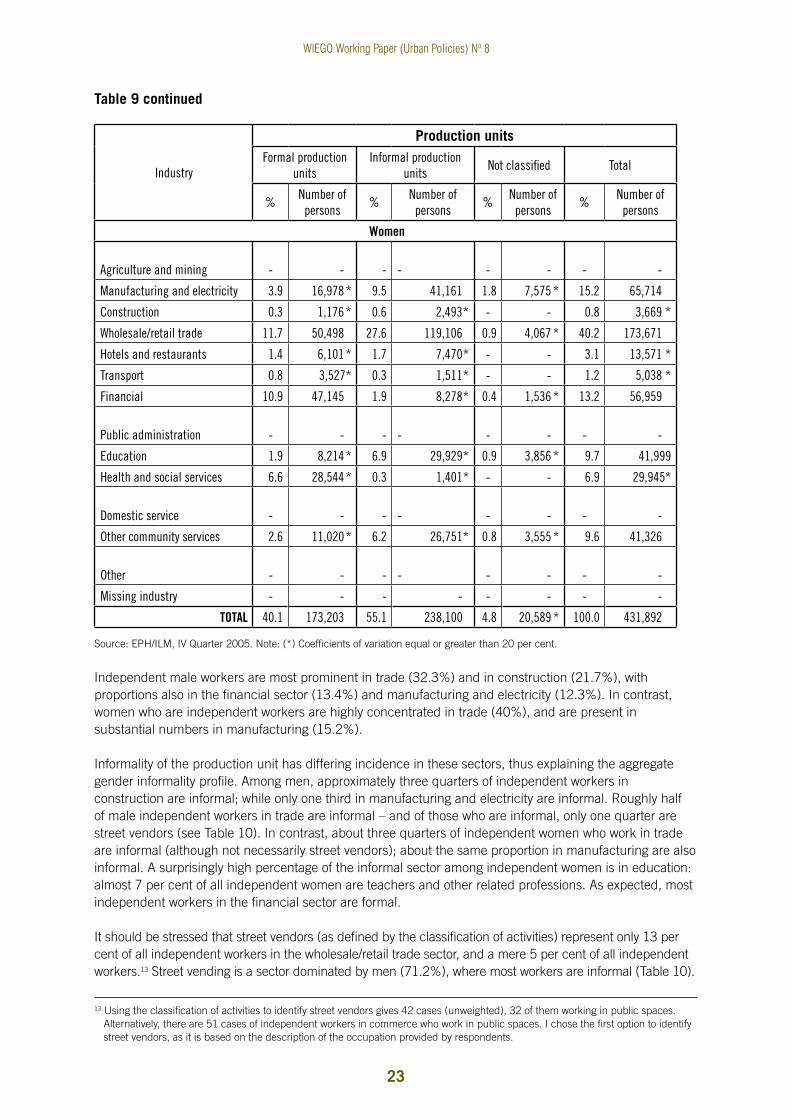
WIEGO Working Paper (Urban Policies) No 8
23
Industry
Production unitsFormal production
unitsInformal production
unitsNot classified Total
%Number of
persons%
Number of persons
%Number of
persons%
Number of persons
Women
agriculture and mining - - - - - - - -
Manufacturing and electricity 3.9 16,978 * 9.5 41,161 1.8 7,575 * 15.2 65,714
Construction 0.3 1,176 * 0.6 2,493 * - - 0.8 3,669 *
Wholesale/retail trade 11.7 50,498 27.6 119,106 0.9 4,067 * 40.2 173,671
Hotels and restaurants 1.4 6,101 * 1.7 7,470 * - - 3.1 13,571 *
Transport 0.8 3,527* 0.3 1,511 * - - 1.2 5,038 *
Financial 10.9 47,145 1.9 8,278 * 0.4 1,536 * 13.2 56,959
Public administration - - - - - - - -
Education 1.9 8,214 * 6.9 29,929 * 0.9 3,856 * 9.7 41,999
Health and social services 6.6 28,544 * 0.3 1,401 * - - 6.9 29,945*
Domestic service - - - - - - - -
other community services 2.6 11,020 * 6.2 26,751 * 0.8 3,555 * 9.6 41,326
other - - - - - - - -
Missing industry - - - - - - - -
ToTal 40.1 173,203 55.1 238,100 4.8 20,589 * 100.0 431,892
Source: EPH/ILM, IV Quarter 2005. Note: (*) Coefficients of variation equal or greater than 20 per cent.
Independent male workers are most prominent in trade (32.3%) and in construction (21.7%), with proportions also in the financial sector (13.4%) and manufacturing and electricity (12.3%). In contrast, women who are independent workers are highly concentrated in trade (40%), and are present in substantial numbers in manufacturing (15.2%).
Informality of the production unit has differing incidence in these sectors, thus explaining the aggregate gender informality profile. Among men, approximately three quarters of independent workers in construction are informal; while only one third in manufacturing and electricity are informal. Roughly half of male independent workers in trade are informal – and of those who are informal, only one quarter are street vendors (see Table 10). In contrast, about three quarters of independent women who work in trade are informal (although not necessarily street vendors); about the same proportion in manufacturing are also informal. A surprisingly high percentage of the informal sector among independent women is in education: almost 7 per cent of all independent women are teachers and other related professions. As expected, most independent workers in the financial sector are formal.
It should be stressed that street vendors (as defined by the classification of activities) represent only 13 per cent of all independent workers in the wholesale/retail trade sector, and a mere 5 per cent of all independent workers.13 Street vending is a sector dominated by men (71.2%), where most workers are informal (Table 10).
13 Using the classification of activities to identify street vendors gives 42 cases (unweighted), 32 of them working in public spaces. Alternatively, there are 51 cases of independent workers in commerce who work in public spaces. I chose the first option to identify street vendors, as it is based on the description of the occupation provided by respondents.
Table 9 continued

WIEGO Working Paper (Urban Policies) No 8
24
Table 10: Street Vendors, by Type of Production Unit and Sex
Production Units
Formal production units Informal production units Not classified Total
% Number of persons % Number of persons % Number of persons % Number of
persons
Men 4.5 2,639* 62.5 36,437 * 4.1 2,406* 71.2 41,482
Women 2.0 1,156* 23.8 13,855 * 3.1 1,780* 28.8 16,791 *
ToTal 6.5 3,795* 86.3 50,292 7.2 4,186* 100.0 58,273
Source: EPH/ILM, IV Quarter 2005. Note: (*) Coefficients of variation equal or greater than 20 per cent.
The picture is highly heterogeneous when looking at home-based workers, identified based on the “place of work” variable (“Where do you perform your work most of the time?”). Home-based workers are independent workers who either work at home or at their associate/partner’s home. They represent only 13 per cent of all independent workers, so the figures in Table 11 should be read with caution, as indicated by the high coefficients of variation reported in most of the cells.
Compared to independent workers, home-based workers are more informal, as 60 per cent work in informal production units. Among men, a third of home-based work is performed in the trade sector; while 40 per cent of home-based female workers are subcontractors in the manufacturing industry.
Table 11: Industry Distribution of Home-based Workers, by Type of Production Unit and Sex
Industry
Production units
Formal production units Informal production units Not classified Total
% Number of persons % Number of
persons % Number of persons % Number of
persons
Total
agriculture and mining 0.7 1,168 * - - 0.8 1,283 * 1.4 2,451 *
Manufacturing and electricity 5.0 8,490 * 24.8 42,308 3.1 5,290 * 32.9 56,088
Construction - - 0.7 1,154 * - - 0.7 1,154 *
Wholesale/retail trade 3.6 6,106 * 18.4 31,410 * 1.3 2,276 * 23.3 39,792 *
Hotels and restaurants 2.2 3,748 * 2.1 3,496 * - - 4.2 7,244 *
Transport - - - - - - - -
Financial 16.3 27,746 * 3.7 6,262 * 0.7 1,271 * 20.7 35,279 *
Public administration - - - - - - - -
Education - - 7.5 12,722 * 1.4 2,403 * 8.9 15,125 *
Health and social services 1.5 2,558 * - - - - 1.5 2,558 *
Domestic service - 0.7 1,261 * - - 1,261 *
other community services 3.1 5,287 * 2.5 4,258 * - - 5.6 9,545 *
other - - - - - - - -
Missing industry - - - - - - - -
ToTal 32.3 55,103 60.3 102,871 7.3 12,523 * 100.0 170,497

WIEGO Working Paper (Urban Policies) No 8
25
Men
agriculture and mining 1.7 1,168 * - - 1.9 1,283 * 3.6 2,451 *
Manufacturing and electricity 3.1 2,118 * 14.5 9,810 * 2.0 1,365 * 19.7 13,293 *
Construction - - 1.7 1,154 * - - 1.7 1,154 *
Wholesale/retail trade 5.1 3,455 * 28.1 18,982 * 1.7 1,145 * 34.9 23,582 *
Hotels and restaurants 1.8 1,213 * 1.8 1,225 * - - 3.6 2,438 *
Transport - - - - - - - -
Financial 15.2 10,237 * 3.7 2,479 * 1.9 1,271 * 20.7 13,987 *
Public administration - - - - - - - -
Education - - 3.7 2,484 * - - 3.7 2,484 *
Health and social services - - - - - - - -
Domestic service - - 1.9 1,261 * - - 1.9 1,261 *
other community services 5.9 3,970 * 4.4 2,950 * - - 10.2 6,920 *
other - - - - - - - -
Missing industry - - - - - - - -
ToTal 32.8 22,161 * 59.7 40,345 7.5 5,064 * 100.0 67,570
Women
agriculture and mining - - - - - - - -
Manufacturing and electricity 6.2 6,342 * 31.6 32,498 * 3.8 3,925 * 41.6 42,765
Construction - - - - - - - -
Wholesale/retail trade 2.6 2,651 * 12.1 12,428 * 1.1 1,131 * 15.8 16,210 *
Hotels and restaurants 2.5 2,535 * 2.2 2,271 * - - 4.7 4,806 *
Transport - - - - - - - -
Financial 17.0 17,509 * 3.7 3,783 * - - 20.7 21,292 *
Public administration - - - - - - - -
Education - - 9.9 10,238 * 2.3 2,403 * 12.3 12,641 *
Health and social services 2.5 2,558 * - - - - 2.5 2,558 *
Domestic service - - - - - - - -
other community services 1.3 1,317 * 1.3 1,308 * - - 2.6 2,625 *
other - - - - - - - -
Missing industry - - - - - - - -
ToTal 32.0 32,912 * 60.8 62,526 7.2 7,459 * 100.0 102,897
Source: EPH/ILM, IV Quarter 2005. Note: (*) Coefficients of variation equal or greater than 20 per cent.
Going back to the analysis of independent workers as a whole, Table 12 shows the qualifications profile of these workers. Compared to employees, there are more professionals among independent workers than among employees, and almost all of them are formal; the few who are not correspond to independent workers “at the margin of informality,” as described above. Informality is more prevalent among skilled independent workers, particularly among women, as half of skilled women independent workers are formal, and half informal. All unskilled independent workers and most semi-skilled workers are informal, a result that mirrors that of employees working in informal production units.
Table 11 continued

WIEGO Working Paper (Urban Policies) No 8
26
Table 12: Job Qualification of Independent Workers, by Type of Production Unit and Sex
Qualifications
Production units
Formal Informal Not classified Total
% Number of persons % Number of
persons % Number of persons % Number of
persons
Total
Professional 12.9 163,309 1.5 19,101 0.4 5,330 14.8 187,740
Skilled 12.2 154,646 7.6 96,483 1.8 22,296 21.5 273,425
Semi-skilled 17.9 226,995 36.4 462,604 3.5 45,034 57.9 734,633
Not skilled 0.3 3,795 4.5 56,815 0.5 6,901 5.3 67,511
other (not specified) 0.2 2,431 - - 0.3 4,125 0.5 6,556
ToTal 43.4 551,176 50.0 635,003 6.6 83,686 100.0 1,269,865
Men
Professional 12.4 103,753 1.4 11,809 0.5 3,996 14.3 119,558
Skilled 12.1 101,508 5.8 48,946 2.1 17,355 20.0 167,809
Semi-skilled 20.0 167,642 35.2 294,596 4.2 35,167 59.4 497,405
Not skilled 0.3 2,639 5.0 41,552 0.6 5,121 5.9 49,312
other (not specified) 0.3 2,431 - - 0.2 1,458 0.2 1,458
ToTal 45.1 377,973 47.4 396,903 7.5 63,097 100.0 837,973
Women
Professional 13.8 59,556 1.7 7,292 0.3 1,334 15.8 68,182
Skilled 12.3 53,138 11.0 47,537 1.1 4,941 24.5 105,616
Semi-skilled 13.7 59,353 38.9 168,008 2.3 9,867 54.9 237,228
Not skilled 0.3 1,156 3.5 15,263 0.4 1,78 4.2 18,199
other (not specified) - - - - 0.6 2,667 0.6 2,667
ToTal 40.1 173,203 55.1 238,1 4.8 20,589 100.0 431,892
Source: EPH/ILM, IV Quarter 2005. Note: (*) Coefficients of variation equal or greater than 20 per cent.
The distribution of hours worked for independent workers shows a striking contrast with that of employees (Table 13). As expected, given the nature of these jobs, hours worked are more variable, with fewer independent workers concentrated in the “standard” working week of 35-45 hours (18%). Also, the aggregate distribution of hours worked is the result of quite different gender patterns: over half of independent women workers work less than 35 hours a week, while independent male workers (as their wage-employed counterparts) are more likely to work long hours (32.3% work over 46 hours). Among women, informal independent workers are more likely to work less than 14 hours a week, as well as to work over 60 hours a week, than formal independent workers are – the latter a possible indication of the difficulties in earning a living in informal independent work (see section 6 below). Informal independent male workers are also more likely to work shorter hours than formal independent men: almost half of them work less than 35 hours, as compared to a mere 16 per cent among formal men (proportions not shown but implicit in Table 13). Formal independent male workers are also more likely to work long hours than their informal counterparts.

WIEGO Working Paper (Urban Policies) No 8
27
Table 13: Hours Worked by Independent Workers, by Type of Production Unit and Sex
Hours worked
Production units
Formal Informal Not classified Total
%Number of
persons%
Number of persons
%Number of
persons%
Number of persons
Total
Up to 14 hours 3.3 42,461 9.8 124,564 1.4 17,718* 14.5 184,743
From 15 to 34 hours 7.8 98,852 14.2 180,020 1.5 18,699* 23.4 297,571
From 35 to 45 hours 8.9 112,640 8.1 102,231 1.1 13,429* 18.0 228,300
From 46 to 60 hours 14.2 180,232 10.7 36,058 1.3 16,750* 26.2 333,040
60 hours or more 9.2 116,991 6.8 86,289 1.0 13,221* 17.0 216,501
Unknown - - 0.5 5,841 * 0.3 3,869* 0.8 9,710 *
ToTal 43.4 551,176 50.0 635,003 6.6 83,686 100.0 1,269,865
Men
Up to 14 hours 1.8 15,327 * 7.6 63,297 0.7 8,781* 6.9 87,405
From 15 to 34 hours 5.4 45,204 13.4 112,108 1.0 12,544* 13.4 169,856
From 35 to 45 hours 9.2 77,098 9.0 75,659 0.9 10,868* 12.9 163,625
From 46 to 60 hours 17.6 147,176 12.2 102,414 1.2 14,970* 20.8 264,560
60 hours or more 11.1 93,168 4.9 41,274 1.0 12,065* 11.5 146,507
Unknown - - 0.3 2,151 * 0.3 3,869* 0.5 6,020 *
ToTal 45.1 377,973 47.4 396,903 5.0 63,097 66.0 837,973
Women
Up to 14 hours 6.3 27,134 * 14.2 61,267 2.1 8,937* 22.5 97,338
From 15 to 34 hours 12.4 53,648 15.7 67,912 1.4 6,155* 29.6 127,715
From 35 to 45 hours 8.2 35,542 * 6.2 26,572 * 0.6 2,561* 15.0 64,675
From 46 to 60 hours 7.7 33,056 * 7.8 33,644 * 0.4 1,780* 15.9 68,480
60 hours or more 5.5 23,823 * 10.4 45,015 0.3 1,156* 16.2 69,994
Unknown - - 0.9 3,690 * - - 0.9 3,690 *
ToTal 40.1 173,203 55.1 238,100 4.8 20,589* 100.0 431,892
Source: EPH/ILM, IV Quarter 2005. Note: (*) Coefficients of variation equal or greater than 20 per cent.

WIEGO Working Paper (Urban Policies) No 8
28
Personal Characteristics of Formal and Informal Workers in Greater Buenos Aires
Formal and Informal Employees
This section extends the analysis of informal wage work to chart some personal and demographic characteristics of these workers, comparing them to those of formal employees. The analysis of employees who work for households is done separately, so as to highlight their relative homogeneity in terms of personal characteristics. This section also serves as an introduction to the multivariate analysis of earnings done in the following section.
Table 14 shows the age profile of formal and informal employees, according to the formality of the production unit. The bulk of employees are concentrated in the middle age bracket (from 25 to 49 years old). However, irrespective of their sex and the type of production unit they work for, informal employees tend to be younger than formal workers: approximately a quarter of those who are informal are younger than 25 years of age, while this proportion is only 12 per cent among formal workers and 18 per cent on average.
Table 15 complements Table 14 with workers’ household position. Men are typically household heads (64.2%) or sons (25%), while women are spouses (39.2%), daughters (28.6%) or household heads (27.5%).14 Two thirds of employed household heads are formal workers – which means that not only they, but also their families, enjoy benefits like health insurance and family allowances granted to formal household heads. But informal male household heads are more prevalent in formal production units, while informal female household heads are relatively more prevalent in informal production units. The same is true about informal women who are spouses – indicating their higher vulnerability as compared to men, given the tiny chances of becoming formal that exist in informal production units.
14 In the Argentinean statistical system, headship is self-declared. However, as it is stated in a gendered manner (“¿Quién el jefe de este hogar?” means “Who is the household head?”), women typically respond they are heads only when they are not partnered/married. In the same vein, men hardly ever identify themselves as “spouses.”

WIEGO Working Paper (Urban Policies) No 8
29
Tabl
e 14
: Age
Dis
trib
utio
n of
For
mal
and
Info
rmal
Em
ploy
ees,
by
Type
of P
rodu
ctio
n U
nit a
nd S
ex
age
Form
al in
form
al
prod
uctio
n un
itsFo
rmal
(pro
duct
ion
unit
not c
lass
ified
)In
form
al in
form
al
prod
uctio
n un
itsIn
form
al in
info
rmal
pr
oduc
tion
units
Info
rmal
(pro
duct
ion
not c
lass
ified
)To
tal
%Nu
mbe
r of
pers
ons
%Nu
mbe
r of
pers
ons
%Nu
mbe
r of
pers
ons
%Nu
mbe
r of
pers
ons
%Nu
mbe
r of
pers
ons
%Nu
mbe
r of
pers
ons
Tota
l
Up to
24
year
s7.
7 2
71,1
88
0.3
11
,139
*5.
3 1
87,4
15
3.5
12
2,60
7
1.2
40
,650
18
.0 6
32,9
99
From
25
to 4
9 ye
ars
41.3
1,4
55,3
20
0.7
24
,557
*11
.3 3
97,4
046.
5
227,
240
2.
0
69,4
27
61.7
2,1
73,9
48
50 ye
ars
old
or o
lder
13.4
472
,193
0.
4
13,1
47 *
4.0
139
,463
1.
8
64,3
14
0.7
25
,918
*20
.3 7
15,0
35
ToTa
l62
.4 2
,198
,701
1.
4
48,8
43
20.6
724
,282
11.8
41
4,16
1
3.9
13
5,99
5
100.
0 3
,521
,982
Men
Up to
24
year
s7.
5 1
63,5
39
0.4
9,
612 *
5.4
118
,364
4.
3
95,
293
1.
0
21,9
24 *
18.6
408
,732
From
25
to 4
9 ye
ars
38.5
845
,329
0.
9
20,7
21 *
10.0
219
,414
8.
8
192
,820
2.
4
53,3
27
60.7
1,3
31,6
11
50 ye
ars
old
or o
lder
13.0
284
,487
0.
5
10,3
72 *
3.8
83
,942
2.
5
53,7
46
0.9
20
,481
*20
.7 4
53,0
28
ToTa
l59
.0 1
,293
,355
1.
9
40,7
05
19.2
421
,720
15
.6
341,
859
4.
4
95,7
32
100.
0 2
,193
,371
Wom
en
Up to
24
year
s8.
1 1
07,6
49
0.1
1,
527 *
5.2
69,
051
2.1
27
,314
*1.
4
18,7
26 *
16.9
224
,267
From
25
to 4
9 ye
ars
45.9
609
,991
0.
3
3,83
6 *13
.4 1
77,9
90
2.6
34
,420
*1.
2
16,1
00 *
63.4
842
,337
50 ye
ars
old
or o
lder
14.1
187
,706
0.
2
2,77
5 *4.
2 5
5,52
1 0.
8
10,5
68 *
0.4
5,
437 *
19.7
262
,007
ToTa
l68
.1 9
05,3
46
0.6
8,
138 *
22
.8 3
02,5
62
5.4
7
2,30
2
3.0
40
,263
10
0.0
1,3
28,6
11
Sour
ce: E
PH
/ILM
, IV
Qua
rter
200
5. N
ote:
(*)
Coe
ffici
ents
of v
aria
tion
equa
l or
grea
ter
than
20
per
cent
.

WIEGO Working Paper (Urban Policies) No 8
30
Tabl
e 15
: Pos
ition
in th
e H
ouse
hold
of F
orm
al a
nd In
form
al E
mpl
oyee
s, b
y Ty
pe o
f Pro
duct
ion
Uni
t and
Sex
Hous
ehol
d po
sitio
n
Form
al in
form
al
prod
uctio
n un
itsFo
rmal
(pro
duct
ion
unit
not c
lass
ified
)In
form
al in
form
al
prod
uctio
n un
itsIn
form
al in
info
rmal
pr
oduc
tion
units
Info
rmal
(pro
duct
ion
not c
lass
ified
)To
tal
%Nu
mbe
r of
pers
ons
%Nu
mbe
r of
pers
ons
%Nu
mbe
r of
pers
ons
%Nu
mbe
r of
pers
ons
%Nu
mbe
r of
pers
ons
%Nu
mbe
r of
pers
ons
Tota
l
Hous
ehol
d he
ad33
.4 1
,175
,590
0.
7
26,0
20 *
8.7
30
6,52
6 5.
8
203,
819
1.8
62
,144
50
.4 1
,774
,099
Spou
se10
.9
383,
054
0.1
4,
229 *
4.3
15
0,90
4 1.
1
39,7
59
0.4
14
,540
16
.8
592,
486
Daug
hter
/son
14.9
52
4,25
1 0.
4
15,0
05 *
6.1
21
6,05
8 3.
5
123,
331
1.4
49
,243
26
.3
927,
888
othe
rs3.
3
115,
806
0.1
3,
589 *
1.4
50
,794
1.
3
47,2
52
0.3
10
,068
6.
5
227,
509
ToTa
l62
.4
2,19
8,70
1 1.
4
48,8
43
20.6
72
4,28
2
11.8
41
4,16
1
3.9
13
5,99
5
100.
0 3
,521
,982
Men
Hous
ehol
d he
ad41
.6
913,
145
1.1
23
,517
*10
.6
233,
477
8.5
18
5,57
1 2.
4
52,8
74
64.2
1,4
08,5
84
Spou
se1.
3
28,1
69 *
0.1
1,
235 *
0.8
17
,662
*0.
8
17,5
28 *
0.3
6,
680 *
3.2
71
,274
Son
12.4
27
1,63
8 0.
6
12,3
64 *
6.3
13
7,98
7 4.
3
95,2
06
1.4
30
,920
*25
.0
548,
115
othe
rs3.
7
80,4
03
0.2
3,
589 *
1.5
32
,594
*2.
0
43,5
54 *
0.2
5,
258 *
7.5
16
5,39
8
ToTa
l59
.0 1
,293
,355
1.
9
40,7
05
19.2
42
1,72
0 15
.6
341,
859
4.4
95
,732
10
0.0
2,1
93,3
71
Wom
en
Hous
ehol
d he
ad19
.8
262,
445
0,2
2,
503 *
1.4
18
,248
*5.
5
73,0
49
0.7
9,
270 *
27.5
36
5,51
5
Spou
se26
.7
354,
88 5
0,2
2,
994 *
1.7
22
,231
*10
.0
133,
242
0.6
7,
860 *
39.2
52
1,21
2
Daug
hter
19.0
25
2,61
3 0,
2
2,64
1 *2.
1
28,1
25 *
5.9
78
,071
1.
4
18,3
23 *
28.6
37
9,77
3
othe
rs2.
7
35,4
03 *
-
- 0.
3
3,69
8 *1.
4
18,2
00 *
0.4
4,
810 *
4.7
62
,111
ToTa
l68
.1
905,
346
0.6
8,
138 *
5.4
72
,302
22
.8
302,
562
3.0
40
,263
10
0.0
1,3
28,6
11
Sour
ce: E
PH
/ILM
, IV
Qua
rter
200
5. N
ote:
(*)
Coe
ffici
ents
of v
aria
tion
equa
l or
grea
ter
than
20
per
cent
.

WIEGO Working Paper (Urban Policies) No 8
31
Differences in the educational profiles of formal and informal employees are even more marked than those in age profiles. A quarter of informal employees who work for formal units, and as many as half of all informal employees who work for informal production units, have very low educational credentials (completed primary school or less). These profiles are heavily influenced by men’s educational attainments, which are lower than women’s. Note that as many as a third of male employees have only completed primary school, while the same proportion of female employees have completed university or tertiary degrees. But while almost 40 per cent of formal female employees have university/tertiary degrees, only 18 per cent have achieved these educational levels among informal employees in formal units; the proportion drops to 11 per cent among informal employees in informal production units.
These figures also indicate that the lower the educational credentials, the more likely that employees occupy informal positions in informal production units. In contrast, the higher the educational credentials, the more likely it is workers occupy formal positions, or, to a lesser extent, informal positions in formal production units.

WIEGO Working Paper (Urban Policies) No 8
32
Tabl
e 16
: Edu
catio
nal A
ttain
men
t of F
orm
al a
nd In
form
al E
mpl
oyee
s, b
y Ty
pe o
f Pro
duct
ion
Uni
t and
Sex
Educ
atio
nal a
ttain
men
t
Form
al in
form
al
prod
uctio
n un
itsFo
rmal
(pro
duct
ion
unit
not c
lass
ified
)In
form
al in
form
al
prod
uctio
n un
itsIn
form
al in
info
rmal
pr
oduc
tion
units
Info
rmal
(pro
duct
ion
unit
not c
lass
ified
)To
tal
%Nu
mbe
r of
pers
ons
%Nu
mbe
r of
pers
ons
%Nu
mbe
r of
pers
ons
%Nu
mbe
r of
pers
ons
%Nu
mbe
r of
pers
ons
%Nu
mbe
r of
pers
ons
Tota
l
Up to
com
plet
e pr
imar
y sch
ool
11.3
396,
786
0.4
15
,012
*4.
9
172
,732
5.
5
192,
149
1.
7
59,
508
23
.7 8
36,1
87
Seco
ndar
y sch
ool (
not c
ompl
ete)
8.2
289,
480
0.2
6,
202
*4.
7
164
,757
3.
3
116,
283
0.
8
27,
895 *
17.2
604
,617
Seco
ndar
y sch
ool (
com
plet
e)15
.052
6,57
4 0.
4
13,1
23 *
4.7
1
64,1
15
1.9
65
,780
0.6
1
9,85
3 *22
.4 7
89,4
45
Univ
ersi
ty/te
rtiar
y sch
ool (
not c
omp.
)11
.440
2,91
6 0.
2
7,11
1 *
3.6
126,
914
0.
6
21,8
49 *
0.5
1
7,68
4 *16
.4 5
76,4
74
Univ
ersi
ty/te
rtiar
y sch
ool (
com
plet
e)16
.658
2,94
5 0.
2
7,39
5 *
2.7
9
5,76
4
0.5
18
,100
*0.
3
11,
055 *
20.3
715
,259
ToTa
l62
.42,
198,
701
1.4
48
,843
20.6
7
24,2
82
11
.8
414,
161
3.
9
135
,995
10
0.0
3,5
21,9
82
Men
Up to
com
plet
e pr
imar
y sch
ool
14.8
324,
032
0.6
1
3,50
5 *
5.8
12
7,77
6
7.9
17
3,45
0
2.2
4
9,31
2
31.4
688
,075
Seco
ndar
y sch
ool (
not c
ompl
ete)
10.4
228,
952
0.3
6
,202
*4.
6
101,
578
4.
1
90,7
53
0.
9
19,
223 *
20.4
446
,708
Seco
ndar
y sch
ool (
com
plet
e)13
.930
4,48
5 0.
5
11,
636
*3.
9
86,5
85
2.
4
51,5
71
0.
7
15,
019 *
21.4
469
,296
Univ
ersi
ty/te
rtiar
y sch
ool (
not c
omp.
)9.
420
6,73
6 0.
3
5,87
6 *
3.0
66
,380
0.
7
16,0
34 *
0.3
6
,560
*13
.7 3
01,5
86
Univ
ersi
ty/te
rtiar
y sch
ool (
com
plet
e)10
.422
9,15
0 0.
2
3,48
6 *
1.8
39
,401
*0.
5
10,0
51 *
0.3
5
,618
*13
.1 2
87,7
06
ToTa
l59
.01,
293,
355
1.9
40
,705
19.2
42
1,72
0
15.6
34
1,85
9
4.4
9
5,73
2
100.
0 2
,193
,371
Wom
en
Up to
com
plet
e pr
imar
y sch
ool
5.5
72,7
54
0.1
1,5
07 *
3.4
44
,956
1.4
18
,699
*0.
8
10,
196 *
11.1
148
,112
Up to
com
plet
e pr
imar
y sch
ool
5.5
72,7
54
0.1
1,5
07 *
3.4
44
,956
1.4
18
,699
*0.
8
10,
196 *
11.1
148
,112
Up to
com
plet
e pr
imar
y sch
ool
5.5
72,7
54
0.1
1,5
07 *
3.4
44
,956
1.4
18
,699
*0.
8
10,
196 *
11.1
148
,112
Up to
com
plet
e pr
imar
y sch
ool
5.5
72,7
54
0.1
1,5
07 *
3.4
44
,956
1.4
18
,699
*0.
8
10,1
96 *
11.1
148
,112
Seco
ndar
y sch
ool (
com
plet
e)16
.722
2,08
9 0.
1 1
,487
*5.
8
77,5
30
1.
1
14,2
09 *
0.4
4,
834 *
24.1
320
,149
Univ
ersi
ty/te
rtiar
y sch
ool (
not c
omp.
)14
.819
6,18
0 0.
1 1
,235
*4.
6
60,5
34
0.
4
5,81
5 *
0.8
11
,124
*20
.7 2
74,8
88
Univ
ersi
ty/te
rtiar
y sch
ool (
com
plet
e)26
.635
3,79
5 0.
3 3
,909
*4.
2
56,3
63
0.
6
8,04
9 *
0.4
5,
437 *
32.2
427
,553
ToTa
l68
.190
5,34
6 0.
6 8
,138
*22
.8
302,
562
5.
4
72,3
02
3.
0
40,2
63
100.
0 1
,328
,611
Sour
ce: E
PH
/ILM
, IV
Qua
rter
200
5. N
ote:
(*)
Coe
ffici
ents
of v
aria
tion
equa
l or
grea
ter
than
20
per
cent
.

WIEGO Working Paper (Urban Policies) No 8
33
As shown in Table 4, almost all employees who work for households are domestic workers, women, and informal. In striking contrast with their female counterparts working in production units, female domestic workers have very low educational attainment (60% of them have only attended or finished primary school) and are relatively old (40% are older than 50 years of age) (MTESS/BM 2007: 69).
Formal and Informal Independent Workers
Compared to employees, independent workers are clearly older: only 6.3 per cent are young (up to 24 years of age) and over 40 per cent are older than 50 years of age. Also, independent male workers are relatively older than their female counterparts. There are very few young formal independent workers, either female or male; and formal independent workers are older than average independent workers. Therefore, the older the independent worker, the more likely that she/he (more “he” than “she” in absolute numbers) is formal (Table 17).
Table 17: Age of Formal and Informal Independent Workers, by Sex
age
Formal production units
Informal production units Not classified Total
% Number of persons % Number of
persons % Number of persons % Number of
persons
Total
Up to 24 years 0.9 11,089 * 4.9 62,030 0.6 7,377 * 6.3 80,496
From 25 to 49 years 22.9 291,427 26.3 333,676 3.6 45,200 52.8 670,303
50 years old or older 19.6 248,660 18.8 239,297 2.4 31,109 * 40.9 519,066
ToTal 43.4 551,176 50.0 635,003 6.6 83,686 100.0 1,269,865
Men
Up to 24 years 1.2 9,884 * 4.5 37,785 * 0.3 2,478 * 6.0 50,147
From 25 to 49 years 22.8 191,073 24.2 203,070 4.0 33,850 * 51.1 427,993
50 years old or older 21.1 177,016 18.6 156,048 3.2 26,769 * 42.9 359,833
ToTal 45.1 377,973 47.4 396,903 7.5 63,097 100.0 837,973
Women
Up to 24 years 0.3 1,205* 5.6 24,245 * 1.1 4,899 * 7.0 30,349*
From 25 to 49 years 23.2 100,354 30.2 130,606 2.6 11,350 * 56.1 242,310
50 years old or older 16.6 71,644 19.3 83,249 1.0 4,340 * 36.9 159,233
ToTal 40.1 173,203 55.1 238,100 4.8 20,589 * 100.0 431,892
Source: EPH/ILM, IV Quarter 2005. Note: (*) Coefficients of Variation equal or greater than 20 per cent.
The age profile of independent workers coincides with their position in the household. As many as 79.1 per cent of men independent workers are household heads, who are slightly less informal than average. In contrast, the great majority of sons are informal. Similarly, spouses and household heads are more prevalent among independent workers than they are among employees, although the incidence of informality does not seem to vary according to household position – with the exception of daughters.

WIEGO Working Paper (Urban Policies) No 8
34
Table 18: Household Position of Formal and Informal Independent Workers, by Sex
Household position
Formal production units
Informal production units Not classified Total
% Number of persons % Number of
persons % Number of persons % Number of
persons
Total
Household head 29.1 369,063 28.3 359,563 4.7 59,287 62.0 787,913
Spouse 9.8 124,436 11.0 139,476 0.8 9,590 * 21.5 273,502
Daughter/son 3.4 43,105 8.8 111,744 1.1 13,619 * 13.3 168,468
others 1.1 14,572 * 1.9 24,220 * 0.1 1,190 * 3.1 39,982 *
ToTal 43.4 551,176 50.0 635,003 6.6 83,686 100.0 1,269,865
Men
Household head 38.4 321,633 34.3 287,618 6.3 53,167 79.1 662,418
Spouse 3.0 25,203 * 2.8 23,422 * 0.1 1,247 * 6.0 49,872
Daughter/son 2.6 21,412 * 8.4 70,345 0.9 7,493 * 11.8 99,250
others 1.2 9,725 * 1.9 15,518 * 0.1 1,190 * 3.2 26,433 *
ToTal 45.1 377,973 47.4 396,903 7.5 63,097 100.0 837,973
Women
Household head 11.0 47,430 16.7 71,945 1.4 6,120 * 29.1 125,495
Spouse 23.0 99,233 26.9 116,054 1.9 8,343 * 51.8 223,630
Daughter/son 5.0 21,693 * 9.6 41,399 1.4 6,126 * 16.0 69,218
others 1.1 4,847 * 2.0 8,702 * - - 3.1 13,549 *
ToTal 40.1 173,203 55.1 238,100 4.8 20,589 * 100.0 431,892
Source: EPH/ILM, IV Quarter 2005. Note: (*) Coefficients of variation equal or greater than 20 per cent.
As older generations of workers are less likely to be highly educated, it is not surprising that independent workers are relatively less educated than employees on average (Table 19). As many as 35 per cent of all independent workers have only partial or completed primary education, a proportion that reaches 40 per cent among male independent workers. The less educated, the more likely that these workers are informal: as many as 60 per cent of all informal male independent workers, and 33 per cent of informal female independent workers, have only these very low educational credentials.

WIEGO Working Paper (Urban Policies) No 8
35
Table 19: Educational Attainment of Formal and Informal Independent Workers, by Sex
Educational attainment
Formal production units
Informal production units Not classified Total
% Number of persons % Number of
persons %Number
of persons
% Number of persons
Total
Up to complete primary school 8.0 101,695 24.2 307,288 2.7 34,902 * 35.0 443,885
Secondary school (complete) 7.3 93,088 7.4 94,130 1.2 15,360 * 16.0 202,578
University/tertiary school (not comp.) 5.2 66,052 6.2 78,231 1.0 12,500 * 12.3 156,783
University/tertiary school (complete) 18.2 230,997 3.5 44,645 1.1 13,566 * 22.8 289,208
ToTal 43.4 551,176 50.0 635,003 6.6 83,686 100.0 1,269,865
Men
Up to complete primary school 9.0 75,266 27.3 228,410 3.7 31,264 40.0 334,940
Secondary school (not complete) 6.5 54,347 8.7 73,020 0.9 7,358 16.1 134,725
Secondary school (complete) 8.2 68,607 5.5 45,844 1.1 9,159 14.8 123,610
University/tertiary school (not comp.) 6.8 57,247 4.4 36,849 1.1 8,938 12.3 103,034
University/tertiary school (complete) 14.6 122,506 1.5 12,780 0.8 6,378 16.9 141,664
ToTal 45.1 377,973 47.4 396,903 7.5 63,097 100.0 837,973
Women
Up to complete primary school 6.1 26,429 * 18.3 78,878 0.8 3,638* 25.2 108,945
Secondary school (not complete) 1.2 4,997 * 8.7 37,689 * 0.0 - 9.9 42,686
Secondary school (complete) 5.7 24,481 * 11.2 48,286 1.4 6,201* 18.3 78,968
University/tertiary school (not comp.) 2.0 8,805 * 9.6 41,382 0.8 3,562* 12.4 53,749
University/tertiary school (complete) 25.1 108,491 7.4 31,865 * 1.7 7,188* 34.2 147,544
ToTal 40.1 173,203 55.1 238,100 4.8 20,589* 100.0 431,892
Source: EPH/ILM, IV Quarter 2005. Note: (*) Coefficients of variation equal or greater than 20 per cent.

WIEGO Working Paper (Urban Policies) No 8
36
Earnings
Formal and Informal Wage Earners
The previous sections have highlighted the heterogeneity of the informal economy in Greater Buenos Aires, showing the importance of wage employment in explaining informality and the diverse contexts in which informal wage employment occurs: in formal production units; in informal production units; and in households. These different forms of informality in wage work are heavily related to earning penalties that go beyond the informal-formal divide. As expected, monthly earnings of formal employees are more than twice those of informal employees ($1162 as compared to $493, current values). Table 20 shows, however, that being informal but working for a formal production unit is associated with mean monthly earnings that are almost 50 per cent higher on average than those of informal employees in informal production units.
Mean monthly earnings are the lowest among informal employees working for households, at a level that is half the earnings of formal workers in households. It is worth noting, however, that this is not the case for mean hourly earnings: at $3.30 per hour, mean hourly earnings of informal workers in households are higher than those of informal employees working in informal production units, and equivalent to mean hourly earnings of formal employees working for households. (Figures are similar in the case of women, who are the bulk of these workers.) This is because the differences behind monthly earnings are almost exclusively related to differences in mean hours worked, in an occupation that is mostly paid “by the hour”15: formal workers in households work 16 hours more on average than their informal counterparts. Still, the fact that the great majority of domestic workers work in a single home (i.e. have only one employer) suggests that these short working hours are not necessarily desired, as the opportunity to increase the hours of work (and monthly income) is associated more with the needs of a single employer rather than with the possibility of working for multiple employers (Esquivel 2010).
Table 20: Mean Monthly and Hourly Earnings of Formal and Informal Employees, by Sex
Employees
Women Men Total
Mean hours
worked
Mean monthly earnings
Mean hourly
earnings
Mean hours
worked
Mean monthly earnings
Mean hourly
earnings
Mean hours
worked
Mean monthly earnings
Mean hourly
earnings
Formal in formal production units 38 1045 6.85 48 1263 6.69 44 1176 6.75
Formal (production unit n.e.c.) 45 895 5.36 50 720 3.42 49 758 3.84
Formal in households 38 510 3.21 61 1023 3.84 42 602 3.33
Informal in formal production units 31 538 4.61 44 728 4.18 39 647 4.36
Informal in informal production units 35 322 2.99 47 470 2.53 44 442 2.62
Informal (production unit n.e.c.) 36 215 2.15 45 574 3.19 42 466 2.87
Informal in households 24 288 3.33 29 288 2.85 24 288 3.30
ToTal 33 722 5.32 29 991 5.33 41 874 5.32
Source: EPH/ILM, IV Quarter 2005.
15 There are therefore differences between monthly earnings that do not vary with hours worked (typically, those of formal and regulated employees); and those of “per hour” workers, whose earnings vary pari passu with hours.

WIEGO Working Paper (Urban Policies) No 8
37
Table 21: Mean Monthly and Hourly Earnings of Formal and Informal Independent Workers, by Sex
Independent workers
Women Men Total
Mean hours
worked
Mean monthly earnings
Mean hourly
earnings
Mean hours
worked
Mean monthly earnings
Mean hourly
earnings
Mean hours
worked
Mean monthly earnings
Mean hourly
earnings
Formal production units 37 1115 8.49 51 1788 9.05 47 1585 8.88
Informal production units 34 347 3.71 38 545 5.05 36 472 4.56
Production units not classified 24 343 5.08 42 1042 6.42 38 899 6.15
ToTal 35 648 5.63 44 1132 6.93 41 972 6.50
Source: EPH/ILM, IV Quarter 2005.
It should also be noted that all formal workers in households work 16 hours a week or more, while 42.8 per cent of informal workers in households work for less than 16 hours a week. According to the Domestic Service Personnel Statute (Decree 326/1956), it is not compulsory for employer households to register employees who work for less than 16 hours a week. It is therefore expected that domestic workers who work less than 16 hours a week are informal.
Aside from employees working for households, the distribution of mean hourly earnings resembles that of monthly earnings. Formal employees in formal production units earn 50 per cent more per hour on average than informal employees in formal production units, who in turn earn 60 per cent per hour more than informal employees in informal production units.
Differences in hours worked largely explain differences in monthly earnings between women and men, as women’s hourly earnings are higher than men’s hourly earnings – a long-term stylized fact in Argentina. This does not mean that gender wage gaps do not exist: multivariate analyses show that based on their formal qualifications – other things being equal – women employees should earn more (not the same) than men on an hourly basis (Esquivel 2007; and below).
Multivariate analyses of ILM data confirm these findings. As shown in Table 22, after controlling for variables related to qualifications, educational level, industry, and personal characteristics, being an informal employee carries a wage penalty of 36 per cent, while working for an informal production unit penalizes wages 20 per cent. Being a man carries a wage premium of 20 per cent. Hourly wages decrease with hours worked, and increase (at a decreasing rate) with age. Household heads have a 6 per cent wage premium. Wages increase with education levels attended (the control is no schooling), and with qualifications. The sectors with a greater presence of informal work among men (construction) and women (domestic sectors) are not significantly different from the manufacturing industry (the control), possibly because other variables (and in particular, informal work) fully capture the effect of the gender profile on wages.

WIEGO Working Paper (Urban Policies) No 8
38
Table 22: Multivariate Analysis of Earnings: Employees
CoefficientStd. Err.
t Sig. Mean
Dependent var. Ln hourly earnings
Independentvariables
Hours worked -0.014 0.001 -21.79 *** 1.446
Age 0.051 0.005 10.58 *** 41.4
Age squared -0.001 0.000 -9.03 *** 38.1
Man 0.202 0.025 7.97 *** 1627.8
Household head 0.064 0.024 2.67 *** 0.562
Primary school (complete) 0.129 0.046 2.78 *** 0.498
Secondary school (not complete) 0.199 0.049 4.06 *** 0.229
Secondary school (complete) 0.352 0.050 7.1 *** 0.178
University/tertiary school (not complete)
0.491 0.054 9.13 *** 0.212
University/tertiary school (complete) 0.697 0.057 12.15 *** 0.149
Semi-skilled 0.137 0.029 4.76 *** 0.410
Technical skill 0.287 0.041 7.01 *** 0.490
Professional skill 0.562 0.052 10.87 *** 0.150
Agriculture and mining -0.237 0.123 -1.93 * 0.075
Construction 0.022 0.053 0.4 0.007
Wholesale/retail trade -0.052 0.036 -1.46 0.047
Hotels and restaurants 0.057 0.055 1.04 0.141
Transport 0.075 0.042 1.8 * 0.041
Financial sector 0.077 0.040 1.93 * 0.083
Public administration 0.122 0.045 2.74 *** 0.101
Education -0.163 0.049 -3.33 *** 0.074
Health and other community/social services
-0.037 0.038 -0.98 0.079
Other sectors 0.321 0.105 3.06 *** 0.130
Domestic Service 0.027 0.050 0.53 0.009
Informal production unit -0.205 0.040 -5.17 *** 0.105
Informal employee -0.363 0.026 -13.82 *** 0.171
Constant 0.465 0.109 4.27 *** 0.098
observations 2369
R-squared 0.5458
Adj R-squared 0.5408
Control variables: woman; other family members; no schooling; unskilled; manufacturing industry; not informal production units.

WIEGO Working Paper (Urban Policies) No 8
39
Formal and Informal Independent Workers
Compared to employees, formal independent workers earn more than formal employees, but informal independent workers earn less than informal employees in monthly terms (Tables 20 and 21). As their hours are lower on average, however, independent workers make substantially more per hour than their comparable employees. Formal independent workers earn $8.88 per hour, as compared to the $6.66 formal employees make on average; and informal independent workers earn $4.56, as compared to $3.56 that informal employees make (a figure heavily influenced by the higher hourly earnings of employees for households).
In all cases, independent male workers earn more than their female counterparts. The multivariate analysis (Table 23) shows that the earnings premium male independent workers get (37.5%) is higher than that of male employees.
Table 23 : Multivariate Analysis of Earnings: Independent Workers
CoefficientStd. Err.
t Sig. Mean
Dependent var. Ln hourly earnings 1.345Independentvariables
Employer 0.241 0.124 1.94 * 0.117Hours worked -0.020 0.001 -13.81 *** 40.9Age 0.060 0.012 4.91 *** 45.7Age squared -0.001 0.000 -4.63 *** 2298.8Man 0.375 0.076 4.95 *** 0.659Household head 0.141 0.074 1.9 * 0.638Primary school (complete) 0.310 0.103 3.01 *** 0.248Secondary school (not complete) 0.287 0.117 2.45 ** 0.152Secondary school (complete) 0.547 0.118 4.66 *** 0.170University/ tertiary school (not complete) 0.578 0.132 4.38 *** 0.121University/ tertiary school (complete) 0.739 0.134 5.51 *** 0.192Semi-skilled 0.311 0.126 2.47 ** 0.628Technical skill 0.574 0.164 3.51 *** 0.201Professional skill 0.882 0.185 4.76 *** 0.109Agriculture and mining 0.454 0.530 0.86 0.003Construction 0.023 0.113 0.21 0.157Wholesale/retail trade -0.094 0.093 -1.02 0.359Hotels and restaurants -0.079 0.179 -0.44 0.031Transport 0.253 0.150 1.69 0.052Financial sector 0.131 0.133 0.98 0.106Public administration (dropped) 0.000Education 0.212 0.199 1.06 0.038Health and other community/social services
0.018 0.129 0.14 0.102
Other sectors (dropped) 0.000Domestic service -0.361 0.296 -1.22 0.010Informal production unit -0.451 0.069 -6.55 *** 0.552Constant -0.183 0.325 -0.56
observations 677R-squared 0.510Adj R-squared 0.492
Control variables: Own account worker; woman; other family members; no schooling; unskilled; manufacturing industry; not informal production unit

WIEGO Working Paper (Urban Policies) No 8
40
The multivariate analysis is also informative about other dimensions of informal independent work and their impact of earnings. Hourly earnings diminish with hours worked, and increase with age (at a decreasing rate). Employers, as expected, have hourly earnings that are 24 per cent above those of own account workers. Returns on education and qualifications are greater than those of employees, but industries are irrelevant (not statistically significant at 10%) in explaining independents’ hourly earnings. There are indications that informality in production units (i.e. those not complying with business and tax regulations) is connected with lower earnings, as those who are informal have hourly earnings 45 per cent less than formal independents. This suggests that non-compliance is related to low incomes and a subsistence logic of these units and workers. Data on capital stock and production unit size, as well as motivational aspects, also point towards this conclusion (MTESS/WB 2007).
An Aggregate View on Labour Earnings
An aggregate look at labour earnings helps summarize this section’s findings. Table 24 shows shares in labour earnings and employment shares of formal and informal workers, according to formality and status in employment. Informal workers’ lower mean earnings imply that, although they are almost half of total employment (45.6%), they only get a quarter of total labour earnings (24.9%). Informal independent workers are worse off than their employee counterparts, getting an income share that represents half their share in employment. In contrast, formal independent workers get a share of total labour earnings that is almost double their share in employment, making them on average better off than their formal employee counterparts.
Table 24: Shares of Labour Earnings and Employment, by Status in Employment and Formality. Greater Buenos Aires 2005
Job category
Workers
Formal Informal Not specified Total
Share in earnings
Share in employment
Share in earnings
Share in employment
Share in earnings
Share in employment
Share in earnings
Share in employment
Employees 55.6 42.9 18.3 31.9 - - 73.9 74.9
Independent workers
18.3 10.4 6.7 12.6
1.2 1.2 26.1 24.1
Family workers - - 0 1.1 - - 0 1.1
ToTal 73.9 53.3 24.9 45.6 1.2 1.2 100.0 100.0
Source: EPH/ILM, IV Quarter 2005.

WIEGO Working Paper (Urban Policies) No 8
41
ConclusionsThis report complements previous analyses based on the Informal Labour Module collected in Greater Buenos Aires in 2005 by examining a comprehensive set of dimensions that define the informal economy in a sex-disaggregated way. This report has shown that not only are women more informal than men, but that the dimensions that contribute to characterizing women’s and men’s informality differ. Half of all women workers and 42 per cent of men worked in the informal economy in Greater Buenos Aires in 2005. But women who work in the informal economy are more likely than men to be employees. Almost half of all women informal employees are domestic workers, and over a third are informal in formal production units. In contrast, as many as a quarter of men informal workers are independent workers. Male informal employees are almost equally as likely to work in formal and in informal production units.
Informal employees and independent workers who work in informal production units, which constitute the informal sector, are in the most vulnerable position, and account for almost half of total informal employment. They are likely to be men, semi-skilled or unskilled, and concentrated in construction and trade (and transport, if they are informal employees). Their mean monthly earnings are only half the mean earnings of their counterparts (with the same status in employment), although informal independent workers are relatively better off than their waged counterparts.
However, informal employment in the informal sector does not explain the whole of informality in Greater Buenos Aires. There coexists a group of informal workers employed by formal enterprises who account for a third of informal employment. Women are relatively more likely than men to belong to this group, with a high incidence of semi-skilled workers, and a concentration in manufacturing and trade. Although they are unprotected by the Labour Law, these workers’ mean monthly and hourly earnings are higher than informal employees in informal enterprises.
The remaining group of informal workers is female domestic workers. Employed by households and de jure and de facto discriminated against, these women have the lowest educational credentials and have the lowest monthly earnings among informal employees. They constitute a group of highly vulnerable female workers, closely related to the “organization of care” in Argentina, in this case, the fact that households in the middle classes and upper-middle classes resort to domestic employment to cover some of their care needs. The extent and characteristics of this occupation cannot be understood without taking into account existing income inequality – both in terms of the income differentials between employer households and the wages they pay to their employees; and of the restricted employment options available to women from poor households, who end up clustered in domestic work (Esquivel, 2010).
The ILM has thus provided new evidence on the dynamics behind the heterogeneity of informal employment in Greater Buenos Aires, by singling out these different groups of informal workers and helping characterize them in ways that are meaningful for policy purposes. This was not possible without the ILM, as the formality of the production unit in which employees and independent workers work was previously unknown.
In terms of methods, the ILM has shown that it is possible to rely on the knowledge workers have of the characteristics of the enterprise they work for (or on their willingness to provide information, in the case of independent workers), provided a sufficiently broad number of questions are posed on different dimensions of business and labour registration, in ways that are meaningful to respondents.
ILM findings point to the fact that variables used in the past to identify the informal sector (in particular, industry and workers’ skill level)16 are relatively reasonable proxies. But they are imperfect predictors of the conditions that explain informal employment beyond that generated by the informal sector. Therefore, there
16 The size of the establishment has also been used as a proxy variable, but there is no evidence that it is related to informality and has not been analyzed in this report. For an analysis based on the information provided by the ILM, see MTESS/BM (2007).

WIEGO Working Paper (Urban Policies) No 8
42
is room for incorporating some of the variables that help identify the formality of the enterprise into the core EPH. If this is not done, the ILM should be repeated periodically in all EPH urban centres to cover the whole of urban employment in Argentina.
Because the ILM was attached to the EPH, the module did not collect information on secondary activities – the incidence of informality in such activities remains unknown. Neither the ILM nor EPH can be used to identify waste pickers (there are no occupation codes that describe the activity). There are occupation codes dedicated to street vendors, but home-based workers are identified using the “place of work” variable. Except for home-based workers in the manufacturing industry (most of them women), little can be said about them, given their small numbers. Aside from recommending that the classification of activities is improved (as it stands now, it says little more than the industry composition of employment and the status in employment, as it is a combination of these two dimensions), it is not clear that the ILM should be tailored for these groups of workers, for which other statistical instruments might be better suited.

WIEGO Working Paper (Urban Policies) No 8
43
ReferencesApella, I. and L. Casanova. 2008. “Los trabajadores independientes y el sistema de seguridad social. El
caso del Gran Buenos Aires,” in Ministerio de Trabajo, Empleo y Seguridad Social and Banco Mundial, Aportes a una nueva visión de la informalidad laboral en la Argentina. Buenos Aires.
Carpio, J., and I. Novacovsky. 1999. “Introducción” in J. Carpio, E. Klein and I. Novacovsky, Informalidad y exclusión social. Buenos Aires: Fondo de Cultura Económica.
Beccaria, L., J. Carpio and A. Orsatti. 1999. “Argentina: informalidad laboral en el nuevo modelo económico,” in J. Carpio, E. Klein and I. Novacovsky, Informalidad y exclusión social. Buenos Aires: Fondo de Cultura Económica.
Beccaria, L., V. Esquivel and R. Maurizio. 2005. “Empleo, salarios y equidad durante la recuperación reciente en la Argentina,” Desarrollo Económico, Vol. 45, No. 178, julio-setiembre, Buenos Aires.
De Soto, H. 1987. El otro sendero. Buenos Aires: Editorial Sudamericana.Esquivel, V. 2006. “Algunos aspectos metodológicos del Módulo de Informalidad de la EPH,” in OIT,
Oficina en Argentina, Informalidad, pobreza y salario mínimo. Programa Nacional de Trabajo Decente Argentina 2004-2007, Buenos Aires.
Esquivel, V. 2007. “Género y diferenciales de salarios en Argentina,” in M. Novick and H. Palomino (eds.), Estructura productiva y empleo: un enfoque transversal. MTEySS, Miño y Dávila, Buenos Aires.
Esquivel, V. 2010. “Care Workers in Argentina: At the Crossroads of Labour Markets Institutions and Care Services.” International Labor Review, Vol. 149, No. 4, December.
Hussmanns, R. 2004. “Defining and Measuring Informal Employment.” Bureau of Statistics, International Labour Office, Geneva.
Instituto Nacional de Estadísticas y Censos, INDEC. 1989. Trabajadores por Cuenta Propia. Encuesta del Gran Buenos Aires 1988, Serie Estudios, No. 12, Buenos Aires.
Instituto Nacional de Estadísticas y Censos, INDEC. 2003. “La nueva Encuesta Permanente de Hogares de Argentina, 2003,” Buenos Aires.
International Labour Office, ILO. 1972. Employment, Income, and Equality: A Strategy for Increasing Productive Employment in Kenya. Geneva: ILO.
International Labour Office, ILO. 2003. “Guidelines Concerning a Statistical Definition of Informal Employment, Endorsed by the Seventeenth International Conference of Labour Statisticians (November-December 2003)” in Seventeenth International Conference of Labour Statisticians (Geneva, 24 November - 3 December 2003). Report of the Conference; Doc. ICLS/17/2003/R; Geneva.
Monza, A. 1999. “La evolución de la informalidad en el área metropolitana en los noventa. Resultados e interrogantes,” in J. Carpio, E. Klein and I. Novacovsky, Informalidad y exclusión social. Buenos Aires: Fondo de Cultura Económica.
MTSS, Ministerio de Trabajo y Seguridad Social, Dirección Nacional de Recursos Humanos y Empleo. 1981. El sector Cuenta Propia. Estudio socioeconómico del trabajo independiente y de la microempresa en la Capital Federal y en el Gran Buenos Aires (1980). Proyecto Gobierno Argentino PNUD/ OIT ARG/87/003, Buenos Aires.
MTESS, Ministerio de Trabajo, Empleo y Seguridad Social. 2004. “Diagnóstico del empleo no registrado,” Subsecretaría de Programación Técnica y Estudios Laborales, Serie Estudios/1, Buenos Aires.
MTESS/BM, Ministerio de Trabajo, Empleo y Seguridad Social and Banco Mundial 2007. La Informalidad Laboral en el Gran Buenos Aires. Una nueva mirada, Buenos Aires
MTESS/BM, Ministerio de Trabajo, Empleo y Seguridad Social and Banco Mundial. 2008. Aportes a una nueva visión de la informalidad laboral en la Argentina, Buenos Aires.
Novick, M., X. Mazorra, and D. Schleser. 2008. “Un nuevo esquema de políticas públicas para la reducción de la informalidad laboral,” in Ministerio de Trabajo, Empleo y Seguridad Social and Banco Mundial, Aportes a una nueva visión de la informalidad laboral en la Argentina. Buenos Aires.
Orsatti, A. and R. Calle. 2003. La situación de los Trabajadores/as Informales en el Cono Sur y el Área Andina. Argentina, Brasil, Chile, Paraguay, Uruguay, Colombia, Perú, Venezuela, OIT.

WIEGO Working Paper (Urban Policies) No 8
44
PREALC, Programa Regional de Empleo para América Latina y el Caribe. 1981. Sector Informal. Santiago de Chile.
Pok, C. and Lorenzetti, A. 2004. “Los perfiles sociales de la informalidad en Argentina,” presentado en el Taller de discusión: Informalidad y Género en Argentina. Buenos Aires: WIEGO – CIEPP, mayo.
Portes, A., M. Castells, and L. A. Benton. 1989. “The Policy Implications of Informality” in Portes, A, M. Castells and L. A. Benton (eds.), The Informal Economy: Studies in Advanced and Less Developed Countries. Baltimore, USA: The Johns Hopkins University Press.
Waisgrais, S. and M. Sarabia. 2008. “Heterogeneidad social y productiva: caracterización del trabajo informal en el Gran Buenos Aires,” in Ministerio de Trabajo, Empleo y Seguridad Social and Banco Mundial, Aportes a una nueva visión de la informalidad laboral en la Argentina. Buenos Aires.
World Bank. 2006. Argentina Poverty Assessment. Informal Employment in Argentina: Towards Understanding Its Causes and Consequences, Report No. 36092-AR. Argentina, Chile, Paraguay, Uruguay Country Management Unit, Latin America and the Caribbean Region, Buenos Aires.

About Inclusive Cities: The Inclusive Cities project aims to strengthen membership-based organizations (MBOs) of the working poor in the areas of organizing, policy analysis and advocacy, in order to ensure that urban informal workers have the tools necessary to make themselves heard within urban planning processes. Inclusive Cities is a collaboration between MBOs of the working poor, international alliances of MBOs and those supporting the work of MBOs. For more information visit: www.inclusivecities.org.
About WIEGO: Women in Informal Employment: Globaliz-ing and Organizing is a global research-policy-action net-work that seeks to improve the status of the working poor, especially women, in the informal economy. WIEGO builds alliances with, and draws its membership from, three con-stituencies: membership-based organizations of informal workers, researchers and statisticians working on the infor-mal economy, and professionals from development agen-cies interested in the informal economy. WIEGO pursues its objectives by helping to build and strengthen networks of informal worker organizations; undertaking policy analy-sis, statistical research and data analysis on the informal economy; providing policy advice and convening policy dia-logues on the informal economy; and documenting and dis-seminating good practice in support of the informal work-force. For more information visit: www.wiego.org.