the information content of stock markets: why do emerging markets have synchronous stock price...
TRANSCRIPT

qThis research was supported by the NTT Fellowship program at the University of MichiganBusiness School and by the Center for International Business Studies at the University of Alberta.We are grateful for superb computer work by Rade Mladenov, and for helpful assistance fromDatastream. We also thank Yehning Chen, Alan Deardor!, Merritt Fox, Ken Froot, Roger Gordon,Larry Merville, Philip Shively, Mark Huson, Ken Lehn, Li Huaizu, Vikas Mehrotra, Ted Neave,Gerard Roland, Alan Schwartz, G. William Schwert, Andrei Shleifer, Jan Svejnar, Katherine Terrell,Rob Vishny, David Weinstein, Michael Weisbach and two anonymous referees. We also thankseminar participants at the 2000 APFME Conference, the 1st CAFR Conference, the EuropeanInternational Business Association 1997 Meetings, George Mason University, Harvard BusinessSchool, the Behavioural Finance course at the Harvard Economics Department, Hong KongPolytechnic University, the Hong Kong University of Science and Technology, M.I.T., the NationalBureau of Economic Research Behavioral Finance Seminar, New York University, the 1998 jointNFA/APFA conference, Texas A & M University, Queen's University, Tulane University, theUniversity of Arizona, the University of British Columbia, the University of Maryland, the WesternEconomic Association 1998 Meetings, the William Davidson Institute Law and Economics confer-ence at the University of Michigan, the William Davidson Institute Research conference at theUniversity of Michigan, and Xi'an Jiaotong University. This research was completed while RandallMorck was a visiting professor at Harvard and Bernard Yeung relocating from the University ofMichigan to the Stern School of Business at New York University.
*Corresponding author. Tel.: #1-780-492-5683.
E-mail address: [email protected] (R. Morck).
Journal of Financial Economics 58 (2000) 215}260
The information content of stock markets: whydo emerging markets have synchronous stock
price movements?q
Randall Morck!,*, Bernard Yeung", Wayne Yu#
!Faculty of Business, University of Alberta, Edmonton, Canada T6G 2R6"Stern School of Business, New York University, New York, NY 10012, USA
#Department of Accountancy, Hong Kong Polytechnic University, Hung Hom,Kowloon, Hong Kong, China
Received 20 January 1999; received in revised form 29 July 1999
Abstract
Stock prices move together more in poor economies than in rich economies. This"nding is not due to market size and is only partially explained by higher fundamentals
0304-405X/00/$ - see front matter ( 2000 Elsevier Science S.A. All rights reserved.PII: S 0 3 0 4 - 4 0 5 X ( 0 0 ) 0 0 0 7 1 - 4

1At present, we only have a long panel of returns for the US. We are beginning our exploration ofhistorical patterns of other advanced economies.
correlation in low-income economies. However, measures of property rights do explainthis di!erence. The systematic component of returns variation is large in emergingmarkets, and appears unrelated to fundamentals co-movement, consistent with noisetrader risk. Among developed economy stock markets, higher "rm-speci"c returnsvariation is associated with stronger public investor property rights. We propose thatstrong property rights promote informed arbitrage, which capitalizes detailed "rm-speci"c information. ( 2000 Elsevier Science S.A. All rights reserved.
JEL classixcation: G12; G14; G15; G38; N20
Keywords: Asset pricing; Information and market e$ciency; Event studies; International"nancial markets; Financial economics
1. Introduction
Stock returns re#ect new market-level and "rm-level information. As Roll(1988) makes clear, the extent to which stocks move together depends on therelative amounts of "rm-level and market-level information capitalized intostock prices. We "nd that stock prices in economies with high per capita grossdomestic product (GDP) move in a relatively unsynchronized manner. Incontrast, stock prices in low per capita GDP economies tend to move up ordown together. A time series of stock price synchronicity for the U.S. marketalso shows that the degree of co-movement in U.S. stock prices has declined,more or less steadily, during the 20th century. These "ndings are not due todi!erences in market size or economy size.1
We consider three plausible explanations for our "nding. First, "rms inlow-income countries might have more correlated fundamentals, and this cor-relation might make their stock prices move more synchronously. For example,if low-income economies tend to be undiversi"ed, "rm-level earnings may behighly correlated because industry events are essentially market-wide events.Second, low-income economies often provide poor and uncertain protection ofprivate property rights. Political events and rumors in such countries could, bythemselves, cause market-wide stock price swings. Moreover, inadequate pro-tection for property rights could make informed risk arbitrage in their stockmarkets unattractive. According to De Long et al. (1989, 1990), a reduction ininformed trading can increase market-wide noise trader risk, which we wouldobserve as increased market-wide stock price variation unrelated to funda-mentals. Third, in countries that provide poorer protection for public investors
216 R. Morck et al. / Journal of Financial Economics 58 (2000) 215}260
from corporate insiders, problems such as intercorporate income shifting couldmake "rm-speci"c information less useful to risk arbitrageurs, and thereforeimpede the capitalization of "rm-speci"c information into stock prices. Thise!ect would reduce "rm-speci"c stock price variation, again increasing stockreturn synchronicity.
We reject the "rst hypothesis, and "nd some evidence consistent with thesecond and third hypotheses stated above. Our formal statistical analysis showsthat economies with more correlated fundamentals do have stock markets withmore synchronous returns, but our best e!orts to control for fundamentalscorrelation and volatility do not render per capita GDP insigni"cant. Addinga variable that measures government respect for private property, however, doesrender per capita GDP insigni"cant in explaining stock price synchronicity.Finally, among developed economies, more protection of public shareholders'property rights against corporate insiders is correlated with more "rm-speci"cinformation being capitalized into stock prices.
We conjecture that the degree to which a country protects private propertyrights a!ects both the extent to which information is capitalized into stockprices and the sort of information that is capitalized. While our econometricevidence is consistent with this conjecture, we recognize that our explanation isincomplete. We invite alternative explanations of our empirical "nding thatstock returns are synchronous in low-income economies and asynchronous inhigh-income economies. Any such explanations must be consistent with our"ndings that market size, economy size, and many aspects of fundamentalsvolatility do not a!ect the relation between per capita GDP and synchronicity,but that measures of property rights protection render per capita GDP insigni-"cant in explaining stock price synchronicity.
In the next section, we review the empirical regularities that motivate thisresearch. In Section 3, we develop our basic synchronicity measures and showtheir negative relationship with per capita GDP. In Section 4, we discuss ourempirical framework and the dependent variables we adopt. In the "fth, sixthand seventh sections, we present our hypotheses and empirical speci"cations,report our results, and conduct various robustness checks. In Section 8, wepresent conclusions.
2. Emerging markets and developed economies
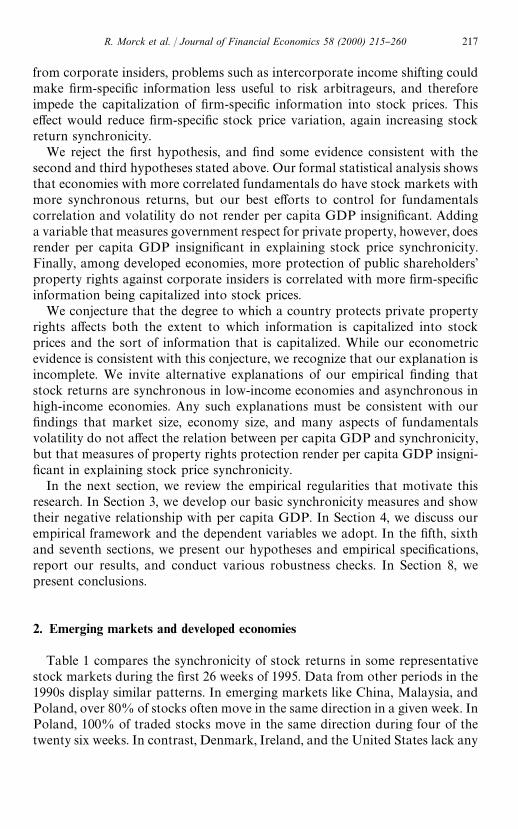
Table 1 compares the synchronicity of stock returns in some representativestock markets during the "rst 26 weeks of 1995. Data from other periods in the1990s display similar patterns. In emerging markets like China, Malaysia, andPoland, over 80% of stocks often move in the same direction in a given week. InPoland, 100% of traded stocks move in the same direction during four of thetwenty six weeks. In contrast, Denmark, Ireland, and the United States lack any
R. Morck et al. / Journal of Financial Economics 58 (2000) 215}260 217

Tab
le1
Stock
pric
eco
move
men
tin
sele
cted
emer
ging
and
dev
elop
edst
ock
mar
kets
The
frac
tion
ofst
ocksw
hose
price
sgo
up,g
odow
n,a
nd
rem
ain
the
sam
edu
ring
each
oft
he"rs
t26
wee
ksof1
995.
Price
chan
gesar
efrom
Dat
astr
eam
,and
are
adju
sted
fordiv
iden
ds.
Chin
aM
alay
sia
Pol
and
Den
mar
kIr
elan
dU
nite
dSta
tes
Wee
k%
Up
%D
ow
n%
Sam
e%
Up
%D
ow
n%
Sam
e%
Up
%D
ow
n%
Sam
e%
Up
%D
ow
n%
Sam
e%
Up
%D
ow
n%
Sam
e%
Up
%D
ow
n%
Sam
e
3261
718
739
973
050
2921
3946
1647
2924
24
896
886
65
950
4525
3033
3235
4738
153
688
722
699
5931
1036
3331
3240
2849
3713
47
885
195
33
925
2736
3733
3235
5432
145
848
780
119
397
048
3318
4426
3033
5315
67
5042
922
610
00
041
3029
4239
1944
4314
759
3110
7714
1015
778
4130
2842
4018
5730
138
1873
947
3913
1090
029
3536
2835
3748
3814
971
227
2860
1282
135
4033
2737
4221
4243
1510
934
413
7711
955
023
3641
2530
4644
4214
119
883
1278
93
953
3138
3126
3935
3352
1512
4151
766
2311
092
830
3733
2839
3350
3713
1389
74
5334
1315
6718
2136
4235
3926
4144
1514
849
641
508
100
00
2837
3532
4425
5035
1515
2173
515
7312
100
00
2743
3033
3928
4737
1516
1875
723
6611
5638
530
5218
2846
2645
4015
1729
638
5625
1990
100
3440
2642
3721
4144
1518
592
36
876
892
048
3318
4737
1650
3515
1935
569
3357
1041
4910
3936
2635
4421
4640
1420
2960
1194
33
8710
341
3622
4035
2549
3714
2189
83
2172
70
100
039
3526
4637
1842
4414
2221
764
5142
792
53
3833
2940
4416
4639
1523
1679
578
175
7423
334
4026
4944
0747
3914
2455
378
1677
736
5113
2440
3640
3326
4441
1525
484
1272
189
4149
1022
4137
4933
1852
3414
2673
207
3060
982
513
2640
3439
4912
4739
14
Sam
ple
308
stoc
ks34
9st
ock
s38
stoc
ks23
3st
ock
s57
stoc
ks
6,88
9st
ocks
218 R. Morck et al. / Journal of Financial Economics 58 (2000) 215}260

Fig. 1. Observed stock price synchronicity in the stock markets of selected countries The fraction ofstocks whose prices rise each week of 1995 in the stock markets of China, Malaysia, Poland and theUnited States based on returns including dividend income from Datastream.
instances of more than 57% of the stocks moving in the same direction duringany week, despite a rising market in the United States. Fig. 1 contrasts Chinese,Malaysian and Polish stocks with U.S. stocks. For clarity, Fig. 1 omits the datafor Denmark and Ireland. As Table 1 shows, the stocks data for Denmark andIreland closely resemble the returns in the U.S. market.
We can easily reject the trivial explanation based on the Law of LargeNumbers that markets with many stocks should show less dispersion around themean. First, the stock markets of Denmark and Ireland resemble the U.S.market, despite listing substantially fewer securities than China or Malaysia.Below we shall show that stock price co-movement is negatively correlated withper capita income, regardless of market or economy size. Second, the contrastbetween the U.S. market and emerging markets is too stark to be based solely ona statistical artifact. To test these di!erences, we calculate
fjt"
max[n61jt
, n$08/jt
]
n61jt#n$08/
jt
, (1)
where n61jt
is the number of stocks in country j whose prices rise in week t andn$08/jt
is the number of stocks whose prices fall. For each country j we calculate
R. Morck et al. / Journal of Financial Economics 58 (2000) 215}260 219

fUS
!fj. The variance of the estimate is approximately
fUS
(1!fUS
)
nUS
#
fj(1!f
j)
nj
, (2)
assuming that fUS
and fj
are uncorrelated. By the Central Limit Theorem, thestatistic
( fUS
!fj)
JfUS
(1!fUS
)/nUS
#fj(1!f
j)/n
j
(3)
is approximately normal for su$ciently large sample sizes such as nUS
and nj.
The null hypothesis that the fraction of stocks moving together in the U.S. is thesame as that in the emerging markets can be rejected in 43 out of 52 weeks forChina, 37 weeks for Poland, and 45 weeks for Malaysia. In contrast, the nullhypothesis can be rejected in only 18 weeks for Denmark and New Zealand, andin only 2 weeks for Ireland.
The di!erences are economically as well as statistically signi"cant. Using theweekly data for the whole of 1995, Eq. (1) shows that 79% of the stocks in Chinamove together in an average week. The same calculation indicates that 77% ofthe stocks in Malaysia move together in an average week of 1995, as do 81% ofthe stocks in Poland. In contrast, in the United States, Denmark, and Ireland,the fraction of stocks gaining value in a given week typically barely exceeds thefraction of stocks losing value.
2.1. The United States as an Emerging Economy?
Fig. 2 plots the fraction of U.S. stocks that move together in a given month,excluding stocks whose prices do not move, over the period 1926 to 1995. In theearlier half of this period, the fraction of stocks that move together is compara-ble to the fractions for emerging markets displayed in Table 1. Fig. 2 demon-strates that price synchronicity decreased as the U.S. economy developed.
The number of stocks traded in the U.S. has increased over time, so thefraction moving together should fall towards the theoretical mean of approxim-ately 50% that would prevail were monthly returns approximately zero andindependent. Fig. 2 addresses this problem by graphing the fraction of 400stocks, randomly selected each period, that move together each month. Thesame decline remains apparent. The decline in synchronicity in U.S. stock pricesis not due to the increase in the number of traded stocks.
As a robustness check, we develop an alternative measure of stock pricesynchronicity using the linear regression
rit"a
i#b
irmt#e
it, (4)
where rit
is stock i's return in week t, and rmt
is a market index return. A highR2 in such a regression indicates a high degree of stock price synchronicity. Our
220 R. Morck et al. / Journal of Financial Economics 58 (2000) 215}260

Fig. 2. The declining synchronicity of U.S. stock prices. The fraction of stocks moving together eachmonth from 1926 to 1995 using all available U.S. stocks and using a portfolio of 400 stocksrandomly chosen each month. Returns include dividend income and are from the Center forResearch in Securities Prices.
thinking is akin to Roll (1988), who examines this regression statistic forindividual stocks in the U.S. We expand on this point when we introduce ourformal measures of stock price synchronicity, below. Fig. 3 graphs the averageR2 for Eq. (4) across stocks, based on monthly returns, for each non-overlapping5-year period from 1926 to 1995. Fig. 3 was constructed "rst using data for allavailable stocks, and then using the largest 300 stocks only. The latter is basedon rankings at the beginning of each 5-year period, and uses an equally weightedmarket index based on those stocks only. A decline in both R2s from the 1930sto the present is apparent, demonstrating again that the behavior of U.S. stockprices earlier in the twentieth century was similar to that of emerging marketstock prices now.
3. Two stock price synchronicity measures
A simple and direct measure of synchronicity in stock price movements isa formalization of the discussion surrounding Table 1. We therefore calculatethe fraction of stocks that move in the same direction in country j,
fj"
1
¹
+t
max[n61jt
, n$08/jt
]
n61jt#n$08/
jt
"
1
¹
+t
fjt. (5)
R. Morck et al. / Journal of Financial Economics 58 (2000) 215}260 221

Fig. 3. The declining fraction of U.S. stock return variation explained by the market. The fraction ofU.S. stock return variation explained by the value-weighted market index is estimated by runninga simple market model regression of using monthly returns including dividend income for sequentialdisjoint four year periods from 1926 to 1995, using all available U.S. stocks and a portfolio of 400stocks randomly chosen each period. Returns and indexes include dividend income and are from theCenter for Research in Securities Prices.
In Eq. (5), n61jt
is the number of stocks in country j whose prices rise in period t,n$08/jt
is the number of stocks whose prices fall, and T is the number of periodsused. We drop stocks whose prices do not move to avoid bias due to non-trading. Thus, we de"ne f
jas the average value of f
jt, as de"ned in Eq. (1), across
periods. Values of fj
must lie between 0.5 and 1.0.Table 2 juxtaposes the ranking of countries by per capita GDP in Panel A
with their ranking by stock price synchronicity, as measured by fj, in Panel B.
Generally, high-income countries have asynchronous stock prices, and the U.S.has the lowest fraction of stocks moving together, f
j. In contrast, low-income
economies have the highest fjs. The "ve highest f
js are for Poland, China,
Taiwan, Malaysia, and Turkey. Our calculation of fj, the fraction of stocks in
each country that move together, are based on 1995 data. Our GDP per capitavariable is averaged over 1992 to 1994 to mitigate any transitory noise. Usinga three-year average of f
jtgives similar results to those shown in Table 2.
An alternative way to distinguish "rm-speci"c stock price movements frommarket-wide price movements, following French and Roll (1986) and Roll(1988), both of whom use U.S. data only, is to calculate the R2s of regressions ofthe form
rit"a
i#b
1,irm,jt
#b2,i
[rUS,t
#ejt]#e
it, (6)
222 R. Morck et al. / Journal of Financial Economics 58 (2000) 215}260

Table 2Per capital gross domestic product and stock return synchronicity
Countries are ranked by per capita GDP in Panel A. In panel B, countries are ranked by stockreturn synchronicity, measured by the fraction of stocks moving together in the average week of1995. In panel C, countries are ranked by stock market synchronicity, measured as the average R2 of"rm-level regressions of bi-weekly stock returns on local and U.S. market indexes in each country in1995. Returns include dividends and are trimmed at $25%.
Panel A Panel B Panel C
Country
Numberof listedstocks
1995 percapita US$
GDP Country
% stocksmoving
in step (fj) Country R2
j
Japan 2276 33,190 United States 57.9 United States 0.021Denmark 264 27,174 Canada 58.3 Ireland 0.058Norway 138 25,336 France 59.2 Canada 0.062Germany 1232 24,343 Germany 61.1 U.K. 0.062United States 7241 24,343 Portugal 61.2 Australia 0.064Austria 139 23,861 Australia 61.4 New Zealand 0.064Sweden 264 23,861 U.K. 63.1 Portugal 0.068France 982 23,156 Denmark 63.1 France 0.075Belgium 283 21,590 New Zealand 64.6 Denmark 0.075Holland 100 20,952 Brazil 64.7 Austria 0.093Singapore 381 20,131 Holland 64.7 Holland 0.103Hong Kong 502 19,930 Belgium 65.0 Germany 0.114Canada 815 19,149 Ireland 65.7 Norway 0.119Finland 104 18,770 Pakistan 66.1 Indonesia 0.140Italy 312 18,770 Sweden 66.1 Sweden 0.142Australia 654 17,327 Austria 66.2 Finland 0.142U.K. 1628 17,154 Italy 66.6 Belgium 0.146Ireland 70 14,186 Norway 66.6 Hong Kong 0.150New Zealand 137 12,965 Japan 66.6 Brazil 0.161Spain 144 12,965 Chile 66.9 Philippines 0.164Taiwan 353 10,698 Spain 67.0 Korea 0.172Portugal 90 9,045 Indonesia 67.1 Pakistan 0.175Korea 461 7,555 South Africa 67.2 Italy 0.183Greece 248 7,332 Thailand 67.4 Czech 0.185Mexico 187 3,944 Hong Kong 67.8 India 0.189Chile 190 3,361 Philippines 68.8 Singapore 0.191Malaysia 362 3,328 Finland 68.9 Greece 0.192Brazil 398 3,134 Czech 69.1 Spain 0.192Czech 87 3,072 India 69.5 South Africa 0.197South Africa 93 2,864 Singapore 69.7 Columbia 0.209Turkey 188 2,618 Greece 69.7 Chile 0.209Poland 45 2,322 Korea 70.3 Japan 0.234Thailand 368 2,186 Peru 70.5 Thailand 0.271Peru 81 1,920 Mexico 71.2 Peru 0.288Columbia 48 1,510 Columbia 72.3 Mexico 0.290Philippines 171 880 Turkey 74.4 Turkey 0.393Indonesia 218 735 Malaysia 75.4 Taiwan 0.412China 323 455 Taiwan 76.3 Malaysia 0.429Pakistan 120 424 China 80.0 China 0.453India 467 302 Poland 82.9 Poland 0.569
R. Morck et al. / Journal of Financial Economics 58 (2000) 215}260 223

where i is a "rm index, j a country market index, t a two-week period time index,rm,jt
is a domestic market index, and rUS,t
is the U.S. market return. The rate ofchange in the exchange rate per U.S. dollar is e
jt.
The regression speci"ed in Eq. (6) is similar to classical asset pricing equa-tions. We do not pursue this asset pricing interpretation of Eq. (6) because weview the present paper as an application of Grossman's (1976) and Roll's (1988)approach to information capitalization, and not as a re"nement or critique ofany asset pricing model. Our emphasis is on the type of information that entersstocks prices, not on any tradeo! between risk and return.
We include the U.S. stock market return in Eq. (6) because most economiesare at least partially open to foreign capital. The expression r
US,t#e
jttranslates
U.S. stock market returns into local currency units. We use biweekly returns toovercome thin trading problems, which arise when securities are traded infre-quently. These returns are compounded from daily total returns. For stockmarkets in the Far East, we lag U.S. market returns by one day to account fortime zone di!erences. Thus, if the biweekly stock return in Japan used data fromMay 7, 1995 to May 21, 1995, the contemporaneous U.S. market return usesdata from May 6, 1995 to May 20, 1995. When we calculate Eq. (6) using U.S.data, we set b
2,ito zero.
Our daily with-dividend stock returns data begin with all companies coveredby the Datastream information service as of January 1997. Datastream alsoallowed us access to data for companies no longer traded, but whose stockprices were formerly covered by their service. Our total cross section for 1995thus contains 15,920 "rms spanning 40 countries. Newly listed or recentlydelisted stocks are included in our sample only if more than 30 weeks of data isavailable for the year in question. This requirement yields su$cient observationsto reliably assess the explanatory power of the market returns on each stock.Thus, we omit newly traded stocks that have been traded for roughly less than"ve months in a year, as well as stocks that are about to be delisted. Whentrading of a stock is suspended, the returns data during the suspension periodare coded as missing and also excluded from our regressions. In addition, formost countries, Datastream returns are either unavailable or seriously incom-plete until the mid-1990s. For this reason, we focus on 1993 through 1995, anduse only 1995 data in our international cross-sectional analysis. As a robustnesscheck, we reproduce our results using 1993 and 1994 data.
Datastream claims that its total returns are adjusted for splits and otherunusual events, but our data do contain some very large stock returns. If thesevery large returns re#ect coding errors, they could add noise to our data orcreate bias in our results. On the assumption that coding errors are over-represented in extreme observations, we trim our data by dropping biweeklyobservations for which the stock's return exceeds 0.25 in absolute value.
The regression statistic for Eq. (6), R2ij, measures the percent of the variation in
the biweekly returns of stock i in country j explained by variations in country j's
224 R. Morck et al. / Journal of Financial Economics 58 (2000) 215}260

2Although the R2j
for the U.S. stock markets is lower than that reported by Roll (1988), note thatwe use 1995 biweekly data while he uses monthly data from September 1982 to August 1987. OurR2 estimate for the US market in the early 1980s ranges between 12% and 13% (see Fig. 3), and so ismuch closer to the average R2 of 0.179 he reports.
market return and the U.S. market return. Given this statistic for each "rm i incountry j, we de"ne
R2j"
+iR2
ij]SS¹
i,j+
iSS¹
i,j
(7)
as an alternative stock price synchronicity measure, where SS¹i,j
is the sum ofsquared total variations. We use this weighting rather than a simple average tofacilitate the decomposition of returns variation in Eqs. (16) and (17) (see inSection 6). A higher R2
jindicates that stock prices frequently move together.
This measure of stock price synchronicity follows Roll (1988) and French andRoll (1986).
Panel C of Table 2 juxtaposes the ranking of countries by stock pricesynchronicity, as measured by R2
j, against their ranking by per capita GDP in
Panel A. Only four relatively wealthy countries have notably high R2s. Thesecountries are Japan, Italy, Greece, and Spain. Note that the stock market inJapan is regarded by many practitioners as notoriously bubble-prone, and thatItaly has a demonstrably poorly functioning stock market (see Zingales, 1994).With these exceptions, low-income economies account for the high R2s. The "vehighest R2
js are for Poland, China, Malaysia, Taiwan, and Turkey. The "ve
lowest R2s are for developed high-income countries } the United States, Ireland,Canada, the United Kingdom, and Australia. Overall, the R2
jestimates for
high-income countries tend to be below the median.2Fig. 4 graphically highlights the large di!erences across countries in the f
jand
R2j
measures of stock market synchronicity. Panel A of Fig. 5 plots the fjof each
country against the logarithm of its per capita GDP, illustrating a clear andstatistically signi"cant negative correlation equal to !0.571 and signi"cant atthe 0.1% level. Panel B of Fig. 5 plots each country's R2
jagainst the logarithm of
its per capita GDP, again making evident a clear and signi"cant negativecorrelation of !0.394, signi"cant at the 2% level. A closer look at Fig. 5suggests two data clusters: high-income countries with low synchronicity andlow-income countries with high synchronicity. This clustering suggests that percapita GDP might be proxying for another measure of economic developmentthat also exhibits such clustering.
In summary, the R2j
and fjmeasures of synchronicity behave similarly. Both
measures show a clearly negative relation between stock price synchronicity andper capita income, with some evidence of clustering.
R. Morck et al. / Journal of Financial Economics 58 (2000) 215}260 225

Fig. 4. Stock price synchronicity in various countries. Panel A. Stock price synchronicity measuredby the average fraction of stock prices moving in the same direction during an average week in 1995.Stock prices that do not move during a week are excluded from the average for that week. Pricemovements are adjusted for dividend payments, and are based on Datastream total returns. Panel B.Stock price synchronicity measured by the average percent of total biweekly "rm-level returnvariation in 1995 explained by local and U.S. value-weighted market indexes. Stock returns andindexes include dividend payments, and are obtained from Datastream.
226 R. Morck et al. / Journal of Financial Economics 58 (2000) 215}260

Fig. 4 (continued).
4. Empirical framework
What explains the highly signi"cant negative correlation between stock pricesynchronicity and per capita GDP? Per capita GDP is a general measure ofeconomic development. In this section, we hypothesize that particular economy
R. Morck et al. / Journal of Financial Economics 58 (2000) 215}260 227

Fig. 5. Stock price synchronicity and gross domestic product. Panel A. The logarithm of per capitagross domestic product plotted against stock return synchronicity measured by the average percentof stock returns moving in the same direction each week. Each observation is for one country. Dataare for 1995. Panel B. The logarithm of per capita gross domestic product plotted against stockreturn synchronicity measured by the percent of total return variation explained by local and U.S.value-weighted market indexes in ordinary least squares regressions. Each observation is for onecountry. Returns and indexes include dividends. Data are for 1995.
characteristics, or dimensions of economic development, might plausibly berelated to stock price synchronicity, and that per capita GDP might serve asa proxy for these characteristics. Our strategy is to see which developmentmeasures are most correlated with stock price synchronicity, and to ask whether
228 R. Morck et al. / Journal of Financial Economics 58 (2000) 215}260

they render per capita GDP insigni"cant in multivariate regressions. From thisexercise, we hope to learn what economic linkages might underlie the correla-tion between stock price synchronicity and per capita income.
4.1. Stock price synchronicity dependent variables
Our two stock price synchronicity measures, f and R2, are unsuitable asdependent variables in regressions because they are bounded within the inter-vals [0.5, 1] and [0, 1] respectively. We therefore adopt a standard econometricremedy and apply logistic transformations to these variables. Our left-hand sidevariables are thus
Wj"log A
fj!0.5
1!fjB, (8)
Bj"log A
R2j
1 ! R2jB. (9)
In Eq. (8), Wjmaps f
jfrom the interval [0.5, 1] to R, the set of real numbers
from negative to positive in"nity. Similarly, in Eq. (9), Bjmaps R2
jfrom the unit
interval to R. The construction of R2j
and fjare as described in Section 3. Both
variables are based on 1995 data, though our results are similar if we use 1993 or1994 data. Scatter plots (not shown) reveal that these transformations preservethe clustering e!ect noted above.
4.2. Controlling for stock market size
By construction, the co-movement measures, R2 and f, decrease with thenumber of securities in a country's stock market. If the sign of the stock return israndom, the Law of Large Numbers pushes f
jto approximately 0.5 as the
number of stocks grows large. That is,
E[ fjt]"EC
max[n61jt
, n$08/jt
]
n61jt#n$08/
jtD+
1
2, (10)
for a short window in which the expected return is close to zero. Also, the marketindex on the right-hand side of Eq. (6), which forms the basis for the constructionof our R2
fprice synchronicity variable, is a weighted average of the individual
stock returns used as dependent variables. This construction produces a similarspurious correlation between number of securities listed and this price syn-chronicity variable. Intuitively, in a market with few securities, each individualsecurity is a more important part of the market index. Thus, higher synchronic-ity might simply re#ect fewer traded stocks.
To control for these e!ects, we use the logarithm of the number of listed stocksin 1995 in each stock market, taken from Datastream. However, a correlation
R. Morck et al. / Journal of Financial Economics 58 (2000) 215}260 229

between synchronicity and market size may also re#ect better functioning stockmarkets having more listings. By controlling for number of listings, we may beintroducing downward bias in the signi"cance of variables that measure stockmarket quality.
4.3. Regression framework
In the following analysis, we propose hypotheses as to why certain economycharacteristics might be related to stock price synchronicity. We constructa vector x
jmeasuring these characteristics, and include it in regressions of the
form
Bjor W
j"c
0#c
1log y
j#c
2log n
j#c ) x
j#u
j, (11)
where Bjand W
jare our logistically transformed price synchronicity variables,
yjis per capita GDP, n
jis the number of listed stocks, and u
jis a random error
term. Our objective is to see which characteristics xjsigni"cantly explain stock
price synchronicity and render the logarithm of per capita GDP insigni"cant.
5. Structural explanations
In this section, we consider the hypothesis that the negative correlationbetween stock price co-movement and per capita income is due to "rms inlow-income economies having more correlated economic fundamentals. To testthis hypothesis, we include speci"c structural variables in the vector x
jthat
might provide separate proxies for such an e!ect. These variables are macroeco-nomic volatility, country size, and economy diversi"cation. Since these variablesmay not encompass all sources of market-wide price movement, we also includea direct measure of earnings co-movement for "rms in each economy usingstandardized "rm-level accounting data. If including these variables in thevector x
jrenders per capita income insigni"cant in regression (11), we can
conclude that per capita income provides a proxy for these structural e!ects.A description of each structural independent variables follows.
5.1. Macroeconomic instability
Some economies could have unstable market fundamentals because ofmacro-economic instability. In these economies, volatile market fundamentalsmay overwhelm variations due to "rm-speci"c factors, so that stock prices tendto move together. If so, our "nding of greater stock price synchronicity couldbe attributed to macro-economic instability.
To measure macroeconomic instability, we use the variance of per capitaGDP growth for each country, with per capita GDP measured in nominal U.S.
230 R. Morck et al. / Journal of Financial Economics 58 (2000) 215}260

3We are grateful to Alan Deardorf and seminar participants at the University of Arizona, theUniversity of British Columbia, George Mason University, Texas A&M University, and TulaneUniversity for stressing the need to include a `country sizea e!ect.
dollars, estimated from 1990 to 1994. We use the variance of the domesticin#ation rate across the same period as a robustness check.
5.2. Country size
Country size per se could matter in at least two ways.3 First, economicactivity in a small country could be geographically localized, so that nearbygeopolitical instability or localized environmental catastrophes such as earth-quake or monsoons might have market-wide e!ects that would not be as evidentin a larger country. For example, Finland's economy shrank by 15% in the early1990s as the neighboring Soviet Union disintegrated amid severe structuralchanges and Finland's role as a gateway to Russia temporarily lost value. HongKong's economy is similarly dependent on events in mainland China.
Second, Bernstein and Weinstein (1998) observe the economic specializationpredicted by standard international trade theory across geographical units ofsimilar size, but not across countries. This "nding is consistent with largercountries having factor endowments that exhibit less uniformity, and thisrelation in turn suggests that the stocks of "rms in large countries might movemore independently than those in small countries. For example, if oil prices fall,the prospects of Ohio manufacturing "rms brighten, while those of Texas oilcompanies dim, resulting in observable asynchronous stock price movements inthe U.S. markets. In contrast, stocks in a smaller oil-producing country, likeVenezuela, might move more synchronously as oil prices change, given thata larger position of Venezuelan economic activity is devoted to providing goodsand services for oil companies and their employees. Similar stories might be toldabout the dependence of smaller countries on particular agricultural crops,mining operations, or industries.
To capture any relation between country size and synchronicity in stockreturns, we use the logarithm of geographical size, in square kilometers, for eachcountry. We use the logarithm of population in a robustness check.
5.3. Economic and managerial diversixcation
The second point above is closely related to economic specialization. In someeconomies, listed "rms could be concentrated in a few industries. Consequently,the fundamentals of these "rms could be highly correlated, and their stock priceshighly synchronous. Undiversi"ed economies should therefore exhibit morestock price synchronicity than diversi"ed ones. If poor countries are relativelyundiversi"ed, this characteristic might explain our "nding.
R. Morck et al. / Journal of Financial Economics 58 (2000) 215}260 231

Alternatively, some economies may be dominated by a few very large "rms. Ifmost other listed "rms are suppliers or customers of these dominant "rms,a high degree of stock price synchronicity might ensue. Problems that would be"rm-speci"c in a larger economy, such as leadership succession within a control-ling family, can potentially a!ect the entire economy. If economies of poorcountries depend disproportionately on a few large "rms, our "nding couldfollow.
To capture these e!ects, we construct an industry Her"ndahl index and a "rmHer"ndahl index for each country. We de"ne the industry Her"ndahl index ofcountry j as H
j"+
kh2k,j
where hk,j
is the combined value of the sales of allcountry j "rms in industry k as a percentage of those of all country j "rms.Analogously, we de"ne the "rm Her"ndahl index of country j to be HK
j"+
ihK 2i|j
where hKi,j
is the sales of "rm i as a percentage of the total sales of all countryj "rms. These indices are constructed using 1995 data and industry classi"ca-tions from Datastream. The latter classi"cations are roughly equivalent to using2-digit Standard Industrial Classi"cation (SIC) codes to de"ne industry catego-ries. High values of the industry and "rm Her"ndahl indexes indicate respect-ively, a lack of industry diversity and the dominance of a few large "rms. Roll(1992) "nds that high industry or high "rm concentration, as captured by suchHer"ndahl indices, partly explains the high volatility of some stock marketindices.
5.4. Synchronous fundamentals
Firm fundamentals might move together more in low-income countries forthe above reasons, or for other reasons. For example, if highly diversi"edconglomerates account for a larger fraction of listed "rms, their returns shouldall resemble the market return. Widespread intercorporate ownership mightalso cause "rm fundamentals to move together, as intercorporate ownershipimplicitly causes the performance of some "rms to depend on that of other "rms.This e!ect is exacerbated if related "rms use intercorporate transactions to assisteach other in bad times or to share the bounty in good times. All suchexplanations posit a greater correlation across "rms in economic fundamentals.A general measure of co-movement of "rm fundamentals can therefore act asa comprehensive structural independent variable, capturing all of these variousexplanations.
To capture the general synchronicity of "rm-level fundamentals, we constructan earnings co-movement index by running the regression
ROAi,j,
"ai#b
i]ROA
m,j, (12)
for each "rm i in each country j. ROAi,j
is a "rm's returns on assets, calculated asannual after-tax pro"t plus depreciation over total assets. ROA
m,jis the value-
weighted average of the return on assets for all "rms in the country.
232 R. Morck et al. / Journal of Financial Economics 58 (2000) 215}260
Our "rm-level earnings data contain isolated irregularities, appearing assingle spikes in the data. These irregularities generally re#ect extraordinaryitems in the calculation of "rm earnings, and are treated as statistical noise forour purposes. To mitigate these data problems, we exclude ROA
i,jin period t if
(ROAi,j,t
!ROAi,j,t~1
) and (ROAi,j,t
!ROAi,j,t`1
) are opposite in sign and areboth greater than 0.75 in absolute value.
Firm level accounting data are sparse for some countries, and completelyunavailable in a few, especially prior to the mid-1990s. Using more years of dataarguably allows better regression estimates, but also worsens the problem ofobtaining comparable data for a statistically meaningful number of countries.We use "ve years of data from 1993 to 1997. Due to missing data, we can runsuch "rm-level ROA regressions in only 24 countries. These countries areAustralia, Austria, Belgium, Brazil, Chile, Denmark, Finland, France, Germany,Greece, Holland, India, Italy, Japan, Korea, Mexico, Norway, Portugal, Spain,Sweden, Taiwan, Turkey, the United Kingdom and the U.S. For three of thesecountries, Austria, Chile, and Taiwan, earnings data are available for very few"rms. Dropping these three countries does not qualitatively a!ect our basic"ndings. To mitigate problems associated with the loss in sample size,we conduct our empirical investigation both with and without the earningsco-movement index.
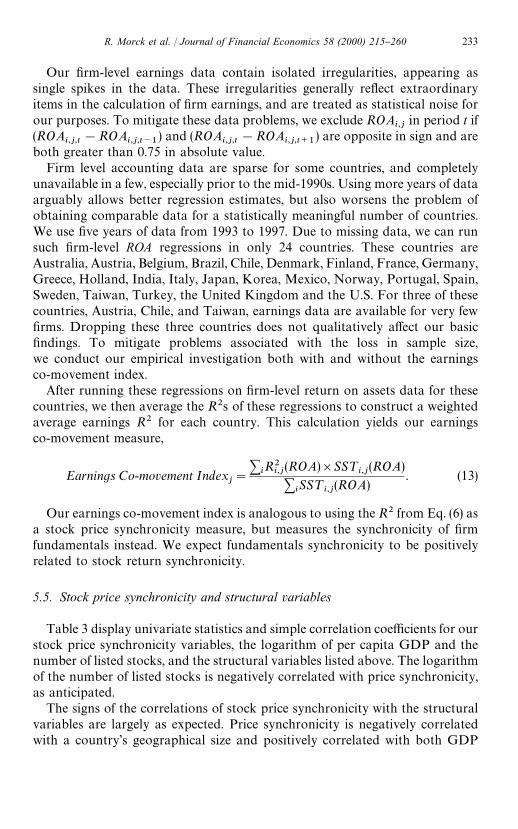
After running these regressions on "rm-level return on assets data for thesecountries, we then average the R2s of these regressions to construct a weightedaverage earnings R2 for each country. This calculation yields our earningsco-movement measure,
Earnings Co-movement Indexj"
+iR2
i,j(ROA)]SS¹
i,j(ROA)
+iSS¹
i,j(ROA)
. (13)
Our earnings co-movement index is analogous to using the R2 from Eq. (6) asa stock price synchronicity measure, but measures the synchronicity of "rmfundamentals instead. We expect fundamentals synchronicity to be positivelyrelated to stock return synchronicity.
5.5. Stock price synchronicity and structural variables
Table 3 display univariate statistics and simple correlation coe$cients for ourstock price synchronicity variables, the logarithm of per capita GDP and thenumber of listed stocks, and the structural variables listed above. The logarithmof the number of listed stocks is negatively correlated with price synchronicity,as anticipated.
The signs of the correlations of stock price synchronicity with the structuralvariables are largely as expected. Price synchronicity is negatively correlatedwith a country's geographical size and positively correlated with both GDP
R. Morck et al. / Journal of Financial Economics 58 (2000) 215}260 233

Tab
le3
Des
crip
tion
ofm
ain
variab
les
Univ
aria
test
atistics
and
sim
ple
corr
elat
ion
coe$
cien
tsbe
twee
nm
ain
variab
les.
Sam
pleis
37co
untr
ies,
exce
ptfo
rth
eac
coun
ting
stan
dar
dsin
dex,
whi
chis
avai
lable
for34
coun
trie
san
dth
eea
rnin
gsco
-move
men
tin
dex
,whi
chis
avai
labl
efo
ronl
y25
coun
ties
.Num
ber
sin
pare
nth
esis
are
pro
babi
lity
leve
lsat
whic
hth
enull
hyp
oth
esis
ofze
roco
rrel
atio
nca
nbe
reje
cted
intw
o-t
aile
dte
sts.
Pan
elA
.Uni
vari
ate
stat
isti
csan
dsi
mpl
eco
rrel
atio
nco
ezci
ents
betw
een
stoc
kpr
ice
sync
hron
icit
yin
dice
s,st
ock
retu
rnva
rian
cede
com
posi
tion
vari
able
slo
g(p2 e)
and
log(
p2 m),
and
stru
ctur
alan
din
stit
utio
nalva
riab
les.
Sim
ple
corr
elat
ion
with
Var
iabl
esM
ean
Stan
dar
dde
viat
ion
Min
imum
Max
imum
Wi
Bj
log(
p2 e)lo
g(p2 m
)
Stock
co-m
ovem
ent
indic
esA
vera
gefrac
tion
of
stoc
ks
movi
ngth
esa
me
dire
ctio
n(f j)
0.65
90.
052
0.57
00.
772
0.99
30.
900
0.16
20.
855
(0.0
0)(0
.00)
(0.3
4)(0
.01)
Rsq
uare
ofm
arket
mode
lba
sed
onw
eekl
yda
tafo
rco
unt
ryj
0.16
90.
099
0.02
00.
429
0.88
80.
949
0.14
60.
891
(0.0
0)(0
.00)
(0.3
9)(0
.00)
Logi
stic
tran
sform
atio
nof
f jfo
rco
unt
ryj(W
j)!
0.80
80.
501
!1.
840.
180
*
Logi
stic
tran
sfor
mat
ion
ofR
2fo
rco
unt
ryj(B
j)!
1.76
0.75
8!
3.84
!0.
284
0.90
9*
(0.0
0)
Loga
rith
mof"rm
-spe
ci"c
variat
ion
(log(
p2 e))!
2.30
0.36
0!
3.05
!1.
520.
115
0.07
3*
(0.5
0)(0
.67)
Loga
rith
mofm
arke
t-w
ide
variat
ion
(log
(p2 m))
!3.
970.
930
!5.
60!
1.86
0.84
30.
904
0.44
9*
(0.0
0)(0
.00)
(0.0
0)
234 R. Morck et al. / Journal of Financial Economics 58 (2000) 215}260

Loga
rith
mofper
capi
taG
DP
8.94
1.30
5.71
10.4
!0.
512
!0.
457
!0.
406
!0.
573
(0.0
0)(0
.00)
(0.0
1)(0
.00)
Loga
rith
mofnum
ber
liste
dst
ock
s5.
611.
063.
818.
89!
0.38
1!
0.30
70.
200
!0.
183
(0.0
2)(0
.06)
(0.2
3)(0
.28)
Stru
ctur
alva
riab
les
Loga
rith
mofge
ogr
aphic
alsize
12.7
2.11
6.46
16.1
!0.
160
!0.
0105
0.37
20.
084
(0.3
4)(0
.54)
(0.0
2)(0
.62)
Var
ianc
ein
GD
Pgr
ow
th0.
0001
0.00
020.
0007
0.00
10.
0703
0.09
99!
0.19
00.
010
(0.6
8)(0
.56)
(0.2
6)(0
.97)
Indus
try
Her"nd
ahlin
dex
0.11
30.
0559
0.03
00.
281
0.01
16!
0.03
5!
0.01
75!
0.02
0(0
.94)
(0.8
4)(0
.28)
(0.0
0)
Firm
Her"nd
ahlin
dex
0.04
820.
0505
0.00
010.
219
!0.
001
!0.
126
!0.
142
!0.
148
(0.9
9)(0
.46)
(0.3
8)(0
.36)
Ear
nings
co-m
ove
men
tin
dex
0.38
30.
164
0.05
50.
777
0.05
550.
201
0.10
00.
250
(0.8
0)(0
.35)
(0.6
3)(0
.23)
Inst
itutiona
lva
riab
les
Good
gove
rnm
ent
index
23.9
4.98
12.9
29.6
!0.
552
!0.
527
0.47
70.
664
(0.0
0)(0
.00)
(0.0
0)(0
.00)
Acc
ounting
stan
dar
ds
index
63.7
10.9
0.36
83!
0.23
7!
0.23
0!
0.03
4!
0.21
8(0
.18)
(0.1
9)(0
.85)
(0.2
2)
Anti-d
irec
tor
righ
tsin
dex
1.78
1.93
05
!0.
586
!0.
595
0.27
1!
0.07
7(0
.00)
(0.0
0)(0
.10)
(0.6
5)
R. Morck et al. / Journal of Financial Economics 58 (2000) 215}260 235

Tab
le3
(con
tinu
ed)
Pan
elB
.Si
mpl
eco
rrel
atio
nco
ezci
ents
ofst
ruct
ural
and
inst
itut
iona
lva
riab
les
wit
hea
chot
her
ab
cd
ef
gh
i
a.Log
arithm
ofper
capi
taG
DP
*
b.Loga
rith
mofnum
ber
ofst
ocks
liste
d0.
364
*
(0.0
3)
Stru
ctur
alva
riab
les
c.Log
arithm
ofge
ogra
phic
alsize
!0.
371
0.11
1*
(0.0
2)(0
.51)
d.V
aria
nce
inG
DP
grow
th!
0.02
0!
0.19
60.
010
*
(0.9
1)(0
.24)
(0.9
7)
e.In
dust
ryH
er"nda
hlin
dex
0.02
5!
0.67
4!
0.21
40.
115
*
(0.8
8)(0
.00)
(0.2
0)(0
.97)
f.Firm
Her"nd
ahlin
dex
!0.
020
!0.
573
!0.
040
0.09
10.
710
*
(0.9
1)(0
.00)
(0.8
2)(0
.59)
(0.0
0)
g.Ear
nin
gsC
o-m
ovem
ent
index
!0.
030.
105
0.10
9!
0.10
0!
0.16
8!
0.32
5*
(0.8
8)(0
.63)
(0.6
1)(0
.64)
(0.4
3)(0
.12)
Inst
itutiona
lva
riab
les
h.G
ood
gove
rnm
entIn
dex
0.91
90.
335
!0.
298
!0.
010
!0.
040
0.01
1!
0.12
6*
(0.0
0)(0
.04)
(0.0
7)(0
.96)
(0.8
2)(0
.95)
(0.5
6)
i.A
nti-d
irec
tor
righ
ts0.
706
0.40
3!
0.25
9!
0.29
2!
0.06
0!
0.07
0!
0.10
80.
729
*
(0.0
0)(0
.01)
(0.1
2)(0
.08)
(0.7
3)(0
.65)
(0.6
1)(0
.00)
j.A
ccoun
ting
stan
dard
sin
dex
0.44
20.
427
!0.
090
!0.
265
!0.
552
!0.
267
0.03
50.
554
0.53
1(0
.01)
(0.0
1)(0
.60)
(0.1
3)(0
.00)
(0.1
3)(0
.87)
(0.0
0)(0
.00)
236 R. Morck et al. / Journal of Financial Economics 58 (2000) 215}260

growth variance and earnings co-movement, although these correlations are allstatistically insigni"cant. More diversi"cation is not consistently correlated withless stock price synchronicity. Overall, these correlations suggest that no onestructural variable is likely to explain the link between per capita GDP andstock price synchronicity.
Panel B of Table 3 also shows that per capita GDP is signi"cantly negativelycorrelated with a country's geographical size, and essentially uncorrelated withdiversi"cation. Clearly, our basic result cannot be due to low-income countriesbeing small and undiversi"ed.
Table 4 displays multivariate regressions of the form of regression (11), to seeif the structural variables, acting in concert, might explain the link between percapita GDP and stock price synchronicity. First, note that a small country e!ectappears in this multivariate setting. Stock prices do move together more insmaller countries. However, this e!ect does not explain the correlation betweenprice synchronicity and per capita GDP, as that variable remains highly signi"-cant. This result suggests that per capita GDP does not serve as a proxy for ourstructural variables, taken either separately or all together, and that factorsbeyond our structural explanations underlie the negative relation between percapita GDP and stock price synchronicity.
5.6. Robustness checks
Some clari"cations are in order. First, we can never categorically reject thestructural hypothesis using regressions like the alternative speci"cations de"nedabove. Additional structural variables can always be found, and some combina-tion of these variables may explain price synchronicity, rendering per capitaGDP insigni"cant. Second, our structural variables may be noisy. Third, earn-ings co-movement is not necessarily successful in capturing the co-movement offundamentals, as stock prices are thought to be based on expected future cash#ow, not current earnings. The relation of price fundamentals to variables basedon accounting numbers, as well as to historical macroeconomic variables, can becomplicated.
Since we run country-level cross-sectional regressions, our sample size islimited. As we add variables to our model, the available degrees of freedom areexhausted quickly. Our robustness tests therefore consist of statistical "t tests,replacing structural variables with alternatives or adding only a small number ofadditional variables at a time.
5.6.1. OutliersOur regression results are not driven by outliers. We conduct diagnostic
checks on the residuals obtained in Table 4. We "nd no outliers using StudentR and Cook's D measures.
R. Morck et al. / Journal of Financial Economics 58 (2000) 215}260 237

Table 4Regressions of stock price synchronicity on economy structural variables
Estimated coe$cients from ordinary least squares regressions of stock price synchronicity variables,B
jand W
j, on the logarithm of per capita GDP and structural variables. A control for market size,
log(number of stocks), is included in all regressions.The structural variables are log(geographicalsize), variance of GDP growth, industry Her"ndahl index, and the "rm Her"ndahl index. Regres-sions 4.2 and 4.4 include, as an additional structural variable, the earnings co-movement index.Sample is 37 countries, except for regressions on the earnings co-movement index, which is availablefor only 25 counties. Numbers in parenthesis are probability levels at which the null hypothesis ofzero correlation can be rejected in two-tailed t-tests.
Dependent variable
Wjis a logistic transformation of
the average fraction of stocksmoving together
Bj
is a logistic transformationof the R2
js of regressions of
stock returns on market indices
4.1 4.2 4.3 4.4
Intercept 4.36 8.11 4.66 8.04(0.00) (0.00) (0.04) (0.04)
Logarithm of per capitaGDP
!0.189 !0.288 !0.238 !0.324(0.01) (0.01) (0.04) (0.04)
Logarithm of number ofstocks listed
!0.180 !0.200 !0.270 !0.367(0.11) (0.14) (0.13) (0.09)
Logarithm ofgeographical size
!0.867 !1.89 !0.948 !1.78(0.04) (0.02) (0.16) (0.15)
Variance in GDP growth 68.6 !253 228 !106(0.84) (0.48) (0.67) (0.85)
Industry Her"ndahlindex
!2.37 !4.30 !2.08 !5.70(0.27) (0.09) (0.54) (0.15)
Firm Her"ndahl index !0.446 1.49 !3.71 1.04(0.83) (0.55) (0.26) (0.80)
Earning co-movementindex
* 0.375 * 1.09(0.49) (0.22)
F statistic for theregression
3.88 3.51 2.87 2.50(0.01) (0.02) (0.03) (0.06)
Sample size 37 25 37 25R2 0.44 0.59 0.36 0.51
238 R. Morck et al. / Journal of Financial Economics 58 (2000) 215}260

5.6.2. Time period ewectsOne way to check whether our results are due to transitory time e!ects is to
repeat our regressions using data taken from other years. We can only repeat theregressions using 1993 and 1994 data because of missing data problems inDatastream for earlier years. We obtain identical conclusions using the twoearlier years.
The major transitory event in 1995 was the aftermath of the depreciation ofthe Mexican Peso. This major macroeconomic event could have driven up thesynchronicity of stock prices in Latin American countries. We repeated ourregressions dropping all Latin American countries in our sample. Our resultsare not qualitatively a!ected.
5.6.3. Alternate stock return synchronicity measuresOur stock return synchronicity indexes are necessarily arbitrary. However,
our stock price synchronicity measures, both Bj
and Wj, give qualitatively
similar results, despite substantial di!erences in their construction. In estimatingR2
jstatistics for stock return regressions, we incorporate the possibility that
stock prices in other economies are in#uenced by the U.S. market. If some stockmarkets are isolated, adding the U.S. market return should not a!ect theirR2
jregression statistics. The R2
jstatistic for the U.S. is constructed without
allowing for the in#uence of foreign markets on U.S. stock prices. This construc-tion could create a downward bias in the estimated U.S. R2. However, ourresults are qualitatively unchanged if we drop the U.S. from our sample.
As further robustness checks, we consider several alternative measures ofstock return synchronicity. The "rst is the average simple correlation acrosspairs of stocks,
1
2(n!1)2n+i/1
+kEi
oik.
The second is the average squared simple correlation,
1
2(n!1)2n+i/1
+kEi
o2ik.
The number of pair-wise combinations rises with the square of the number oflisted stocks, n. Computation becomes di$cult for n'150. We therefore ran-domly choose 50 stocks from each country and calculate the average of the2,450, or n2!n, resulting pair-wise simple correlation coe$cients. Anotheralternative measure is the fraction of pairs in which the average simple correla-tion coe$cient is above a certain threshold, as given by
1
2(n!1)2n+i/1
+kEi
dik, (14)
R. Morck et al. / Journal of Financial Economics 58 (2000) 215}260 239

where dik
is one if oikis above o( , and is zero otherwise. We consider o( equal to
50%, 40%, 30%, and 20%.All of these alternative synchronicity measures generate qualitatively similar
results to the measures used in the text, but at generally lower levels of statisticalsigni"cance. Average correlation coe$cients generate less signi"cant resultsthan both average squared correlation coe$cients and the fraction of correla-tions above threshold values of o( . For the last calculation, a 50% cuto!generates results with statistical signi"cance similar to the reported results.
5.6.4. Alternative methods of controlling for market size ewectsBy construction, the synchronicity indices are a!ected by the number of
stocks in a market. We control for this market size e!ect by explicitly introduc-ing the logarithm of the number of listed stocks as an independent variable.Another way to overcome this e!ect is to constrain the number of stocks we useto construct our synchronicity indices. The alternative synchronicity measuresdiscussed in the previous section are based on 50 stocks from each country, andso are una!ected by such problems. Yet they generate qualitatively similarresults to those shown. We can also reproduce our results using a restrictednumber of stocks in each country to construct our stock price synchronicityvariables, B
jand W
j. The median number of listings in the stock markets in our
sample is 300. For countries with fewer than 300 stocks, we use all stocks toconstruct the information content measures. For countries with more than 300stocks, we randomly select 300 stocks. We then re-estimate the test shown inTable 4 twenty times, using 300 di!erent randomly drawn "rms each time andindexes based only on those "rms. In every run, the results are qualitativelyidentical to those reported.
5.6.5. Unstable monetary policiesIf the stock markets in low-income countries are volatile because of swings in
monetary policy, the variance in the in#ation rate might be a better variablethan the variance of GDP growth for explaining stock price synchronicity. Thisvariable, like GDP growth variance, enters our equation with the predicted sign,but is even more insigni"cant than the variable it replaces.
5.6.6. Alternative measure of country sizeIn Table 4, we measure country size by the logarithm of the area of each
country in square kilometers. This metric makes sense if extreme weather orother localized natural phenomena cause synchronicity in stock prices. How-ever, geographical area is only one measure of country size, and population is anobvious alternative country size metric. Substituting the logarithm of popula-tion does not change our "ndings.
240 R. Morck et al. / Journal of Financial Economics 58 (2000) 215}260

5.6.7. Commodity-based economiesIf poor countries are disproportionately dependent on raw materials produc-
tion, and these industries are more pro-cyclical than others, our basic "ndingmight follow. Including a dummy variable which equals one if raw materials arethe country's most important sector, and zero otherwise, also changes nothing inour reported results. This structural hypothesis is also apparently not respon-sible for our basic "nding.
Because our focus is on the stock market data, our sample excludes very smalland very poor countries, as such countries generally have no stock markets. Wethus are neither proving nor disproving the idea that dependence on undiversi-"ed raw materials production might cause economy-wide #uctuations in sucheconomies.
5.6.8. Alternative measures of fundamentals co-movementOur earnings co-movement variable could be a noisy measure of funda-
mentals comovement. Using many years of historical data makes the variabletoo dependent on the past, which is likely inappropriate for fast-changingeconomies. On the other hand, using too few years of data makes it di$cult toestimate the variable precisely. The earnings co-movement measure is estimatedusing "ve years of annual data. We experimented with six and seven years ofdata instead. Both alternatives generate qualitatively similar results to thosereported. We use ROA market indices that are weighted by asset values. Usingequally weighted indices also leads to similar "ndings. Applying a logistictransformation also generates qualitatively similar results.
As another measure of disparity in "rm fundamentals, we use the cross-sectional variance of "rm ROA in each country. We average these cross-sectional variances over 1992, 1993, and 1994. Using this variable does notchange our results.
In conclusion, after treating an exhaustive list of robustness concerns, we "ndthat our results remain intact.
6. An institutional development explanation
In the previous section, we showed that including structural variables in thevector x
jdoes not render per capita income insigni"cant in the regression in
Eq. (11), and argued that per capita income is not proxying for structural e!ects.In this section, we consider a second general hypothesis, that the negativecorrelation between stock price co-movement and per capita income isdue to low-income economies providing poor protection of private propertyrights.
We construct a &&good government index'' to measure how well country jprotects private property rights. We denote this index g
j, and include it in
R. Morck et al. / Journal of Financial Economics 58 (2000) 215}260 241

regressions of the form
Bjor W
j"c
0#c
1logy
j#c
2logn
j#c ) x
j#c
3gj#u
j, (15)
where Bjand W
jare our logistically transformed price synchronicity variables,
yjis per capita GDP, n
jis the number of listed stocks, x
jis a vector of economy
structural characteristics, and ujis a random error term. If the good government
index is signi"cant, and including it renders per capita GDP insigni"cant, wehave evidence that a lack of property rights protection underlies the high degreeof stock price synchronicity.
6.1. Why property rights protection might awect stock price movements
In many countries, governments and courts are mercantilist devices fordiverting wealth to an entrenched elite. Politicians can `shut down [a] business,kick it out of its premises, or even refuse to allow it to starta (Shleifer, 1994) byusing a variety of tactics including open legislation, licensing requirements,repudiation of commitments, and nationalization. Asset values are predomi-nantly a!ected by political connections and events. For example, based onstock price movements in response to rumors about President Suharto'shealth Fisman (1999) estimates that as much as 25% of the market valueof many Indonesian "rms is related to political connections. In such countries,political events, or even rumors about political events, could cause largemarket-wide stock price swings and generate high levels of stock pricesynchronicity.
Thus, stock price synchronicity might re#ect higher political risk. However, itis important to recall that stock price synchronicity is not explained above bymacroeconomic volatility or synchronous economic fundamentals.
If our structural variables are adequate, political risk must a!ect share pricesthrough some other channel. Admittedly, our structural measures could be#awed. For example, investors might expect systematic #uctuations in futurefundamentals to arise from current political events. Such politically sensitivegrowth options in low-income countries might explain how their highly syn-chronous stock returns can be unrelated to synchronicity in past earnings. Weinvite further work to explore these possibilities.
However, bad government might increase stock price synchronicity throughchannels that are not directly associated with economic fundamentals. Financetheory posits that risk arbitrageurs expend resources uncovering proprietaryinformation about stocks and earn an acceptable return by using that informa-tion to trade against less informed investors. Risk arbitrageurs accumulateinformation until the marginal cost of gathering an additional unit of informa-tion exceeds its risk-adjusted marginal return. Such trading by many riskarbitrageurs, each with unique proprietary information, is thought to capitalizeinformation into share prices (Grossman, 1976; Shleifer and Vishny, 1997). Risk
242 R. Morck et al. / Journal of Financial Economics 58 (2000) 215}260

arbitrage, of this sort may be less economically attractive in countries thatprotect private property rights more poorly for several reasons.
First, economic fundamentals may be obscured by political factors in manylow-income countries. Second, political events may be hard to forecast inlow-income countries, whose governments are often relatively opaque anderratic. Third, risk arbitrageurs who do make correct predictions may not beallowed to keep their earnings in countries that protect private property rightspoorly, especially if the risk arbitrageurs are political outsiders. Because of thesefactors, "rm-speci"c risk arbitrage could be relatively unattractive in countriesthat protect private property rights poorly, and informed trading correspond-ingly thin.
If weak property rights discourage informed risk arbitrage, they might alsocreate systematic stock price #uctuations. De Long et al. (1990) argue thatinsu$cient informed trading can `create spacea for noise trading. Indeed, whatDe Long et al. (1990) call a `create spacea e!ect is central to their model ofsystematic noise trader risk. They de"ne this e!ect as follows: `As the variabilityof noise traders' beliefs increases, the price of risk increases. To take advantageof noise traders' misperceptions, sophisticated investors must bear this greaterrisk. Since sophisticated investors are risk averse, they reduce the extent towhich they bet against noise traders in response to this increased risk.a (De Longet al., 1990, p. 715). If the proportion of noise traders in the market is abovea critical level, this e!ect causes noise trading to grow in importance relative toinformed trading, and eventually `dominate the marketa (De Long et al., 1990, 720).
Thus, De Long et al. (1989, 1990) argue that stock markets without a su$cientamount of informed trading could be characterized by large systematic priceswings due to noise trading. If the governments of low-income countries do notrespect property rights and thereby discourage informed trading in their stockmarkets, share prices in those markets should exhibit intensi"ed market-widevariation and high synchronicity.
6.2. Measuring good government
To capture the extent to which a country's politicians respect private propertyrights, we construct a good government index as the sum of three indexes fromLa Porta et al. (1998b), each ranging from zero to ten. These indexes measure (i)government corruption, (ii) the risk of expropriation of private property by thegovernment, and (iii) the risk of the government repudiating contracts. Lowvalues for each index indicate less respect for private property.
La Porta et al. (1998b) describe these three indexes as follows: The `corrup-tion indexa is an assessment of corruption in government by the InternationalCountry Risk Guide (ICR). Low scores of this index indicate that `high govern-ment o$cials are likely to demand special paymentsa and that `illegal paymentsare generally expected throughout lower levels of governmenta in the form of
R. Morck et al. / Journal of Financial Economics 58 (2000) 215}260 243

`bribes connected with import and export licences, exchange controls, taxassessment, policy protection, or loans.a The `risk of expropriation indexa is theICR's assessment of the risk of `outright con"scationa or `forced nationaliza-tion.a The `repudiation of contracts by government indexa is ICR's assessmentof the risk of a `modi"cation in a contract taking the form of a repudiation,postponement, or scaling downa due to `budget cutbacks, indigenization pres-sure, a change in government, or a change in government economic and socialpriorities.a All three ICR indexes are averages of the monthly indexes for Apriland October from 1982 to 1995. The good government index, like our syn-chronicity measures, tends to be quite high for developed countries and quitelow for emerging economies.
6.3. The relation of stock price synchronicity to good government
The good government index is available for all countries except China, theCzech Republic, and Poland. Table 3 reports univariate statistics for our goodgovernment index, as well as its simple correlations with the stock price syn-chronicity indices, B
jand W
j, per capita income, market size, and the structural
variables.The pattern of the simple correlation coe$cients in Panel A of Table 3 is
consistent with the view that better protection of private property rights reducesstock price synchronicity. In addition, Panel B shows that countries with higherper capita income have higher good government indices. It also shows that thegood government index is signi"cantly correlated with market size, measured asthe logarithm of the number of stock in the country's stock market, a "ndingthat is consistent with more institutionally advanced economies having marketson which more stocks trade. This result con"rms our premise that includingmarket size as a control variable biases our tests against "nding that institu-tional development matters.
The regressions in Table 5 show that the good government index remainssigni"cantly negatively correlated with stock price synchronicity after control-ling for market size and the structural variables. More important, the logarithmof per capita GDP becomes insigni"cant in regressions containing the goodgovernment index.
In summary, our results in this section are consistent with the view thata greater respect for private property rights by governments in developedeconomies underlies our "nding that stock prices in high-income countries areless synchronous than in low-income countries.
6.4. More market-wide variation or less xrm-specixc variation?
Our stock return synchronicity measure Bjcan be decomposed into market
wide variation and "rm speci"c variation.Bjis the logistic transformation of the
244 R. Morck et al. / Journal of Financial Economics 58 (2000) 215}260

Table 5Regressions of stock price synchronicity on economy structural variables and a good governmentindex
Estimated coe$cients from ordinary least squares regressions of stock price synchronicity variables,B
jand W
j, on the logarithm of per capita GDP, structural variables and a good government index.
A control for market size, log(number of stocks), is included in all regressions. The structuralvariables are log(geographical size), variance of GDP growth, industry Her"ndahl index, and the"rm Her"ndahl index. Regressions 5.2 and 5.4 include, as an additional structural variable, theearnings co-movement index. Sample is 37 countries, except for regressions on the earningsco-movement index, which is available for only 25 countries. Numbers in parenthesis are probabilitylevels at which the null hypothesis of zero correlation can be rejected in two-tailed t-tests.
Dependent variable
Wj
and is a logistictransformation of the average
fraction of stocks movingtogether
Bj, is a logistic
transformation of theR2
js of regressions of stock
returns on market indices
5.1 5.2 5.3 5.4
log(GDP per capita) 0.033 0.025 0.170 0.188(0.83) (0.87) (0.48) (0.46)
Logarithm of number ofstocks listed
!0.204 !0.197 !0.315 !0.331(0.06) (0.10) (0.07) (0.07)
Good government index !0.059 !0.098 !0.110 !0.161(0.11) (0.03) (0.07) (0.03)
Strucrual variablesLog. of geographical size !0.811 !1.98 !0.846 !1.92
(0.05) (0.01) (0.19) (0.09)
Variance in GDP growth 72.1 !216 235 !47.2(0.82) (0.49) (0.65) (0.93)
Industry Her"ndahl index !3.44! !4.97 !4.07 !6.79(0.12) (0.03) (0.24) (0.06)
Firm Her"ndahl index 0.282 1.83 !2.38 1.59(0.89) (0.41) (0.46) (0.65)
Earning comovement index * 0.117 * 0.671(0.81) (0.40)
} } } } } } } } } } } } } } } } } } } } } } } } } } } } } } } } } } } } } } } } } } } } } } } } } }
F-test for the structuralvariables
1.91 2.93 1.67 1.78(0.14) (0.05) (0.19) (0.17)
F statistics for the regression 3.89 4.63 3.19 3.55(0.00) (0.00) (0.02) (0.01)
Sample size 37 25 37 25R2 0.48 0.70 0.44 0.64
R. Morck et al. / Journal of Financial Economics 58 (2000) 215}260 245

R2j
in Eq. (7), which can be written as
R2j"
+i|j
R2i,j
SS¹i,j
+i|j
SS¹i,j
"
+i|j
p2m,i,j
p2e,i,j#p2m,i,j
(p2m,i,j
#p2e,i,j )
+ioj
(p2m,i,j
#p2e,i,j), (16)
where p2m,i,j
is the variation in the return of "rm i in country j explained bymarket factors and p2e,i,j is the residual variation in "rm i's return. SubstitutingEq. (16) into the de"nition of B
jyields
Bj"logA
p2m,j
p2e,j B"log(pm,j
)!log(pe,j ), (17)
where the average variation in country j stock returns that is explained bymarket factors is p2
mj"(1/n)+
ipi,j,m
, and p2ej"(1/n)+ip2i,j,e , is the average "rm-
speci"c variation in country j stock returns.If noise trader risk makes stock prices more synchronous in countries with
weak private property rights, we should "nd Bj
to be high in those countriesbecause of high market-wide stock price variation, p2
m,j. If higher synchronicity
in emerging markets is due to less "rm-speci"c variation, p2e,j , other explanationsmust be sought.
Fig. 6 explores this issue by displaying the average "rm-speci"c variation, p2e ,and market-wide variation, p2
m, in U.S. stock returns from 1926 to 1995. Each
bar represents a 3-year average. The decreases in R2s in the post-war periodappear to be associated with both the capitalization of more "rm-speci"cinformation into stock prices and with a decline in the in#uence of market-widefactors. Campbell et al. (2000) replicate this result and elaborate on its statisticalproperties.
Since a high R2 can re#ect low levels of "rm-speci"c variation, p2e,j , or highlevels of market-wide variation, p2
m,j, or both, it is useful to relate these measures.
Table 6 reveals p2e,j to be greater than p2m,j
in all countries except Poland.Fig. 7 shows that the greater synchronicity exhibited across countries isassociated with greater systematic stock return variation, p2
m,j, and with no
clear pattern of higher or lower "rm-speci"c return variation, p2e,j . In contrast,Table 6 shows lower synchronicity within developed economies associated withlower p2e,j , and with p2
m,jat a relatively uniform low level.
Panel A of Table 3 shows the simple correlations of log(p2e,j) and log(p2m,j
) withour other country-level cross-section variables. Stock price synchronicity ispositively correlated with high market risk, but not with low "rm-speci"c risk.Both per capita GDP and the good government index are negatively correlatedwith log(p2e,j ) and log(p2
m,j) and, in both cases, the correlations with systematic
risk are stronger and more signi"cant.To test the hypothesis that increased synchronicity is primarily due
to increased market-wide price variation, Table 7 considers regressions
246 R. Morck et al. / Journal of Financial Economics 58 (2000) 215}260

Fig. 6. The changing structure of U.S. stock return variation from 1926 to 1995 Total returnsvariation is decomposed into a systematic component, which is related to the value-weighted marketindex, and a "rm-speci"c component, which is not. Each bar represents an estimate over a three yearperiod based on monthly dividend-adjusted returns. Returns and indexes include dividends. Dataare from the Center for Research in Securities Prices.
of the forms
log(p2e,j )"c0#c
1logy
j#c
2logn
j#c ) xj#c
3gj#u
j, (18)
log(p2m,j
)"c0#c
1logy
j#c
2logn
j#c ) xj#c
3gj#u
j, (19)
where xjis a vector of structural and institutional development variables, y
jis
per capita GDP, nj
is the number of listed stocks, gj
is the good governmentindex, and u
jis a random error term.
Table 7 shows the good government index to be negatively and signi"cantlyrelated to market-wide stock price variation. The good government index is alsonegatively related to "rm-speci"c stock price variation, but this e!ect is smallerin magnitude and, at best, signi"cant only in a one-tailed test, as seen in column3 of Table 7. Although Figs. 6 and 7 are more ambiguous, Tables 3 and 7 arebroadly consistent with the conjecture that noise trading generates market-widestock price #uctuations unrelated to fundamentals movements in economieswith uncertain private property rights.
R. Morck et al. / Journal of Financial Economics 58 (2000) 215}260 247

Table 6The components of stock return variation
Countries are ranked by stock market synchronicity, measured as the average R2 of "rm-levelregressions of bi-weekly stock returns on local and U.S. market indexes in each country in 1995. Thisis decomposed into a "rm-speci"c stock return variation, p2e , and a market-wide stock returnvariation, p2
m. Returns include dividends and are trimmed at $25%. Due to rounding errors,
R2j
does not exactly match p2m/(p2
m#p2e ).
Country R2j
p2e p2m
Country R2j
p2e p2m
United States 0.021 0.174 0.004 Korea 0.172 0.174 0.036Ireland 0.058 0.073 0.005 Pakistan 0.175 0.140 0.030Canada 0.062 0.190 0.013 Italy 0.183 0.073 0.016U.K. 0.062 0.068 0.005 Czech 0.185 0.125 0.028Australia 0.064 0.149 0.010 India 0.189 0.132 0.031New Zealand 0.064 0.111 0.008 Singapore 0.191 0.102 0.024Portugal 0.068 0.084 0.006 Greece 0.192 0.103 0.024France 0.075 0.087 0.007 Spain 0.192 0.067 0.016Denmark 0.075 0.059 0.005 South Africa 0.197 0.074 0.018Austria 0.093 0.061 0.006 Columbia 0.209 0.095 0.025Holland 0.103 0.051 0.006 Chile 0.209 0.086 0.023Germany 0.114 0.067 0.009 Japan 0.234 0.111 0.034Norway 0.119 0.086 0.012 Thailand 0.271 0.109 0.041Indonesia 0.140 0.127 0.021 Peru 0.288 0.128 0.052Sweden 0.142 0.084 0.014 Mexico 0.290 0.129 0.052Finland 0.142 0.113 0.019 Turkey 0.393 0.218 0.141Belgium 0.146 0.047 0.008 Taiwan 0.412 0.084 0.058Hong Kong 0.150 0.118 0.021 Malaysia 0.429 0.079 0.059Brazil 0.161 0.143 0.027 China 0.453 0.079 0.066Philippines 0.164 0.145 0.029 Poland 0.569 0.118 0.156
6.5. More robustness checks
The results in Tables 5 and 7 survive all the same robustness checks discussedabove in connection with Table 4. The results are not due to outliers, transitorye!ects, particular synchronicity measures, di!erent sized markets, monetaryinstability, commodity dependence, fundamentals co-movement, or funda-mentals volatility.
In principle, it would be desirable to add more institutional variables. How-ever, this exercise is impractical given our limited sample size, and because othermeasures of institutional development tend to be highly correlated with thegood government index. We therefore replace the good government index withother measures of property rights protection, testing each alternative measure inturn.
The alternative property rights measures we use are a &&rule of law index'' anda &&judicial e$ciency index'', both described in detail in La Porta et al. (1998a).
248 R. Morck et al. / Journal of Financial Economics 58 (2000) 215}260

Fig. 7. Average stock return variation for each country is decomposed into a systematic component,p2m, denoted by circles, and a "rm-speci"c stock component, p2e , denoted by triangles, and these are
plotted against stock return synchronicity, as measured by systematic variation as a percent of totalvariation. Biweekly 1995 "rm-level returns are regressed on local and U.S. value-weighted indexes toconstruct this data. Returns and indexes are adjusted for dividends, and are from Datastream.
4We are grateful to Michael Weisbach and an anonymous referee for stressing this clusteringe!ect, and suggesting we consider it more thoroughly.
Both measures generate qualitatively similar results to those shown for the goodgovernment index.
The size of a country's stock market may be a function of its institutionalmaturity. We already include the logarithm of the number of listed stocks.Adding stock market capitalization or its logarithm as an additional variabledoes not qualitatively change our results.
6.6. Two stock market regimes?
We have remarked above that Fig. 5, which displays scatter plots of stockprice synchronicity versus income, shows two clusters: high-income countrieswith low stock price synchronicity and low-income countries with high syn-chronicity.4 The regressions in Table 5 show that the good government indexcaptures this dichotomy better than per capita income does. Indeed, replacingthe logarithm of per capita GDP in Fig. 5 with the good government index againclearly reveals two clusters.
This clustering suggests the possibility of a threshold e!ect. If institutionaldevelopment, as measured by our good government index, is below a criticallevel, a di!erent regime governs stock prices, and a high degree of synchronicity
R. Morck et al. / Journal of Financial Economics 58 (2000) 215}260 249

Table 7Regressions of systematic or "rm-speci"c stock price variation on economy structural variables anda good government index
Ordinary least-squares regressions of the logarithm of systematic stock return variation, log(p2m), and
the logarithm of "rm-speci"c stock return variation, log(p2e ), on the logarithm of per capita GDP,structural variables and a good government index. A control for market size, log(number of stocks),is included in all regressions. The structural variables are log(geographical size), variance of GDPgrowth, industry Her"ndahl index, and the "rm Her"ndahl index. Regressions 7.2 and 7.4 include, asan additional structural variable, the earnings co-movement index. Sample is 37 countries, except forregressions on the earnings co-movement index, which is available for only 25 countries. Numbers inparenthesis are probability levels at which the null hypothesis of zero correlation can be rejected intwo-tailed t-tests.
Dependent variable
log(p2m) is the logarithm of
average systematic returnsvariation
log(p2e ) is the logarithm ofaverage "rm-speci"c returns
variation
7.1 7.2 7.3 7.4
log(GDP per capita) 0.228 0.248 0.057 0.059(0.38) (0.42) (0.63) (0.67)
Logarithm of number ofstocks listed
!0.176 !0.313 0.140 0.0500(0.34) (0.17) (0.10) (0.63)
Good government index !0.164 !0.213 !0.0540 !0.0520(0.01) (0.02) (0.06) (0.17)
Structural variablesLog. of geographical size !0.418 !0.128 0.430 1.79
(0.54) (0.92) (0.17) (0.01)
Variance in GDP growth 9.59 !211 228 !167(0.99) (0.73) (0.37) (0.55)
Industry Her"ndahl index !3.81 !6.59 0.256 0.213(0.30) (0.12) (0.88) (0.91)
Firm Her"ndahl index !1.89 1.26 0.481 !0.317(0.58) (0.77) (0.76) (0.87)
Earning co-movement index * 0.621 * !0.051(0.51) (0.91)
F statistics for the regression 4.29 3.26 3.18 3.42(0.00) (0.02) (0.01) (0.02)
Sample size 37 25 37 25R2 0.51 0.62 0.43 0.63
250 R. Morck et al. / Journal of Financial Economics 58 (2000) 215}260

is observed. Marginal changes that do not cross this threshold might have littlee!ect.
To test whether our results hold within both subsamples or mainly describedi!erences between the two subsamples, we repeat the correlations and regres-sions in our tables separately on subsamples of high and low good governmentindex countries. We use the mean of the good government index (23.92) as thedividing line in creating these subsamples, yielding a developed economy sub-sample of 22 countries, and an emerging economy subsample containing 15countries. Minor changes in the dividing line do not a!ect our results. Note thatdividing the sample into the two clusters shown in Fig. 5, countries witha logarithm of per capita GDP above and below nine, generates precisely thesame partition. Dividing the sample according to whether the `rule of lawindex,a introduced in the previous subsection, is above and below its averagealso generates precisely the same partition.
Across emerging economies, analogues of Tables 3 and 5 (not shown) revealstock market synchronicity to be correlated with neither the logarithm of percapita GDP nor good government. Indeed, in the analogue of Table 5, bothvariables remain uncorrelated with synchronicity. Overall, synchronicity in theemerging markets appears unrelated to marginal changes in the protectionaccorded private property. This result is consistent with the existence of a thre-shold level of institutional development associated with relatively asynchronousstock pricing.
In the developed country subsample, the situation is more complex. As inemerging markets, synchronicity is unrelated to per capita GDP. But acrossdeveloped countries, synchronicity is higher when the good government index islower in the analogues of Tables 3 and 5, though this e!ect is signi"cant only inone-tailed tests. Moreover, high synchronicity in developed countries is asso-ciated both with low levels of "rm-speci"c variation, p2e , and high levels ofmarket-wide variation, p2
m. This result is consistent with the U.S. data shown in
Fig. 6. This "nding motivates a closer look at the developed countries to clarifythe determinants of stock price synchronicity there.
7. More capitalization of 5rm-speci5c information in high-income countries?
In this section, we consider two variants of the hypothesis that a country'sinstitutions might a!ect the relative amounts "rm-speci"c versus market-wideinformation that are capitalized into stock prices set by rationally informed riskarbitrageurs. First, we test the hypothesis that "rm-speci"c risk arbitrage ismore attractive in economies that force "rms to provide better accounting data.Second, we test the hypothesis that "rm-speci"c risk arbitrage is more attractivein economies that provide better protection for public investors from corporateinsiders. We motivate both hypotheses in more detail below.
R. Morck et al. / Journal of Financial Economics 58 (2000) 215}260 251
We conduct our tests on the emerging economy subsample of countries withbelow average good government indexes, on the developed economy subsampleof countries with above average good government indexes, and on the fullsample. We repeat the tests for these three groups because accounting rules andinvestor rights laws might be dead letters in countries with weak institutions.Since accounting rules and public investor protection require the rule of law, thetwo hypotheses introduced above might be relevant primarily in the developedcountry subsample.
7.1. The importance of proprietary xrm-specixc information in the United States
Recall from Eq. (17) that high stock return synchronicity can be due to eitherhigh systematic variation, or low "rm-speci"c variation, or both. Fig. 7 revealsthat both systematic and "rm-speci"c return variation di!er substantially acrosscountries. In emerging economies, higher stock price synchronicity is mainlyassociated with greater systematic variation, p2
m,j; but in developed economies,
lower synchronicity is also associated with greater "rm-speci"c variation,p2e,j .
Roll (1988) and French and Roll (1986) stress the importance of proprietary"rm-speci"c information, which they propose is re#ected by p2e , in U.S. stockprices. Roll (1988) considers cross-sectional average R2 measures comparable toEq. (7) as measures of the explanatory power of asset pricing models. Using 1982to 1987 data, he "nds low R2s of about 35% with monthly data and about 20%with daily data, and concludes that asset pricing models have very limitedexplanatory power. Pointing out that stock price changes re#ect unpredictableindustry and "rm-speci"c factors as well as systematic factors, he drops observa-tions for dates when news about a "rm, or its industry, is reported in the"nancial press. This re"nement improves his R2s only slightly. French and Roll(1986) "nd U.S. stock returns to be more volatile during exchange trading hoursthan during non-trading hours, and argue that private information is theprinciple factor behind high trading-time variance.
French and Roll (1986) and Roll (1988) both conclude that most of thevariation in U.S. stock prices re#ects the capitalization of proprietary"rm-speci"c information. These results raise the possibility that low levels ofsynchronicity in some country's stock prices might re#ect the incorporation ofmore "rm-speci"c information into prices in their stock markets.
7.2. Firm-level accounting data and stock price synchronicity in developedeconomies
If accounting data are more useful, more "rm-speci"c public information isavailable to all investors. This plausibly lets risk arbitrageurs make more precisepredictions regarding "rm-speci"c stock price movements. Thus, we might
252 R. Morck et al. / Journal of Financial Economics 58 (2000) 215}260
observe more "rm-speci"c price variation in countries with better accountingstandards.
To test this hypothesis, we rerun the correlations and regressions in Tables5 and 7, for both the full sample and the emerging and developed economysubsamples separately, using a direct measure of the sophistication of eachcountry's accounting standards in place of our good government index. We takethis variable from La Porta et al. (1998a), who construct the measure using 1990data from International Accounting and Auditing Trends, Center for InternationalFinancial Analysis and Research, Inc. La Porta et al. (1998a) describe theconstruction of the accounting standards index as follows: `This index wascreated by examining and rating companies' 1990 annual reports on theirinclusion or omission of 90 items. These fall into seven categories (generalinformation, income statements, balance sheets, funds #ow statement, ac-counting standards, stock data and special items). A minimum of 3 companies ineach country were studied. The companies represent a cross section of variousindustry groups where industrial companies numbered 70% while "nancialcompanies represented the remaining 30%a. They obtain annual reports fromMoody's International, CIFAR, EXTEL, WorldScope, 20-Fs, Price Waterhouseand various country sources. The accounting standards index ranges from 36 to83, with a high value indicating more detailed and useful disclosure require-ments.
Univariate statistics for the accounting standards variable and its simplecorrelation coe$cients with our other variables are shown in Table 3.Accounting standards are negatively correlated with synchronicity, but thesigni"cance levels are in the neighborhood of 20% indicating only a marginalrelation between the variables, even in one-tailed tests. In regressions analogousto those in Tables 5 and 7 for both the full sample and the emerging anddeveloped economy subsamples, substituting the accounting standards variablefor the good government index produces results similar to those in Table 4. Theaccounting standards index itself is uniformly statistically insigni"cant. Addingthe accounting standards measure as an additional explanatory variable alsoleaves it statistically insigni"cant, and does not a!ect the magnitude or signi"-cance of the good government index in the whole sample or either subsample.We conclude that either this e!ect is unimportant in explaining our "ndings, orour measure of accounting standards is #awed.
7.3. Diwerential capitalization of xrm-specixc and market-wide information?
A lack of respect for the property rights of public investors by corporateinsiders might impede the capitalization of "rm-level information in stock pricesin some developed countries. This hypothesis is motivated by the observation,noted above, that greater stock price synchronicity is associated with lower"rm-speci"c returns variation among developed country stock markets.
R. Morck et al. / Journal of Financial Economics 58 (2000) 215}260 253

This observation requires explanation. We conjecture that "rm-speci"c riskarbitrage could be less cost e!ective in economies that more poorly protectpublic investors from insiders. If less "rm-speci"c risk arbitrage therefore occurs,and Roll (1988) and French and Roll (1986) are correct in arguing that such riskarbitrage is the primary cause of "rm-speci"c share price movements, we shouldobserve lower "rm-speci"c share price variation in such economies.
At this point we can only speculate about the underlying mechanism thatmight discourage "rm-speci"c risk arbitrage in economies that fail to protectpublic investors from insiders. One possibility follows from the "nding of LaPorta et al. (1999), that control pyramids are the most common device insidersuse to control public "rms outside the United States. In a control pyramid,a family controls one "rm, which holds controlling blocks of other "rms, each ofwhich holds controlling blocks in yet more "rms, and so on. Such pyramids canhave a dozen or more layers. Minority shares in some or all of these "rms aretraded publicly. Daniels and Morck (1994) stress that in Canada, where manypublicly traded stocks are minority shares in "rms in such control pyramids, themost important corporate governance laws are `oppression remedies,a whichstop controlling shareholders from shifting income between controlled "rmsthrough non-arm's-length transactions for goods, services, or capital at arti"cialprices. The problem is a type of insider trading, but is also akin to transferpricing in multinational "rms. In economies with control pyramids, weakerprotection for public investors might render such income shifting more routine.
If income shifting involved strong "rms subsidizing weak "rms, "rm funda-mentals would become more correlated. If other criteria, such as each "rm'srelevance to the wealth, pet projects, status, or political in#uence of insiders,governed income shifting decisions, fundamentals correlation need not rise.Although the former sort of income shifting may happen in situations of"nancial distress, we postulate that the latter sort is more commonplace.
Shifting away abnormal pro"ts that arise from market-wide factors attractsattention unless all other "rms do likewise. In contrast, shifting "rm-speci"cabnormal pro"ts away requires no such concurrent action. Rational risk arbit-rageurs, knowing they cannot predict where "rm-speci"c abnormal pro"ts willcome to rest, should thus invest fewer resources in predicting "rm-speci"cabnormal pro"ts, and focus on market-wide plays. Such a focus implies that less"rm-speci"c information should enter stock prices in economies where incomeshifting is easier. Stock return synchronicity should rise as "rm-speci"c returnvariation falls in economies with poorer investor protection.
At least partly consistent with this mechanism, Bhattacharya et al. (2000) "ndthat Mexican stock prices, return volatilities, trading volumes, and spreadssimply do not respond to many types of "rm-speci"c news that are known toa!ect U.S. stock prices. Although Bhattacharya et al. (2000) present evidenceof insider trading to explain their "nding, this evidence does not excludethe possibility that insiders appropriating "rm-speci"c pro"ts might limit
254 R. Morck et al. / Journal of Financial Economics 58 (2000) 215}260

"rm-speci"c stock price movements. However, we admit the conjectural natureof this mechanism, and welcome alternatives explanations of why low "rm-speci"c returns variation is associated with higher synchronicity in developedeconomies.
To test the more basic hypothesis that poor investor protection is associatedwith a reduced capitalization of "rm-speci"c information, we rerun the regres-sions in Table 5 using a direct measure of the extent to which public share-holders' property is protected from appropriation by corporate insiders, an&&anti-director rights index''. This index is a score card of shareholders' rightsagainst directors in various countries compiled by La Porta et al. (1998a). Themeasure can range from zero to six according to whether or not shareholders (i)can vote by mail, (ii) are barred from selling stock a few days prior to a share-holder meeting, (iii) can use cumulative voting for directors, (iv) have legalstanding to sue directors or to force the company to buy back their shares, (v)have preemptive rights to new issues, and (vi) call extraordinary shareholdermeetings relatively easily. Higher scores indicate that corporate insiders aremore accountable to shareholders. Univariate statistics of the anti-directorrights index and its simple correlation coe$cients to our other variables areshown in Table 3.
La Porta et al. (1998a) emphasize that, for such rights to provide e!ectiveprotection, a country must have functional political and legal systems. It istherefore plausible that the anti-director rights index might be most relevant incountries with good government, where the rule of law prevails. La Porta et al.(1998a) show that many countries, including some with strong property rightsprotection in general, poorly protect the property rights of public investors. This"nding suggests that there might be enough variation in anti-director rightswithin our developed country subsample for statistical tests.
We therefore ran regressions like those in Table 5, but substituting theanti-director rights index for the good government index. We run these regres-sions for the whole sample and the developed and emerging economy sub-samples. The anti-director rights index is insigni"cant in the whole sample andemerging economy subsample, but negative and highly statistically signi"cant inthe developed economy subsample. Recall that the good government index isalso signi"cant in the developed economy subsample. However, if both theantidirector rights and good government indexes are included in regressionsusing the developed country sub-sample, the good government index is insigni-"cant.
If more "rm-speci"c information is capitalized into stock prices in developedeconomies, decreased synchronicity in that subsample should be related tohigher levels of "rm-speci"c variation. Table 8 tests this hypothesis by runningregressions analogous to those in Table 7, but either replacing the good govern-ment index with the anti-director rights index or including both. These regres-sions are run using only the developed economy subsample. Table 8 shows
R. Morck et al. / Journal of Financial Economics 58 (2000) 215}260 255
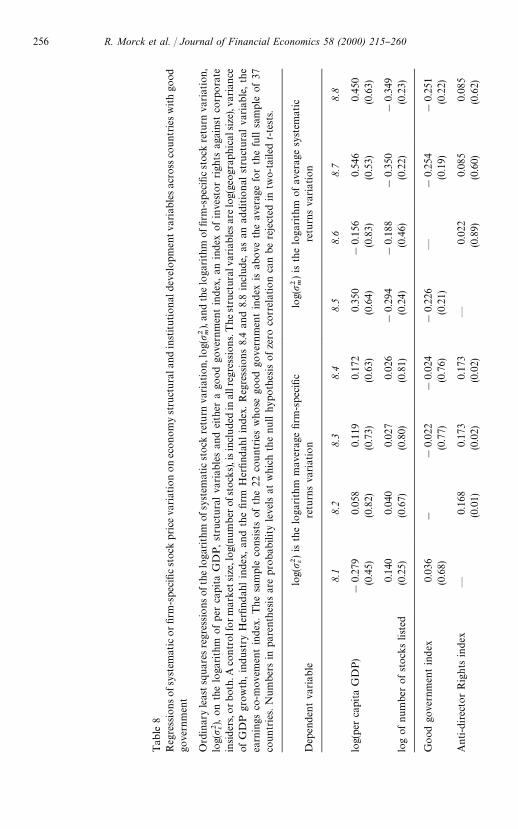
Tab
le8
Reg
ress
ionsofs
yste
mat
icor"rm
-spe
ci"c
stoc
kpr
ice
variat
ion
on
econom
yst
ruct
ura
land
inst
itut
ional
deve
lopm
entva
riab
lesac
ross
count
ries
with
good
gove
rnm
ent
Ord
inar
yle
astsq
uare
sre
gres
sions
oft
helo
garith
mof
syst
emat
icst
ock
retu
rnva
riat
ion,
log(
p2 m),
and
the
loga
rith
mof"rm
-spe
ci"cst
ock
retu
rnva
riat
ion,
log(
p2 e),on
the
loga
rith
mofper
capi
taG
DP,st
ruct
ura
lva
riab
les
and
eith
era
good
gove
rnm
ent
inde
x,an
inde
xofin
vest
or
righ
tsag
ains
tco
rpora
tein
sider
s,orbot
h.A
contr
olf
orm
arke
tsiz
e,lo
g(nu
mber
ofst
ock
s),i
sin
clude
din
allr
egre
ssio
ns.
The
stru
ctur
alva
riab
lesar
elo
g(ge
ogr
aphic
alsize
),va
rian
ceof
GD
Pgr
ow
th,in
dus
try
Her"nd
ahlin
dex,
and
the"rm
Her"nd
ahlin
dex
.R
egre
ssio
ns
8.4
and
8.8
incl
ude,
asan
addi
tional
stru
ctura
lva
riab
le,th
eea
rnin
gsco
-mov
emen
tin
dex
.The
sam
ple
cons
ists
ofth
e22
count
ries
who
sego
od
gove
rnm
ent
inde
xis
above
the
aver
age
for
the
full
sam
ple
of37
coun
trie
s.N
um
bers
inpa
rent
hes
isar
epro
babili
tyle
vels
atw
hich
the
null
hypo
thes
isofze
roco
rrel
atio
nca
nbe
reje
cted
intw
o-ta
iled
t-te
sts.
Dep
enden
tva
riab
lelo
g(p2 e)
isth
elo
garith
mm
aver
age"rm
-spec
i"c
retu
rns
variat
ion
log(
p2 m)is
the
loga
rith
mofav
erag
esy
stem
atic
retu
rns
variat
ion
8.1
8.2
8.3
8.4
8.5
8.6
8.7
8.8
log(
per
capi
taG
DP)
!0.
279
0.05
80.
119
0.17
20.
350
!0.
156
0.54
60.
450
(0.4
5)(0
.82)
(0.7
3)(0
.63)
(0.6
4)(0
.83)
(0.5
3)(0
.63)
0.14
00.
040
0.02
70.
026
!0.
294
!0.
188
!0.
350
!0.
349
log
ofnu
mbe
rofst
ock
slist
ed(0
.25)
(0.6
7)(0
.80)
(0.8
1)(0
.24)
(0.4
6)(0
.22)
(0.2
3)
Good
gove
rnm
entin
dex
0.03
6!
!0.
022
!0.
024
!0.
226
*!
0.25
4!
0.25
1(0
.68)
(0.7
7)(0
.76)
(0.2
1)(0
.19)
(0.2
2)
Anti-d
irec
tor
Rig
hts
inde
x*
0.16
80.
173
0.17
3*
0.02
20.
085
0.08
5(0
.01)
(0.0
2)(0
.02)
(0.8
9)(0
.60)
(0.6
2)
256 R. Morck et al. / Journal of Financial Economics 58 (2000) 215}260
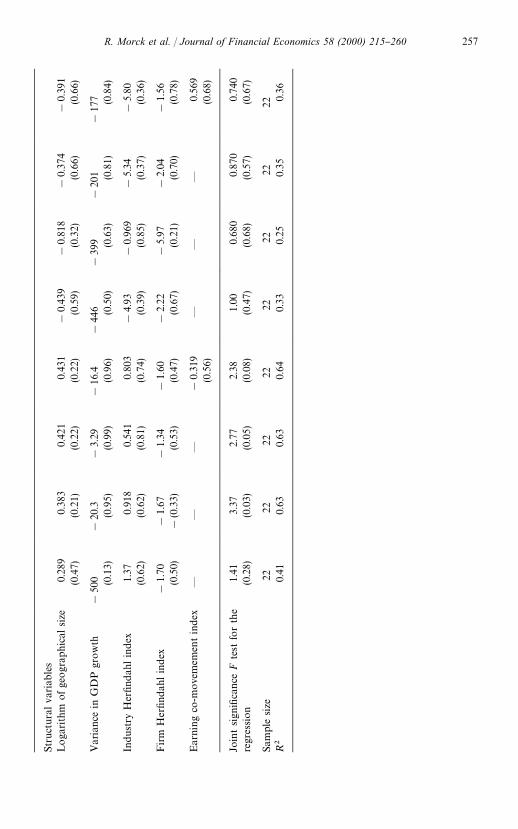
Stru
ctur
alva
riab
les
Loga
rith
mofge
ogr
aphic
alsize
0.28
90.
383
0.42
10.
431
!0.
439
!0.
818
!0.
374
!0.
391
(0.4
7)(0
.21)
(0.2
2)(0
.22)
(0.5
9)(0
.32)
(0.6
6)(0
.66)
Var
ianc
ein
GD
Pgr
ow
th!
500
!20
.3!
3.29
!16
.4!
446
!39
9!
201
!17
7(0
.13)
(0.9
5)(0
.99)
(0.9
6)(0
.50)
(0.6
3)(0
.81)
(0.8
4)
Indus
try
Her"nd
ahlin
dex
1.37
0.91
80.
541
0.80
3!
4.93
!0.
969
!5.
34!
5.80
(0.6
2)(0
.62)
(0.8
1)(0
.74)
(0.3
9)(0
.85)
(0.3
7)(0
.36)
Firm
Her"nd
ahlin
dex
!1.
70!
1.67
!1.
34!
1.60
!2.
22!
5.97
!2.
04!
1.56
(0.5
0)!
(0.3
3)(0
.53)
(0.4
7)(0
.67)
(0.2
1)(0
.70)
(0.7
8)
Ear
ning
co-m
ovem
emen
tin
dex
**
*!
0.31
9*
**
0.56
9(0
.56)
(0.6
8)
Join
tsign
i"ca
nce
Fte
stfo
rth
ere
gres
sion
1.41
3.37
2.77
2.38
1.00
0.68
00.
870
0.74
0(0
.28)
(0.0
3)(0
.05)
(0.0
8)(0
.47)
(0.6
8)(0
.57)
(0.6
7)
Sam
ple
size
2222
2222
2222
2222
R2
0.41
0.63
0.63
0.64
0.33
0.25
0.35
0.36
R. Morck et al. / Journal of Financial Economics 58 (2000) 215}260 257

signi"cantly more "rm-speci"c price variation in stocks in developed countriesthat provide better protection of public shareholders against corporate insiders.
7.4. Additional robustness tests
We replicated the regressions in Table 8 replacing the antidirector rightsinteraction variable with a dummy variable for the origin of the country's legalsystem. La Porta et al. (1998a) show that countries with legal systems derivedfrom those of France or Germany give public shareholders little protectionagainst insiders. Thus, we thus set our legal origin dummy to zero if a country'slegal system is modeled on that of France or Germany, and to one if it ismodeled on those of Britain or Scandinavia. The results are qualitatively similar,and signi"cance levels are similar to those for the anti-director rights variable.Regressions including the fundamentals correlation measure yield qualitativelysimilar results. In summary, we cannot reject the hypothesis that less "rm-speci"c information is capitalized into stock prices in developed economies thatprovide less protection of public shareholders' property rights from corporateinsiders.
8. Conclusions
We present empirical evidence that stock returns are more synchronous inemerging economies than in developed economies. We show that this result isnot an artifact of structural characteristics of economies, such as market size,fundamentals volatility, country size, economy diversi"cation, or the co-move-ment of "rm-level fundamentals. Though some of these factors contribute tostock return synchronicity, a large residual e!ect remains, and this e!ect iscorrelated with measures of institutional development.
In particular, less respect for private property by government is associatedwith more market-wide stock price variation, and therefore also with moresynchronous stock price movements. Since these market-wide price #uctuationsare uncorrelated with fundamentals, we conjecture that poor property rightsprotection might deter risk arbitrage and, in the words of De Long et al. (1990),`create spacea for noise traders. However, since we may be controlling forfundamentals volatility imperfectly, we cannot rule out other explanations.
We also show that, in developed economies, providing public shareholderswith stronger legal protection against corporate insiders is associated greater"rm-speci"c returns variation, and so with lower synchronicity. We conjecturethat economies that protect public investors' property rights might discourageintercorporate income-shifting by controlling shareholders. Better propertyrights protection thus might render "rm-speci"c risk-arbitrage more attractivein the stock markets of such economies.
258 R. Morck et al. / Journal of Financial Economics 58 (2000) 215}260

Overall, our results suggest that stock markets in emerging economies may beless useful as processors of economic information than stock markets inadvanced economies. The function of an e$cient stock market is to processinformation, and thereby guide capital towards its best economic use. If stockprice movements in emerging economies are mainly due to either politicallydriven shifts in property rights or noise trading, numb invisible hands in theirstock markets may allocate capital poorly, thereby retarding economic growth.Consistent with this interpretation, Wurgler (2000) "nds a higher elasticity ofcapital expenditure with respect to value added in countries whose stock returnsare less synchronous, as measured in this study.
Finally, we recognize that these interpretations, though supported to someextent by our "ndings, remain conjectures. We invite alternative explanations ofour econometric "ndings.
References
Bhattacharya, U., Daouk, H., Jorgenson, B., Kehr, C., 2000. When an event is not an event: thecurious case of an emerging market. Journal of Financial Economics 55, 69}101.
Bernstein, J., Weinstein, D., 1998. Do endowments predict the location of production? evidence fromnational and international data. Unpublished working paper d6815. National Bureau ofEconomic Research, Cambridge, MA.
Campbell, J., M. Lettau, B. Malkiel, Y. Xu, 2000. Have individual stocks become more volatile? Anempirical exploration of idiosyncratic risk. Journal of Finance. Forthcoming.
Daniels, R., Morck, R., 1994. Corporate Decision Making in Canada. University of Calgary Press,Calgary.
De Long, J.B., Shleifer, A., Summers, L.H., Waldmann, R.J., 1989. The size and incidence of thelosses from noise trading. Journal of Finance 44, 681}696.
De Long, J.B., Shleifer, A., Summers, L.H., Waldmann, R.J., 1990. Noise trader risk in "nancialmarkets. Journal of Political Economy 98, 703}738.
Fisman, R., 1999. It's not what you know2 estimating the value of political connections. Unpub-lished manuscript.
French, K.R., Roll, R., 1986. Stock return variances: the arrival of information and the reaction oftraders. Journal of Financial Economics 17, 5}26.
Grossman, S., 1976. On the e$ciency of competitive stock markets where traders have diverseinformation. Journal of Finance 31, 573}585.
La Porta, R., Lopez de-Silanes, F., Shleifer, A., Vishny, R.W., 1998a. Law and "nance. Journal ofPolitical Economy 106, 1112}1155.
La Porta, R., Lopez de-Silanes, F., Shleifer, A., Vishny, R.W., 1998b. The quality of government.Unpublished working paper d6727. National Bureau of Economic Research, Cambridge.
La Porta, R., Lopez-de-Silanes, F., Shleifer, A., 1999. Corporate ownership around the world.Journal of Finance 54, 471}517.
Roll, R., 1992. Industrial structure and the comparative behavior of international stock marketindices. Journal of Finance 47, 3}41.
Roll, R., 1988. R2. Journal of Finance 43, 541}566.Shleifer, A., 1994. Establishing property rights. Annual Conference Supplement, World Bank
Research Observer, 93}117.Shleifer, A., Vishny, R.W., 1997. The limits of arbitrage. Journal of Finance 52, 35}55.
R. Morck et al. / Journal of Financial Economics 58 (2000) 215}260 259

Wurgler, J., 2000. Financial markets and the allocation of capital, Journal of Financial Economics58, 187}214.
Zingales, L., 1994. The value of the voting right: a study of the Milan stock exchange experience.Review of Financial Studies 7, 125}148.
260 R. Morck et al. / Journal of Financial Economics 58 (2000) 215}260