the internationalization of venture capital and private equity · · 2018-03-24september 2008 the...
TRANSCRIPT
September 2008
The Internationalization of Venture Capital and Private Equity*
Joshua Aizenman and Jake Kendall
UCSC and the NBER; The World Bank
Abstract
This paper investigates the internationalization of venture capital (VC) and private equity (PE) investments. We derive flows between countries of VC and PE investments worldwide, relying on comprehensive firm-level data sources, covering three decades and about 100 countries. A gravity analysis indicates that distance, common language, and colonial ties are significant factors in directing these flows. Additionally, the presence of high-end human capital, a better business environment, high levels of military expenditure, and deeper financial markets are important local factors that attract international venture capital. There is also evidence of path dependency and persistence in VC and PE flows, indicating network effects and fixed costs of entry may be at work. Further analysis suggests the internalization of VC and PE is an ongoing story. Prior to the 1990s, VC was primarily a US-only phenomenon. The globalization of IT activities induced the US venture capital industry to mature, and to start exporting its unique skills as VC managers. The US is now a dominant net exporter of deals, though most cross-border deals are still either to or from the US. China has emerged as the dominant net importer, followed by Sweden, Canada, the UK, India and France. For deals outside the US, cross-border participation has been the norm, while US-located deals have been almost exclusively domestic, involving a higher percent of international participation only after 2001. In the past few years, domestic VC and PE capacity has begun to emerge in many countries where it did not exist previously.
Joshua Aizenman Jake Kendall Economics E2, UCSC The World Bank Santa Cruz, 1818 H Street, NW CA, 95064 Washington DC 20433 [email protected] [email protected]
Keywords: Venture capital, Gravity equation, path dependence, cross border flows JEL classification: F15, F21
* We would like to thank the following people for their help and insights into the venture capital and private equity world: Brad Maclean of the Asian Venture Capital Journal, Oliver Roupe of the Founder’s Fund, Mawuli Ababibo of the African Venture Capital Association, and various staff members at Thomson VentureXpert. We thank Dennis Novy for useful comments. Any errors are ours.
1
"The Great Divide -- A Narrow Majority of VCs Go Global While the Rest Stay Focused Stateside, the United States is Still the Top Destination of Choice." Global Trends in Venture Capital 2006 Survey, Report Sponsored by Deloitte & Touche USA LLP 1. Introduction
Venture capital (VC) is long-term, hands-on equity investment in privately held, high-
growth-potential companies, initiated and managed by professional investors [see Lerner (2001)
and Gompers and Lerner (2001) for evaluation and reviews of the recent literature]. While
venture capital firms and the companies they own are not significant in terms of employment
generation or capital under management, the role of VC in the economy should not be
underestimated. Very few of the top US technology companies got started without VC funds. In
addition, VC directed investment seems to be especially potent in the innovation process. This
role was confirmed by Kortum and Lerner (2000), who examined the influence of venture capital
on patented inventions in the United States across twenty industries over three decades. They
found that venture capital investments in an industry are associated with significantly higher
patenting rates than regular R&D by almost a 7 to 1 ratio. Countries around the world have taken
note, and attempted to replicate the success of the US VC industry on their home soil, both by
encouraging inward investment from foreign players and by growing capacity locally.
While the VC sector in the United States has been large and vibrant for many years, the
rest of the world saw very little growth in VC activity until the mid 1990s.1 Since that time, the
internationalization of the VC sector has been driven both by general factors driving
globalization as well as historical facts specific to VC. As Figures 1-4 show, a great deal of
growth in international activity occurred starting in the late 1990s around the time of the US-
centered technology bubble, some of which was driven by an oversupply of funds to US VC
firms who may have gone international in the search for deal flow. While a bubble may have
driven the growth VC funding out of and into the US, the destinations of these flows have not
been random, and the continuing significance of cross-border flows as well as the continued
1 The roots of the modern VC industry go back to the aftermath of World War II, including the foundation in 1946 of American Research and Development Corporation. ARDC is credited with the first major venture capital IT success story, when its 1957 seed investment in Digital Equipment Corporation (DEC) delivered annual return of nearly 100% after the company's initial public offering in 1968 [see Wilson (1985)].
2
growth of domestic VC capacity in countries which had almost none previous to the late 1990’s
is further evidence that the globalization of the VC industry is here to stay.2
The purpose of this paper is to investigate both the degree of internationalization of
venture capital and private equity investments in recent years and to assess the factors which
determine the destination of cross-border VC and PE investment flows. To address these issues,
we rely primarily on the Thomson VentureXpert database -- a comprehensive data source for
deals done worldwide that includes over 30 years of historical data. It draws its information from
quarterly surveys of private equity firms; government filings; public news releases; and Thomson
reporters as they interact with private equity practitioners. Each deal in our sample includes the
names of the investors and the locations of their offices, the name of the target company and
their location, as well as some details on the stage of the deal, the industry in which the company
operates, the total value of the deal (amount of cash invested), and the timing. With this
information, we can calculate the volume of deals done in a given country in a given year, and
the approximate bilateral flows between countries, defining as the source country the home
country of the investment firm and the destination country as the home country of the target
company. All total, there are just over 100 countries represented in our sample, both as source
and destination countries [see Data Appendix for further details].
Before continuing, a few definitions are in order. The terms private equity and venture
capital are not well defined and have conflicting uses in the financial press. Much of the
practitioner community uses the term “private equity” to refer to both venture financing and
other private placement deals such as buyouts and acquisitions of private companies. Often,
however, private equity refers only to the deals which are not venture capital. We take this
second approach. Our definition of venture capital is in line with that used at Thompson
VentureXpert, the European Venture Capital Association, and the American National Venture
Capital Association, three definitive industry sources. We define venture capital (abbreviated:
VC) by the stage of the investment and include seed, startup, early stage, and expansion stage
deals.3 These are the preliminary stages a company goes through in its initial journey to
becoming a functioning corporation with steady revenues and a well defined product and
2 Recent survey evidence from Deloitte (2006) indicates that the internationalization of VC and PE activities for firms based in the US and Europe may just be taking off. More than 50% of the firms they survey are planning to expand globally. 3 Expansion stage deals generally occur after the venture has achieved some limited success with its product and are often a way to allow founders to achieve some liquidity by selling part of their stakes to new VC partners.
3
customer base that has the potential to issue shares through an IPO. We refer to the rest of the
deal types as private equity (abbreviated: PE). These include buyout, buy-in, merger, acquisition,
late stage, turnaround/rescue, PIPE, and many other types. The main characteristic of these types
of deals is that they involve functioning (or previously functioning) companies which have left
the initial growth phase and often represent financial engineering and changes of control as
opposed to an investment designed to develop an initial product and take it to market.
Additionally, private equity investments do not as often have IPOs as their main exit strategy.
We start in Section 2 by evaluating the overall trends, inferred by aggregating the deal-
level data. The internalization of VC is an ongoing trend but prior to the early 1990s, as a first
order approximation, the VC industry was confined to the US. Hence, we focus on the years
1990-2007, and explore the internationalization of both VC and PE through the cycle of the
1990s IT bubble, and the more recent burst of PE activity occurring after 2002.
We document a large rise in the proportion of worldwide deal volume which featured
cross-border participation, from only 15% in the early 1990’s to over 40% in 2007. We also see
that for deals outside the US, a high level of cross-border participation has been the norm for
quite some time. It’s evident that the end of the IT bubble had dramatic and lasting impact on the
VC segment, which is still about quarter of the peak volume of 1999-2000 worldwide [volume
excluding the US is still about half of the peak], whereas the sum of PE and VC has recovered
and is at levels comparable to the peak volume at the end of 1990s.4 The US stands out clearly
as it’s venture capital and private equity deals are largely domestically funded (though at a
decreasing rate going into the 2000’s) whereas most other regions feature a very high level of
cross-border participation. Less than quarter of the US deals had international participation
during our sample period, while for Asia and Europe about three quarters of the deals had
international participation. Looking at the “venture capital surplus,” measured as the difference
between the number of cross-border deals done by local firms in a country, minus the number of
local deals which featured foreign participation during a 5-year window, reveals the global
dominance of the US as the largest net exporter of VC deals. France, Israel, Canada, India and
China were consistently net importers of VC deals, with China emerging as the largest net
importer of VC deals after 2003. Disaggregating to the firm and deal level shows that
4 This is largely due to a boom in cross-border PE investing after 2003 as documented in Price Waterhouse Coopers (2006).
4
international VC firms and the deals they engage in are noticeably different from purely
domestic deals and firms.
We continue in Section 3 with an econometric assessment of the factors explaining the
the number of international venture capital and private equity deals between countries and the
dollar volume of these flows. We apply various versions of the gravity model to the patterns of
VC and PE flows. The empirical gravity structure has been widely applied in the international
trade literature [see the review by Anderson and Van Wincoop (2004)] and to model
international financial flows of FDI [Aizenman and Marion (2004)], portfolio equity [Portes and
Rey (2005)], and sovereign lending [Rose and Spiegel (2004)].5 We find that distance is
negatively related to deal volume and to the number of venture capital and private equity deals,
indicating the powerful location bias in these types of investment activity. This result is very
robust, and not surprising in light of the intensive monitoring and advisory roles that these types
of investments require. Conversations with practitioners indicate that even purely US-based
VC’s will often choose only a few cities in which to operate, sourcing several deals in each city
so as to economize on travel to that area. Language connections between countries and colonial
relationship are also significant predictors of venture capital deal counts, possibly being a proxy
for the extent of social and business networking between the source and destination countries as
well as for the similarity of institutions, levels of trust, and communication costs. We find
evidence of persistence in venture capital and private equity flows even when controlling for
source and destination country effects indicating the possibility of network spillover effects,
herding, and/or “beachhead” effects related to fixed costs of commencing activity in a given
country. We confirm that venture capital tends to flow to countries with more high-end human
capital, with better business environment, and deeper financial markets (especially stock
markets, which facilitate exit from venture investments via IPO). There is also evidence defense
expenditure and venture capital deals may be complementary.6
Throughout both Sections 2 and 3, we focus more intently on the VC data relative to the
PE data. The literature mentioned earlier has shown a very special role for venture funded
investment in driving technological innovation. With private equity on the other hand no similar
finding has been evident and it is our opinion that PE more often represents financial engineering 5 While empirically useful, the theoretical foundations for applying the gravity to FDI and other flows of capital remains wanting and debatable [see Blonigen (2005) for a review of related issues]. 6 Plenty of anecdotal evidence indicates that the military played a central role in the development of the US and Israeli VC sectors [see Wilson (1983)].
5
and changes of control rather than the creation of real assets and new technologies. For this
reason we focus more closely on VC and include our analysis of the PE sector partly for
comparison given that some of the same factors which affect the ability of investors (and
specifically foreign investors) to engage in VC activity will also effect PE activity and vice
versa.
Section 4 concludes with a discussion of the results and the implications for future work.
2. Preliminary Inspection of the Data
The patterns of the international movement of venture capital and private equity funds are
interesting in their own right and have not gotten much attention in the academic literature. Here
we attempt to document the aggregate patterns as they appear in our data. We focus on the
volume of deals which feature participation by cross-border investors as well as on the size, and
other characteristics of those deals as they differ from deals financed solely from domestic
sources. To the extent that we can within our data, we also analyze the situation at firm level and
measure differences in deal characteristics between firms that engage in cross border activity and
those which do not.
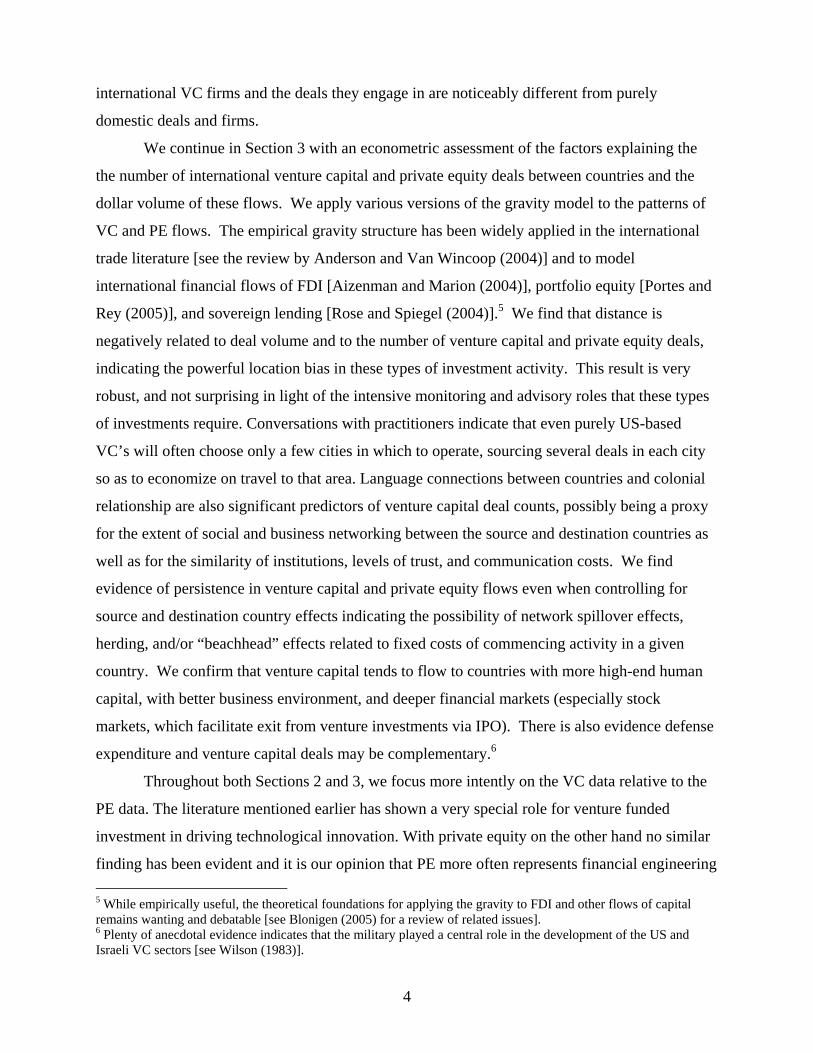
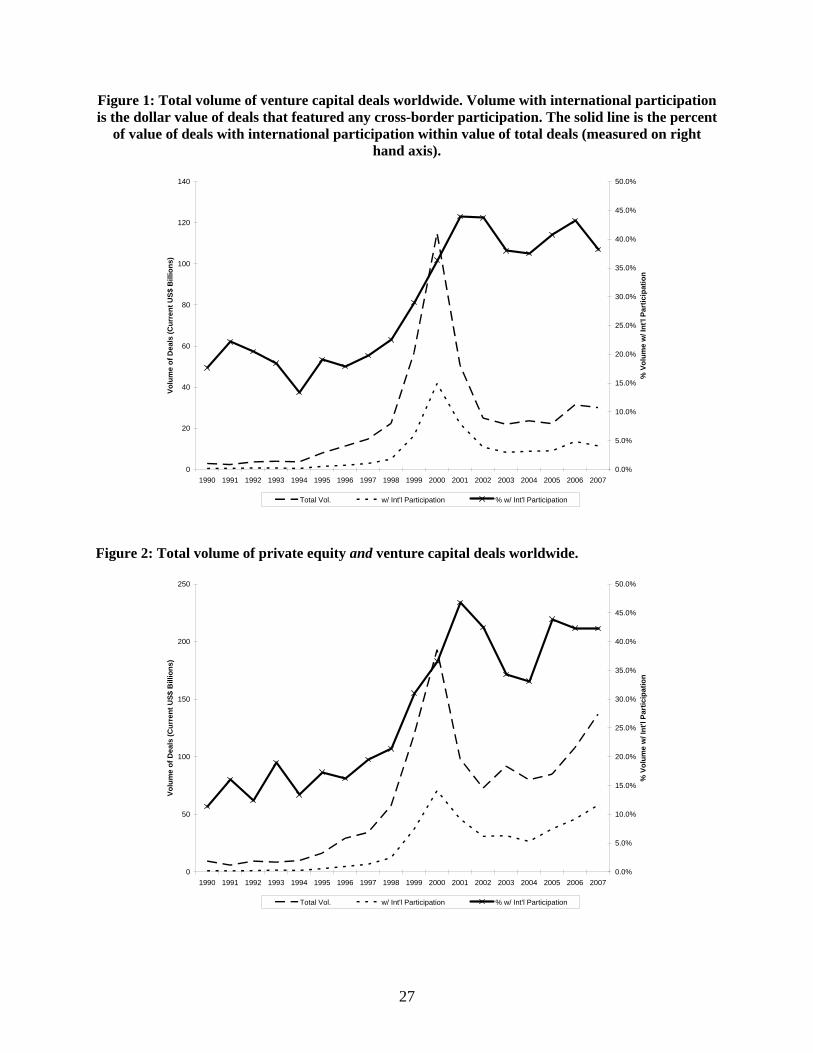
Figure 1 charts the total worldwide volume of VC deals in our dataset over time as well
as the volume of those deals which feature international participation and the ratio of these two.
Two major features stand out. First, one can see clearly the boom in the volume of venture
capital and private equity money associated with the late 1990’s internet bubble which then
crashes precipitously in 2001-2002. Also interesting, and of great relevance to our study is the
rise in the proportion of deals which are funded with some cross-border participation. This ratio
goes from only 15% in the early 1990’s to over 40% in 2007. Figure 2 report similar patterns for
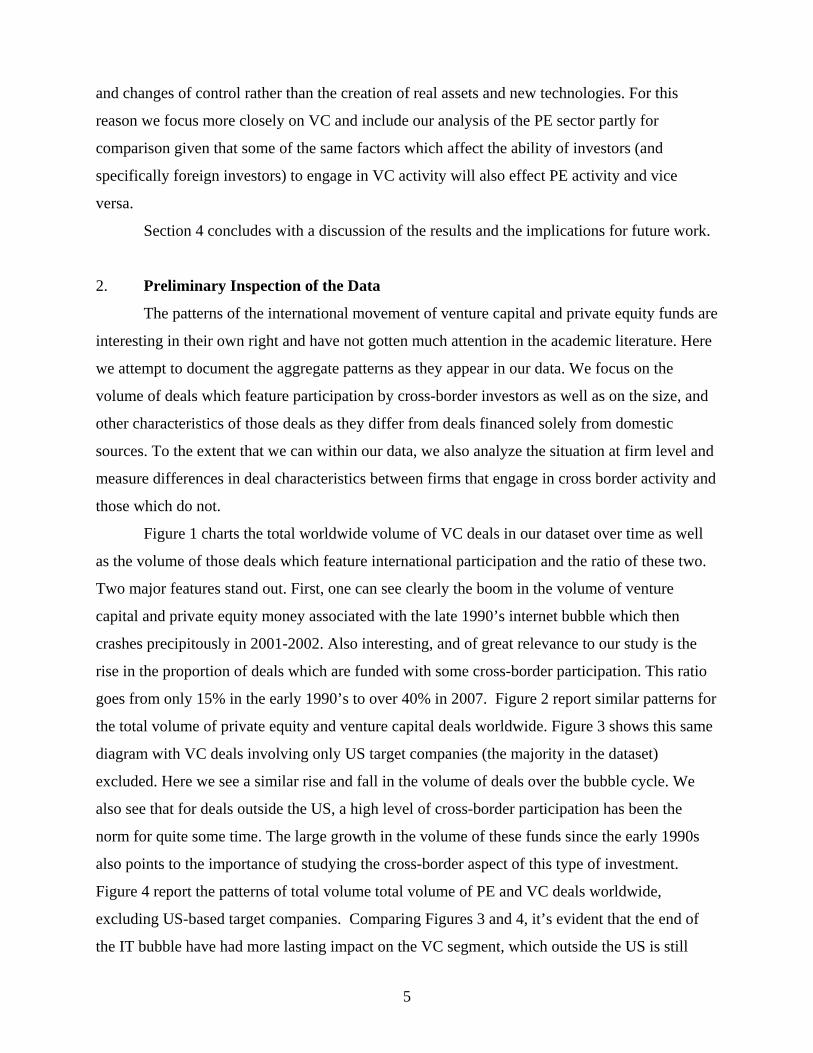
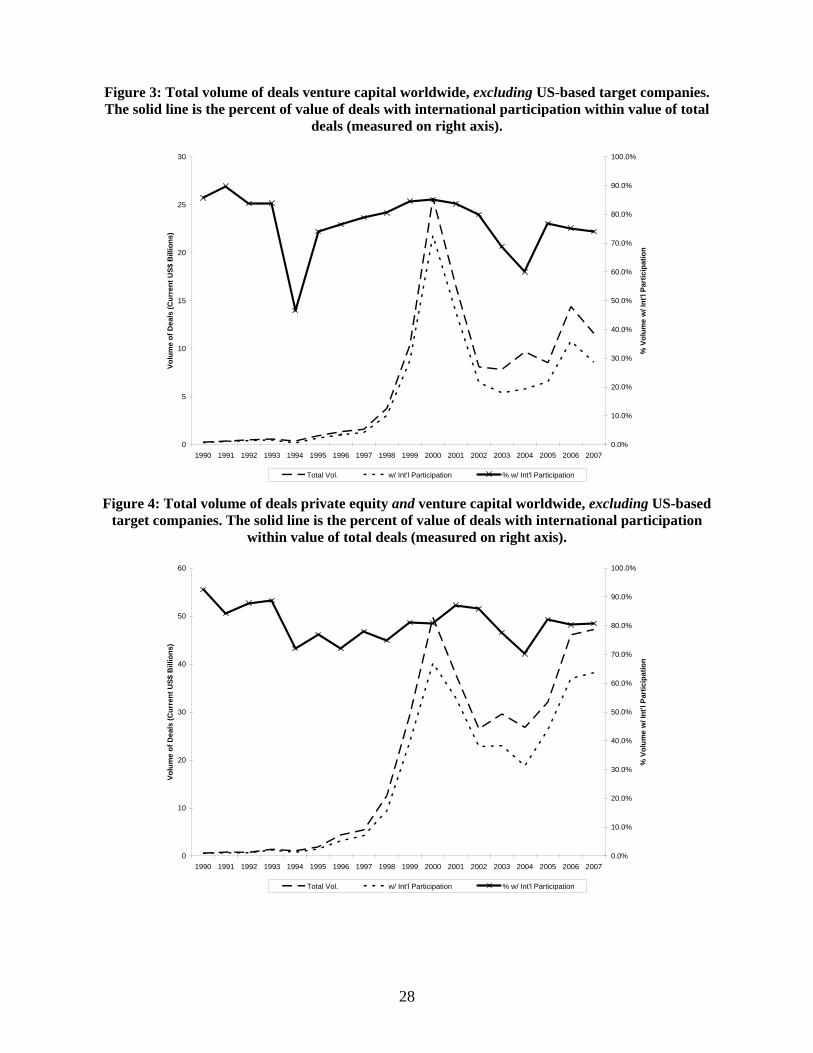
the total volume of private equity and venture capital deals worldwide. Figure 3 shows this same
diagram with VC deals involving only US target companies (the majority in the dataset)
excluded. Here we see a similar rise and fall in the volume of deals over the bubble cycle. We
also see that for deals outside the US, a high level of cross-border participation has been the
norm for quite some time. The large growth in the volume of these funds since the early 1990s
also points to the importance of studying the cross-border aspect of this type of investment.
Figure 4 report the patterns of total volume total volume of PE and VC deals worldwide,
excluding US-based target companies. Comparing Figures 3 and 4, it’s evident that the end of
the IT bubble have had more lasting impact on the VC segment, which outside the US is still
6
about half of the peak volume of 1999-2000 [only about quarter of the peak volume world wide],
whereas the sum of PE and VC has recovered and is at levels comparable to the peak volume at
the end of 1990s. The recovery of the total volume is largely driven by a worldwide boom in PE
investing starting around 2003.
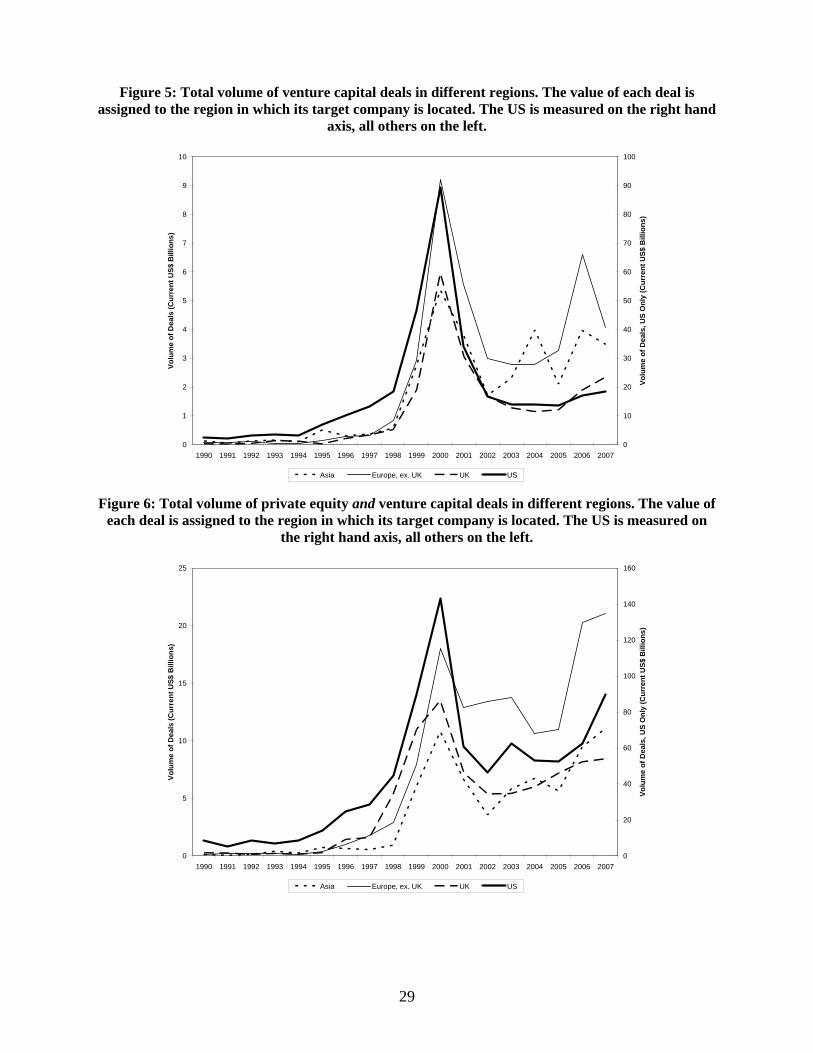
Figure 5 shows the volumes of deals funded in different regions including the US, UK,
Europe (ex. UK), and Asia. The impact of the internet bubble in these regions is again evident as
is the fact that the bubble-related swings in the US volume seem to have been higher than in
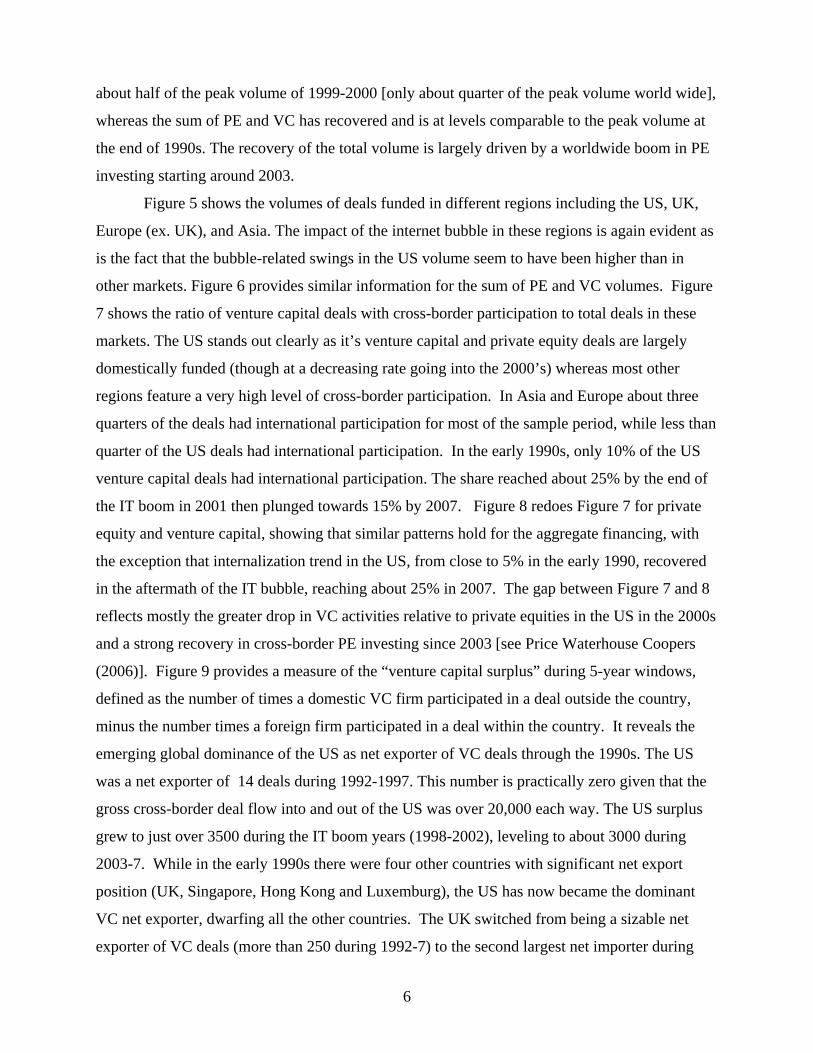
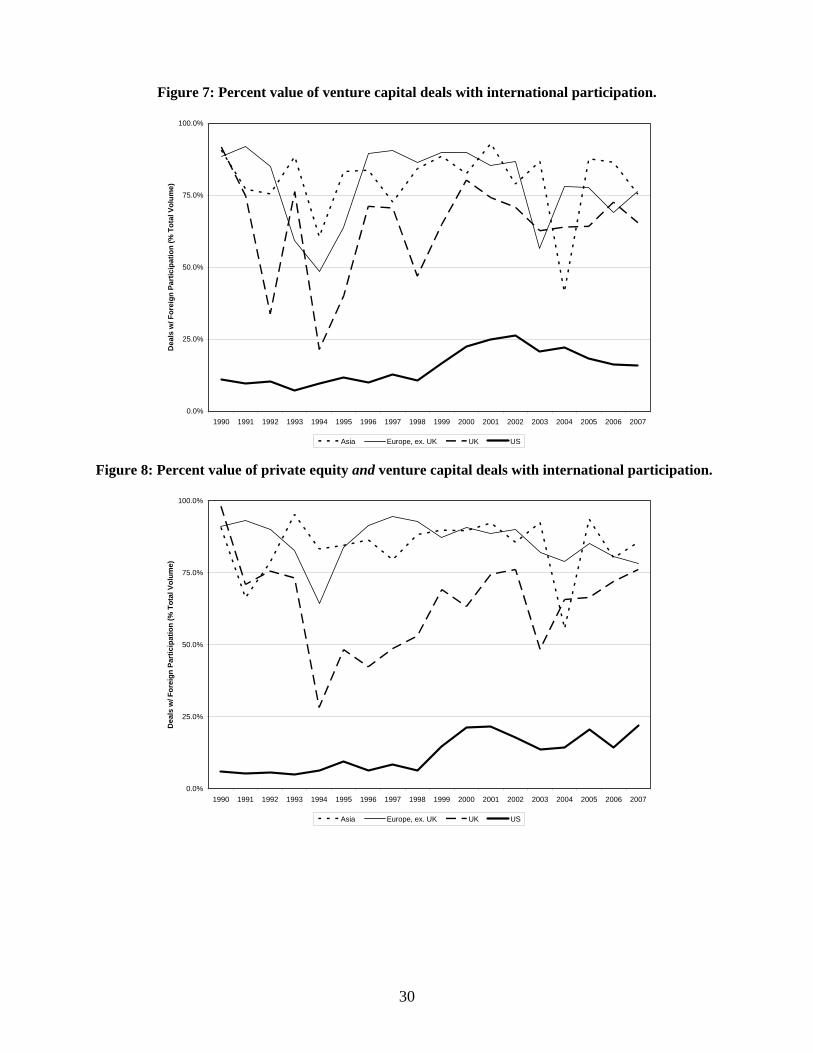
other markets. Figure 6 provides similar information for the sum of PE and VC volumes. Figure
7 shows the ratio of venture capital deals with cross-border participation to total deals in these
markets. The US stands out clearly as it’s venture capital and private equity deals are largely
domestically funded (though at a decreasing rate going into the 2000’s) whereas most other
regions feature a very high level of cross-border participation. In Asia and Europe about three
quarters of the deals had international participation for most of the sample period, while less than
quarter of the US deals had international participation. In the early 1990s, only 10% of the US
venture capital deals had international participation. The share reached about 25% by the end of
the IT boom in 2001 then plunged towards 15% by 2007. Figure 8 redoes Figure 7 for private
equity and venture capital, showing that similar patterns hold for the aggregate financing, with
the exception that internalization trend in the US, from close to 5% in the early 1990, recovered
in the aftermath of the IT bubble, reaching about 25% in 2007. The gap between Figure 7 and 8
reflects mostly the greater drop in VC activities relative to private equities in the US in the 2000s
and a strong recovery in cross-border PE investing since 2003 [see Price Waterhouse Coopers
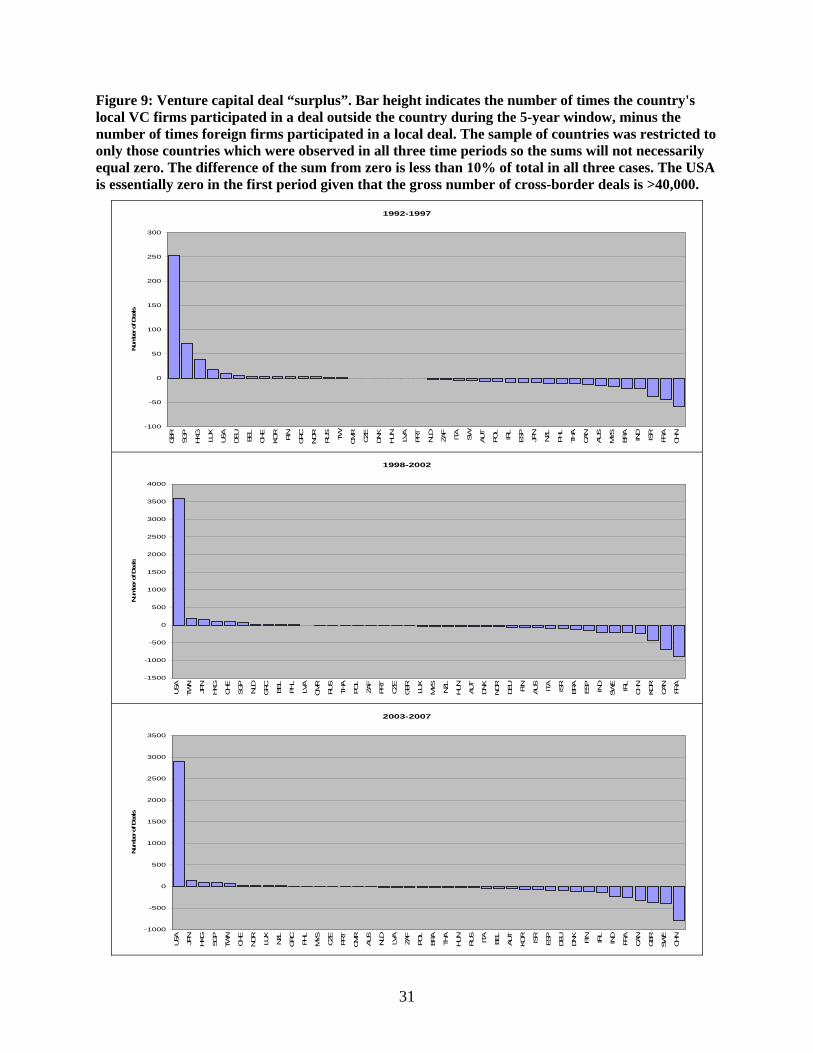
(2006)]. Figure 9 provides a measure of the “venture capital surplus” during 5-year windows,
defined as the number of times a domestic VC firm participated in a deal outside the country,
minus the number times a foreign firm participated in a deal within the country. It reveals the
emerging global dominance of the US as net exporter of VC deals through the 1990s. The US
was a net exporter of 14 deals during 1992-1997. This number is practically zero given that the
gross cross-border deal flow into and out of the US was over 20,000 each way. The US surplus
grew to just over 3500 during the IT boom years (1998-2002), leveling to about 3000 during
2003-7. While in the early 1990s there were four other countries with significant net export
position (UK, Singapore, Hong Kong and Luxemburg), the US has now became the dominant
VC net exporter, dwarfing all the other countries. The UK switched from being a sizable net
exporter of VC deals (more than 250 during 1992-7) to the second largest net importer during
7
2003-2007 (more than 350 deals). France, Israel, Canada, India and China are consistent net
importers of VC deals, with China emerging as the largest net importer of VC deals (approaching
800 during 2003-2007).
As a crude simplification, VC was a US grown phenomena, which helped the takeoff of
the US IT sector. The globalization of IT activities induced the US venture capital to mature,
and to start exporting their unique skills as VC managers, often following IT growth elsewhere
while continuing to dominate the VC of the US domestic market. This is reflected in the fast
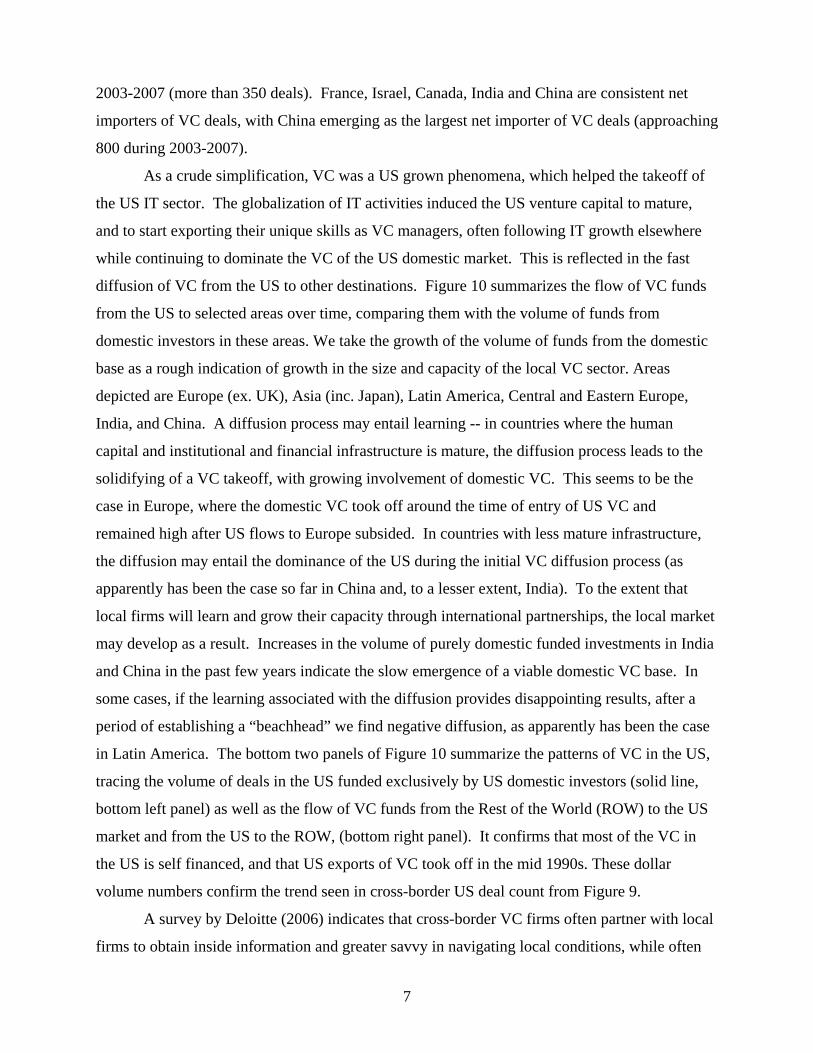
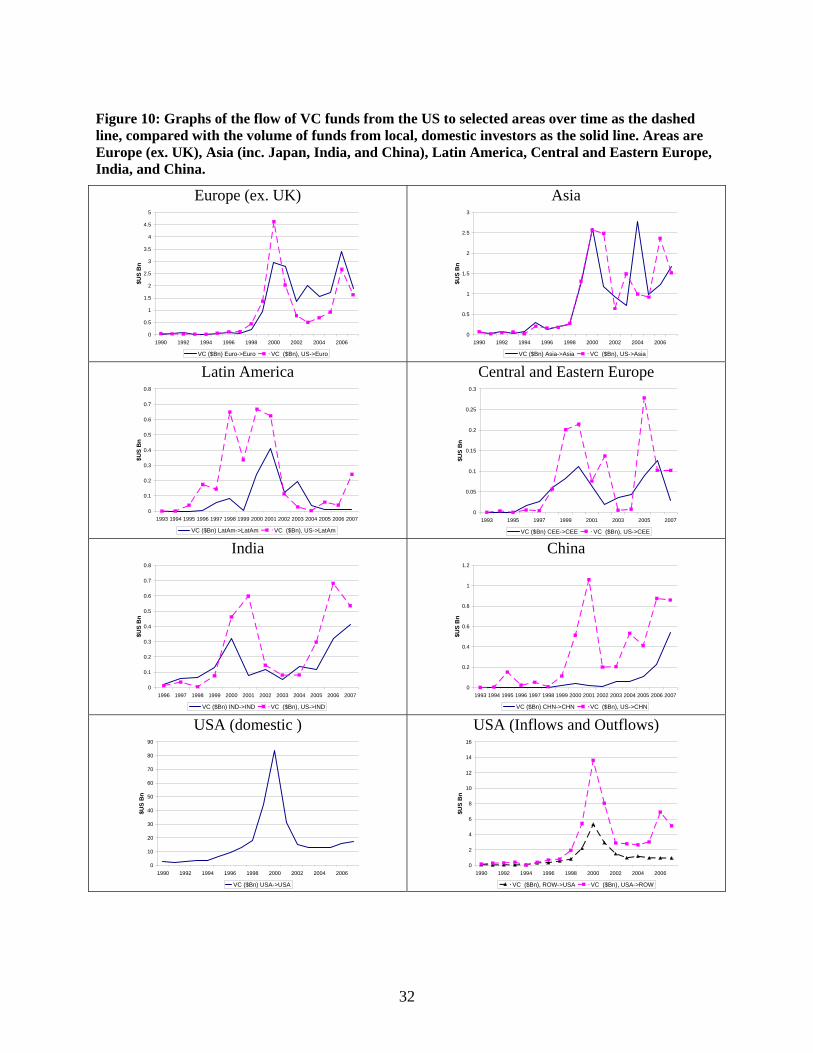
diffusion of VC from the US to other destinations. Figure 10 summarizes the flow of VC funds
from the US to selected areas over time, comparing them with the volume of funds from
domestic investors in these areas. We take the growth of the volume of funds from the domestic
base as a rough indication of growth in the size and capacity of the local VC sector. Areas
depicted are Europe (ex. UK), Asia (inc. Japan), Latin America, Central and Eastern Europe,
India, and China. A diffusion process may entail learning -- in countries where the human
capital and institutional and financial infrastructure is mature, the diffusion process leads to the
solidifying of a VC takeoff, with growing involvement of domestic VC. This seems to be the
case in Europe, where the domestic VC took off around the time of entry of US VC and
remained high after US flows to Europe subsided. In countries with less mature infrastructure,
the diffusion may entail the dominance of the US during the initial VC diffusion process (as
apparently has been the case so far in China and, to a lesser extent, India). To the extent that
local firms will learn and grow their capacity through international partnerships, the local market
may develop as a result. Increases in the volume of purely domestic funded investments in India
and China in the past few years indicate the slow emergence of a viable domestic VC base. In
some cases, if the learning associated with the diffusion provides disappointing results, after a
period of establishing a “beachhead” we find negative diffusion, as apparently has been the case
in Latin America. The bottom two panels of Figure 10 summarize the patterns of VC in the US,
tracing the volume of deals in the US funded exclusively by US domestic investors (solid line,
bottom left panel) as well as the flow of VC funds from the Rest of the World (ROW) to the US
market and from the US to the ROW, (bottom right panel). It confirms that most of the VC in
the US is self financed, and that US exports of VC took off in the mid 1990s. These dollar
volume numbers confirm the trend seen in cross-border US deal count from Figure 9.
A survey by Deloitte (2006) indicates that cross-border VC firms often partner with local
firms to obtain inside information and greater savvy in navigating local conditions, while often
8
providing a significant portion of the funds. Wright, Pruthi, and Lockett (2005) find that
international investors often take consistently different positions and act on different investment
criteria than local VC firms. Our data confirm the idea that there are additional observable
characteristics of international deals and the firms who engage in them that differ from their
domestic counterparts.
Tables 1-3 contain the results of a series of t-tests of equality of means between different
populations of deals and investor firms in our sample. We conduct these tests in five year
windows to chart the evolution of these differences over time. The windows are designed to
capture changes over the course of the internet bubble of 2001 and are broken down as 1992-
1997 (pre-bubble), 1998-2002 (bubble years), 2003-2007 (post-bubble).
Table 1 contains the results of t-tests of differences in means between the population of
PE and VC deals in our data set which feature international participation vs. those which do not.
The results indicate that deals with cross-border funding tend to be of greater value
(approximately 45%-55% larger, on average), and of greater value on a per investor basis
(approximately 25%-35% larger per investor, on average). They also tend to feature more
investors per deal that deals which are purely domestically funded (between 60% and 80% more
investors per deal). These results highlight the importance of cross-border deals as they tend to
be the larger and more capital intensive projects and likely involve more and bigger investor
firms since the share per firm is also larger. Additionally, the size difference appears to be
growing over time from the early 1990s onward.
Table 2 contains similar t-test results where the populations are no longer cross-border vs.
domestic deals but instead are broken down by low tech./high tech., venture capital/private
equity, and deals which feature participation by investors from the five largest venture capital
markets (including domestic deals in those markets) and those which do not. High technology
deals are defined by the main activity of the target company and include both biotech and IT or
internet related companies. The tests show that high tech deals are larger by a margin of
approximately 18% (from the late 1990’s onward). They also show that size of private equity
deals is larger than that of venture capital deals growing from around a 10% margin in the early
1990s to over 100% larger in the 2003-2007 window. Finally, we also see that firms from the
major venture capital markets of US, UK, Germany, France, and Canada tend to participate in
larger deals at home and abroad by a large margin of 80%-140% over their counterparts from
other countries.
9
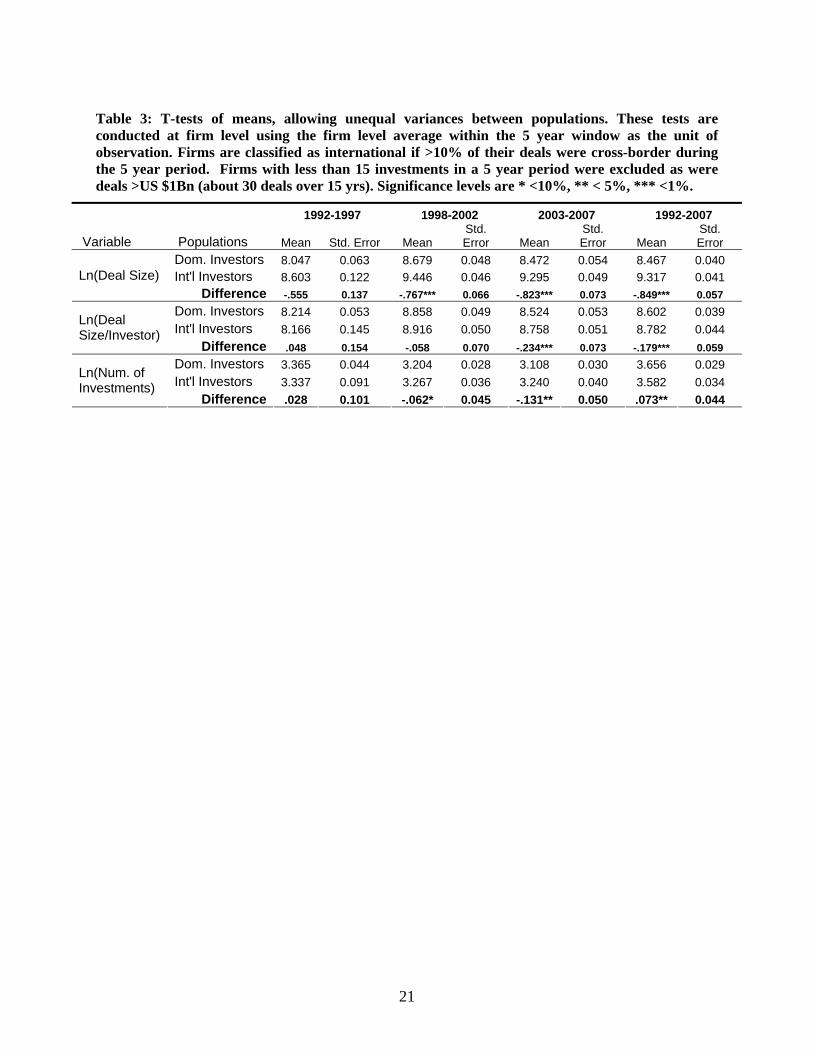
Table 3 contains the results of tests conducted at the firm-level, distinguishing between
investment firms which transacted more than 10% of their deals across-border (“international
firms”) versus firms which conduct less that 10% of their deals across-border (“domestic firms”).
To construct our units of observation, we average the size of deal in which each firm participated
in (both domestic and cross-border), the average size per investor of each deal (this reflects the
number of other investors whether they were domestic or international firms), and the number of
investments made all within the five year windows. To make the 10% threshold meaningful, we
drop firms from any five year window in which they had less than 15 total deals. We find that the
international firms in our data set participate in larger deals, especially after 1998, where the
margin grows from 75% in 1998-2002 to 82% in the 2003-2007 window. The deals they
participate in are larger on a per investor basis by a small and statistically insignificant amount
until the post bubble period (2003-2007) when the margin grows to 23% and is significant at 1%.
Similarly, the average number of deals done in a five year period by international firms is
essentially equivalent to that of domestic firms in the early 1990’s but grows to the statistically
significant margin of 13% greater by the 2003-2007 time period.
The picture these numbers paint is one of larger, more active firms engaging in cross-
border deals while smaller firms participate in domestic-only deals. 7 This phenomenon seems to
grow more pronounced over time. Additionally, the deals which feature cross-border
participation tend to be larger, feature a greater level of commitment per investor, and feature
more investors. The margins of these differences are also trending upward over time. Thus, the
importance of cross-border participation in private equity and venture capital deals is clear and
seems to have increased in recent years.
3. Regression Analysis
In the previous section we have documented the increase in cross border venture capital
and private equity flows, and the unique nature of these international deals (i.e. larger and
involving more investors). The globalization of private equity and venture capital is clearly well
underway and has potential to be an important source of funds for funding innovation and
financial reengineering around the world. In this section of the paper we seek to measure what
7 These results are in line with the insights provided by Melitz (2003).
10
factors facilitate the flows between countries and which local factors attract VC and PE flows to
an economy.
3.1 Empirical Strategy
We employ a basic gravity model structure to determine the drivers of cross border flows
of venture capital and private equity funds. Since much of the cross border activity is coming
from a few advanced economies, we focus primarily on the role of the characteristics of the
destination countries in attracting the flows. As with any standard gravity analysis, we also
include measures of the relationship between countries such as distance, whether or not they
share a common language, and colonial legacy.
We use both OLS and Poisson regression techniques to test two basic gravity
specifications.8 Both specifications feature measures of the deal flow between countries in both
the venture capital and private equity categories, and include the log of source and destination
country GDP, as well as the log of the distance between the countries, as is standard in gravity
models. In the OLS regressions, the LHS variable is the log of the value of deal flow between
countries, whereas in the Poisson regression, the LHS variable is the count of the number of
times a firm from the source country participated in a deal in the destination country.9
The first specification features both source and destination country dummies and tests the
role of variables that measure the relationship between countries such as distance, common
language, and a legacy of colonial dependence between the two. This gravity model is captured
by the following equation:
tjitjijitjitji Xy ,,,,,,, ')distanceln( εβααα +++++= (1)
Where tjiy ,, is the log of deal volume or, in the Poisson regressions, the count of the
number of deals from source country j to destination country i in year t. The vector X, are
8 We also attempted non-linear regressions, using the Poisson functional form but with the continuous volume data variable on the LHS as suggested for gravity models in Silva and Tenreyro (2006). We do not present these results as it was often impossible to obtain convergence for many of our chosen specifications. For those specifications that did converge, the key variables of interest were significant and of the proper sign. 9 The Poisson technique is in complementary and in some ways superior to OLS regressions because there are many country-pair-years for which there are only a few or zero deals, and the Poisson technique recognizes explicitly the discreet nature of the data.
11
measures of the relation between the source and destination countries (such as the presence of a
common language among their respective populations). Within this specification some
regressions include variables which measure path dependence such as the lagged average of
bilateral and total flow volumes as well as the number of firms active between two countries in
the past few years.
The second specification drops the destination country dummies and includes destination
country characteristics such as measures of financial development, institutional variables,
technical infrastructure, market size and sophistication, and educational attainment in the
population. This specification is designed to shed light on the question of what types of
economic environments attract international venture capital and private equity investments.
tjitjijitjtji Xy ,,,,,,, ')distanceln( εβαα ++++= (2)
Where now, iα has been dropped and tjiX ,, has been augmented by variables which measure
characteristics of the economy of i. Within these two gravity model specifications, we also
restrict the sample in various ways to see how the parameters change and what factors gain or
lose statistical significance.
Our main dependent variables are the log of the volume of venture capital funding, the
number of venture capital deals, the log of the value of private equity funding, and the number of
private equity deal. The values are summed over all deals originating in the source country that
fund target companies based in the destination country. Unfortunately, our deal level data do not
contain the actual amount invested by each investment firm but have only the name and
headquarters location of each investor as well as the total amount invested by all participating
investor firms. We take a uniform prior, and assume each investor invests the same amount,
assigning an equal fraction of each deal’s value to each investor. To calculate the flows between
each i,j-country pair in a given t-year, we sum the imputed deal shares for the (source) country j
investment firms’ deals which are destined for country i companies in year t. There are a large
number of i,j-pairings for which we observe zero flows in either private equity, venture capital,
or both. Zero flows are always a difficulty in the gravity specification. To deal with this issue, we
calculate the actual LHS variable as )1 flow of Valueln( + which makes the zero flow
observations ln(1)=0. We then drop observations for which we observe neither type of flow,
12
private equity nor venture capital, under the assumption that these “double zeros” represent a
different statistical process (including the possibility that no attention was being paid to those
two countries by Thomson VentureXpert staff) and thus do not belong in our regressions.10
We take a similar approach to calculating the count of deals for the Poisson regression,
counting all instances in which a firm from country j participated in a deal in country i in a given
year t.
3.2 Results of Regression Analysis
In this section we explore our regression results, looking first at the results of regressions
that include both source and destination country effects, which are designed to assess the role of
various types of connections between countries (colonial, previous VC activity, etc.) and second
at regressions which drop the destination country effects and include various destination country
specific measures to asses the role of these factors in promoting an environment that attracts
venture capital and private equity type investment by foreign parties. In the last part of this
section, we explore the determinants of average deal size and other refinements to the base
specifications.
Regressions with Both Source and Destination Country Effects
Table 4, shows the results of the gravity specification with both source and destination
country dummies (equation (1)) using OLS, Table 5 shows the same specifications using the
Poisson technique with deal counts rather than volumes on the LHS.11 The last two columns in
both tables are the baseline specification, the other columns contain lagged values of deal flows
or counts which proxy for the degree to which the private equity and venture capital community
in the source country are familiar with the destination country, and, possibly, expectations of
returns.
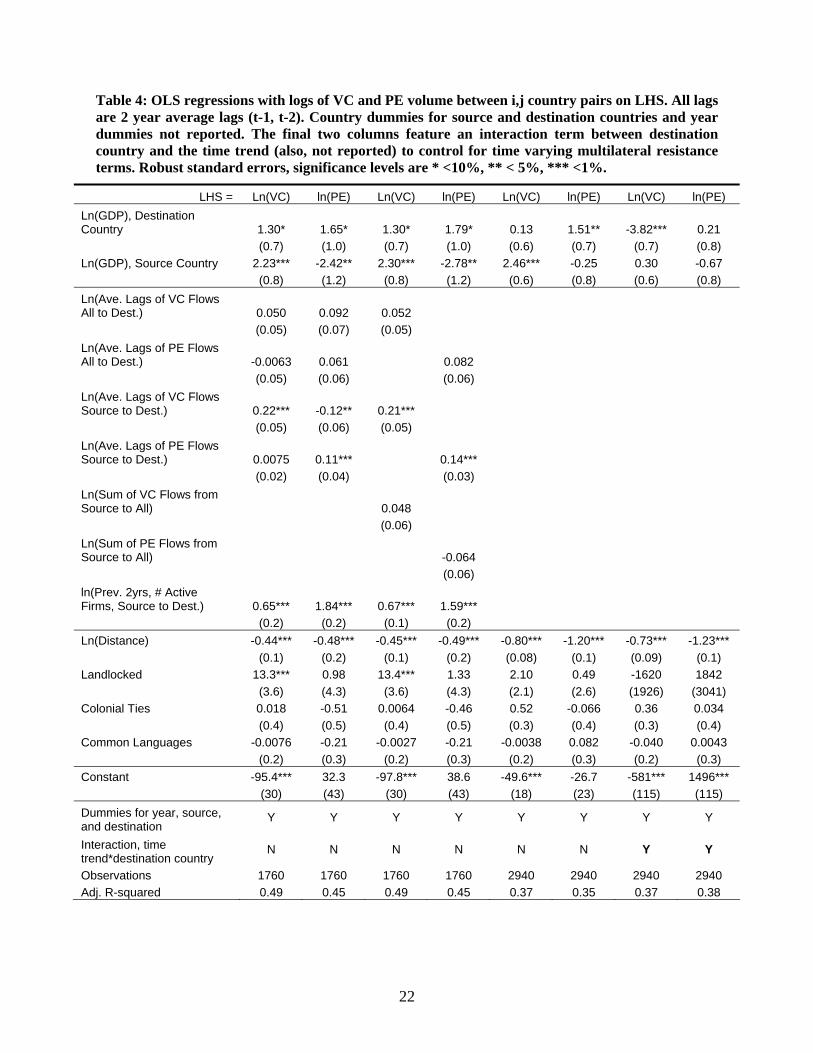
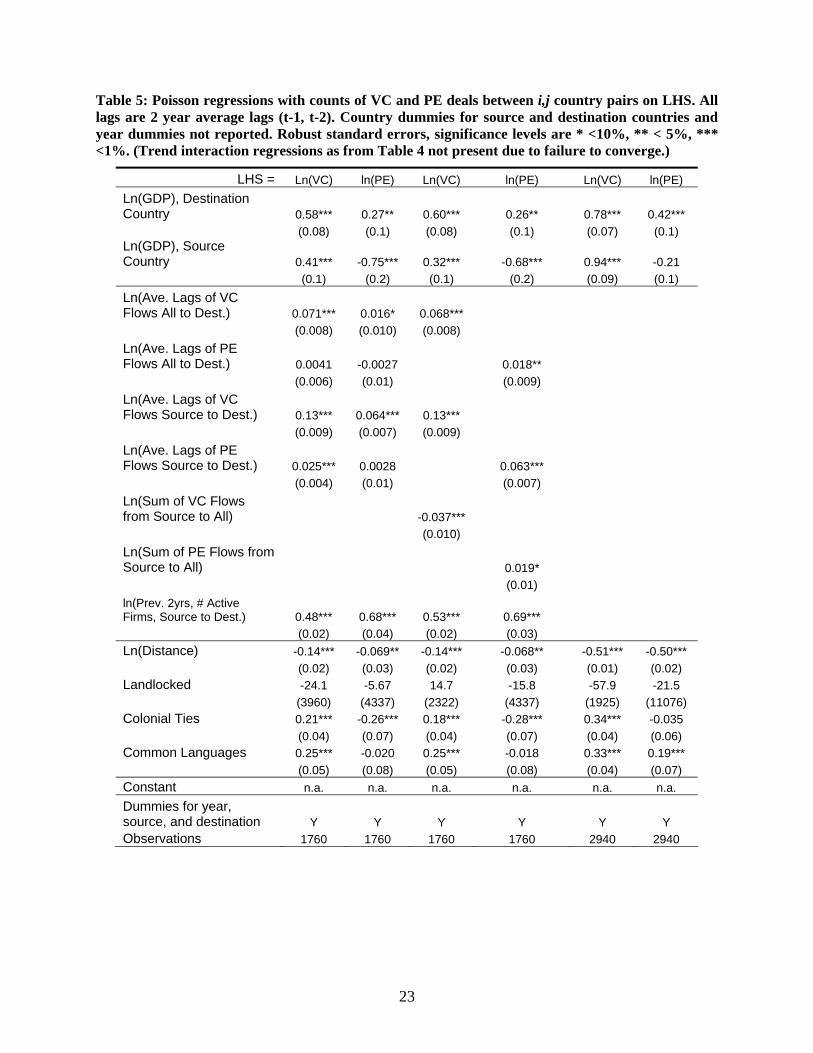
In both Table 4 and Table 5 we can see that distance is negatively related to deal volume
and deal count in all of the venture capital and private equity regressions. This is a strong result
indicating the powerful location bias in these types of investment activity. Conversations with
10 A perusal of the data supports this notion in the sense that most of these double zero observations are between developing or emerging market economies rather than between major economies with developed venture capital and private equity markets. 11 Table 4 also contains a regression where the time trend has been interacted with the destination country dummy to allow for time varying multilateral resistance terms. We did not include a Poisson version of this regression because it would not converge.
13
practitioners indicate that venture capitalists factor in travel costs when making decisions about
where to invest, especially in light of the intensive monitoring and advisory roles that these types
of investments require. Often, VC’s will choose a few cities in which to operate, sourcing several
deals in each city so as to economize on travel to that area. It is also likely that distance proxies
for several other factors including limited local information, dissimilarity of institutions, and lack
of social/business networks in distant countries [e.g. Sorenson and Stuart (2001) also document a
very strong location bias in domestic US firms due to inter-firm networking effects]. The
indicator variable for a past colonial relationship is also a significant predictor of venture capital
deal counts in all three Poisson specifications of Table 5 as well as in the baseline specification
of Table 4. This variable may also proxy for the extent of social and business networking
between the source and destination countries as well as for the similarity of institutions. The
dummy variable for a shared common language (another indicator of networks, communication
costs, and cultural similarity) is significant in the baseline Poisson regression predicting PE deal
counts and in all three of the VC regressions.
A study by Guler and Guillen (2005) finds that VC firms tend to replicate the foreign
entry patterns of their syndicate partners. Research by Sorensen and Stuart (2005) confirms the
importance of networking in the geographic location of VCs. The first through fourth columns of
Tables 4 and 5 show modified specifications which contain moving averages of the deal volumes
and counts between the two countries over the previous two years (t-1 and t-2). In columns three
and four, the venture capital regressions contain either the lagged volumes or lagged counts of
the venture capital deals between country i and j as well as the lagged volumes or counts of the
venture capital deals from all other source countries (all not j) to the destination countries. The
private equity specifications are similarly specified. We also include another lagged measure
which is the number of investment firms from the source country active in the destination
country in the previous two years. This variable is designed to separate out the effects of volume
(which may be driven by a few firms who have overcome the fixed costs of entry) from the
“popularity” of the destination across a number of firms more likely related to knowledge
diffusion. Finally, to asses the possibility that the supply of capital within the source country is
limited, we also include the contemporaneous sum of all deal volume or counts from the source
country to all other destination countries. In the first and second columns of Tables 4 and 5, we
open the specification up to include lags of private equity flows in the venture capital regression
and the lags of venture capital flows in the private equity regression to test for complementarities
14
between these two types of flows. Critically, we include both source and destination country
GDP and fixed effects to control for the size and growth rates of the two economies in generating
flows and lagged flows.
These regressions reveal some interesting patterns. First, there does seem to be
persistence in venture capital and private equity flows even when controlling for source and
destination country fixed effects and GDP growth. In Table 4 and 5, the lagged values of the
LHS variable between source and destination are significant in all but one regression (PE). We
believe this argues strongly for a path-dependency in VC and PE flows. One candidate
mechanism for this type of effect are the fixed costs to establishing a “beach-head” in a foreign
country such as travel, learning the local market, establishing relationships with local partners,
hiring staff familiar with the foreign market, and possibly setting up satellite offices. A related
possibility is that the diffusion of information amongst source country firms engenders a “follow
the leader” type of dynamic. Tables 4 and 5 also show that the variable capturing the lag of the
number of active firms is also significant in all specifications which may proxy for how well
known the destination is amongst source country firms. Based on these results, we believe that
fixed costs (or a “beachhead effect”), and inter-firm networks (or a “follow the leader effect”)
may both be at work.
In the first and second column of Table 5 (though not in Table 4), the lag of the flows
which are not on the LHS are also seen to be positive and significant. Thus, the lag of PE deal
count is positive and significant in the VC regression and vice versa. This result indicate that, for
instance, VC firms may be aware of both the activities of VC and PE firms from their home
country as well as the activities of VC and PE firms from other countries as they enter the
destination country. Additionally, the lag of the deal count of the PE or VC coming from all
other source countries is also significant but negative in the case of VC indicating the possibility
of supply constraints which make investments in one destination country substitutes for investing
in another.
The results show that the distance, colonial history, and language connections between
countries are useful predictors of where venture capital and private equity will flow. These
results parallel those in Portes and Rey (2005) and the other financial gravity models of
international investment flows mentioned above. The results also show interesting dynamic
patterns indicating that – not only do venture and private equity funds follow the lead of firms in
the same source country – they may also follow the lead of investors from other countries into
15
the destination country. The fact that the lag of the number of firms operating in the country is
significant even when controlling for the volume of investments, GDP growth, and distance
leads us to believe that these effects are not simply be capital chasing an economic boom or
overcoming fixed entry costs but the results of the increased visibility of the destination country
in the investment community (i.e. a “follow the leader” effect).
Regressions with Destination Country Characteristics
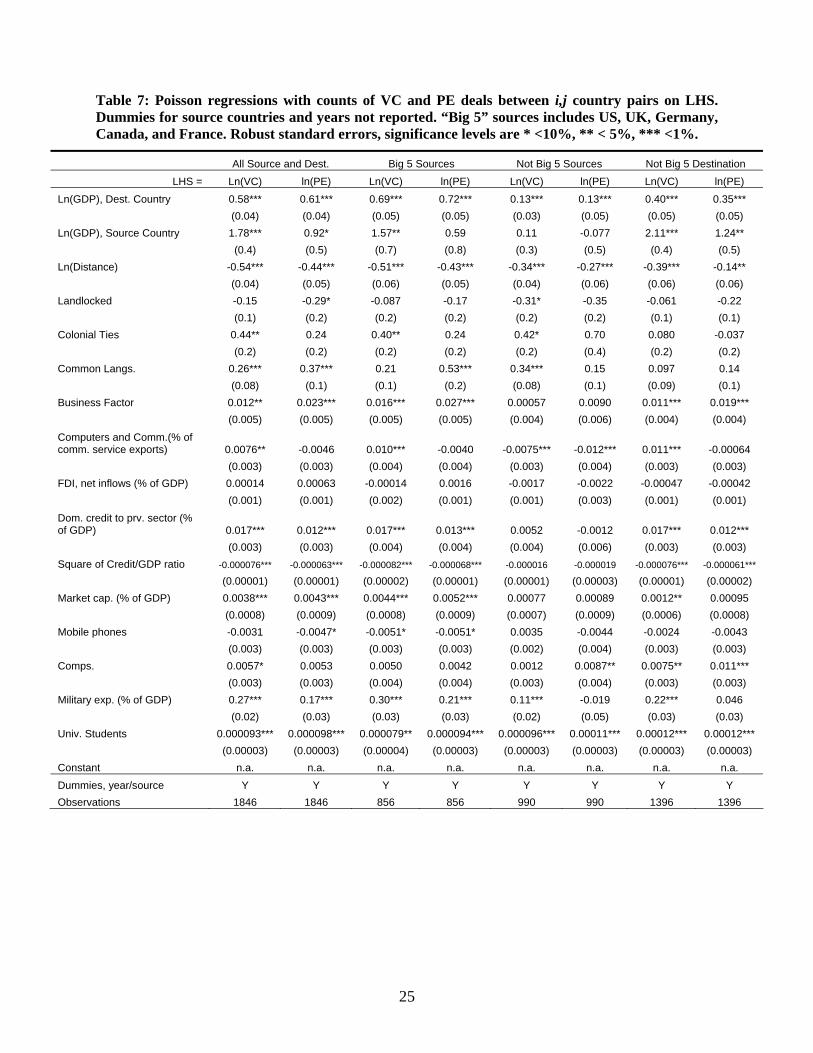
Tables 6 and 7 contain the results of OLS regressions and Poisson regressions
respectively, using the gravity specification without destination country effects but including
variables which measure destination country characteristics (equation (2)). Without much theory
to guide us on this topic, we might expect that the conditions that attract foreign VC and PE
flows are similar to those which allow for growth in the size of the domestic market. This is
indeed what we find.
Full Sample and “Big 5” Sources
The first through fourth columns of these two tables contain regressions with the full
sample, and with the sample restricted to VC and PE flows originating in the “Big 5” source
countries of US, UK, Germany, France, and Canada where a majority of these funds originate.
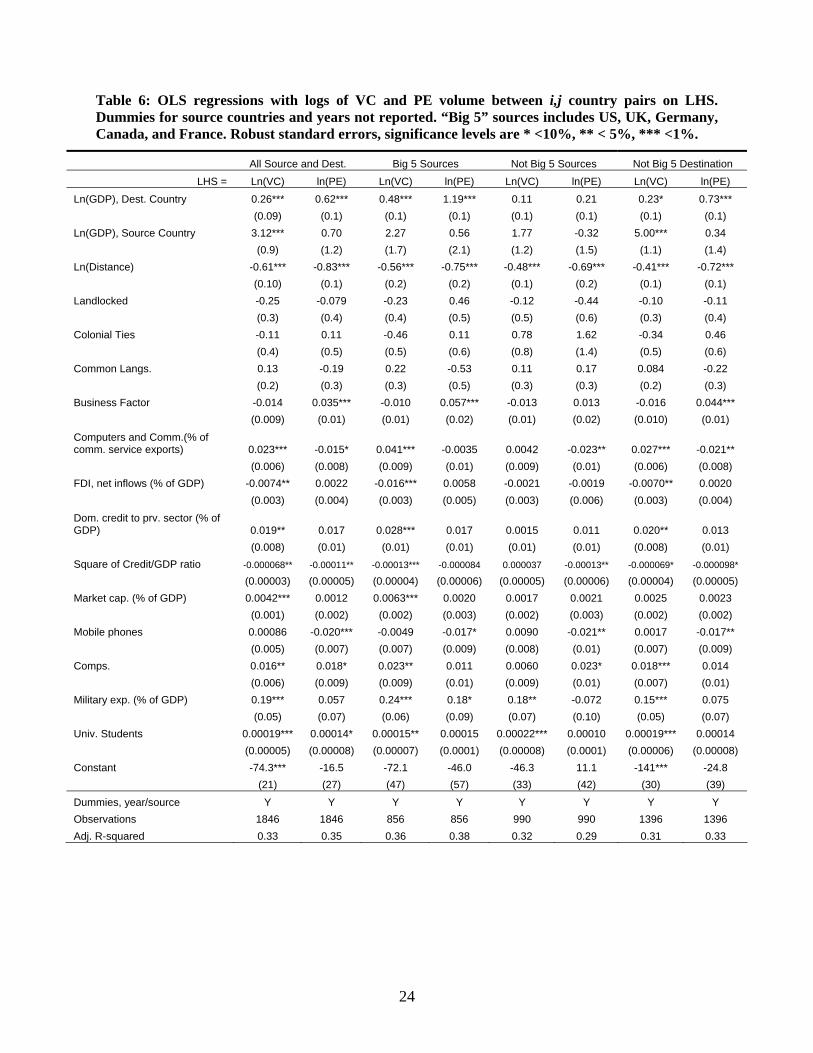
We find that institutions matter, as captured by our business institution factor, at least in the first
four columns of Table 7, which are Poisson regressions of VC and PE deal counts in the full
sample and restricted to the main VC/PE source countries.12 This result is in concordance with
research that finds institutions a critical determinant of the ability of VCs to operate [see, e.g.
Jeng and Wells (2000), Gompers and Lerner (2001), and Guler and Guillen (2005)]. We also find
that a measure of orientation of the local economy towards high-tech, measured by the
percentage of computers and communications services in commercial services exports, is
positive and significant in the main specifications of both the Poisson and OLS regressions. An
even stronger and possibly related result is that the number of university students per 1000
population, a measure of high quality human capital, is positive and significant in all the Poisson
regressions and many of the VC related OLS regressions. Both of these results are in line with
other research which finds that the entrepreneurial environment is a critical factor for the
development of the VC industry [see, e.g. Romaine and Van Pottelsberghe (2004) and Da Rin,
12 The “Big 5” source countries, in our dataset, are US, UK, Germany, Canada, and France.
16
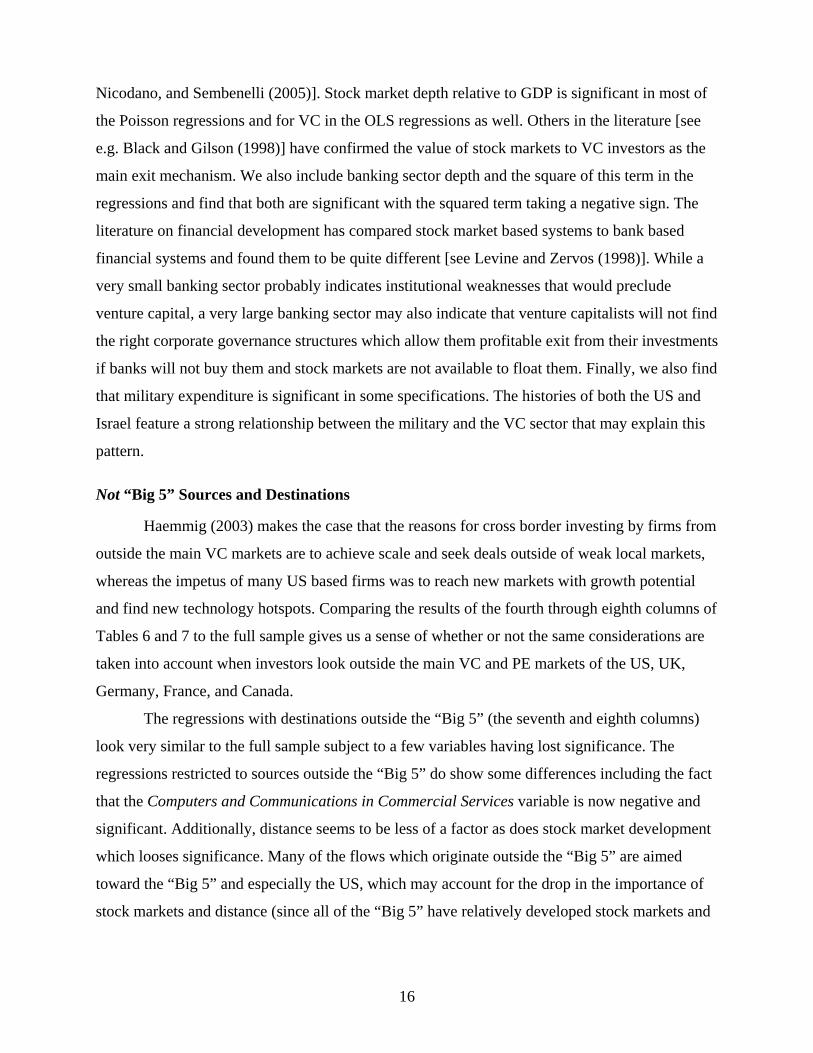
Nicodano, and Sembenelli (2005)]. Stock market depth relative to GDP is significant in most of
the Poisson regressions and for VC in the OLS regressions as well. Others in the literature [see
e.g. Black and Gilson (1998)] have confirmed the value of stock markets to VC investors as the
main exit mechanism. We also include banking sector depth and the square of this term in the
regressions and find that both are significant with the squared term taking a negative sign. The
literature on financial development has compared stock market based systems to bank based
financial systems and found them to be quite different [see Levine and Zervos (1998)]. While a
very small banking sector probably indicates institutional weaknesses that would preclude
venture capital, a very large banking sector may also indicate that venture capitalists will not find
the right corporate governance structures which allow them profitable exit from their investments
if banks will not buy them and stock markets are not available to float them. Finally, we also find
that military expenditure is significant in some specifications. The histories of both the US and
Israel feature a strong relationship between the military and the VC sector that may explain this
pattern.
Not “Big 5” Sources and Destinations
Haemmig (2003) makes the case that the reasons for cross border investing by firms from
outside the main VC markets are to achieve scale and seek deals outside of weak local markets,
whereas the impetus of many US based firms was to reach new markets with growth potential
and find new technology hotspots. Comparing the results of the fourth through eighth columns of
Tables 6 and 7 to the full sample gives us a sense of whether or not the same considerations are
taken into account when investors look outside the main VC and PE markets of the US, UK,
Germany, France, and Canada.
The regressions with destinations outside the “Big 5” (the seventh and eighth columns)
look very similar to the full sample subject to a few variables having lost significance. The
regressions restricted to sources outside the “Big 5” do show some differences including the fact
that the Computers and Communications in Commercial Services variable is now negative and
significant. Additionally, distance seems to be less of a factor as does stock market development
which looses significance. Many of the flows which originate outside the “Big 5” are aimed
toward the “Big 5” and especially the US, which may account for the drop in the importance of
stock markets and distance (since all of the “Big 5” have relatively developed stock markets and
17
distance may not matter as much in sending funds to well known destinations) and the change in
the other coefficients.
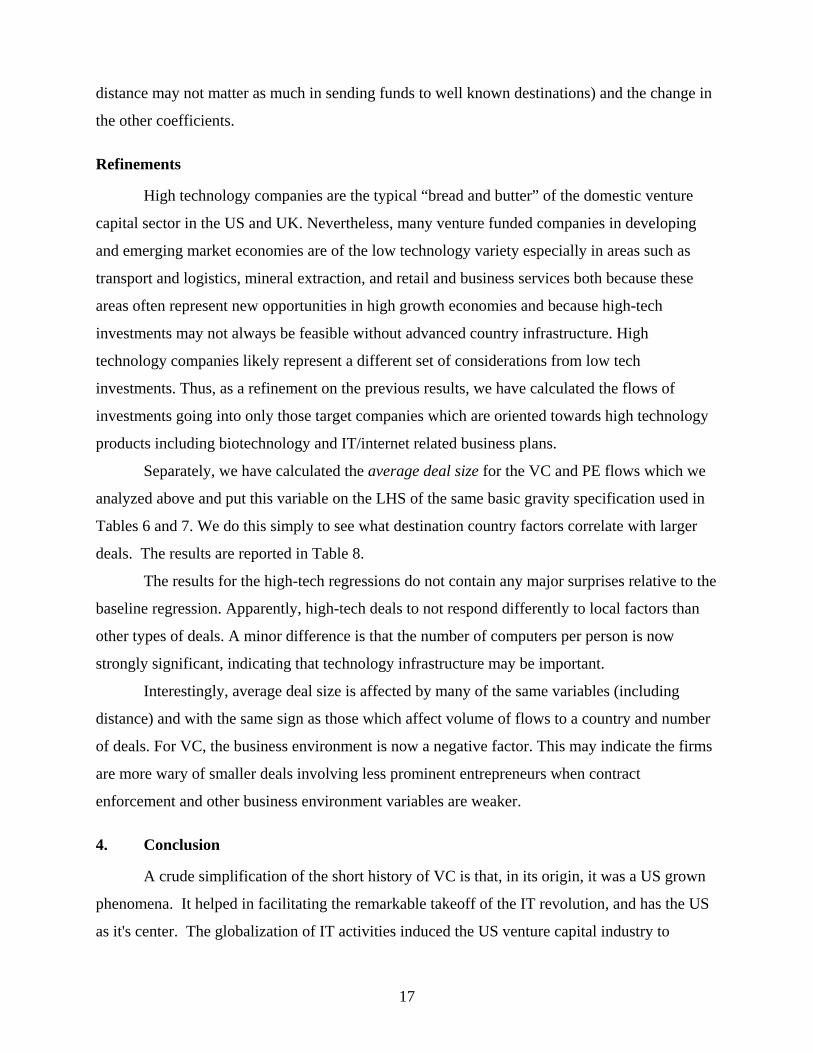
Refinements
High technology companies are the typical “bread and butter” of the domestic venture
capital sector in the US and UK. Nevertheless, many venture funded companies in developing
and emerging market economies are of the low technology variety especially in areas such as
transport and logistics, mineral extraction, and retail and business services both because these
areas often represent new opportunities in high growth economies and because high-tech
investments may not always be feasible without advanced country infrastructure. High
technology companies likely represent a different set of considerations from low tech
investments. Thus, as a refinement on the previous results, we have calculated the flows of
investments going into only those target companies which are oriented towards high technology
products including biotechnology and IT/internet related business plans.
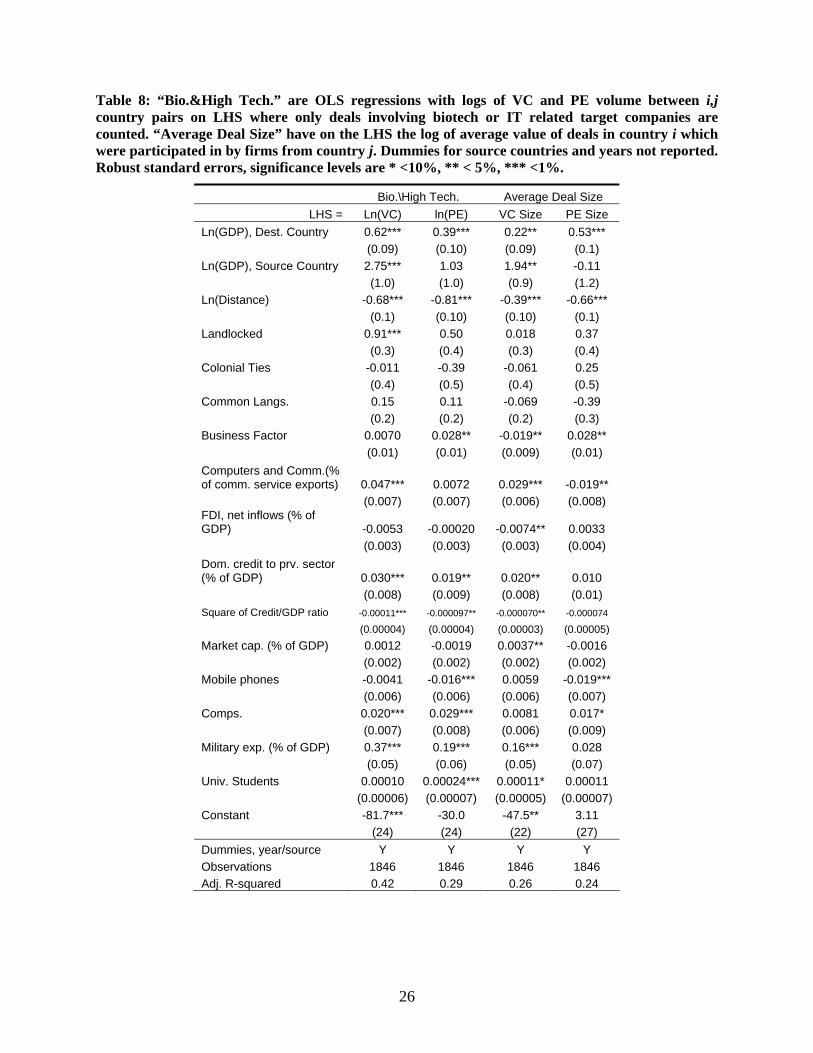
Separately, we have calculated the average deal size for the VC and PE flows which we
analyzed above and put this variable on the LHS of the same basic gravity specification used in
Tables 6 and 7. We do this simply to see what destination country factors correlate with larger
deals. The results are reported in Table 8.
The results for the high-tech regressions do not contain any major surprises relative to the
baseline regression. Apparently, high-tech deals to not respond differently to local factors than
other types of deals. A minor difference is that the number of computers per person is now
strongly significant, indicating that technology infrastructure may be important.
Interestingly, average deal size is affected by many of the same variables (including
distance) and with the same sign as those which affect volume of flows to a country and number
of deals. For VC, the business environment is now a negative factor. This may indicate the firms
are more wary of smaller deals involving less prominent entrepreneurs when contract
enforcement and other business environment variables are weaker.
4. Conclusion
A crude simplification of the short history of VC is that, in its origin, it was a US grown
phenomena. It helped in facilitating the remarkable takeoff of the IT revolution, and has the US
as it's center. The globalization of IT activities induced the US venture capital industry to

18
mature, and to start exporting its unique skills as VC managers, while continuing to dominate the
VC of the domestic market. This is reflected by the continuing of strong home bias of the VC in
the US, where most of the activities are funded by US based deals, with growing diffusion of VC
from the US to other destinations, making the US the dominant exporter of VC deals, at time
where outside the US, the internalization of VC capital remains the rule.
19
References
Aizenman J. and N. P. Marion (2004), “The merits of horizontal versus vertical FDI in the presence of uncertainty,” Journal of International Economics, 62, pp 125-148.
Anderson E. J. and E Van Wincoop (2004), “Trade Costs,” Journal of Economic Literature, 42, 3, pp. 691-751.
Blonigen, B. A. (2005), “A Review of the Empirical Literature on FDI Determinants,” NBER Working paper # 11299.
Black B. S. and R. J. Gillson (1998), "Venture Capital and the Structure of Capital Markets: Banks versus Stock Markets," Journal of Financial Economics, Vol. 47, pp. 243-277.
Da Rin, N., G. Nicodano and A. Sembenelli (2005), “Public Policy and the Creation of Active Venture Capital Markets,” European Central Bank Working Paper Series, No. 430.
Deloitte (2006), “Global Trends in Venture Capital, 2006 Survey” sponsored by Deloitte & Touche LLP.
Gompers P. and J. Lerner (2001), “The Venture Capital Revolution,” The Journal of Economic Perspectives, 15, 2, pp. 145-168.
Guler I. and M. F. Guillen (2005), “Knowledge, Institutions, and Foreign Entry: The Internationalization of US Venture Capital Firms”, working paper draft.
Haemmig M. (2003), The Globalization of Venture Capital –Haupt Verlag, Berne, 2003. Jeng L. A. and P. C. Wells (2000), “The Determinants of Venture Capital Funding: Evidence
Across Countries” working paper. Kortum S. and J. Lerner (2000), “Assessing the Contribution of Venture Capital to Innovation”
The RAND Journal of Economics, 31, 4, pp. 674-692. Lerner, J., (2001), Venture Capital, Technological Innovation, and Growth (Boston: Harvard
Business School). Levine, R. and Zervos, S. (1998), “Stock Markets, Banks, and Economic Growth”, American
Economic Review, Vol. 88, No. 3. Melitz M. J. (2003), “The Impact of Trade on Intra-Industry Reallocations and Aggregate
Industry Productivity,” Econometrica, 71, 6, pp. 1695-1725. Portes R. and H. Rey (2005), “The Determinants of Cross-Border Equity Flows,” Journal of
International Economics, 65, pp 269-296. Price Waterhouse Coopers (2006), “Global Private Equity Report”, report by Price Waterhouse
Coopers, LLC. Romain A. and B. Van Pottelsberghe (2004), “The Determinants of Venture Capital: A Panel
Analysis in 16 OECD Countries”, working paper draft. Rose A. K. and M. M. Spiegel (2004) “A Gravity Model of Sovereign Lending: Trade, Default,
and Credit,” IMF Staff Papers, 51, pp. 50-63. Silva J. M. C. S. and S. Tenreyro (2006), “The Log of Gravity,” The Review of Economics and
Statistics, 641-658. Sorenson O. and T. Stuart (2001), “Syndication Networks and the Spatial Distribution of Venture
Capital Investments,” American Journal of Sociology, Volume 106 Number 6. Wilson, R. (1983), The New Ventures – Inside the High Stakes World of Venture Capital,
Addison Wesley Publishing Company. Wright, P. W. Pruthi and A. Lockett (2005), “Do Foreign and Domestic Venture Capital Firms
Differ in Their Monitoring of Investees?” Asia Pacific Journal of Management, 20, pp. 175-204.
20
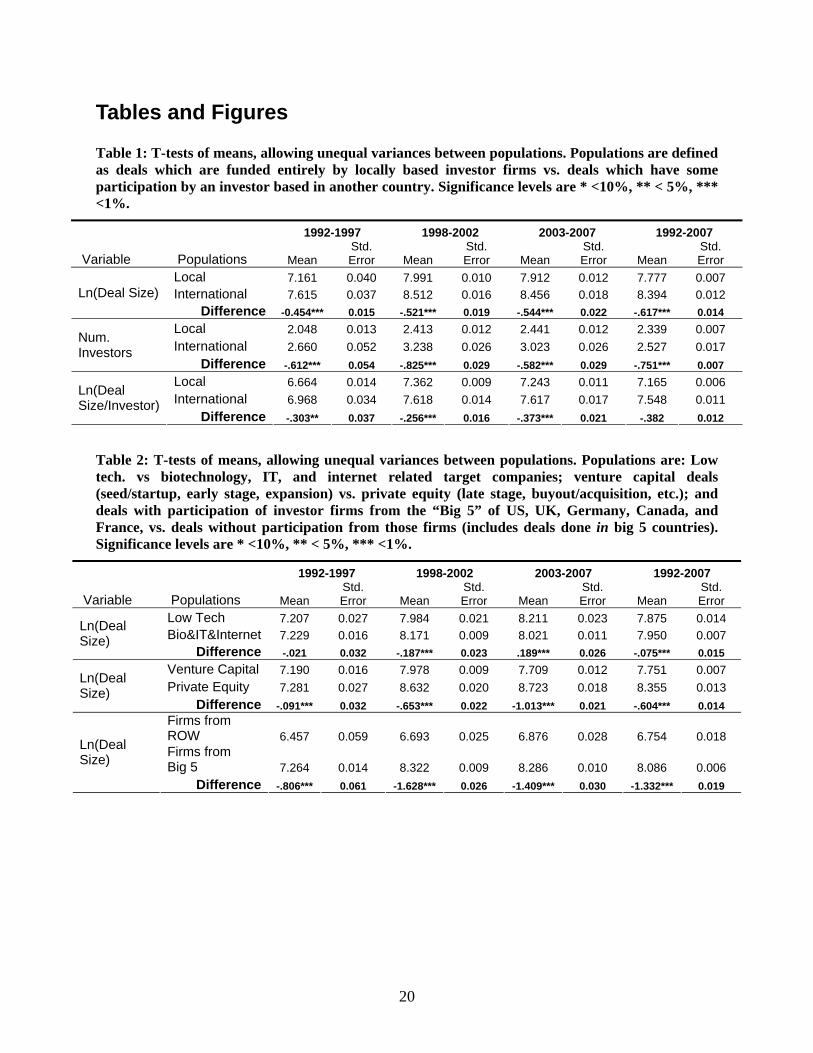
Tables and Figures
Table 1: T-tests of means, allowing unequal variances between populations. Populations are defined as deals which are funded entirely by locally based investor firms vs. deals which have some participation by an investor based in another country. Significance levels are * <10%, ** < 5%, *** <1%.
1992-1997 1998-2002 2003-2007 1992-2007
Variable Populations Mean Std. Error Mean
Std. Error Mean
Std. Error Mean
Std. Error
Local 7.161 0.040 7.991 0.010 7.912 0.012 7.777 0.007 International 7.615 0.037 8.512 0.016 8.456 0.018 8.394 0.012 Ln(Deal Size)
Difference -0.454*** 0.015 -.521*** 0.019 -.544*** 0.022 -.617*** 0.014 Local 2.048 0.013 2.413 0.012 2.441 0.012 2.339 0.007 International 2.660 0.052 3.238 0.026 3.023 0.026 2.527 0.017
Num. Investors
Difference -.612*** 0.054 -.825*** 0.029 -.582*** 0.029 -.751*** 0.007 Local 6.664 0.014 7.362 0.009 7.243 0.011 7.165 0.006 International 6.968 0.034 7.618 0.014 7.617 0.017 7.548 0.011
Ln(Deal Size/Investor)
Difference -.303** 0.037 -.256*** 0.016 -.373*** 0.021 -.382 0.012 Table 2: T-tests of means, allowing unequal variances between populations. Populations are: Low tech. vs biotechnology, IT, and internet related target companies; venture capital deals (seed/startup, early stage, expansion) vs. private equity (late stage, buyout/acquisition, etc.); and deals with participation of investor firms from the “Big 5” of US, UK, Germany, Canada, and France, vs. deals without participation from those firms (includes deals done in big 5 countries). Significance levels are * <10%, ** < 5%, *** <1%.
1992-1997 1998-2002 2003-2007 1992-2007
Variable Populations Mean Std. Error Mean
Std. Error Mean
Std. Error Mean
Std. Error
Low Tech 7.207 0.027 7.984 0.021 8.211 0.023 7.875 0.014 Bio&IT&Internet 7.229 0.016 8.171 0.009 8.021 0.011 7.950 0.007
Ln(Deal Size)
Difference -.021 0.032 -.187*** 0.023 .189*** 0.026 -.075*** 0.015 Venture Capital 7.190 0.016 7.978 0.009 7.709 0.012 7.751 0.007 Private Equity 7.281 0.027 8.632 0.020 8.723 0.018 8.355 0.013
Ln(Deal Size)
Difference -.091*** 0.032 -.653*** 0.022 -1.013*** 0.021 -.604*** 0.014 Firms from ROW 6.457 0.059 6.693 0.025 6.876 0.028 6.754 0.018 Firms from Big 5 7.264 0.014 8.322 0.009 8.286 0.010 8.086 0.006
Ln(Deal Size)
Difference -.806*** 0.061 -1.628*** 0.026 -1.409*** 0.030 -1.332*** 0.019
21
Table 3: T-tests of means, allowing unequal variances between populations. These tests are conducted at firm level using the firm level average within the 5 year window as the unit of observation. Firms are classified as international if >10% of their deals were cross-border during the 5 year period. Firms with less than 15 investments in a 5 year period were excluded as were deals >US $1Bn (about 30 deals over 15 yrs). Significance levels are * <10%, ** < 5%, *** <1%.
1992-1997 1998-2002 2003-2007 1992-2007
Variable Populations Mean Std. Error Mean Std. Error Mean
Std. Error Mean
Std. Error
Dom. Investors 8.047 0.063 8.679 0.048 8.472 0.054 8.467 0.040 Int'l Investors 8.603 0.122 9.446 0.046 9.295 0.049 9.317 0.041 Ln(Deal Size)
Difference -.555 0.137 -.767*** 0.066 -.823*** 0.073 -.849*** 0.057 Dom. Investors 8.214 0.053 8.858 0.049 8.524 0.053 8.602 0.039 Int'l Investors 8.166 0.145 8.916 0.050 8.758 0.051 8.782 0.044
Ln(Deal Size/Investor)
Difference .048 0.154 -.058 0.070 -.234*** 0.073 -.179*** 0.059 Dom. Investors 3.365 0.044 3.204 0.028 3.108 0.030 3.656 0.029 Int'l Investors 3.337 0.091 3.267 0.036 3.240 0.040 3.582 0.034
Ln(Num. of Investments)
Difference .028 0.101 -.062* 0.045 -.131** 0.050 .073** 0.044
22
Table 4: OLS regressions with logs of VC and PE volume between i,j country pairs on LHS. All lags are 2 year average lags (t-1, t-2). Country dummies for source and destination countries and year dummies not reported. The final two columns feature an interaction term between destination country and the time trend (also, not reported) to control for time varying multilateral resistance terms. Robust standard errors, significance levels are * <10%, ** < 5%, *** <1%.
LHS = Ln(VC) ln(PE) Ln(VC) ln(PE) Ln(VC) ln(PE) Ln(VC) ln(PE) Ln(GDP), Destination Country 1.30* 1.65* 1.30* 1.79* 0.13 1.51** -3.82*** 0.21 (0.7) (1.0) (0.7) (1.0) (0.6) (0.7) (0.7) (0.8) Ln(GDP), Source Country 2.23*** -2.42** 2.30*** -2.78** 2.46*** -0.25 0.30 -0.67 (0.8) (1.2) (0.8) (1.2) (0.6) (0.8) (0.6) (0.8) Ln(Ave. Lags of VC Flows All to Dest.) 0.050 0.092 0.052
(0.05) (0.07) (0.05) Ln(Ave. Lags of PE Flows All to Dest.) -0.0063 0.061 0.082
(0.05) (0.06) (0.06) Ln(Ave. Lags of VC Flows Source to Dest.) 0.22*** -0.12** 0.21***
(0.05) (0.06) (0.05) Ln(Ave. Lags of PE Flows Source to Dest.) 0.0075 0.11*** 0.14***
(0.02) (0.04) (0.03) Ln(Sum of VC Flows from Source to All)
0.048
(0.06) Ln(Sum of PE Flows from Source to All)
-0.064
(0.06) ln(Prev. 2yrs, # Active Firms, Source to Dest.) 0.65*** 1.84*** 0.67*** 1.59***
(0.2) (0.2) (0.1) (0.2) Ln(Distance) -0.44*** -0.48*** -0.45*** -0.49*** -0.80*** -1.20*** -0.73*** -1.23*** (0.1) (0.2) (0.1) (0.2) (0.08) (0.1) (0.09) (0.1) Landlocked 13.3*** 0.98 13.4*** 1.33 2.10 0.49 -1620 1842 (3.6) (4.3) (3.6) (4.3) (2.1) (2.6) (1926) (3041) Colonial Ties 0.018 -0.51 0.0064 -0.46 0.52 -0.066 0.36 0.034 (0.4) (0.5) (0.4) (0.5) (0.3) (0.4) (0.3) (0.4) Common Languages -0.0076 -0.21 -0.0027 -0.21 -0.0038 0.082 -0.040 0.0043 (0.2) (0.3) (0.2) (0.3) (0.2) (0.3) (0.2) (0.3) Constant -95.4*** 32.3 -97.8*** 38.6 -49.6*** -26.7 -581*** 1496*** (30) (43) (30) (43) (18) (23) (115) (115) Dummies for year, source, and destination
Y Y Y Y Y Y Y Y
Interaction, time trend*destination country
N N N N N N Y Y
Observations 1760 1760 1760 1760 2940 2940 2940 2940 Adj. R-squared 0.49 0.45 0.49 0.45 0.37 0.35 0.37 0.38
23
Table 5: Poisson regressions with counts of VC and PE deals between i,j country pairs on LHS. All lags are 2 year average lags (t-1, t-2). Country dummies for source and destination countries and year dummies not reported. Robust standard errors, significance levels are * <10%, ** < 5%, *** <1%. (Trend interaction regressions as from Table 4 not present due to failure to converge.)
LHS = Ln(VC) ln(PE) Ln(VC) ln(PE) Ln(VC) ln(PE) Ln(GDP), Destination Country 0.58*** 0.27** 0.60*** 0.26** 0.78*** 0.42*** (0.08) (0.1) (0.08) (0.1) (0.07) (0.1) Ln(GDP), Source Country 0.41*** -0.75*** 0.32*** -0.68*** 0.94*** -0.21 (0.1) (0.2) (0.1) (0.2) (0.09) (0.1) Ln(Ave. Lags of VC Flows All to Dest.) 0.071*** 0.016* 0.068*** (0.008) (0.010) (0.008) Ln(Ave. Lags of PE Flows All to Dest.) 0.0041 -0.0027 0.018** (0.006) (0.01) (0.009) Ln(Ave. Lags of VC Flows Source to Dest.) 0.13*** 0.064*** 0.13*** (0.009) (0.007) (0.009) Ln(Ave. Lags of PE Flows Source to Dest.) 0.025*** 0.0028 0.063*** (0.004) (0.01) (0.007) Ln(Sum of VC Flows from Source to All) -0.037*** (0.010) Ln(Sum of PE Flows from Source to All) 0.019* (0.01) ln(Prev. 2yrs, # Active Firms, Source to Dest.) 0.48*** 0.68*** 0.53*** 0.69*** (0.02) (0.04) (0.02) (0.03) Ln(Distance) -0.14*** -0.069** -0.14*** -0.068** -0.51*** -0.50*** (0.02) (0.03) (0.02) (0.03) (0.01) (0.02) Landlocked -24.1 -5.67 14.7 -15.8 -57.9 -21.5 (3960) (4337) (2322) (4337) (1925) (11076) Colonial Ties 0.21*** -0.26*** 0.18*** -0.28*** 0.34*** -0.035 (0.04) (0.07) (0.04) (0.07) (0.04) (0.06) Common Languages 0.25*** -0.020 0.25*** -0.018 0.33*** 0.19*** (0.05) (0.08) (0.05) (0.08) (0.04) (0.07) Constant n.a. n.a. n.a. n.a. n.a. n.a. Dummies for year, source, and destination Y Y Y Y Y Y Observations 1760 1760 1760 1760 2940 2940
24
Table 6: OLS regressions with logs of VC and PE volume between i,j country pairs on LHS. Dummies for source countries and years not reported. “Big 5” sources includes US, UK, Germany, Canada, and France. Robust standard errors, significance levels are * <10%, ** < 5%, *** <1%.
All Source and Dest. Big 5 Sources Not Big 5 Sources Not Big 5 Destination LHS = Ln(VC) ln(PE) Ln(VC) ln(PE) Ln(VC) ln(PE) Ln(VC) ln(PE)
Ln(GDP), Dest. Country 0.26*** 0.62*** 0.48*** 1.19*** 0.11 0.21 0.23* 0.73*** (0.09) (0.1) (0.1) (0.1) (0.1) (0.1) (0.1) (0.1) Ln(GDP), Source Country 3.12*** 0.70 2.27 0.56 1.77 -0.32 5.00*** 0.34 (0.9) (1.2) (1.7) (2.1) (1.2) (1.5) (1.1) (1.4) Ln(Distance) -0.61*** -0.83*** -0.56*** -0.75*** -0.48*** -0.69*** -0.41*** -0.72*** (0.10) (0.1) (0.2) (0.2) (0.1) (0.2) (0.1) (0.1) Landlocked -0.25 -0.079 -0.23 0.46 -0.12 -0.44 -0.10 -0.11 (0.3) (0.4) (0.4) (0.5) (0.5) (0.6) (0.3) (0.4) Colonial Ties -0.11 0.11 -0.46 0.11 0.78 1.62 -0.34 0.46 (0.4) (0.5) (0.5) (0.6) (0.8) (1.4) (0.5) (0.6) Common Langs. 0.13 -0.19 0.22 -0.53 0.11 0.17 0.084 -0.22 (0.2) (0.3) (0.3) (0.5) (0.3) (0.3) (0.2) (0.3) Business Factor -0.014 0.035*** -0.010 0.057*** -0.013 0.013 -0.016 0.044*** (0.009) (0.01) (0.01) (0.02) (0.01) (0.02) (0.010) (0.01)
Computers and Comm.(% of comm. service exports) 0.023*** -0.015* 0.041*** -0.0035 0.0042 -0.023** 0.027*** -0.021** (0.006) (0.008) (0.009) (0.01) (0.009) (0.01) (0.006) (0.008) FDI, net inflows (% of GDP) -0.0074** 0.0022 -0.016*** 0.0058 -0.0021 -0.0019 -0.0070** 0.0020 (0.003) (0.004) (0.003) (0.005) (0.003) (0.006) (0.003) (0.004) Dom. credit to prv. sector (% of GDP) 0.019** 0.017 0.028*** 0.017 0.0015 0.011 0.020** 0.013 (0.008) (0.01) (0.01) (0.01) (0.01) (0.01) (0.008) (0.01) Square of Credit/GDP ratio -0.000068** -0.00011** -0.00013*** -0.000084 0.000037 -0.00013** -0.000069* -0.000098*
(0.00003) (0.00005) (0.00004) (0.00006) (0.00005) (0.00006) (0.00004) (0.00005) Market cap. (% of GDP) 0.0042*** 0.0012 0.0063*** 0.0020 0.0017 0.0021 0.0025 0.0023 (0.001) (0.002) (0.002) (0.003) (0.002) (0.003) (0.002) (0.002) Mobile phones 0.00086 -0.020*** -0.0049 -0.017* 0.0090 -0.021** 0.0017 -0.017** (0.005) (0.007) (0.007) (0.009) (0.008) (0.01) (0.007) (0.009) Comps. 0.016** 0.018* 0.023** 0.011 0.0060 0.023* 0.018*** 0.014 (0.006) (0.009) (0.009) (0.01) (0.009) (0.01) (0.007) (0.01) Military exp. (% of GDP) 0.19*** 0.057 0.24*** 0.18* 0.18** -0.072 0.15*** 0.075 (0.05) (0.07) (0.06) (0.09) (0.07) (0.10) (0.05) (0.07) Univ. Students 0.00019*** 0.00014* 0.00015** 0.00015 0.00022*** 0.00010 0.00019*** 0.00014 (0.00005) (0.00008) (0.00007) (0.0001) (0.00008) (0.0001) (0.00006) (0.00008) Constant -74.3*** -16.5 -72.1 -46.0 -46.3 11.1 -141*** -24.8 (21) (27) (47) (57) (33) (42) (30) (39)
Dummies, year/source Y Y Y Y Y Y Y Y Observations 1846 1846 856 856 990 990 1396 1396 Adj. R-squared 0.33 0.35 0.36 0.38 0.32 0.29 0.31 0.33
25
Table 7: Poisson regressions with counts of VC and PE deals between i,j country pairs on LHS. Dummies for source countries and years not reported. “Big 5” sources includes US, UK, Germany, Canada, and France. Robust standard errors, significance levels are * <10%, ** < 5%, *** <1%.
All Source and Dest. Big 5 Sources Not Big 5 Sources Not Big 5 Destination LHS = Ln(VC) ln(PE) Ln(VC) ln(PE) Ln(VC) ln(PE) Ln(VC) ln(PE)
Ln(GDP), Dest. Country 0.58*** 0.61*** 0.69*** 0.72*** 0.13*** 0.13*** 0.40*** 0.35*** (0.04) (0.04) (0.05) (0.05) (0.03) (0.05) (0.05) (0.05) Ln(GDP), Source Country 1.78*** 0.92* 1.57** 0.59 0.11 -0.077 2.11*** 1.24** (0.4) (0.5) (0.7) (0.8) (0.3) (0.5) (0.4) (0.5) Ln(Distance) -0.54*** -0.44*** -0.51*** -0.43*** -0.34*** -0.27*** -0.39*** -0.14** (0.04) (0.05) (0.06) (0.05) (0.04) (0.06) (0.06) (0.06) Landlocked -0.15 -0.29* -0.087 -0.17 -0.31* -0.35 -0.061 -0.22 (0.1) (0.2) (0.2) (0.2) (0.2) (0.2) (0.1) (0.1) Colonial Ties 0.44** 0.24 0.40** 0.24 0.42* 0.70 0.080 -0.037 (0.2) (0.2) (0.2) (0.2) (0.2) (0.4) (0.2) (0.2) Common Langs. 0.26*** 0.37*** 0.21 0.53*** 0.34*** 0.15 0.097 0.14 (0.08) (0.1) (0.1) (0.2) (0.08) (0.1) (0.09) (0.1) Business Factor 0.012** 0.023*** 0.016*** 0.027*** 0.00057 0.0090 0.011*** 0.019*** (0.005) (0.005) (0.005) (0.005) (0.004) (0.006) (0.004) (0.004)
Computers and Comm.(% of comm. service exports) 0.0076** -0.0046 0.010*** -0.0040 -0.0075*** -0.012*** 0.011*** -0.00064 (0.003) (0.003) (0.004) (0.004) (0.003) (0.004) (0.003) (0.003) FDI, net inflows (% of GDP) 0.00014 0.00063 -0.00014 0.0016 -0.0017 -0.0022 -0.00047 -0.00042 (0.001) (0.001) (0.002) (0.001) (0.001) (0.003) (0.001) (0.001) Dom. credit to prv. sector (% of GDP) 0.017*** 0.012*** 0.017*** 0.013*** 0.0052 -0.0012 0.017*** 0.012*** (0.003) (0.003) (0.004) (0.004) (0.004) (0.006) (0.003) (0.003) Square of Credit/GDP ratio -0.000076*** -0.000063*** -0.000082*** -0.000068*** -0.000016 -0.000019 -0.000076*** -0.000061***
(0.00001) (0.00001) (0.00002) (0.00001) (0.00001) (0.00003) (0.00001) (0.00002) Market cap. (% of GDP) 0.0038*** 0.0043*** 0.0044*** 0.0052*** 0.00077 0.00089 0.0012** 0.00095 (0.0008) (0.0009) (0.0008) (0.0009) (0.0007) (0.0009) (0.0006) (0.0008) Mobile phones -0.0031 -0.0047* -0.0051* -0.0051* 0.0035 -0.0044 -0.0024 -0.0043 (0.003) (0.003) (0.003) (0.003) (0.002) (0.004) (0.003) (0.003) Comps. 0.0057* 0.0053 0.0050 0.0042 0.0012 0.0087** 0.0075** 0.011*** (0.003) (0.003) (0.004) (0.004) (0.003) (0.004) (0.003) (0.003) Military exp. (% of GDP) 0.27*** 0.17*** 0.30*** 0.21*** 0.11*** -0.019 0.22*** 0.046 (0.02) (0.03) (0.03) (0.03) (0.02) (0.05) (0.03) (0.03) Univ. Students 0.000093*** 0.000098*** 0.000079** 0.000094*** 0.000096*** 0.00011*** 0.00012*** 0.00012*** (0.00003) (0.00003) (0.00004) (0.00003) (0.00003) (0.00003) (0.00003) (0.00003) Constant n.a. n.a. n.a. n.a. n.a. n.a. n.a. n.a. Dummies, year/source Y Y Y Y Y Y Y Y Observations 1846 1846 856 856 990 990 1396 1396
26
Table 8: “Bio.&High Tech.” are OLS regressions with logs of VC and PE volume between i,j country pairs on LHS where only deals involving biotech or IT related target companies are counted. “Average Deal Size” have on the LHS the log of average value of deals in country i which were participated in by firms from country j. Dummies for source countries and years not reported. Robust standard errors, significance levels are * <10%, ** < 5%, *** <1%.
Bio.\High Tech. Average Deal Size LHS = Ln(VC) ln(PE) VC Size PE Size
Ln(GDP), Dest. Country 0.62*** 0.39*** 0.22** 0.53*** (0.09) (0.10) (0.09) (0.1) Ln(GDP), Source Country 2.75*** 1.03 1.94** -0.11 (1.0) (1.0) (0.9) (1.2) Ln(Distance) -0.68*** -0.81*** -0.39*** -0.66*** (0.1) (0.10) (0.10) (0.1) Landlocked 0.91*** 0.50 0.018 0.37 (0.3) (0.4) (0.3) (0.4) Colonial Ties -0.011 -0.39 -0.061 0.25 (0.4) (0.5) (0.4) (0.5) Common Langs. 0.15 0.11 -0.069 -0.39 (0.2) (0.2) (0.2) (0.3) Business Factor 0.0070 0.028** -0.019** 0.028** (0.01) (0.01) (0.009) (0.01) Computers and Comm.(% of comm. service exports) 0.047*** 0.0072 0.029*** -0.019** (0.007) (0.007) (0.006) (0.008) FDI, net inflows (% of GDP) -0.0053 -0.00020 -0.0074** 0.0033 (0.003) (0.003) (0.003) (0.004) Dom. credit to prv. sector (% of GDP) 0.030*** 0.019** 0.020** 0.010 (0.008) (0.009) (0.008) (0.01) Square of Credit/GDP ratio -0.00011*** -0.000097** -0.000070** -0.000074
(0.00004) (0.00004) (0.00003) (0.00005) Market cap. (% of GDP) 0.0012 -0.0019 0.0037** -0.0016 (0.002) (0.002) (0.002) (0.002) Mobile phones -0.0041 -0.016*** 0.0059 -0.019*** (0.006) (0.006) (0.006) (0.007) Comps. 0.020*** 0.029*** 0.0081 0.017* (0.007) (0.008) (0.006) (0.009) Military exp. (% of GDP) 0.37*** 0.19*** 0.16*** 0.028 (0.05) (0.06) (0.05) (0.07) Univ. Students 0.00010 0.00024*** 0.00011* 0.00011 (0.00006) (0.00007) (0.00005) (0.00007) Constant -81.7*** -30.0 -47.5** 3.11 (24) (24) (22) (27) Dummies, year/source Y Y Y Y Observations 1846 1846 1846 1846 Adj. R-squared 0.42 0.29 0.26 0.24
27
Figure 1: Total volume of venture capital deals worldwide. Volume with international participation is the dollar value of deals that featured any cross-border participation. The solid line is the percent
of value of deals with international participation within value of total deals (measured on right hand axis).
0
20
40
60
80
100
120
140
1990 1991 1992 1993 1994 1995 1996 1997 1998 1999 2000 2001 2002 2003 2004 2005 2006 2007
Volu
me
of D
eals
(Cur
rent
US$
Bill
ions
)
0.0%
5.0%
10.0%
15.0%
20.0%
25.0%
30.0%
35.0%
40.0%
45.0%
50.0%
% V
olum
e w
/ Int
'l Pa
rtic
ipat
ion
Total Vol. w/ Int'l Participation % w/ Int'l Participation
Figure 2: Total volume of private equity and venture capital deals worldwide.
0
50
100
150
200
250
1990 1991 1992 1993 1994 1995 1996 1997 1998 1999 2000 2001 2002 2003 2004 2005 2006 2007
Volu
me
of D
eals
(Cur
rent
US$
Bill
ions
)
0.0%
5.0%
10.0%
15.0%
20.0%
25.0%
30.0%
35.0%
40.0%
45.0%
50.0%
% V
olum
e w
/ Int
'l Pa
rtic
ipat
ion
Total Vol. w/ Int'l Participation % w/ Int'l Participation
28
Figure 3: Total volume of deals venture capital worldwide, excluding US-based target companies. The solid line is the percent of value of deals with international participation within value of total
deals (measured on right axis).
0
5
10
15
20
25
30
1990 1991 1992 1993 1994 1995 1996 1997 1998 1999 2000 2001 2002 2003 2004 2005 2006 2007
Volu
me
of D
eals
(Cur
rent
US$
Bill
ions
)
0.0%
10.0%
20.0%
30.0%
40.0%
50.0%
60.0%
70.0%
80.0%
90.0%
100.0%
% V
olum
e w
/ Int
'l Pa
rtic
ipat
ion
Total Vol. w/ Int'l Participation % w/ Int'l Participation Figure 4: Total volume of deals private equity and venture capital worldwide, excluding US-based
target companies. The solid line is the percent of value of deals with international participation within value of total deals (measured on right axis).
0
10
20
30
40
50
60
1990 1991 1992 1993 1994 1995 1996 1997 1998 1999 2000 2001 2002 2003 2004 2005 2006 2007
Volu
me
of D
eals
(Cur
rent
US$
Bill
ions
)
0.0%
10.0%
20.0%
30.0%
40.0%
50.0%
60.0%
70.0%
80.0%
90.0%
100.0%
% V
olum
e w
/ Int
'l Pa
rtic
ipat
ion
Total Vol. w/ Int'l Participation % w/ Int'l Participation
29
Figure 5: Total volume of venture capital deals in different regions. The value of each deal is assigned to the region in which its target company is located. The US is measured on the right hand
axis, all others on the left.
0
1
2
3
4
5
6
7
8
9
10
1990 1991 1992 1993 1994 1995 1996 1997 1998 1999 2000 2001 2002 2003 2004 2005 2006 2007
Volu
me
of D
eals
(Cur
rent
US$
Bill
ions
)
0
10
20
30
40
50
60
70
80
90
100
Volu
me
of D
eals
, US
Onl
y (C
urre
nt U
S$ B
illio
ns)
Asia Europe, ex. UK UK US Figure 6: Total volume of private equity and venture capital deals in different regions. The value of
each deal is assigned to the region in which its target company is located. The US is measured on the right hand axis, all others on the left.
0
5
10
15
20
25
1990 1991 1992 1993 1994 1995 1996 1997 1998 1999 2000 2001 2002 2003 2004 2005 2006 2007
Volu
me
of D
eals
(Cur
rent
US$
Bill
ions
)
0
20
40
60
80
100
120
140
160
Volu
me
of D
eals
, US
Onl
y (C
urre
nt U
S$ B
illio
ns)
Asia Europe, ex. UK UK US
30
Figure 7: Percent value of venture capital deals with international participation.
0.0%
25.0%
50.0%
75.0%
100.0%
1990 1991 1992 1993 1994 1995 1996 1997 1998 1999 2000 2001 2002 2003 2004 2005 2006 2007
Dea
ls w
/ For
eign
Par
ticip
atio
n (%
Tot
al V
olum
e)
Asia Europe, ex. UK UK US Figure 8: Percent value of private equity and venture capital deals with international participation.
0.0%
25.0%
50.0%
75.0%
100.0%
1990 1991 1992 1993 1994 1995 1996 1997 1998 1999 2000 2001 2002 2003 2004 2005 2006 2007
Dea
ls w
/ For
eign
Par
ticip
atio
n (%
Tot
al V
olum
e)
Asia Europe, ex. UK UK US
31
Figure 9: Venture capital deal “surplus”. Bar height indicates the number of times the country's local VC firms participated in a deal outside the country during the 5-year window, minus the number of times foreign firms participated in a local deal. The sample of countries was restricted to only those countries which were observed in all three time periods so the sums will not necessarily equal zero. The difference of the sum from zero is less than 10% of total in all three cases. The USA is essentially zero in the first period given that the gross number of cross-border deals is >40,000.
1992-1997
-100
-50
0
50
100
150
200
250
300
GBR
SGP
HKG
LUX
USA
DEU
BEL
CHE
KOR
FIN
GRC
NOR
RUS
TW
CMR
CZE
DNK
HUN
LVA
PRT
NLD ZAF
ITA
SW AUT
POL
IRL
ESP
JPN
NZL
PHL
THA
CAN
AUS
MYS
BRA
IND
ISR
FRA
CHN
Num
ber o
f Dea
ls
1998-2002
-1500
-1000
-500
0
500
1000
1500
2000
2500
3000
3500
4000
USA
TWN
JPN
HKG
CHE
SGP
NLD
GRC
BEL
PHL
LVA
CMR
RUS
THA
POL
ZAF
PRT
CZE
GBR LUX
MYS NZL
HUN
AUT
DNK
NOR
DEU FIN
AUS
ITA
ISR
BRA
ESP
IND
SWE
IRL
CHN
KOR
CAN FRA
Num
ber o
f Dea
ls
2003-2007
-1000
-500
0
500
1000
1500
2000
2500
3000
3500
USA JPN
HKG
SGP
TWN
CHE
NOR
LUX
NZL
GRC
PHL
MYS CZE
PRT
CMR
AUS
NLD LVA
ZAF
POL
BRA
THA
HUN
RUS
ITA
BEL
AUT
KOR
ISR
ESP
DEU
DNK
FIN
IRL
IND
FRA
CAN
GBR
SWE
CHN
Num
ber o
f Dea
ls
32
Figure 10: Graphs of the flow of VC funds from the US to selected areas over time as the dashed line, compared with the volume of funds from local, domestic investors as the solid line. Areas are Europe (ex. UK), Asia (inc. Japan, India, and China), Latin America, Central and Eastern Europe, India, and China.
Europe (ex. UK)
0
0.5
1
1.5
2
2.5
3
3.5
4
4.5
5
1990 1992 1994 1996 1998 2000 2002 2004 2006
$US
Bn
VC ($Bn) Euro->Euro VC ($Bn), US->Euro
Asia
0
0.5
1
1.5
2
2.5
3
1990 1992 1994 1996 1998 2000 2002 2004 2006
$US
Bn
VC ($Bn) Asia->Asia VC ($Bn), US->Asia Latin America
0
0.1
0.2
0.3
0.4
0.5
0.6
0.7
0.8
1993 1994 1995 1996 1997 1998 1999 2000 2001 2002 2003 2004 2005 2006 2007
$US
Bn
VC ($Bn) LatAm->LatAm VC ($Bn), US->LatAm
Central and Eastern Europe
0
0.05
0.1
0.15
0.2
0.25
0.3
1993 1995 1997 1999 2001 2003 2005 2007
$US
Bn
VC ($Bn) CEE->CEE VC ($Bn), US->CEE India
0
0.1
0.2
0.3
0.4
0.5
0.6
0.7
0.8
1996 1997 1998 1999 2000 2001 2002 2003 2004 2005 2006 2007
$US
Bn
VC ($Bn) IND->IND VC ($Bn), US->IND
China
0
0.2
0.4
0.6
0.8
1
1.2
1993 1994 1995 1996 1997 1998 1999 2000 2001 2002 2003 2004 2005 2006 2007
$US
Bn
VC ($Bn) CHN->CHN VC ($Bn), US->CHN USA (domestic )
0
10
20
30
40
50
60
70
80
90
1990 1992 1994 1996 1998 2000 2002 2004 2006
$US
Bn
VC ($Bn) USA->USA
USA (Inflows and Outflows)
0
2
4
6
8
10
12
14
16
1990 1992 1994 1996 1998 2000 2002 2004 2006
$US
Bn
VC ($Bn), ROW->USA VC ($Bn), USA->ROW
33
Appendix: Data Sources and Variable Descriptions Our primary source for data on venture capital and private equity investments is the Thomson VentureXpert database. The database is a comprehensive data source for deals done worldwide and includes over 30 years of historical data. Thomson Financial’s private equity data sources include quarterly surveys of private equity firms; government filings; public news releases; and Thomson reporters as they interact with private equity practitioners. The deals measure cash-for-equity investments and include the investment activity of professional venture capital and private equity firms, SBICs, venture/private equity arms of corporations, institutions, investment banks and similar entities whose primary activity is financial investing. Qualifying transactions include cash investments by these entities either directly or by participation in various forms of private placement. All recipient companies are private, and may have been newly-created or spun-out of existing companies, universities, or public sector enterprises. Ideally, the universe for this study would be all venture capital and private equity investments worldwide. Most of the deals reported in Thompson are at the discretion of the investing firm so there will be some deals which are not reported. However, the fact that a majority deals involve more than one investment firm implies fairly comprehensive coverage. Additionally, Thomson reports that its greatest coverage is of the U.S. and European markets as well as of deals done by larger international firms who also operate in the U.S. and European markets. This fact will induce some bias in the data; however, we would like to learn what we can about deals which happen in the non-US/Europe markets and so include all deals in much of our analysis, restricting the sample to the larger US/Europe markets when appropriate. We focus on the years 1990-2007, during which there was much variation in the level of worldwide private equity activity. Each deal in the sample includes the names of the investors and the locations of their offices, the name of the target company and their location, as well as some details on the stage of the deal, the industry in which the company operates, the total value of the deal (amount invested), and the timing. With this information, we can calculate the volume of deals done in a given country in a given year, and the bilateral flows between countries, defining as the source country the home country of the investment firm and the destination country as the home country of the target company. All total, there are 100 countries represented in our sample. We define venture capital by the stage of the investment and include seed, startup, early stage, and expansion stage deals. These stages are the preliminary stages a company goes through in its initial journey to becoming a functioning company with steady revenues and a well defined product and customer base. For lack of a better term, we refer to the rest of the deal types as private equity. These include buyout, buy-in, merger, acquisition, turnaround/rescue, PIPE, and many other types. The main characteristic of these types of deals is that they involve functioning (or previously functioning) companies which have left the initial growth phase and often represent financial engineering as opposed to an investment designed to develop an initial product and take it to market. In addition to the VentureXpert data we have also collected data on the various source and destination countries in the sample. Much of this data comes from the Word Bank Development
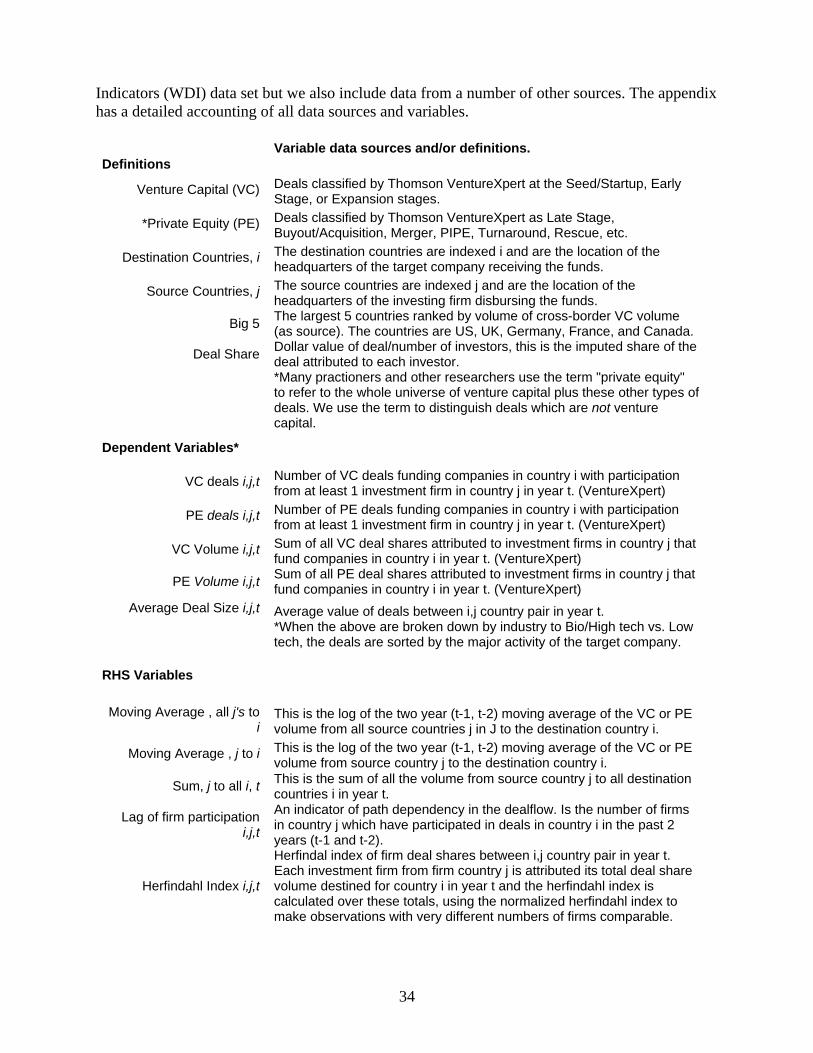
34
Indicators (WDI) data set but we also include data from a number of other sources. The appendix has a detailed accounting of all data sources and variables.
Variable data sources and/or definitions. Definitions
Venture Capital (VC) Deals classified by Thomson VentureXpert at the Seed/Startup, Early Stage, or Expansion stages.
*Private Equity (PE) Deals classified by Thomson VentureXpert as Late Stage, Buyout/Acquisition, Merger, PIPE, Turnaround, Rescue, etc.
Destination Countries, i The destination countries are indexed i and are the location of the headquarters of the target company receiving the funds.
Source Countries, j The source countries are indexed j and are the location of the headquarters of the investing firm disbursing the funds.
Big 5 The largest 5 countries ranked by volume of cross-border VC volume (as source). The countries are US, UK, Germany, France, and Canada.
Deal Share Dollar value of deal/number of investors, this is the imputed share of the deal attributed to each investor.
*Many practioners and other researchers use the term "private equity" to refer to the whole universe of venture capital plus these other types of deals. We use the term to distinguish deals which are not venture capital.
Dependent Variables*
VC deals i,j,t Number of VC deals funding companies in country i with participation from at least 1 investment firm in country j in year t. (VentureXpert)
PE deals i,j,t Number of PE deals funding companies in country i with participation from at least 1 investment firm in country j in year t. (VentureXpert)
VC Volume i,j,t Sum of all VC deal shares attributed to investment firms in country j that fund companies in country i in year t. (VentureXpert)
PE Volume i,j,t Sum of all PE deal shares attributed to investment firms in country j that fund companies in country i in year t. (VentureXpert)
Average Deal Size i,j,t Average value of deals between i,j country pair in year t.
*When the above are broken down by industry to Bio/High tech vs. Low tech, the deals are sorted by the major activity of the target company.
RHS Variables
Moving Average , all j's to
i This is the log of the two year (t-1, t-2) moving average of the VC or PE volume from all source countries j in J to the destination country i.
Moving Average , j to i This is the log of the two year (t-1, t-2) moving average of the VC or PE volume from source country j to the destination country i.
Sum, j to all i, t This is the sum of all the volume from source country j to all destination countries i in year t.
Lag of firm participation i,j,t
An indicator of path dependency in the dealflow. Is the number of firms in country j which have participated in deals in country i in the past 2 years (t-1 and t-2).
Herfindahl Index i,j,t
Herfindal index of firm deal shares between i,j country pair in year t. Each investment firm from firm country j is attributed its total deal share volume destined for country i in year t and the herfindahl index is calculated over these totals, using the normalized herfindahl index to make observations with very different numbers of firms comparable.
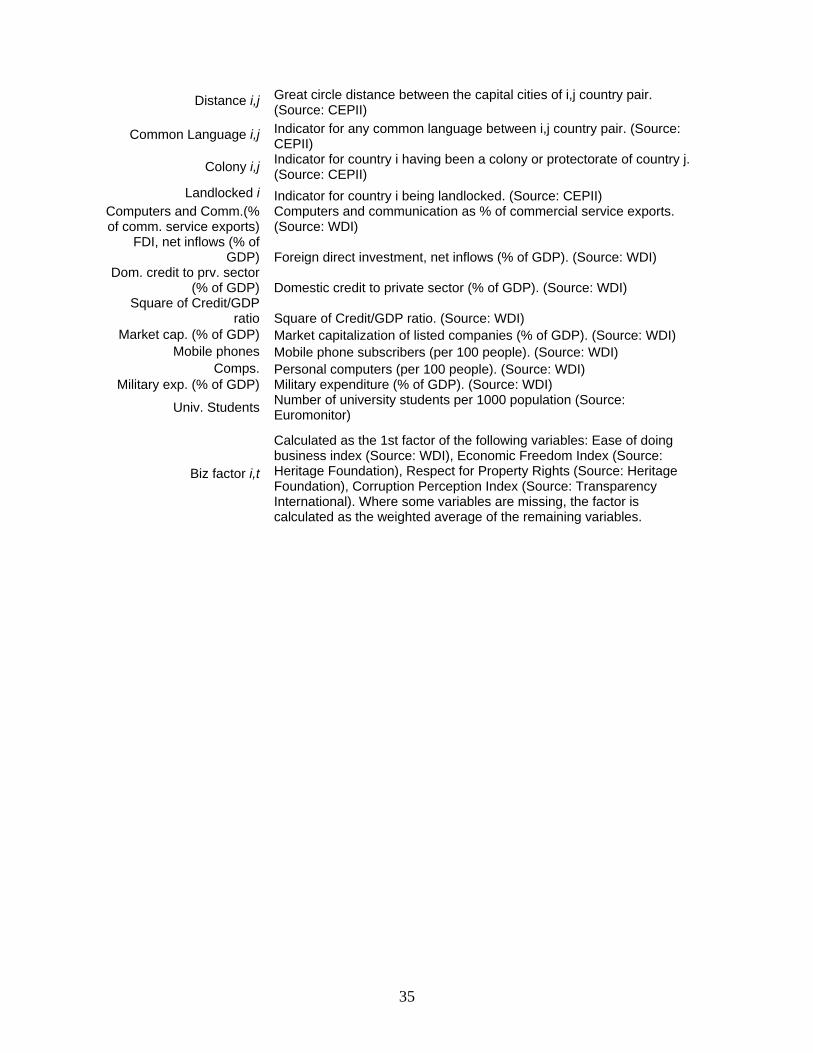
35
Distance i,j Great circle distance between the capital cities of i,j country pair. (Source: CEPII)
Common Language i,j Indicator for any common language between i,j country pair. (Source: CEPII)
Colony i,j Indicator for country i having been a colony or protectorate of country j. (Source: CEPII)
Landlocked i Indicator for country i being landlocked. (Source: CEPII) Computers and Comm.(% of comm. service exports)
Computers and communication as % of commercial service exports. (Source: WDI)
FDI, net inflows (% of GDP) Foreign direct investment, net inflows (% of GDP). (Source: WDI)
Dom. credit to prv. sector (% of GDP) Domestic credit to private sector (% of GDP). (Source: WDI)
Square of Credit/GDP ratio Square of Credit/GDP ratio. (Source: WDI)
Market cap. (% of GDP) Market capitalization of listed companies (% of GDP). (Source: WDI) Mobile phones Mobile phone subscribers (per 100 people). (Source: WDI)
Comps. Personal computers (per 100 people). (Source: WDI) Military exp. (% of GDP) Military expenditure (% of GDP). (Source: WDI)
Univ. Students Number of university students per 1000 population (Source: Euromonitor)
Biz factor i,t
Calculated as the 1st factor of the following variables: Ease of doing business index (Source: WDI), Economic Freedom Index (Source: Heritage Foundation), Respect for Property Rights (Source: Heritage Foundation), Corruption Perception Index (Source: Transparency International). Where some variables are missing, the factor is calculated as the weighted average of the remaining variables.