the ioc’s midas touch: summer olympics and city growth
TRANSCRIPT

The IOC’s Midas Touch: Summer Olympics and City Growth
Volker Nitsch Nicolai Wendland
CESIFO WORKING PAPER NO. 4378 CATEGORY 1: PUBLIC FINANCE
AUGUST 2013
An electronic version of the paper may be downloaded • from the SSRN website: www.SSRN.com • from the RePEc website: www.RePEc.org
• from the CESifo website: Twww.CESifo-group.org/wp T
CESifo Working Paper No. 4378
The IOC’s Midas Touch: Summer Olympics and City Growth
Abstract Hosting a mega-event is a costly activity of short duration. Still, cities frequently compete to become host of all types of events. This paper examines the effect of staging the largest and most important sporting event in the world, the Summer Olympic Games, on the host city. Applying a difference-in-differences methodology, we analyze the rates of population growth of Olympic cities, candidate cities and other large cities in host and candidate countries over the period from 1860 to 2010. We find that, following the Games, host cities experience a measurable decline in population growth relative to cities in the control group. Our results indicate that being awarded the Summer Olympics has, on average, a negative impact on cities.
JEL-Code: F530, N900, O180, R120, R230.
Keywords: mega-events, impact, host city, city size.
Volker Nitsch Darmstadt University of Technology Department of Law and Economics
Marktplatz 15, Residenzschloss Germany – 64283 Darmstadt [email protected]
Nicolai Wendland Darmstadt University of Technology Department of Law and Economics
Marktplatz 15, Residenzschloss Germany – 64283 Darmstadt
August 24, 2013 We thank seminar participants in Amsterdam (Tinbergen), Bratislava (ERSA), Darmstadt and Seattle (WEAI) for helpful comments. Olinda Papst provided excellent research assistance.

1
1. Introduction
Cities (and countries) often compete fiercely about hosting institutions and mega-events. Location decisions are typically made only after an extensive ‘beauty contest’ among various candidates. For instance, when in January 2012 the United Nations called for expressions of interest to host one of its programs, the Global Water Operators’ Partnership Alliance, three cities offered bids, including the commitment to provide substantial financial funding.1 For the World Expo 2020, an international exhibition, the Bureau International des Expositions already lists five candidate cities.2
Empirically, the benefits of host functions seem to be well established for institutions. Ades and Glaeser (1995), for instance, find that capital cities tend to be disproportionately large; they estimate that a countryʼs main city is, on average, 42 percent larger if it is also the capital city of the country. Nitsch (2003) argues that the pattern of persistence in Viennaʼs excessive size after the break-up of the Austro-Hungarian Empire may partly be explained by its new role as a seat of international organizations.
For events, in contrast, with their limited duration, the evidence on the (net) effects on host cities is more controversial. While some studies indicate a positive impact, they often focus on individual events and tend to predict effects ex ante; many of these analyses are commissioned.
More generally, any empirical assessment of the effects of events on host cities has to deal with a number of (potential) issues. For one thing, mega-events affect cities along various dimensions. While some effects may be easily quantifiable, such as the number of visitors and tourists, others are more difficult to identify, such as the effects of hosting events on the local labor market. Most importantly, effects on intangibles, such as a cityʼs (long-term) reputation, seem to be hard to quantify at all. Another important issue is to properly control for the costs. Hosting costs not only include the pecuniary expenses for managing the event.3 Often events require considerable upfront investments into facilities and infrastructure,
1 The city of Barcelona won the bid to host the secretariat. The announcement notice states that the Barcelona offer excelled in its financial commitment and in the strength of the institutional support and coordination behind the bid; see http://www.gwopa.org/news-and-events/news/3323-barcelona-wins-bid-to-host-un-habitats-water-partnership-secretariat. More generally, in an attempt to partly compensate for the loss of its capital city status, the German city of Bonn managed to attract almost 20 United Nations organizations within a period of about a decade; see http://www.bonn.de/wirtschaft_wissenschaft_internationales/uno-stadt/index.html?lang=en. 2 See http://www.bie-paris.org/site/en/component/content/category/24-expo-candidates-2020. 3 These costs may be already substantial. For instance, it is frequently reported that countries have deliberately withdrawn from the Eurovision Song Contest due to the cost as the winning nation of this (currently) one-week, three-shows music competition is expected to host next yearʼs event; see http://www.guardian.co.uk/commentisfree/2010/may/20/eurovision-spending-costs.

2
typically followed by expenses for long-term operation, maintenance and rebuilding.4 Moreover, events may involve noticeable non-pecuniary costs for local inhabitants; examples include increased security measures, temporary road closures and congestion. Finally, when quantifying the impact of mega-events, a reasonably large sample of events should be analyzed. While case studies may be insightful, events are typically characterized by strong host-specific components (especially because applicants aim to distinguish themselves from competitors in the selection process). As a result, estimates of average effects should be derived from a broad cross-section of events.
In this paper, we analyze the effects of hosting one of the worldʼs largest international events, the Summer Olympic Games. The Summer Olympics are a multi-sport event, featuring a large number of competitions (currently about 300) in a wide variety of sports. Organized by the International Olympic Committee (IOC), the Games are typically held every four years over two to three weeks.
For our purposes, the Summer Olympics provide, apart from size and importance of the event, a number of useful features. First, the Games are staged in a single city. While some competitions may be held at outside locations, the event itself essentially takes place in a spatially concentrated area for which effects may be properly identified; quantification seems to be more difficult, in contrast, for mega-events hosted at multiple locations, such as the FIFA World Cup or the Tour de France. Second, host cities of Summer Olympics are large urban areas. For these locations, often the capital city of a country, relevant indicators are readily available; data are much harder to obtain, in contrast, for an analysis of events at small and remote places, such as some host locations of the Winter Olympic Games or the Formula One Grand Prix. Third, the Games have a long history. The first edition of the Summer Olympics (in the modern era) dates back more than one hundred years to the 1896 Games of Athens, allowing to identify the long-term impact of hosting the event. Moreover, due to the relatively low frequency of the Olympics, with Rio de Janeiro hosting the Games of the XXXI Olympiad in 2016, the total number of events appears manageable. Similarly, the notable variation in host cities (across countries and continents) seems particularly favorable for empirical analysis. Fourth, cities regularly compete about hosting the event. While the steady stream of applicant cities illustrates the general interest in hosting the Olympic Games, the group of cities with an unsuccessful bid forms a useful control group to which the performance of Olympic cities can be reasonably compared.
We contribute to the literature along various lines. Our key innovation is to empirically explore the overall impact of holding the Games. Instead of focusing on a specific feature associated with hosting the mega-event, we are interested in an all-encompassing cost-benefit analysis for the host city. Specifically, we argue that the change in population size of a location is a useful indicator of its overall attractiveness. In addition, we analyze a sample which covers the full list of Olympiads. While most previous studies assess individual events, we aim to quantify the average effect across all hosted Summer Olympics.
4 Some facilities are reconstructed in order to avoid underutilization; examples include the Centennial Olympic Stadium in Atlanta. Other facilities may be deconstructed after the closing of the event, such as, for instance, pavilions at the World Expo.

3
In order to identify the impact of the Summer Olympics on host cities, we apply a time-shifted difference-in-differences approach that compares the change in population growth in host cities before and after the ‘treatment’ (i.e., having staged the Games) to that of a control group of cities. Previewing our main results, we find that the population growth of Olympic cities declines after having hosted the Games relative to that of other large cities in the country or defeated candidate cities.
The remainder of the paper is organized as follows. In Section 2, we provide some additional motivation and background for our analysis. Section 3 describes our empirical strategy and data. The heart of our paper is Section 4, which presents and discusses the empirical results. Finally, Section 5 briefly concludes.
2. Background
Why do cities apply to host the Olympic Games? According to the Olympic Charter, the IOC itself defines its role, in a very general fashion, “to promote a positive legacy from the Olympic Games to the host cities and host countries”.5 In practice, the expectations of local authorities may be similarly opaque. While the motivation to host the Games is probably influenced by many factors, two reasons seem to be of particular importance across all applicants. On the one hand, cities aim to benefit from the tangible improvements associated with hosting the Olympics; the required large investments into facilities and infrastructure are widely expected to promote urban development. On the other hand, cities hope for strong intangible benefits, such as increased international recognition. As the IOC notes in a marketing report, “the Olympic Games is uniquely popular amongst everyone, regardless of age, sex, income or nationality”6; Glaeser, Kolko and Saiz (2001) emphasize the role of local amenities to consumers for city growth.
The positive effects of staging the Games are balanced by the costs for host cities which are similarly diverse. Some costs, such as direct expenditures on facilities, may be easily quantifiable. Others are hard to identify at all. These costs may be, for instance, difficult to measure (such as environmental damages), or they may apply over the very long term.7
In our empirical analysis, instead of capturing the diverging effects individually, we focus on city population as a summary measure of a cityʼs overall attractiveness. Conceptually, we consider a situation in which the distribution of population across cities is initially in equilibrium and assume that holding the Olympic Games affects the quality of life in the host city (in potentially many different ways). Households, which seek to maximize utility, respond to this change in the spatial distribution of amenities in a Tiebout-like process
5 See http://www.olympic.org/Documents/olympic_charter_en.pdf. 6 See http://www.olympic.org/Documents/Reports/EN/en_report_567.pdf. 7 For instance, the facilities for the 1976 Olympic Games in Montréal were partly financed by a tax which only ended in November 2006; see http://www.parcolympique.qc.ca/en/the-olympic-park/useful-information/frequently-asked-questions/.

4
through their locational choices. As a result, the distribution of population adjusts until spatial equilibrium is attained.
Consequently, we make use of one of the fundamental concepts in urban economics, compensating differentials. According to this conceptual framework, any shift in the perceived attractiveness of a location directly translates into a change in demand. If the supply of land is inelastic (e.g., for neighborhoods within cities), the changing desirability of locations is primarily mirrored in prices (or, more precisely, capitalized into land rents). For cities, however, we follow the argument of Henderson (1974) that a change in the utility level across cities leads to an adjustment in population size.8
Our comprehensive empirical approach allows dealing with a number of issues that typically arise in economic impact studies of sporting events. For instance, a frequent concern is, as noted before, the proper identification of the various (dis)amenities associated with the event.9 The analysis is further complicated by difficulties in isolating the individual effects, taking also offsetting factors into account (such as substitution or crowding out effects). As a result, studies rarely aim to assess the overall effect of events on cities, instead highlighting selected issues only. Most closely related to our work, Billings and Holladay (2012) examine the effect of hosting the Olympics on city population, per capita income and trade openness; they also provide an extensive review of studies assessing the economic impact of hosting the Olympics.10
3. Methodology and Data
3.1 Empirical Strategy
To analyze the effect of hosting the Summer Olympic Games on city growth, we apply a difference-in-differences methodology. Specifically, we compare the growth performance of Olympic cities (our treatment group) before and after the Games with that of other cities (our control group) over the same period. Moreover, since Olympic cities host the Games in different years, we treat the timing of the before-after comparison as Games-specific; that is, we formally employ a time-shifted difference-in-differences specification which is centered
8 For instance, Henderson (1982, p. 32) notes: “In modeling the allocation of regional population, a critical determinant of regional size is amenity endowments [...]. In fact, if all regions of a country produce the complete range of interregionally traded goods and labor and capital are mobile across regions, regional sizes are determined almost solely by relative amenity endowments.” 9 As an example, the assessment may even include an evaluation of the architectural design of newly built sport arenas. 10 Billings and Holladay (2012) use of a sample of international cities with a population of at least 750,000 in 2007. Applying propensity score matching, they analyze host effects over the period from 1950 to 2005.

5
on the date that each Olympic city hosts the Games.11 In sum, we estimate equations of the form:
PopGrowthct = α OlyCityc + β PastOlympicst>τ(i) + γ (OlyCityc × PastOlympicst>τ(i)) + εct, (1)
where PopGrowthct is the change in log population size over the previous decade of city c at time t; OlyCityc is a dummy variable which takes the value of one when a city is a member of our treatment group of Olympic host cities and zero otherwise; PastOlympicst>τ(i) is a time-varying dummy variable which is Games-specific and takes the value of one for periods after Games i have been hosted and zero otherwise; and εct is the error term.
In practice, we modify and extend the baseline specification in various ways to assess the robustness of our results. For instance, in one perturbation, we include a full set of time dummies to control for common trends in population growth rates across cities, unrelated to the timing of the Olympic Games. If β is additionally set to 0, this specification gets close to a standard difference-in-differences approach as we discuss in more detail below. We also include a measure of initial population size (at the beginning of the decade) to control for possible convergence where larger cities tend to grow less; see, for instance, Glaeser, Scheinkman and Shleifer (1995). Notably, our analysis of population growth rates differences out city-specific features which are constant over time.
The coefficient of interest to us is γ, the effect of the Olympic Games on the growth performance of host cities relative to a control group of other cities (which are otherwise hopefully identical). To the extent that hosting the Olympics measurably affects the rate of population growth, this coefficient takes values significantly different from zero.
3.2 Data Description
At the heart of our empirical analysis is a newly compiled panel data set, comprising the population size of major cities in applicant countries for more than a century. Our data set is constructed as follows. For each edition of the Olympic Games, we collect the populations of the fifteen largest cities in each of the countries that bids to host the Olympics (and also has been awarded official candidate status from the IOC12). While this selection automatically includes the host city (i.e., the city which receives the ‘treatment’ of staging the event), it easily allows for the construction of two reasonable ‘control’ groups. A within-country comparison explores the development of the host city relative to other cities in the country. Alternatively, the growth performance of the host city is related to that of other candidate
11 For another application of a time-shifted difference-in-differences approach, see Kaplan and Rodrik (2002). 12 Technically, the IOC Executive Board decides which applicant city will be accepted as candidate city. Only candidate cities are eligible for election. See http://www.olympic.org/Documents/olympic_charter_en.pdf.

6
cities (whose bid for the Olympics was not chosen by the IOC). In total, our sample comprises data for 452 cities from 26 countries; Appendix Table A1 lists the host and candidate cities.13
Having identified the relevant sample of cities, we aim to track the population size of these cities over the period from 1860 to 2010 in 10-year-intervals. Data is not always available, however, for all cities at all times, for various reasons. For instance, Canberra, the capital city and one of the largest urban areas in Australia, was established only in 1913, thereby effectively reducing (part of) the control group for the 1956 Games of Melbourne and the 2000 Games of Sydney. As a result, our analysis is based on an unbalanced sample.
The data are collected by hand from various national sources, typically annual statistical yearbooks, mainly for three reasons. First, our analysis covers a period of more than 150 years for which only few comprehensive statistics are available. The first modern Olympic Games were held in Athens in 1896 so that our sample of city population sizes stretches back to 1860 to reasonably capture trends in population growth before the Games. Second, by design, our sample consists of a fixed number of cities per country while international statistics typically cover only cities above a certain population threshold. At an extreme, these comprehensive sources (such as the United Nationsʼs World Urbanization Prospects) may even exclude particularly small applicant cities, such as Lausanne, Switzerland. Finally, only (time-varying) contemporary sources allow properly identifying the top cities in the national city size distribution at the time of the bid, thereby avoiding potential selection bias.
The use of national statistics also has possible drawbacks as data may not be directly comparable, both across countries and over time. However, for within-country analyses, inconsistencies between sources should be of little relevance. Also, national statistical yearbooks typically provide city populations for previous years, using the same geographic definition of the urban area, for purposes of comparison. Cross-country comparisons benefit from the international practice to regularly take a population census at least every 10 years, typically at the turn of the decade. Importantly, differences in the national measurement of city populations may be less of an issue for the analysis of growth rates. Still, to ensure robustness of the results, we also examine harmonized city population data from the United Nations. Detailed sources are listed in Appendix Table A2.
4. Empirical Results
4.1 Olympic Cities vs. Other Cities in the Host Country
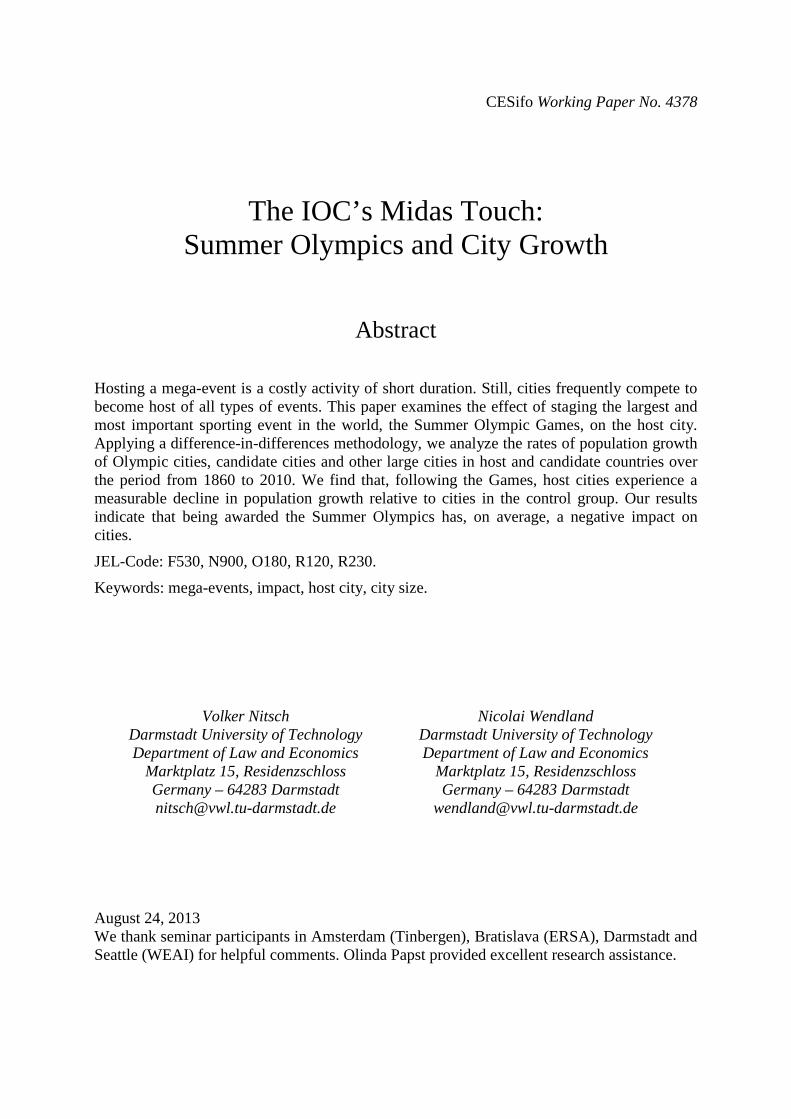
We begin our empirical analysis by reviewing the growth performance of Olympic cities relative to other cities in the (host) country. Table 1 presents the benchmark estimation results. Each column tabulates the estimates from a separate regression, gradually expanding
13 Taking advantage of the time-shifted design of our analysis, we treat each Summer Olympics individually before pooling. Therefore, we allow for multiple appearances of cities in our data set.

7
the regression specification from the left to the right of the table. In a first exercise, we examine the most parsimonious specification of equation (1), when β is set equal to 0. In this specification, we include, along with an Olympic city identifier, a full set of time dummies to control for the variation in the average growth rate of city populations in our sample over time, such that γ captures the relative deviation of Olympic cities from this average after having hosted the Games. Since plain year dummies capture average population growth rates for both pre- and post-episodes and, thus, ignore the time-shifted character of our analysis, this specification gets close to a standard difference-in-differences specification; see, for instance, Redding and Sturm (2008) for a recent application. As shown, the estimated coefficient on the Olympic city dummy is positive and statistically significant, indicating that cities in our treatment group grow, on average, significantly faster in population size than other national cities. More notably, the γ coefficient on the variable of interest, the Host City × Post Olympics interaction, takes a significantly negative value, which implies that holding the event is associated with a substantial decline in population growth in host cities relative to other cities in the sample. In sum, the estimation results suggest that the Summer Olympics are awarded to fast-growing, attractive cities, but host cities then typically tend to fall behind in population size after the Games, with a legacy of debt from staging the mega-event being one of various reasonable explanations for this finding.
In fact, part of the explanation for our estimation result may be sample selection bias, which is not properly controlled for in a conventional difference-in-differences specification. Specifically, early Olympic Games mainly took place in European countries where population growth of (large) cities has generally slowed over time, while later editions of the Summer Olympics were partly held in countries with rapid urban growth before the Games (such as Korea and China), with year dummies picking up a mix of these effects. Therefore, for γ to be an unbiased estimate of the effect of the Olympics, we must control for the (event-specific) difference in population growth rates before and after the Olympics in our sample. Column 2 shows that the observed patterns of population growth are not specific to Olympic host cities but apply, in similar fashion, to other large cities in the country. The estimate of β is negative and economically and statistically significant, indicating a sizable reduction in the growth rate of host country city populations after the Games, while the overall performance of Olympic cities no longer deviates from the control group. However, while also γ falls in magnitude and significance, the parameter estimate remains of borderline significance, which still suggests a particularly poor post-Games performance of host cities.
In the next two columns, we extend the set of fixed effects. The inclusion of Olympics fixed effects captures event-specific idiosyncrasies. For instance, the 1904 Games were initially awarded to Chicago, but then shifted to St. Louis to coincide with the Worldʼs Fair. Also the 1908 Games were re-located. Having been originally scheduled to be held in Rome, London stepped-in after the eruption of Mount Vesuvius in 1906. The fixed effects also control for all other (unobserved) heterogeneities related to individual Olympics (or, for that matter, host countries), such as, for instance, differences in the definition and collection of national city population data. The use of Olympics-year fixed effects provides an even stronger test, capturing data variations within countries over time. Not surprisingly, for both

8
extensions, the estimated coefficients on our variables of interest decrease in importance, while the R2 increases sizably.
A potential shortcoming of our approach of using other cities in the host country as control group to which the performance of Olympic cities is related to, is that treated cities are typically on the top of the national city size distribution and, thus, possibly ‘structurally different’ from the control group.14 To deal with this issue, we replicate our set of regressions, including (log) city size as an additional control variable. The remaining four columns in Table 1 present the results. As shown, there is indeed strong evidence of convergence, with initially larger cities growing, on average, significantly less than cities at the lower end of the city size distribution in our sample; the estimated coefficient on the size variable is consistently negative and significant. Olympic cities, in contrast, are apparently unaffected from this pattern, with estimation results now indicating significantly faster growth. Most notably, our key results remain qualitatively unchanged from this perturbation. While city growth generally slows in host countries in the aftermath of the Games, the relative reduction in growth seems to be, if anything, particularly strong for Olympic cities.
We have performed extensive robustness checks. A subset of the results when the sample is split along various lines is tabulated in Table 2. Again, we apply the four different regression specifications of equation (1), but, to economize on space, we report only the coefficient of interest, γ.
In a first exercise, we distinguish between Olympic Games that have actually taken place and Games that were cancelled. The Games of the VI Olympiad (Berlin, 1916) were abandoned due to World War I; the Games of the XII and XIII Olympiad (London, 1940 and 1944) were cancelled due to World War II. Without staging the sporting event (and organizations eventually interrupted), however, we would also expect the Olympics effect on the development of cities to be smaller. Indeed, for the set of cancelled (non-)events, γ is indistinguishable from zero and even takes a positive sign.
Next, we split the sample by time period. In particular, it may be argued that the Games have become a large-scale event, exhibiting a measurable effect on cities, only in the last few decades. The estimation results, however, are not generally supportive for this hypothesis. While the estimates turn out to be slightly weaker for Games staged before the end of World War II, the coefficient of interest is consistently negative (though rarely statistically significant) across all specifications and periods.
In another perturbation, we split the sample geographically. Specifically, we separately analyze the Summer Olympics held in US cities (four episodes), European cities (sixteen episodes), and also exclude the 1980 Games of Moscow (since Russian city population data may be affected by socialist planning). Two findings appear particularly noteworthy. First, it is especially host cities in the US that tend to fall behind in relative population size after having staged the Olympics. Second, findings of a negative effect of the
14 Seven (out of 27) Olympic Games in our sample were held in cities which were not the most populated city in the country.

9
Olympics on city growth become stronger if Russian cities are dropped from the sample, suggesting that Moscow has performed substantially better in the post-Olympics era than other host cities. Reassuringly, our findings seem to be largely consistent across major geographic areas.
Finally, we analyze a subsample that excludes the lower end of the national city size distribution in our sample; that is, we drop cities ranked from 11th to 15th in a country, without much effect.
In another extension, we examine the timing of the effect of the Summer Olympics on host cities in more detail. We first rerun our default regression (from column 2 of Table 1), gradually extending the time window around the event. Table 3 presents the results. As shown, the parameter estimate of γ slightly increases in (absolute) magnitude as the time interval widens. However, the coefficient is precisely estimated (at borderline significance) only if the sample covers almost the full period.
In an alternative exercise, we analyze the full sample, but instead of a single γ coefficient we estimate separate interaction terms for the performance of Olympic cities at different points in time before and after the Games. Figure 1 contains a separate plot for each of the four panel estimation specifications of equations (1). The graphs show that Olympic cities tend to outgrow other cities in the country prior to the Games, but this pattern seems to be reversed past the event, with generally little variation over time.
4.2 Olympic Cities vs. Candidate Cities
In our difference-in-differences model, we compare hosts to non-hosts. For non-host cities, it may be reasonable to start with an exploration of other urban areas in the country which typically face a similar economic, geographic and institutional background as the host city. However, there is another equally plausible control group of cities: candidate cities which have submitted a bid to host the Games but have not been awarded the event by the IOC.
Following this approach, Table 4 tabulates results when we use rival (but unsuccessful) candidate cities instead of other national cities as control group. We apply a similar set of estimation specifications as before so that the table presents exact analogues.
Reviewing the results, coefficient estimates are often similar in sign and significance to our previous findings. City growth generally tends to slow after the event. Also, larger cities experience a relative decline in population growth. Most notably, host cities fall behind relative to non-host cities after the Olympics, although the evidence is somewhat weaker than before (which may also be due to the smaller sample size).
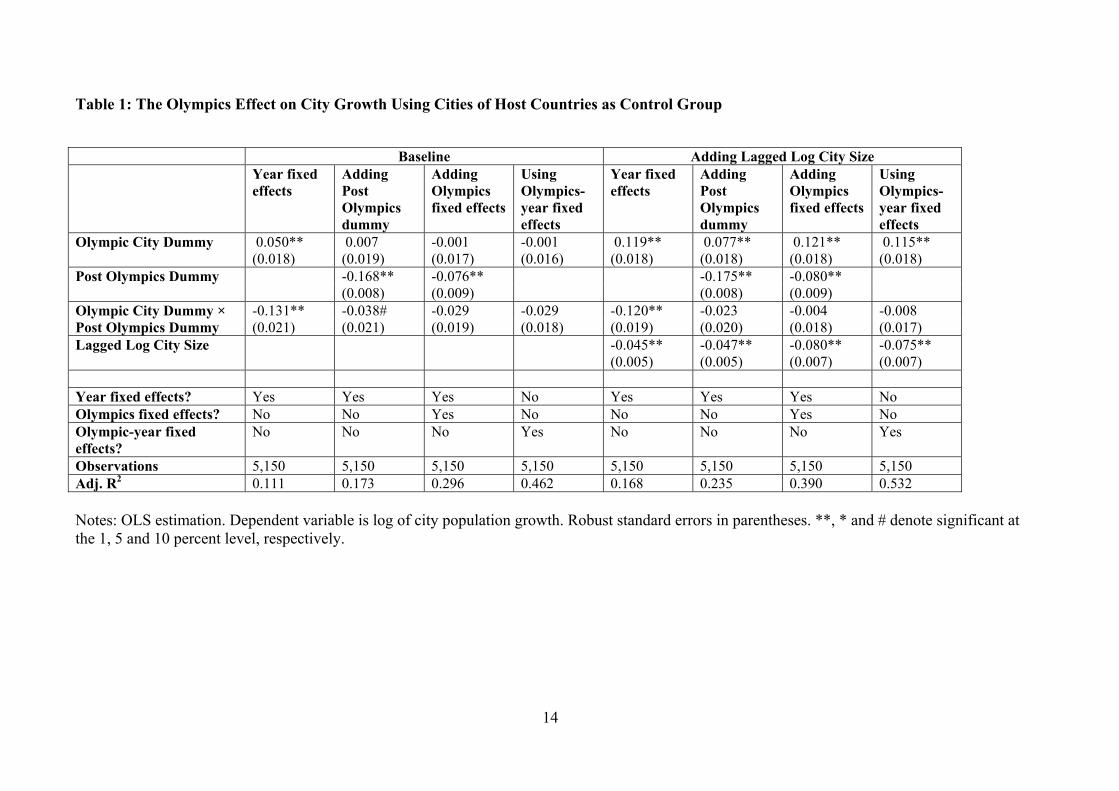
Again, we partition our sample along various dimensions and examine the sub-samples separately to explore the robustness of our findings. The results are reported in Table 5. As before, it is reassuring to note that any Olympics effect is only observed for events which have been actually hosted; the estimate of γ is always statistically

10
indistinguishable from zero and even takes a positive sign for cancelled Olympics. For our sub-samples defined along geographic lines, in contrast, we now find the strongest (negative) effects of hosting the Olympics for non-US cities. This finding, however, may not be too surprising; some US cities, such as Detroit, bid unsuccessfully for the Olympics in an attempt to counter urban decline. In addition, we separate our sample to take account of the fact that cities have applied repeatedly, both successfully and unsuccessfully. None of these divisions, however, has a notable effect on the results.
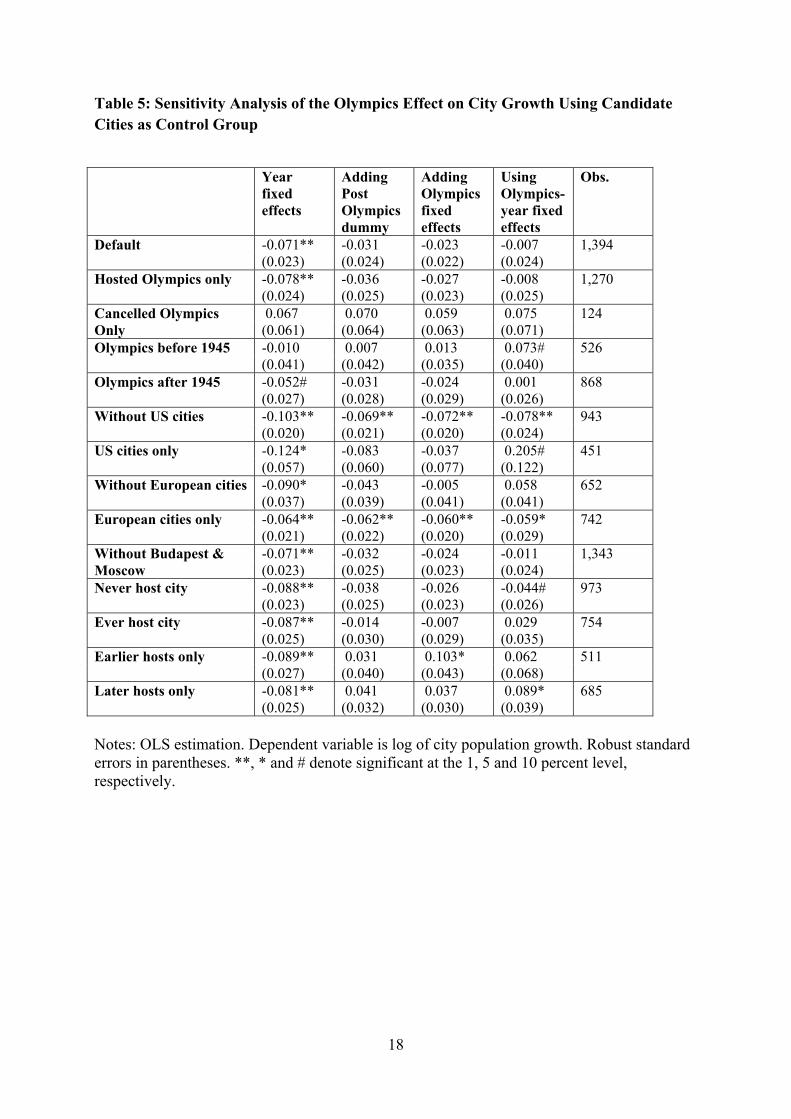
Table 6 replicates our analysis of the timing of the effect when we gradually extend the time interval around the Olympics. In contrast to findings from within-country comparisons when the hosting effect is observed only over the long run, our estimation results indicate a measurable negative short-term effect of staging the Olympics on the host city relative to other candidate cities. The parameter estimate of γ is different from zero at conventional levels of statistical significance up to a time window of +/– 60 years around the event, an effect that is not identifiable in the full sample. Figure 2 provides accompanying graphs, analogous to Figure 1, generally supporting this result.
4.3 Candidate Cities vs. Other Cities in the Candidate City Country
In another modification, we perform a placebo test, which examines the growth performance of unsuccessful bidding cities relative to non-bidders from the same country. Table 7 reports the results, presenting estimates for the same set of specifications as before. Interestingly, the coefficient of interest takes again a significantly negative value, indicating that, similar to our findings for Olympic cities, applicant cities exhibit below-average growth on a national scale after the Olympics, even though they did not host the event. Since candidate cities also tend to grow, on average, significantly faster than other cities in the country, this finding, taken at face value, seems to suggest a rather general pattern instead of a hosting effect: rapidly-expanding cities bid for the Games at a time their relative growth performance begins to deteriorate.
A closer examination shows, however, that this estimation result is not particularly robust. Specifically, the estimated point coefficient on the interaction term is highly sensitive to the inclusion of a small group of US cities which repeatedly applied, without success, in the immediate post-World War II period. For each of the three Summer Olympics following World War II, at least four different US cities were in the running to host the Summer Olympics; many of these cities have been already in relative decline at the time of application.15 In fact, two of the bidding cities, Baltimore and Minneapolis, are no longer among the top 15 large statistical metropolitan areas in the United States. In unreported
15 IOC regulations have later been modified to allow countries to nominate only one city. Bye-law paragraph 1.3 to Rule 33 of the Olympic Charter states that “[s]hould there be several potential applicant cities in the same country to the same Olympic Games, one city only may apply, as decided by the NOC of the country concerned”; see http://www.olympic.org/Documents/olympic_charter_en.pdf.

11
results, we find that the estimated γ coefficient falls in magnitude and statistical significance once US cities or the Olympics of 1948, 1952 and 1956 are dropped.
4.4 Olympic Cities vs. Other Cities
To further analyze the relevance of this issue, we pool our samples and examine the effect of holding the Games, in addition to the effect of submitting a bid. That is, we treat host cities as a sub-group of all applicant cities. Table 8 provides estimates of the permanent effects for various specifications. Although the estimated coefficients on the Olympic City × Post Olympics interaction consistently take negative values, none is significantly different from zero, indicating that most of the effect of the Olympics is already captured by the decision to apply for the Games.
Table 9 presents analogous results for the short-term effect of the Olympics. Two results stand out. First, for short durations of up to +/–60 years, Olympic cities perform significantly worse than both national companions and other candidate cities. This effect, however, becomes weaker and eventually turns insignificant as the window of analysis increases. Second, the candidate city effect starts to become significant only after a half century and then dominates the overall effect.
4.5 Further Robustness: Sample Sensitivity
In a final perturbation, we explore the robustness of our results for city population data taken from a different source. Instead of compiling data individually country by country, we use (harmonized) information from a standard reference, the United Nations’s World Urbanization Prospects: The 2011 Revision. The UN provides population data for urban agglomerations with more than 750,000 inhabitants (at the time of the revision) over the period from 1950 to 2025 in five-year intervals.
Table 10 presents the results. While we apply the full set of specifications on this alternative data set and also experiment with different samples, we report only a subset of our results to economize on space. Specifically, all tabulated estimation results use our default specification of equation (1), with a dummy variable for the post Olympics period along with year fixed effects, as reported in column 2 of Table 1. We then modify the specification by adding a control for lagged city size to capture convergence; we also extend our sample with projected population data up to year 2025. The first four columns tabulate estimates when we use other large cities of the host country as control group; the remaining four columns present the analogues for candidate cities as controls.
The estimation results turn out to provide strong support for our earlier conclusions. For instance, sample selection is indeed an issue of major relevance for our analysis. For a national control group of cities based on current population size (that is, a sample that covers cities as ranked by their size in the year 2011), we observe that non-host cities have consistently grown faster than Olympic cities. However, this empirical finding is mainly

12
driven by the construction of the sample. The effect disappears once we control for the rapid growth of initially small cities. Moreover, the effect is not observed when we use other candidate cities as control group. Importantly, our key finding of disproportionately weak population growth of Olympic cities after hosting the Games is robust.
5. Conclusions
Hosting a mega-event is a costly activity of short duration. Still, cities frequently compete to become host of all types of events, from sports and music to trade fairs, political summit meetings, and even academic conferences.
This paper examines the effect of staging the largest and most important sporting event in the world, the Summer Olympic Games, on the host city. Applying a difference-in-differences methodology on a newly compiled data set, we analyze the rates of population growth of Olympic cities, candidate cities and other large cities in host and candidate countries over the period from 1860 to 2010.
We find that, following the Games, host cities experience a measurable decline in population growth relative to cities in the control group. Our results indicate that being awarded the Summer Olympics has, on average, a negative impact on cities. An obvious extension of our research is the analysis of why (and when) do cities fail to benefit from hosting the mega-event; we leave this issue for future research.
References:
Ades, Alberto F. and Edward L. Glaeser. 1995. “Trade and Circuses: Explaining Urban Giants,” Quarterly Journal of Economics. 110 (February): 195-227.
Billings, Stephen B. and J. Scott Holladay. 2012. “Should Cities Go for the Gold? The Long-Term Impacts of Hosting the Olympics,” Economic Inquiry. 50 (July): 754-772.
Glaeser, Edward L., Jed Kolko, and Albert Saiz. 2001. “Consumer City,” Journal of Economic Geography. 1 (January): 27-50.
Glaeser, Edward L., José A. Scheinkman, and Andrei Shleifer. 1995. “Economic Growth in a Cross-Section of Cities,” Journal of Monetary Economics. 36 (August): 117-143.
Henderson, J. Vernon. 1974. “The Sizes and Types of Cities,” American Economic Review. 64 (June): 640-656.
Henderson, J. Vernon. 1982. “Evaluating Consumer Amenities and Interregional Welfare Differences,” Journal of Urban Economics. 11 (January): 32-59.

13
Kaplan, Ethan and Dani Rodrik. 2002. “Did the Malaysian Capital Controls Work?” in Sebastian Edwards and Jeffrey Frankel (eds.) Preventing Currency Crises in Emerging Markets. Chicago: University of Chicago Press.
Nitsch, Volker. 2003. “Does History Matter for Urban Primacy? The Case of Vienna,” Regional Science and Urban Economics. 33 (July): 401-418.
Redding, Stephen J. and Daniel M. Sturm. 2008. “The Costs of Remoteness: Evidence from German Division and Reunification,” American Economic Review. 98 (December): 1766-1797.
Rose, Andrew K. and Mark M. Spiegel. 2011. “The Olympic Effect,” Economic Journal. 121 (June): 652-677.
14
Table 1: The Olympics Effect on City Growth Using Cities of Host Countries as Control Group
Baseline Adding Lagged Log City Size
Year fixed effects
Adding Post Olympics dummy
Adding Olympics fixed effects
Using Olympics-year fixed effects
Year fixed effects
Adding Post Olympics dummy
Adding Olympics fixed effects
Using Olympics-year fixed effects
Olympic City Dummy 0.050** 0.007 -0.001 -0.001 0.119** 0.077** 0.121** 0.115** (0.018) (0.019) (0.017) (0.016) (0.018) (0.018) (0.018) (0.018) Post Olympics Dummy -0.168** -0.076** -0.175** -0.080** (0.008) (0.009) (0.008) (0.009) Olympic City Dummy × -0.131** -0.038# -0.029 -0.029 -0.120** -0.023 -0.004 -0.008 Post Olympics Dummy (0.021) (0.021) (0.019) (0.018) (0.019) (0.020) (0.018) (0.017) Lagged Log City Size -0.045** -0.047** -0.080** -0.075** (0.005) (0.005) (0.007) (0.007) Year fixed effects? Yes Yes Yes No Yes Yes Yes No Olympics fixed effects? No No Yes No No No Yes No Olympic-year fixed effects?
No No No Yes No No No Yes
Observations 5,150 5,150 5,150 5,150 5,150 5,150 5,150 5,150 Adj. R2 0.111 0.173 0.296 0.462 0.168 0.235 0.390 0.532 Notes: OLS estimation. Dependent variable is log of city population growth. Robust standard errors in parentheses. **, * and # denote significant at the 1, 5 and 10 percent level, respectively.

15
Table 2: Sensitivity Analysis of the Olympics Effect on City Growth Using Cities of Host Countries as Control Group
Year
fixed effects
Adding Post Olympics dummy
Adding Olympics fixed effects
Using Olympics-year fixed effects
Obs.
Default -0.131** -0.038# -0.029 -0.029 5,150 (0.021) (0.021) (0.019) (0.018) Hosted Olympics only -0.138** -0.041# -0.031 -0.030 4,600 (0.022) (0.022) (0.020) (0.019) Cancelled Olympics 0.023 0.039 0.028 0.022 550 only (0.060) (0.062) (0.059) (0.061) Olympics before 1945 -0.060# -0.039 -0.042 -0.047 2,698 (0.035) (0.035) (0.032) (0.031) Olympics after 1945 -0.077** -0.032 -0.015 -0.012 2,452 (0.027) (0.026) (0.026) (0.023) Without US cities -0.110** -0.014 -0.002 -0.000 4,263 (0.019) (0.019) (0.018) (0.017) US cities only -0.215** -0.138* -0.136* -0.136* 887 (0.055) (0.056) (0.056) (0.057) Without European cities -0.153** -0.074* -0.060 -0.061 1,883 (0.035) (0.036) (0.038) (0.038) European cities only -0.062** -0.010 -0.008 -0.009 3,267 (0.019) (0.019) (0.018) (0.017) Without Russian cities -0.133** -0.044* -0.034# -0.035# 5,017 (0.021) (0.022) (0.019) (0.019) Largest 10 cities only -0.121** -0.019 -0.017 -0.021 3,483 (0.022) (0.022) (0.020) (0.019) Notes: OLS estimation. Dependent variable is log of city population growth. Robust standard errors in parentheses. **, * and # denote significant at the 1, 5 and 10 percent level, respectively.

16
Table 3: The Short-Run Olympics Effect on City Growth Using Cities of Host Countries as Control Group
Time Interval around Olympic Games (+/- Years) Full 10 20 30 40 50 60 70 80 90 100 Sample
Olympic City Dummy -0.034 -0.015 -0.012 -0.003 -0.002 -0.000 -0.002 0.000 0.007 -0.008 0.007 (0.028) (0.026) (0.022) (0.022) (0.020) (0.019) (0.019) (0.018) (0.019) (0.019) (0.019) Post Olympics Dummy -0.096** -0.105** -0.128** -0.140** -0.153** -0.158** -0.165** -0.167** -0.168** -0.168** -0.168** (0.012) (0.010) (0.009) (0.009) (0.008) (0.008) (0.008) (0.008) (0.008) (0.008) (0.008) Olympic City Dummy × -0.024 -0.015 -0.023 -0.035 -0.033 -0.035 -0.031 -0.032 -0.038# -0.039# -0.038# Post Olympics Dummy (0.040) (0.035) (0.029) (0.027) (0.025) (0.023) (0.022) (0.021) (0.022) (0.021) (0.021) Time fixed effects? Yes Yes Yes Yes Yes Yes Yes Yes Yes Yes Yes Olympics fixed effects? No No No No No No No No No No No Olympic-year fixed effects?
No No No No No No No No No No No
Observations 1,179 1,923 2,624 3,220 3,722 4,127 4,459 4,721 4,919 5,040 5,150 Adj. R2 0.094 0.092 0.111 0.127 0.145 0.156 0.155 0.164 0.173 0.174 0.176 Notes: OLS estimation. Dependent variable is log of city population growth. Robust standard errors in parentheses. **, * and # denote significant at the 1, 5 and 10 percent level, respectively.

17
Table 4: The Olympics Effect on City Growth Using Candidate Cities as Control Group
Baseline Adding Lagged Log City Size
Year fixed effects
Adding Post Olympics dummy
Adding Olympics fixed effects
Using Olympics-year fixed effects
Year fixed effects
Adding Post Olympics dummy
Adding Olympics fixed effects
Using Olympics-year fixed effects
Olympic City Dummy -0.001 -0.016 -0.050** -0.050* 0.028 0.013 -0.014 -0.019 (0.021) (0.021) (0.018) (0.020) (0.018) (0.019) (0.016) (0.018) Post Olympics Dummy -0.067** -0.029 -0.068** -0.034# (0.015) (0.018) (0.016) (0.018) Olympic City Dummy × -0.071** -0.031 -0.023 -0.007 -0.069** -0.029 -0.018 -0.009 Post Olympics Dummy (0.023) (0.024) (0.022) (0.024) (0.021) (0.023) (0.021) (0.022) Lagged Log City Size -0.066** -0.066** -0.065** -0.056** (0.008) (0.008) (0.008) (0.009) Year fixed effects? Yes Yes Yes No Yes Yes Yes No Olympics fixed effects? No No Yes No No No Yes No Olympic-year fixed effects?
No No No Yes No No No Yes
Observations 1,394 1,394 1,394 1,394 1,394 1,394 1,394 1,394 Adj. R2 0.510 0.514 0.574 0.559 0.563 0.567 0.620 0.596 Notes: OLS estimation. Dependent variable is log of city population growth. Robust standard errors in parentheses. **, * and # denote significant at the 1, 5 and 10 percent level, respectively.
18
Table 5: Sensitivity Analysis of the Olympics Effect on City Growth Using Candidate Cities as Control Group
Year
fixed effects
Adding Post Olympics dummy
Adding Olympics fixed effects
Using Olympics-year fixed effects
Obs.
Default -0.071** -0.031 -0.023 -0.007 1,394 (0.023) (0.024) (0.022) (0.024) Hosted Olympics only -0.078** -0.036 -0.027 -0.008 1,270 (0.024) (0.025) (0.023) (0.025) Cancelled Olympics 0.067 0.070 0.059 0.075 124 Only (0.061) (0.064) (0.063) (0.071) Olympics before 1945 -0.010 0.007 0.013 0.073# 526 (0.041) (0.042) (0.035) (0.040) Olympics after 1945 -0.052# -0.031 -0.024 0.001 868 (0.027) (0.028) (0.029) (0.026) Without US cities -0.103** -0.069** -0.072** -0.078** 943 (0.020) (0.021) (0.020) (0.024) US cities only -0.124* -0.083 -0.037 0.205# 451 (0.057) (0.060) (0.077) (0.122) Without European cities -0.090* -0.043 -0.005 0.058 652 (0.037) (0.039) (0.041) (0.041) European cities only -0.064** -0.062** -0.060** -0.059* 742 (0.021) (0.022) (0.020) (0.029) Without Budapest & -0.071** -0.032 -0.024 -0.011 1,343 Moscow (0.023) (0.025) (0.023) (0.024) Never host city -0.088** -0.038 -0.026 -0.044# 973 (0.023) (0.025) (0.023) (0.026) Ever host city -0.087** -0.014 -0.007 0.029 754 (0.025) (0.030) (0.029) (0.035) Earlier hosts only -0.089** 0.031 0.103* 0.062 511 (0.027) (0.040) (0.043) (0.068) Later hosts only -0.081** 0.041 0.037 0.089* 685 (0.025) (0.032) (0.030) (0.039) Notes: OLS estimation. Dependent variable is log of city population growth. Robust standard errors in parentheses. **, * and # denote significant at the 1, 5 and 10 percent level, respectively.
19
Table 6: The Short-Run Olympics Effect on City Growth Using Candidate Cities as Control Group
Time Interval around Olympic Games (+/- Years) Full 10 20 30 40 50 60 70 80 90 100 Sample
Olympic City Dummy -0.030 -0.009 -0.014 -0.008 -0.007 -0.011 -0.017 -0.026 -0.025 -0.024 -0.018 (0.033) (0.030) (0.027) (0.026) (0.024) (0.023) (0.022) (0.022) (0.022) (0.022) (0.022) Post Olympics Dummy -0.014 -0.030# -0.040* -0.046** -0.049** -0.053** -0.057** -0.060** -0.062** -0.062** -0.061** (0.023) (0.018) (0.016) (0.016) (0.015) (0.015) (0.015) (0.015) (0.015) (0.015) (0.015) Olympic City Dummy × -0.087# -0.060 -0.059# -0.060# -0.059* -0.053* -0.041 -0.030 -0.027 -0.026 -0.033 Post Olympics Dummy (0.049) (0.040) (0.034) (0.031) (0.028) (0.027) (0.026) (0.025) (0.025) (0.025) (0.024) Time fixed effects? Yes Yes Yes Yes Yes Yes Yes Yes Yes Yes Yes Olympics fixed effects? No No No No No No No No No No No Olympic-year fixed effects?
No No No No No No No No No No No
Observations 304 489 670 832 978 1,096 1,193 1,269 1,329 1,360 1,391 Adj. R2 0.143 0.151 0.189 0.199 0.217 0.250 0.560 0.536 0.522 0.518 0.514 Notes: OLS estimation. Dependent variable is log of city population growth. Robust standard errors in parentheses. **, * and # denote significant at the 1, 5 and 10 percent level, respectively.

20
Table 7: The Bidding Effect on Candidate City Growth Using Cities in Candidate Countries as Control Group
Baseline Adding Lagged Log City Size
Year fixed effects
Adding Post Olympics dummy
Adding Olympics fixed effects
Using Olympics-year fixed effects
Year fixed effects
Adding Post Olympics dummy
Adding Olympics fixed effects
Using Olympics-year fixed effects
Candidate City Dummy 0.065** 0.055** 0.044** 0.043** 0.110** 0.100** 0.102** 0.099** (0.012) (0.012) (0.012) (0.011) (0.012) (0.012) (0.012) (0.012) Post Olympics Dummy -0.056** -0.013 -0.057** -0.007 (0.006) (0.010) (0.006) (0.009) Candidate City Dummy × -0.092** -0.062** -0.059** -0.055** -0.081** -0.051** -0.046** -0.045** Post Olympics Dummy (0.013) (0.013) (0.013) (0.013) (0.013) (0.013) (0.013) (0.013) Lagged Log City Size -0.039** -0.039** -0.052** -0.049** (0.004) (0.004) (0.005) (0.004) Year fixed effects? Yes Yes Yes No Yes Yes Yes No Olympics fixed effects? No No Yes No No No Yes No Olympic-year fixed effects?
No No No Yes No No No Yes
Observations 11,588 11,588 11,588 11,588 11,588 11,588 11,588 11,588 Adj. R2 0.095 0.099 0.131 0.161 0.128 0.132 0.180 0.205 Notes: OLS estimation. Dependent variable is log of city population growth. Robust standard errors in parentheses. **, * and # denote significant at the 1, 5 and 10 percent level, respectively.

21
Table 8: The Olympics Effect on City Growth Using Cities of Host and Candidate Countries as Control Group
Baseline Adding Lagged Log City Size
Year fixed effects
Adding Post Olympics dummy
Adding Olympics fixed effects
Using Olympics-year fixed effects
Year fixed effects
Adding Post Olympics dummy
Adding Olympics fixed effects
Using Olympics-year fixed effects
Candidate City Dummy 0.065** 0.046** 0.038** 0.038** 0.113** 0.094** 0.098** 0.098** (0.012) (0.012) (0.012) (0.011) (0.012) (0.012) (0.012) (0.012) Olympic City Dummy -0.014 -0.015 -0.018 -0.023 0.004 0.004 -0.001 -0.007 (0.021) (0.021) (0.019) (0.019) (0.019) (0.019) (0.017) (0.017) Post Olympics Dummy -0.094** -0.033** -0.099** -0.029** (0.005) (0.008) (0.005) (0.007) Candidate City Dummy -0.095** -0.046** -0.042** -0.042** -0.085** -0.034* -0.031* -0.033** ×Post Olympics Dummy (0.013) (0.013) (0.013) (0.013) (0.013) (0.013) (0.013) (0.013) Olympic City Dummy × -0.032 -0.028 -0.029 -0.017 -0.030 -0.026 -0.019 -0.006 Post Olympics Dummy (0.024) (0.024) (0.022) (0.022) (0.023) (0.023) (0.021) (0.020) Lagged Log City Size -0.042** -0.043** -0.052** -0.050** (0.003) (0.003) (0.004) (0.003) Year fixed effects? Yes Yes Yes No Yes Yes Yes No Olympics fixed effects? No No Yes No No No Yes No Olympic-year fixed effects?
No No No Yes No No No Yes
Observations 16,511 16,511 16,511 16,511 16,511 16,511 16,511 16,511 Adj. R2 0.091 0.105 0.146 0.176 0.130 0.145 0.199 0.224 Notes: OLS estimation. Dependent variable is log of city population growth. Robust standard errors in parentheses. **, * and # denote significant at the 1, 5 and 10 percent level, respectively.

22
Table 9: The Short-Run Olympics Effect on City Growth Using Cities of Host and Candidate Countries as Control Group
Time Interval around Olympic Games (+/- Years) Full 10 20 30 40 50 60 70 80 90 100 Sample
Candidate City Dummy -0.011 0.002 0.015 0.024# 0.027* 0.031* 0.041** 0.047** 0.051** 0.050** 0.046** (0.016) (0.015) (0.013) (0.013) (0.012) (0.012) (0.012) (0.012) (0.012) (0.012) (0.012) Olympic City Dummy -0.007 0.009 0.002 0.004 -0.000 -0.005 -0.015 -0.022 -0.021 -0.021 -0.015 (0.031) (0.029) (0.025) (0.025) (0.023) (0.022) (0.022) (0.021) (0.022) (0.022) (0.021) Post Olympics Dummy -0.051** -0.052** -0.069** -0.078** -0.085** -0.090** -0.092** -0.093** -0.094** -0.094** -0.094** (0.008) (0.006) (0.006) (0.005) (0.005) (0.005) (0.005) (0.005) (0.005) (0.005) (0.005) Candidate City Dummy 0.034 0.004 -0.012 -0.025 -0.025# -0.030* -0.040** -0.046** -0.051** -0.050** -0.046** ×Post Olympics Dummy (0.025) (0.019) (0.016) (0.016) (0.014) (0.014) (0.014) (0.014) (0.014) (0.014) (0.013) Olympic City Dummy × -0.098* -0.058 -0.054# -0.054# -0.052# -0.047# -0.034 -0.024 -0.023 -0.023 -0.028 Post Olympics Dummy (0.047) (0.039) (0.032) (0.030) (0.027) (0.026) (0.025) (0.024) (0.025) (0.024) (0.024) Time fixed effects? Yes Yes Yes Yes Yes Yes Yes Yes Yes Yes Yes Olympics fixed effects? No No No No No No No No No No No Olympic-year fixed effects?
No No No No No No No No No No No
Observations 3,786 6,092 8,264 10,185 11,883 13,194 14,306 15,133 15,790 16,140 16,511 Adj. R2 0.041 0.056 0.067 0.079 0.090 0.100 0.108 0.116 0.119 0.116 0.105 Notes: OLS estimation. Dependent variable is log of city population growth. Robust standard errors in parentheses. **, * and # denote significant at the 1, 5 and 10 percent level, respectively.

23
Table 10: The Olympics Effect on City Growth
Using Cities of Host Countries as Control Group Using Candidate Cities as Control Group
1950-2005 1950-2025 1950-2005 1950-2025 Olympic City Dummy -0.058** 0.061** -0.058** 0.045** 0.037** 0.037** 0.037** 0.036** (0.009) (0.010) (0.009) (0.009) (0.009) (0.010) (0.009) (0.009) Post Olympics Dummy -0.089** -0.054** -0.087** -0.058** -0.027** -0.026** -0.026** -0.025** (0.004) (0.003) (0.003) (0.003) (0.004) (0.004) (0.004) (0.004) Olympic City Dummy × 0.009 -0.034** 0.013 -0.026** -0.045** -0.045** -0.043** -0.044** Post Olympics Dummy (0.010) (0.011) (0.010) (0.010) (0.010) (0.011) (0.010) (0.010) Lagged Log City Size -0.056** -0.049** 0.004* 0.004* (0.002) (0.001) (0.002) (0.001) Year fixed effects? Yes Yes Yes Yes Yes Yes Yes Yes Olympics fixed effects? No No No No No No No No Olympic-year fixed effects?
No No No No No No No No
Observations 6,204 6,204 8,460 8,460 1,321 1,321 1,801 1,801 Adj. R2 0.168 0.350 0.200 0.349 0.449 0.451 0.435 0.437 Notes: OLS estimation. Dependent variable is log of city population growth. Robust standard errors in parentheses. **, * and # denote significant at the 1, 5 and 10 percent level, respectively.

24
Figure 1: The Olympics Effect on City Growth Using Cities of Host Countries as Control Group
-.2
0.2
.4.6
Coe
ff. o
n O
lym
pic
city
dum
my
-10 -5 0 5 10Decades from Olympic Games
Year fixed effects
-.2
0.2
.4.6
Coe
ff. o
n O
lym
pic
city
dum
my
-10 -5 0 5 10Decades from Olympic Games
Post Olympics dummy
-.4
-.2
0.2
.4.6
Coe
ff. o
n O
lym
pic
city
dum
my
-10 -5 0 5 10Decades from Olympic Games
Olympics fixed effects-.
20
.2.4
Coe
ff. o
n O
lym
pic
city
dum
my
-10 -5 0 5 10Decades from Olympic Games
Olympics-year fixed effects

25
Figure 2: The Olympics Effect on City Growth Using Candidate Cities as Control Group
-.4
-.2
0.2
.4C
oeff.
on
Oly
mpi
c ci
ty d
umm
y
-10 -5 0 5 10Decades from Olympic Games
Year fixed effects
-.4
-.2
0.2
.4C
oeff.
on
Oly
mpi
c ci
ty d
umm
y
-10 -5 0 5 10Decades from Olympic Games
Post Olympics dummy
-.4
-.2
0.2
.4C
oeff.
on
Oly
mpi
c ci
ty d
umm
y
-10 -5 0 5 10Decades from Olympic Games
Olympics fixed effects-.
4-.
20
.2C
oeff.
on
Oly
mpi
c ci
ty d
umm
y
-10 -5 0 5 10Decades from Olympic Games
Olympics-year fixed effects

26
Appendix A1: List of Olympic and Candidate Cities
Year Olympic City Candidate Cities 1896 Athens 1900 Paris 1904 St. Louis Buffalo, Chicago 1908 London Berlin, Milan, Turin, Rome 1912 Stockholm Berlin 1916 Berlin Alexandria, Budapest 1920 Antwerp Amsterdam, Lyon 1924 Paris Amsterdam, Barcelona, Los Angeles, Rome, Prague 1928 Amsterdam Los Angeles 1932 Los Angeles 1936 Berlin Barcelona, Budapest, Rome 1940 Tokyo Helsinki 1944 London Detroit, Helsinki, Lausanne, Rome 1948 London Baltimore, Lausanne, Los Angeles, Minneapolis, Philadelphia 1952 Helsinki Amsterdam, Chicago, Detroit, Los Angeles, Minneapolis,
Philadelphia 1956 Melbourne Buenos Aires, Chicago, Detroit, Los Angeles, Mexico City,
Minneapolis, Philadelphia, San Francisco 1960 Rome Brussels, Budapest, Detroit, Lausanne, Mexico City, Tokyo 1964 Tokyo Brussels, Detroit, Vienna 1968 Mexico City Buenos Aires, Detroit, Lyon 1972 Munich Detroit, Madrid, Montreal 1976 Montreal Los Angeles, Moscow 1980 Moscow Los Angeles 1984 Los Angeles 1988 Seoul Nagoya 1992 Barcelona Amsterdam, Belgrade, Birmingham, Brisbane, Paris 1996 Atlanta Athens, Belgrade, Manchester, Melbourne, Toronto 2000 Sydney Beijing, Berlin, Istanbul, Manchester Source: IOC Olympic Studies Centre
27
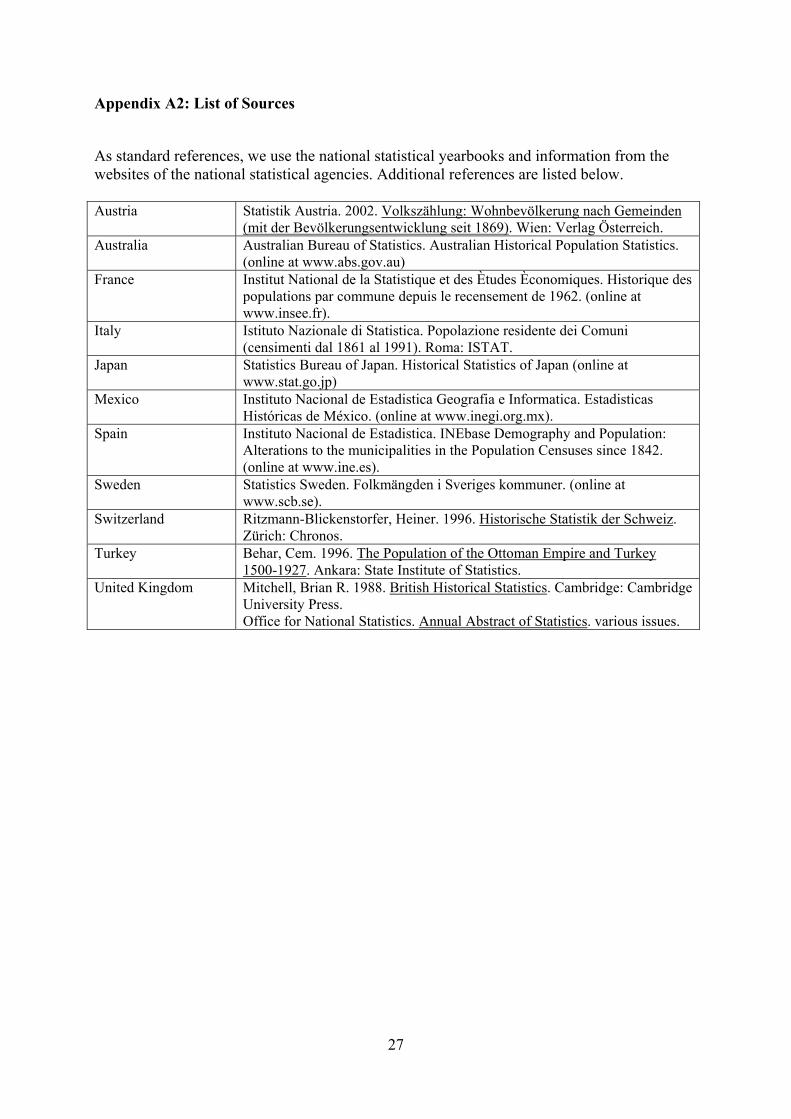
Appendix A2: List of Sources
As standard references, we use the national statistical yearbooks and information from the websites of the national statistical agencies. Additional references are listed below. Austria Statistik Austria. 2002. Volkszählung: Wohnbevölkerung nach Gemeinden
(mit der Bevölkerungsentwicklung seit 1869). Wien: Verlag Österreich. Australia Australian Bureau of Statistics. Australian Historical Population Statistics.
(online at www.abs.gov.au) France Institut National de la Statistique et des Ètudes Èconomiques. Historique des
populations par commune depuis le recensement de 1962. (online at www.insee.fr).
Italy Istituto Nazionale di Statistica. Popolazione residente dei Comuni (censimenti dal 1861 al 1991). Roma: ISTAT.
Japan Statistics Bureau of Japan. Historical Statistics of Japan (online at www.stat.go.jp)
Mexico Instituto Nacional de Estadistica Geografia e Informatica. Estadisticas Históricas de México. (online at www.inegi.org.mx).
Spain Instituto Nacional de Estadistica. INEbase Demography and Population: Alterations to the municipalities in the Population Censuses since 1842. (online at www.ine.es).
Sweden Statistics Sweden. Folkmängden i Sveriges kommuner. (online at www.scb.se).
Switzerland Ritzmann-Blickenstorfer, Heiner. 1996. Historische Statistik der Schweiz. Zürich: Chronos.
Turkey Behar, Cem. 1996. The Population of the Ottoman Empire and Turkey 1500-1927. Ankara: State Institute of Statistics.
United Kingdom Mitchell, Brian R. 1988. British Historical Statistics. Cambridge: Cambridge University Press. Office for National Statistics. Annual Abstract of Statistics. various issues.