the journal of fixed income - institutional web...
TRANSCRIPT
VOLUME 23 NUMBER 4 SPRING 2014
FIXED INCOMEThe Journal of
www.iijfi.com
The Voices of Influence | iijournals.com
THE JOURNAL OF FIXED INCOME 51SPRING 2014
Low-Risk Anomalies in Global Fixed Income: Evidence from Major Broad MarketsRAUL LEOTE DE CARVALHO, PATRICK DUGNOLLE, XIAO LU, AND PIERRE MOULIN
RAUL LEOTE DE CARVALHO
is head of quantitative strategies and research for financial engineering at BNP Paribas Investment Partners in Paris, [email protected]
PATRICK DUGNOLLE
is head of fixed income for financial engineering at BNP Paribas Investment Partners in Paris, [email protected]
XIAO LU
is a quantitative analyst for financial engineering at BNP Paribas Investment Partners in Paris, [email protected]
PIERRE MOULIN
is head of financial engi-neering at BNP Paribas Investment Partners in Paris, [email protected]
The first references to a low-risk anomaly in financial markets date back to the report by Haugen and Heins [1972] and the paper
by Black, Jensen, and Scholes [1972]. In the first, the authors found empirically that the relationship between return and risk for U.S. equities between 1926 and 1969 had been much f latter than predicted by the capital asset pricing model (CAPM) with returns to port-folios invested in the lowest-risk stocks much higher than predicted by CAPM. Conversely, portfolios invested in riskier stocks had much lower returns than predicted by CAPM. In the second paper, the authors proved theoretically that in a world where leverage costs more than the risk-free rate, the relationship between return and risk must be f latter than predicted by CAPM. Since then, the evidence of the low-risk anomaly in equity markets has grown, with a vast number of papers documenting it both empirically and theoretically.
Recently, Baker and Haugen [2012] confirmed that the lowest-risk stocks out-performed in all observable markets in the world. For the U.S., the evidence spans 86 years of history and for most other markets there is evidence at least since the seven-ties. It has also been shown in a number of studies that neither the three-factor Fama and French [1992] model nor the four-factor Carhart [1997] model succeeds in explaining the positive alpha in low-risk stocks. Blitz,
Falkenstein, and van Vilet [2013] reviewed the literature on the low-volatility anomaly. They listed the possible explanations put for-ward so far for the anomalous behavior of stocks, which CAPM did not predict.
Not all evidence is empirical. Theo-retical evidence has been produced simply by analyzing the consequences of replacing some of the hypothesis behind CAPM with more realistic ones. The first example was the Black, Jensen, and Scholes [1972] paper mentioned earlier, looking at the impact of increasing the cost of leverage beyond the risk-free rate. Frazzini and Pedersen [2011] demonstrated that if agents have a con-strained access to leverage limited to some multiple of their wealth, then stocks with the lowest risk, as measured by beta, must have positive alpha and stocks with the highest risk must have negative alpha. Blitz [2012] demonstrated that in a world with peered-delegated portfolio management, where per-formance is benchmarked against the returns to the market portfolio, managers must prefer the higher-returning high-beta stocks over the lower-returning low-beta stocks, because both represent similar risk from a bench-mark-relative perspective. This incentive for delegated managers to bid up the prices of high-beta stocks and ignore low-beta stocks can be shown to generate positive alpha in low-risk stocks and negative alpha in high-risk stocks.
JFI-CARVALHO.indd 51 3/18/14 8:43:56 AM
RAUL LEOTE
DE CARVALHO
is the deputy head of financial engineering at BNP Paribas Investment [email protected]
PATRICK DUGNOLLE
is a quantitative portfolio manager at THEAM, an investment management subsidiary of BNP Paribas Investment Partners focused on protected, indexed and model driven investment solutions. [email protected]
XIAO LU
is head of research for financial engineering at BNP Paribas Investment Partners. [email protected]
PIERRE MOULIN
is head of distribution marketing with oversight for financial engineering at BNP Paribas Investment Partners. [email protected]
LOW-RISK ANOMALIES IN GLOBAL FIXED INCOME: EVIDENCE FROM MAJOR BROAD MARKETS SPRING 2014
The conclusions of Black, Jensen and Scholes [1972], Blitz [2012] and Frazzini and Pedersen [2013] should also apply to fixed income markets. In fact, the latter also give empirical evidence of a low-risk anomaly in the U.S. Treasury and corporate bond markets. Their results were not the first evidence of a low-risk anomaly in f ixed income markets. Haugen and Heins [1972] had already provided empirical evidence that portfo-lios invested in lower-risk U.S. Treasury bonds offered higher compenzation for risk than predicted by CAPM. The converse held true for portfolios invested in riskier U.S. Treasury bonds. Much later, Pilotte and Sterbenz [2006] discussed the low-risk anomaly in the U.S. Trea-sury market and showed that the Sharpe ratio is very high for short-term bills and bonds and decreases with bond maturity, and hence with risk. Risk simply seems to increase at a faster rate than returns along the yield curve. The Sharpe ratio of longer-dated bonds is com-parable to that of equities whereas the Sharpe ratio for short-term bills and bonds is significantly higher. The fact that three-month Treasury bills would have to be levered 63 times in a portfolio for its risk to be compa-rable to that of an equity portfolio and 21 times to reach the risk of a five-year bond portfolio illustrates well how leverage constraints and costs pose a limit on any attempt to arbitrage away the low-risk anomaly. Similar results were found when Treynor ratios, which account for the exposure to the market portfolio, were used. Higher Treynor ratios were found for the short-term bills and bonds than for longer-dated bonds, evidence that low-risk bills and bonds must have positive alpha. They also showed that the alpha of short-term Treasury bills and bonds cannot be explained, even going beyond CAPM and using a number of affine models proposed by Duffee [2002], which rely on the findings of Litterman and Scheinkman [1991] that three factors should account for most of the variation in the prices of Treasuries.
Derwall, Huij and de Zwart [2009] reported a short-term anomaly for the universe of U.S. corporate bonds and a universe of U.S. corporate mutual funds. They found that returns to portfolios invested in short-term bonds and short-term corporate mutual funds (those with lowest sensitivity to the aggregate risk pre-mium) exhibited positive alpha and abnormally higher Sharpe ratios between October 1991 and December 2003. They also went beyond CAPM and showed that the two-factor model proposed by Gebhardt, Hvidkjaer, and Swaminathan [2005], the extended CAPM three-
factor model proposed by Huij and Derwall [2008], and even the four-factor model of Elton, Gruber, and Blake [1995] all still failed to explain the returns of short-term corporate bonds and corporate mutual funds. Aussenegg, Göetz, and Jelic [2012] extended the analysis to Euro-pean corporate bonds and essentially observed a behavior similar to that of U.S. corporate bonds, with short-dated bonds generating higher returns than can be explained by the same factors models.
In this article, we argue that what has been called a short-term anomaly is indeed no more than a low- risk anomaly much like what has been observed in equity markets. We argue that simply using volatility, beta, or term exposure to capture this alpha is not optimal because these risk measures are not constant over time for individual bonds. All other things being equal, the risk of a bond decreases with time. Thus measures of risk that require using a historical window of several years in their estimation will be inaccurate and will exclude all bonds issued most recently for which not enough data is yet available. Instead, we consider only those bond risk measures that do not require historical returns for their estimation. The five risk metrics we use are the dura-tion-times-yield (DTY), also known as yield elasticity, introduced by Fisher [2006], the modified duration, the yield-to-maturity (YTM), and for corporate bonds, the duration-times-spread (DTS), introduced by Ben Dor, Dynkin, Hyman, Houweling, van Leeuwen, and Pen-ninga [2007], and the option-adjusted spread (OAS).
Bond risk arises either through the passage of time, which is predictable, or through changes in yields. The Macaulay duration, which is the time-weighted average of the present value PVi
of future cash f lows i paid at time t
i relative to the present value V of all future cash
f lows, measures the time required to recover an initial investment in a bond at current level of yields:
∑=MacDt PV
Vi iPVV
i
(1)
In turn, the modified duration, which measures the sensitivity of the bond value to changes in yields, is the percentage change in bond value for a unit change in yield and can be calculated from the Macaulay duration:
DMacD
( )1 YTMTTk
= (2)
JFI-CARVALHO.indd 52 3/18/14 8:43:56 AM
THE JOURNAL OF FIXED INCOME SPRING 2014
where k is the compounding frequency per year (1 for annual, 2 for semi-annual, 12 for monthly, 52 for weekly).
Yield elasticity (YE) of bond value is the per-centage change in bond value divided by a one per-centage change in the yield to maturity of the bond. It is simply equal to the modified duration times the yield (DTY):
DTY D YTMTT×D (3)
Fisher [2006] found that the DTY is a far more reliable measure of one-month-ahead interest rate risk than the modified duration and substantially more reli-able than the yield to maturity. His major criticism of modified duration as a measure of interest rate risk is the fact that yield changes depend on the level of yields, which modified duration does not take into account. DTY tells us that bonds with long duration and low yields are in fact as risky as bonds with short duration and high yields. His empirical tests confirmed that mod-ified duration is not a useful measure of interest rate risk and demonstrated the superiority of DTY.
DTS is the equivalent of DTY for credit risk. DTS is the sensitivity of the value of a corporate bond to a one percentage change in spread and is simply the product of the spread duration Ds
, which measures the sensitivity of the bond value to a change in OAS, multiplied by the option-adjusted spread:
DTS DTT OASs ×D (4)
DTS tells us that low-spread and long-duration corporate bonds have as much credit risk as high-spread and short-duration corporate bonds. This was confirmed empirically by Ben Dor et al. [2007]. Similar to modi-fied duration, the problem with spread duration as a measure of credit risk is that changes in spread depend on the level of spreads.
In our empirical analysis, we consider the universes of corporate investment grade bonds denominated in USD, EUR, GBP, and JPY in greater detail. To empiri-cally demonstrate the risk anomaly, we use a technique borrowed from the world of equities. Every month we rank the universe of corporate bonds of a given currency by the measures of risk and form quintile portfolios. The first quintile portfolio invests in the lowest-risk bonds, the last in the highest-risk bonds. Bonds are market-
capitalization weighted in each quintile portfolio and portfolios are rebalanced at the end of each month. We then analyze the performance and risk of each quintile portfolio constructed in this way, also estimating its beta and alpha over the back-tested period. The turnover of the portfolios is not excessive, confirmed by an analysis of the impact of realistic transaction costs.
We repeated the exercise for DTY, modified dura-tion, yield, DTS, and OAS. The results demonstrate the superiority of DTY as a predictive risk measure, as well as at uncovering the risk anomaly. Indeed, the analysis of returns and risk of the quintile portfolios shows that those portfolios invested in the corporate bonds with the lowest DTY realize some of the lowest levels of vola-tility and beta and some of the largest positive alpha and Sharpe ratio, irrespective of the currency considered. The difference between the positive alpha found in port-folios invested in the bonds with the lowest DTY and the negative alpha found in portfolios with the largest DTY is at least as large as that obtained using the other measures of risk to rank corporate bonds.
We extend the analysis to sovereign bonds and quasi and foreign government bonds denominated in USD, EUR, GBP, and JPY using DTY. We also inves-tigate securitized and collateralized bonds and corporate high yield bonds denominated in USD, EUR, and GBP, as well as the aggregates of the corporate investment grade with corporate high yield bond universes for these currencies. Finally, we consider emerging cor-porate bonds denominated in USD and also the aggre-gate of all universes of bonds denominated in EUR, i.e., the euro broad universe. In all cases, the results from our analyses were extremely consistent with port-folios invested in bonds with the lowest DTY always realizing lower volatilities, lower beta, and delivering positive alpha and the largest Sharpe ratio while port-folios invested in bonds with the highest DTY always realized the larger volatilities, higher beta, and deliv-ered negative alpha and lowest Sharpe ratio. The out-come is invariant to increasing the size of universe by aggregating different segments together and using the market capitalization of the aggregated universe as the reference benchmark index for alpha and beta estima-tion. For example, aggregating corporate high yield bonds and corporate investment grade bond universes still gives results perfectly in line with the analysis of each universe separately.
JFI-CARVALHO.indd 53 3/18/14 8:43:57 AM
LOW-RISK ANOMALIES IN GLOBAL FIXED INCOME: EVIDENCE FROM MAJOR BROAD MARKETS SPRING 2014
DATA
We relied on the Global Index System (GIS) from Bank of America Merrill Lynch (BofA ML) using its historical index constitu-ents, starting in January 1997 and monthly updating until December 2012. The GIS from BofA ML offers an extensive coverage of a complete range of individual bond issues across all liquid bond markets and is widely used by fixed income asset managers for bench-marking and calculation of portfolios’ net asset values. Thus, beyond the use of historical index constituents, the BofA ML database was also used to provide the pricing of individual bonds, in terms of monthly total returns and monthly cash rates in each currency consid-ered, as well as a consistent set of individual risk measures. The database includes 85,442 individual bonds in the 192 months of history used in our analysis. Bonds with less than one year of maturity are automatically removed by BofA ML. More details were provided by Galdi, Peacock and Goldblatt [2012].
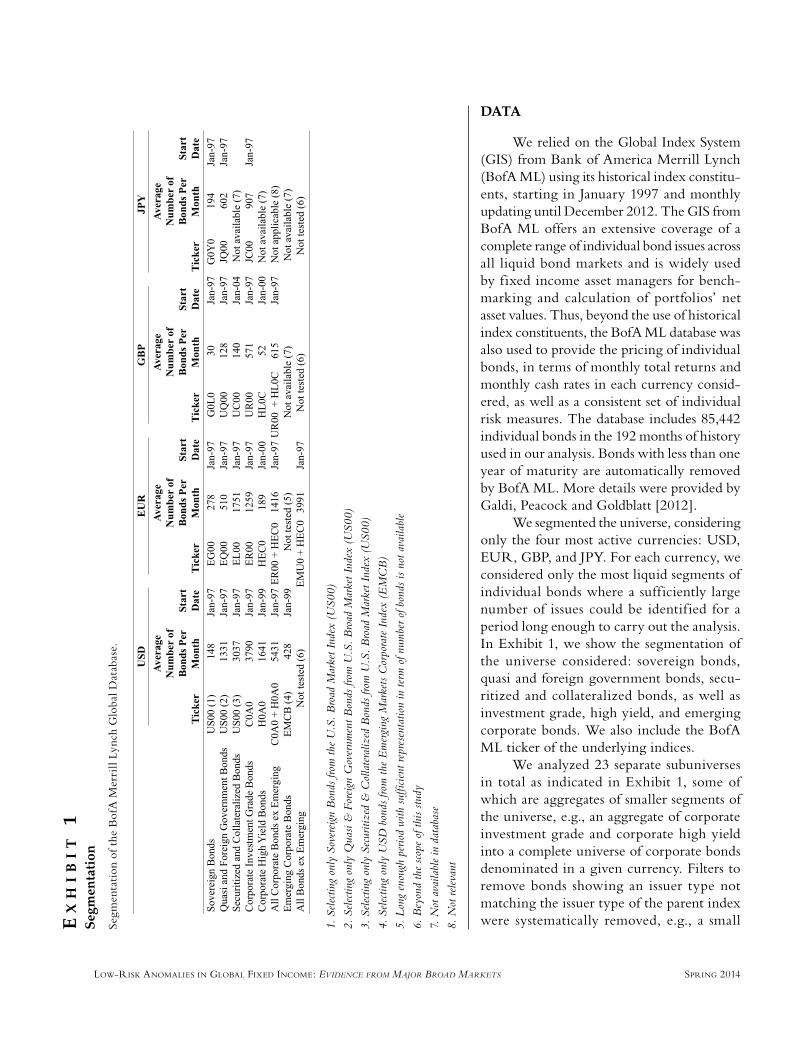
We segmented the universe, considering only the four most active currencies: USD, EUR, GBP, and JPY. For each currency, we considered only the most liquid segments of individual bonds where a sufficiently large number of issues could be identif ied for a period long enough to carry out the analysis. In Exhibit 1, we show the segmentation of the universe considered: sovereign bonds, quasi and foreign government bonds, secu-ritized and collateralized bonds, as well as investment grade, high yield, and emerging corporate bonds. We also include the BofA ML ticker of the underlying indices.
We analyzed 23 separate subuniverses in total as indicated in Exhibit 1, some of which are aggregates of smaller segments of the universe, e.g., an aggregate of corporate investment grade and corporate high yield into a complete universe of corporate bonds denominated in a given currency. Filters to remove bonds showing an issuer type not matching the issuer type of the parent index were systematically removed, e.g., a small E
XH
IB
IT
1S
egm
enta
tion
Segm
enta
tion
of t
he B
ofA
Mer
rill
Lync
h G
loba
l Dat
abas
e.
1. S
elec
ting
only
Sov
erei
gn B
onds
from
the
U.S
. B
road
Mar
ket I
ndex
(U
S00)
2. S
elec
ting
only
Qua
si &
For
eign
Gov
ernm
ent B
onds
from
U.S
. B
road
Mar
ket I
ndex
(U
S00)
3. S
elec
ting
only
Sec
uriti
zed
& C
olla
tera
lized
Bon
ds fr
om U
.S.
Bro
ad M
arke
t Ind
ex (
US0
0)
4. S
elec
ting
only
USD
bon
ds fr
om th
e E
mer
ging
Mar
kets
Cor
pora
te I
ndex
(E
MC
B)
5. L
ong
enou
gh p
erio
d w
ith s
uffic
ient
repr
esen
tatio
n in
term
of n
umbe
r of b
onds
is n
ot a
vaila
ble
6. B
eyon
d th
e sc
ope
of th
is st
udy
7. N
ot a
vaila
ble
in d
atab
ase
8. N
ot re
leva
nt
JFI-CARVALHO.indd 54 3/18/14 8:43:57 AM
THE JOURNAL OF FIXED INCOME SPRING 2014
number of securitized and collateralized bonds were classified as corporate bonds, in particular in the earlier history of the universe. In Exhibit 1, we also include the average number of bond issues in each case study as well as the start date used in the analysis.
Particularly important is the fact that the BofA ML database includes issues of companies that suffered bankruptcy or were involved in M&A activity during the period used for the analysis. The final prices of those issues take into account recovery rates and in this sense our results should not suffer from survivorship bias. Accrued interest and reinvestment at the end of each month of cash proceeds from intra-month coupon pay-ments is also taken into consideration.
METHODOLOGY
In each segment considered, we ranked the bonds in the universe by a given risk measure and formed quin-
tile portfolios. In each quintile, the bonds were weighted by their market value. The portfolios were rebalanced at the end of each month to take into account the changes in rankings. The returns to each quintile portfolio have been calculated from the monthly total returns of each bond month and include accrued interest of coupon pay-ments during the month. Cash is reinvested at the end of the month.
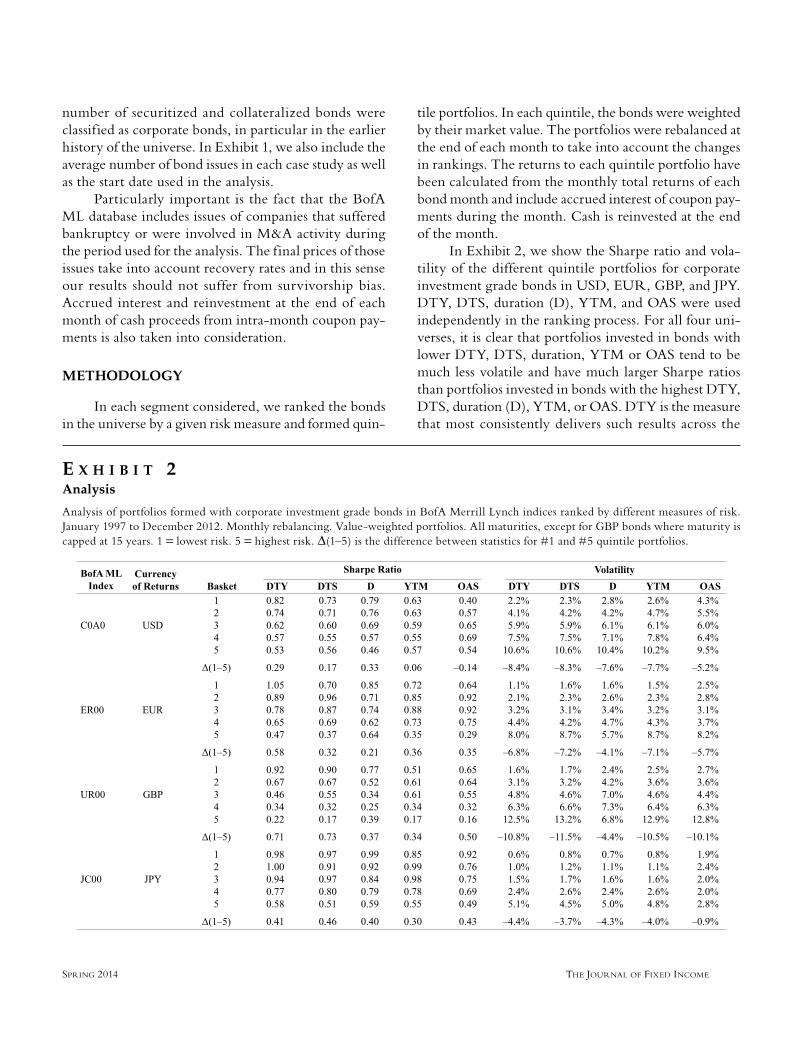
In Exhibit 2, we show the Sharpe ratio and vola-tility of the different quintile portfolios for corporate investment grade bonds in USD, EUR, GBP, and JPY. DTY, DTS, duration (D), YTM, and OAS were used independently in the ranking process. For all four uni-verses, it is clear that portfolios invested in bonds with lower DTY, DTS, duration, YTM or OAS tend to be much less volatile and have much larger Sharpe ratios than portfolios invested in bonds with the highest DTY, DTS, duration (D), YTM, or OAS. DTY is the measure that most consistently delivers such results across the
E X H I B I T 2Analysis
Analysis of portfolios formed with corporate investment grade bonds in BofA Merrill Lynch indices ranked by different measures of risk. January 1997 to December 2012. Monthly rebalancing. Value-weighted portfolios. All maturities, except for GBP bonds where maturity is capped at 15 years. 1 = lowest risk. 5 = highest risk. Δ(1–5) is the difference between statistics for #1 and #5 quintile portfolios.
JFI-CARVALHO.indd 55 3/18/14 8:43:57 AM
LOW-RISK ANOMALIES IN GLOBAL FIXED INCOME: EVIDENCE FROM MAJOR BROAD MARKETS SPRING 2014
universes considered. OAS is the measure that delivers less consistent results. For USD, portfolios with high OAS actually have higher Sharpe ratio than portfolios with lower OAS, and portfolios with low YTM have Sharpe ratios only marginally higher than those with high YTM. The difference in volatility of portfolios invested in low OAS and high OAS is smaller for USD, EUR, and JPY bonds than when other measures are used.
Note again that portfolios invested in low-duration bonds include not only bonds with very short maturities but also bonds with much longer maturities and very large spreads. These bonds with longer maturity and very large spreads are excluded from the low DTY and DTS portfolios, that being the key difference between ranking by duration and DTY or DTS. In turn, DTY is more general than DTS and can be applied to all bonds. Similarly, YTM is more general than OAS.
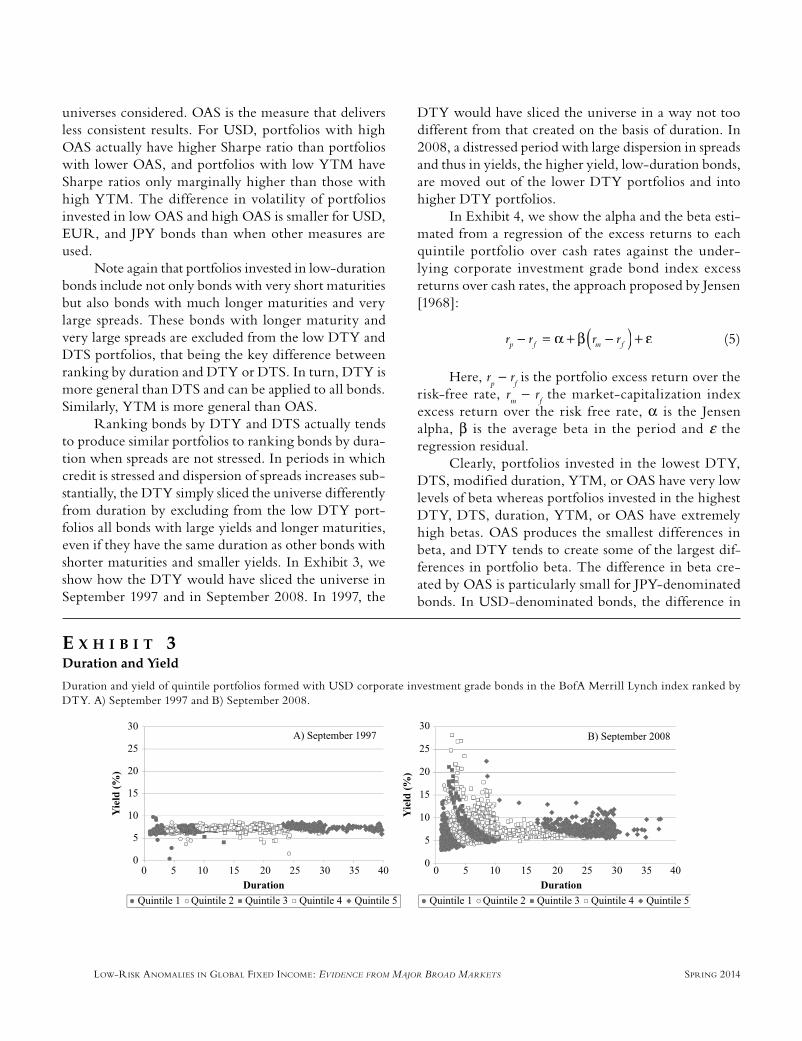
Ranking bonds by DTY and DTS actually tends to produce similar portfolios to ranking bonds by dura-tion when spreads are not stressed. In periods in which credit is stressed and dispersion of spreads increases sub-stantially, the DTY simply sliced the universe differently from duration by excluding from the low DTY port-folios all bonds with large yields and longer maturities, even if they have the same duration as other bonds with shorter maturities and smaller yields. In Exhibit 3, we show how the DTY would have sliced the universe in September 1997 and in September 2008. In 1997, the
E X H I B I T 3Duration and Yield
Duration and yield of quintile portfolios formed with USD corporate investment grade bonds in the BofA Merrill Lynch index ranked by DTY. A) September 1997 and B) September 2008.
DTY would have sliced the universe in a way not too different from that created on the basis of duration. In 2008, a distressed period with large dispersion in spreads and thus in yields, the higher yield, low-duration bonds, are moved out of the lower DTY portfolios and into higher DTY portfolios.
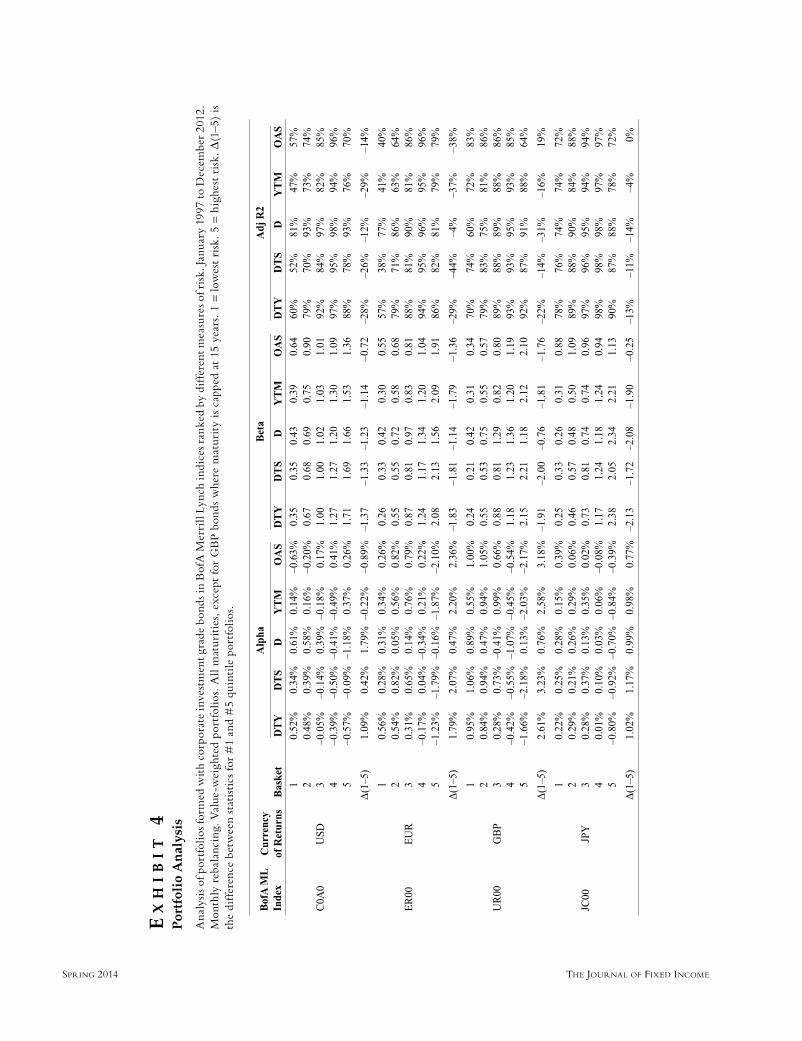
In Exhibit 4, we show the alpha and the beta esti-mated from a regression of the excess returns to each quintile portfolio over cash rates against the under-lying corporate investment grade bond index excess returns over cash rates, the approach proposed by Jensen [1968]:
r rp fr r ( )rm fr=r α + β(rmr + ε (5)
Here, rp − r
f is the portfolio excess return over the
risk-free rate, rm − r
f the market-capitalization index
excess return over the risk free rate, α is the Jensen alpha, β is the average beta in the period and ε the regression residual.
Clearly, portfolios invested in the lowest DTY, DTS, modified duration, YTM, or OAS have very low levels of beta whereas portfolios invested in the highest DTY, DTS, duration, YTM, or OAS have extremely high betas. OAS produces the smallest differences in beta, and DTY tends to create some of the largest dif-ferences in portfolio beta. The difference in beta cre-ated by OAS is particularly small for JPY-denominated bonds. In USD-denominated bonds, the difference in
JFI-CARVALHO.indd 56 3/18/14 8:43:58 AM
THE JOURNAL OF FIXED INCOME SPRING 2014
EX
HI
BI
T 4
Por
tfol
io A
nal
ysis
Ana
lysi
s of p
ortf
olio
s for
med
wit
h co
rpor
ate
inve
stm
ent g
rade
bon
ds in
Bof
A M
erri
ll Ly
nch
indi
ces r
anke
d by
dif
fere
nt m
easu
res o
f ris
k. Ja
nuar
y 19
97 to
Dec
embe
r 20
12.
Mon
thly
reb
alan
cing
. Val
ue-w
eigh
ted
port
folio
s. A
ll m
atur
itie
s, e
xcep
t fo
r G
BP
bond
s w
here
mat
urit
y is
cap
ped
at 1
5 ye
ars.
1 =
low
est
risk
. 5 =
hig
hest
ris
k. Δ
(1–5
) is
th
e di
ffer
ence
bet
wee
n st
atis
tics
for
#1
and
#5
quin
tile
por
tfol
ios.
JFI-CARVALHO.indd 57 3/18/14 8:44:04 AM
LOW-RISK ANOMALIES IN GLOBAL FIXED INCOME: EVIDENCE FROM MAJOR BROAD MARKETS SPRING 2014
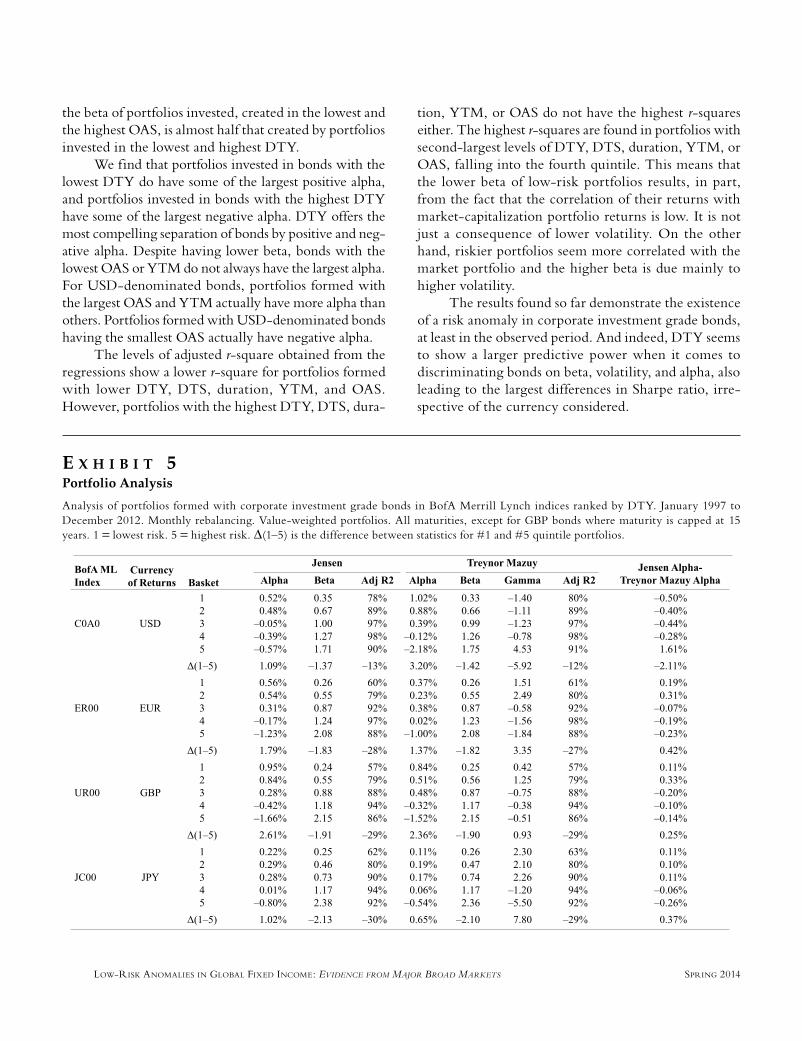
the beta of portfolios invested, created in the lowest and the highest OAS, is almost half that created by portfolios invested in the lowest and highest DTY.
We find that portfolios invested in bonds with the lowest DTY do have some of the largest positive alpha, and portfolios invested in bonds with the highest DTY have some of the largest negative alpha. DTY offers the most compelling separation of bonds by positive and neg-ative alpha. Despite having lower beta, bonds with the lowest OAS or YTM do not always have the largest alpha. For USD-denominated bonds, portfolios formed with the largest OAS and YTM actually have more alpha than others. Portfolios formed with USD-denominated bonds having the smallest OAS actually have negative alpha.
The levels of adjusted r-square obtained from the regressions show a lower r-square for portfolios formed with lower DTY, DTS, duration, YTM, and OAS. However, portfolios with the highest DTY, DTS, dura-
tion, YTM, or OAS do not have the highest r-squares either. The highest r-squares are found in portfolios with second-largest levels of DTY, DTS, duration, YTM, or OAS, falling into the fourth quintile. This means that the lower beta of low-risk portfolios results, in part, from the fact that the correlation of their returns with market-capitalization portfolio returns is low. It is not just a consequence of lower volatility. On the other hand, riskier portfolios seem more correlated with the market portfolio and the higher beta is due mainly to higher volatility.
The results found so far demonstrate the existence of a risk anomaly in corporate investment grade bonds, at least in the observed period. And indeed, DTY seems to show a larger predictive power when it comes to discriminating bonds on beta, volatility, and alpha, also leading to the largest differences in Sharpe ratio, irre-spective of the currency considered.
E X H I B I T 5Portfolio Analysis
Analysis of portfolios formed with corporate investment grade bonds in BofA Merrill Lynch indices ranked by DTY. January 1997 to December 2012. Monthly rebalancing. Value-weighted portfolios. All maturities, except for GBP bonds where maturity is capped at 15 years. 1 = lowest risk. 5 = highest risk. Δ(1–5) is the difference between statistics for #1 and #5 quintile portfolios.
JFI-CARVALHO.indd 58 3/18/14 8:44:05 AM
THE JOURNAL OF FIXED INCOME SPRING 2014
When the beta of portfolios is not constant over time, the Jensen alpha can include market-timing effects, i.e., a larger beta when market returns in excess of cash are positive and a smaller beta when market returns in excess of cash are negative would add to positive Jensen alpha. The regression approach proposed by Treynor and Mazuy [1966] separates the alpha due to cross-sectional selection from the market timing effects associated with a variable beta in time. The regression they proposed is then:
( ) ( )= α + +) γ ( + ε
2r r− b( ) +) γ (p fr r TM
(6)
with αΤΜ the Treynor-Mazuy alpha, b the Treynor-Mazuy beta, and γ a measure of market-timing skill.
In Exhibit 5, we show the results obtained from Treynor-Mazuy regression for portfolios formed with bonds ranked by DTY.
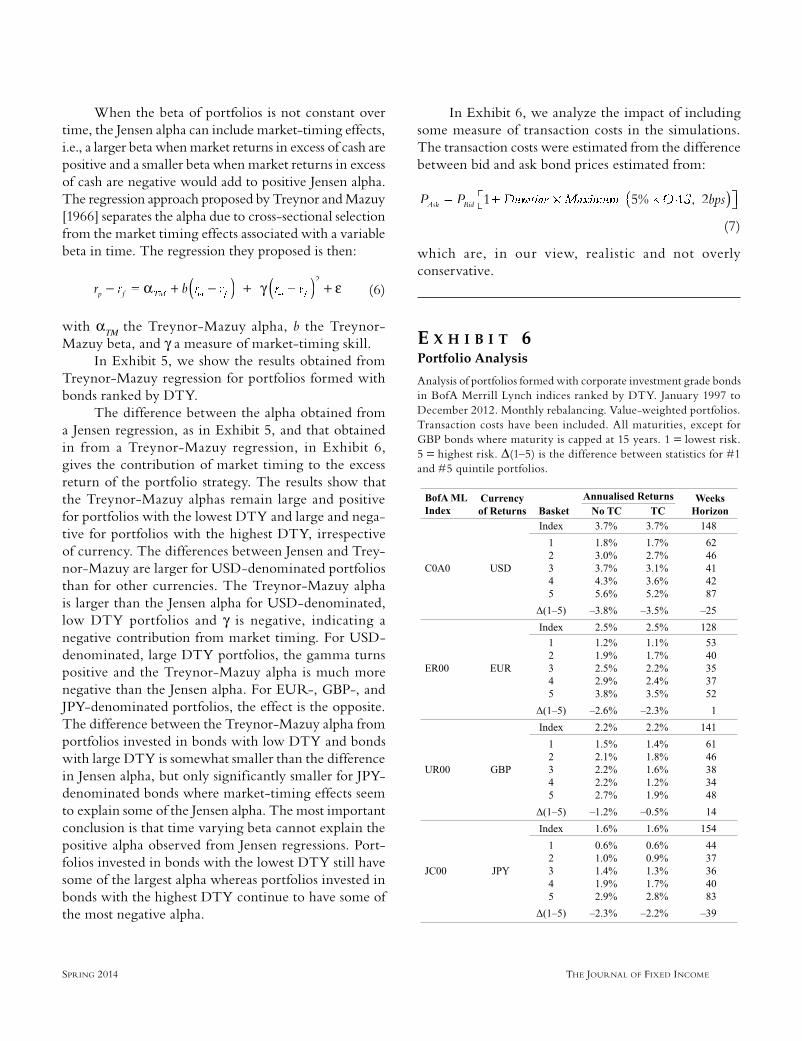
The difference between the alpha obtained from a Jensen regression, as in Exhibit 5, and that obtained in from a Treynor-Mazuy regression, in Exhibit 6, gives the contribution of market timing to the excess return of the portfolio strategy. The results show that the Treynor-Mazuy alphas remain large and positive for portfolios with the lowest DTY and large and nega-tive for portfolios with the highest DTY, irrespective of currency. The differences between Jensen and Trey-nor-Mazuy are larger for USD-denominated portfolios than for other currencies. The Treynor-Mazuy alpha is larger than the Jensen alpha for USD-denominated, low DTY portfolios and γ is negative, indicating a negative contribution from market timing. For USD-denominated, large DTY portfolios, the gamma turns positive and the Treynor-Mazuy alpha is much more negative than the Jensen alpha. For EUR-, GBP-, and JPY-denominated portfolios, the effect is the opposite. The difference between the Treynor-Mazuy alpha from portfolios invested in bonds with low DTY and bonds with large DTY is somewhat smaller than the difference in Jensen alpha, but only significantly smaller for JPY-denominated bonds where market-timing effects seem to explain some of the Jensen alpha. The most important conclusion is that time varying beta cannot explain the positive alpha observed from Jensen regressions. Port-folios invested in bonds with the lowest DTY still have some of the largest alpha whereas portfolios invested in bonds with the highest DTY continue to have some of the most negative alpha.
In Exhibit 6, we analyze the impact of including some measure of transaction costs in the simulations. The transaction costs were estimated from the difference between bid and ask bond prices estimated from:
1P PAsP k Bid ( )5% ,S b, 2 psb1PBPP id 5%⎡⎣⎡⎡ ⎤⎦⎤⎤
(7)
which are, in our view, realistic and not overly conservative.
E X H I B I T 6Portfolio Analysis
Analysis of portfolios formed with corporate investment grade bonds in BofA Merrill Lynch indices ranked by DTY. January 1997 to December 2012. Monthly rebalancing. Value-weighted portfolios. Transaction costs have been included. All maturities, except for GBP bonds where maturity is capped at 15 years. 1 = lowest risk. 5 = highest risk. Δ(1–5) is the difference between statistics for #1 and #5 quintile portfolios.
JFI-CARVALHO.indd 59 3/18/14 8:44:06 AM
LOW-RISK ANOMALIES IN GLOBAL FIXED INCOME: EVIDENCE FROM MAJOR BROAD MARKETS SPRING 2014
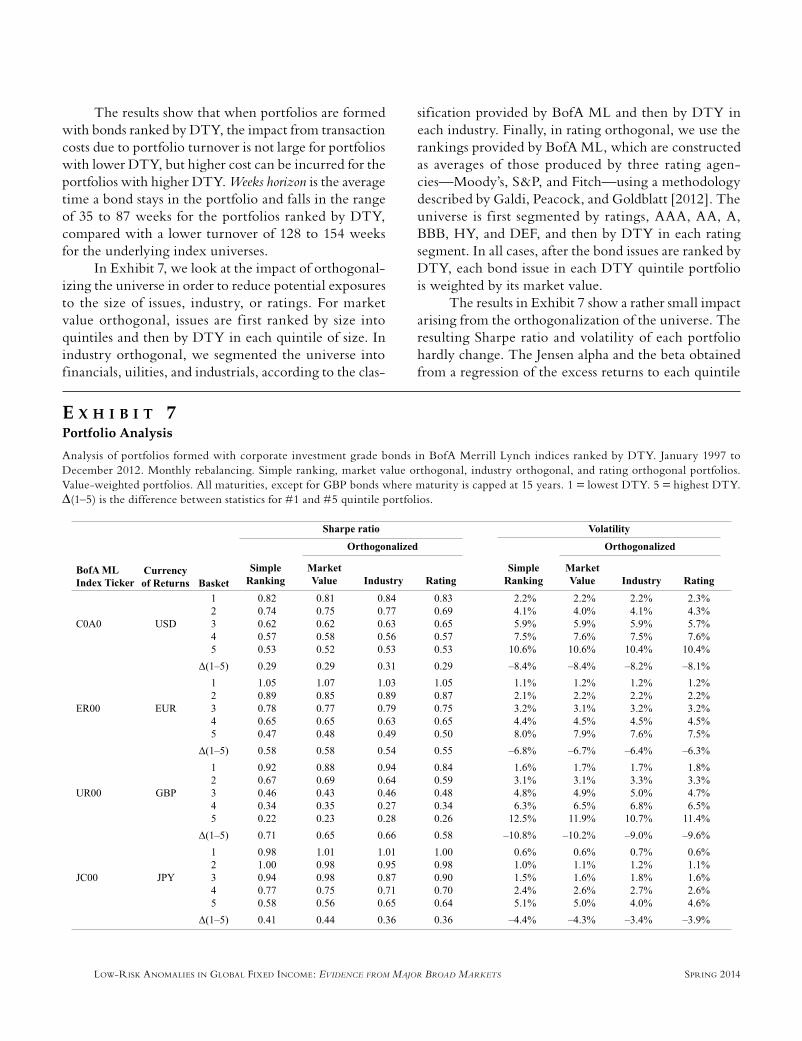
sification provided by BofA ML and then by DTY in each industry. Finally, in rating orthogonal, we use the rankings provided by BofA ML, which are constructed as averages of those produced by three rating agen-cies—Moody’s, S&P, and Fitch—using a methodology described by Galdi, Peacock, and Goldblatt [2012]. The universe is f irst segmented by ratings, AAA, AA, A, BBB, HY, and DEF, and then by DTY in each rating segment. In all cases, after the bond issues are ranked by DTY, each bond issue in each DTY quintile portfolio is weighted by its market value.
The results in Exhibit 7 show a rather small impact arising from the orthogonalization of the universe. The resulting Sharpe ratio and volatility of each portfolio hardly change. The Jensen alpha and the beta obtained from a regression of the excess returns to each quintile
The results show that when portfolios are formed with bonds ranked by DTY, the impact from transaction costs due to portfolio turnover is not large for portfolios with lower DTY, but higher cost can be incurred for the portfolios with higher DTY. Weeks horizon is the average time a bond stays in the portfolio and falls in the range of 35 to 87 weeks for the portfolios ranked by DTY, compared with a lower turnover of 128 to 154 weeks for the underlying index universes.
In Exhibit 7, we look at the impact of orthogonal-izing the universe in order to reduce potential exposures to the size of issues, industry, or ratings. For market value orthogonal, issues are f irst ranked by size into quintiles and then by DTY in each quintile of size. In industry orthogonal, we segmented the universe into financials, uilities, and industrials, according to the clas-
E X H I B I T 7Portfolio Analysis
Analysis of portfolios formed with corporate investment grade bonds in BofA Merrill Lynch indices ranked by DTY. January 1997 to December 2012. Monthly rebalancing. Simple ranking, market value orthogonal, industry orthogonal, and rating orthogonal portfolios. Value-weighted portfolios. All maturities, except for GBP bonds where maturity is capped at 15 years. 1 = lowest DTY. 5 = highest DTY. Δ(1–5) is the difference between statistics for #1 and #5 quintile portfolios.
JFI-CARVALHO.indd 60 3/18/14 8:44:07 AM
THE JOURNAL OF FIXED INCOME SPRING 2014
EX
HI
BI
T 8
Por
tfol
io A
nal
ysis
Ana
lysi
s of p
ortf
olio
s for
med
wit
h co
rpor
ate
inve
stm
ent g
rade
bon
ds in
Bof
A M
erri
ll Ly
nch
indi
ces r
anke
d by
DT
Y. J
anua
ry 1
997
to D
ecem
ber 2
012.
Mon
thly
reba
lanc
ing.
Si
mpl
e ra
nkin
g, m
arke
t va
lue
orth
ogon
al, i
ndus
try
orth
ogon
al a
nd r
atin
g or
thog
onal
por
tfol
ios.
Val
ue-w
eigh
ted
port
folio
s. A
ll m
atur
itie
s, e
xcep
t fo
r G
BP
bond
s w
here
m
atur
ity
is c
appe
d at
15
year
s. 1
= lo
wes
t D
TY
. 5 =
hig
hest
DT
Y. Δ
(1–5
) is
the
dif
fere
nce
betw
een
stat
isti
cs fo
r #
1 an
d #
5 qu
inti
le p
ortf
olio
s.
JFI-CARVALHO.indd 61 3/18/14 8:44:07 AM
LOW-RISK ANOMALIES IN GLOBAL FIXED INCOME: EVIDENCE FROM MAJOR BROAD MARKETS SPRING 2014
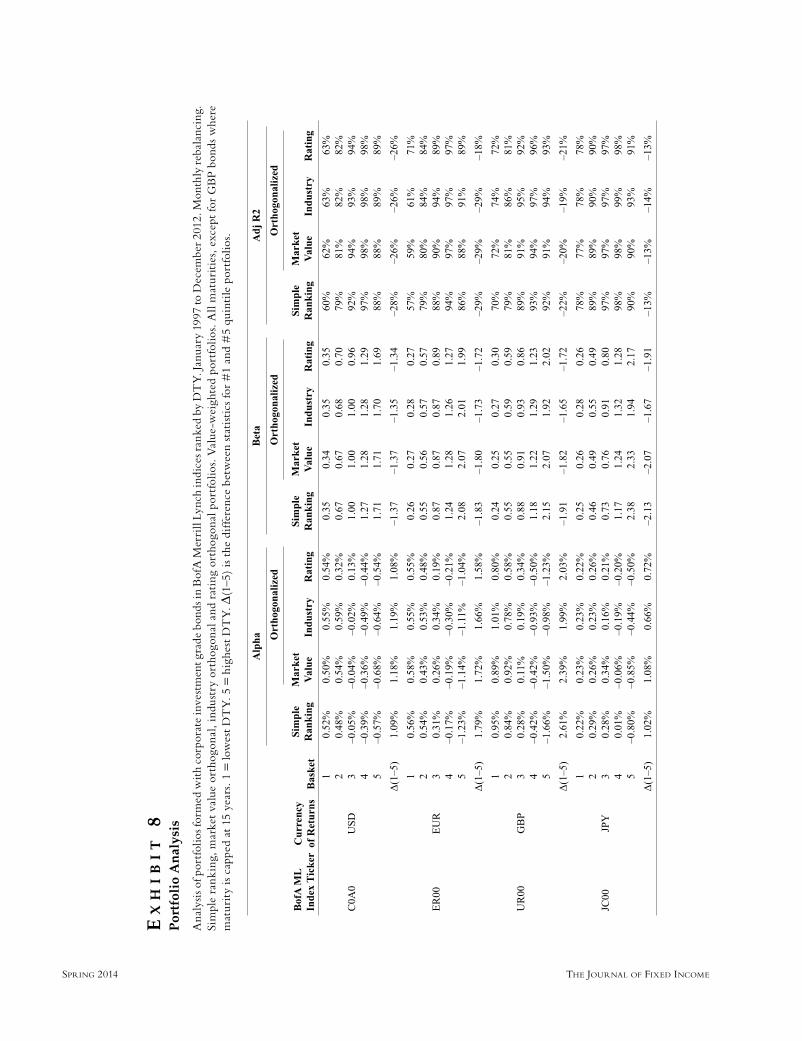
orthogonalized portfolio over cash rates against under-lying corporate investment grade bond index excess returns over cash rates can be found in Exhibit 8. The adjusted r-square of the regression is also included. There are no significant differences in results. The only noticeable difference is perhaps a slightly smaller alpha dispersion in the case of rating and industry orthogo-nalization. This shows that any potential biases created toward industries, ratings, or market capitalization with our simple methodology behind the construction of quintile portfolios cannot explain the positive alpha of the lowest-risk quintile portfolios and negative alpha in the riskier quintile porfolios. Thus, for the sake of sim-plicity, we opted for not using any orthogonalization in the remainder of this article.
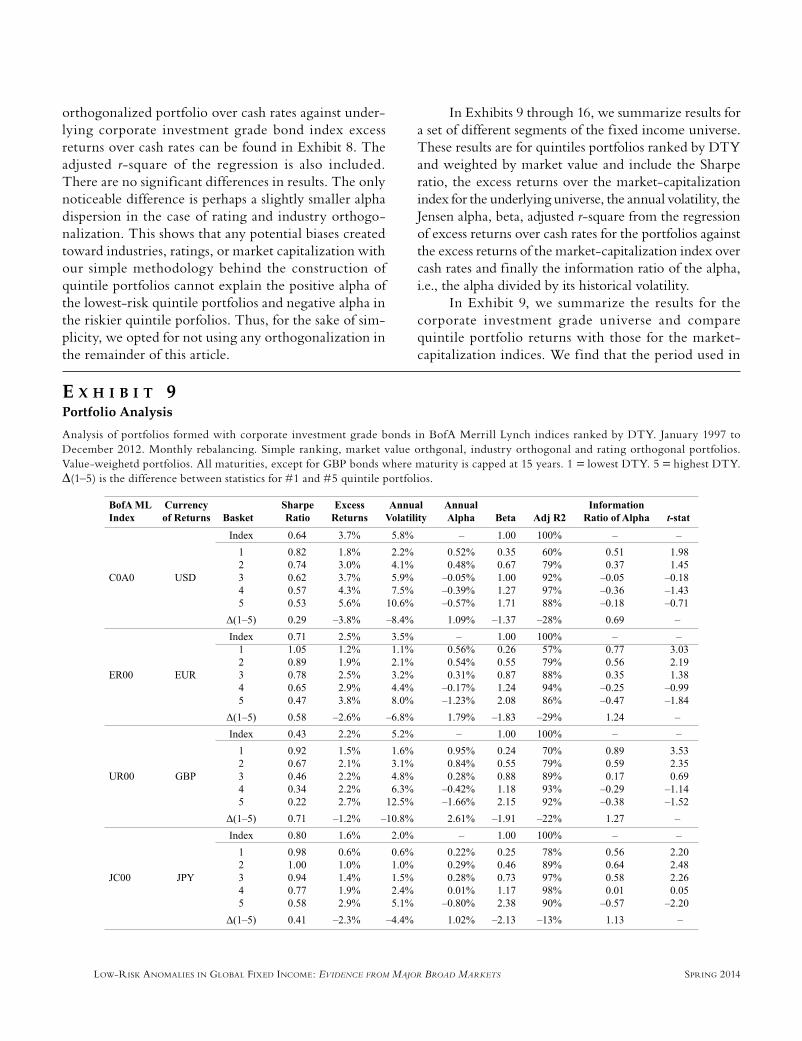
In Exhibits 9 through 16, we summarize results for a set of different segments of the fixed income universe. These results are for quintiles portfolios ranked by DTY and weighted by market value and include the Sharpe ratio, the excess returns over the market-capitalization index for the underlying universe, the annual volatility, the Jensen alpha, beta, adjusted r-square from the regression of excess returns over cash rates for the portfolios against the excess returns of the market-capitalization index over cash rates and finally the information ratio of the alpha, i.e., the alpha divided by its historical volatility.
In Exhibit 9, we summarize the results for the corporate investment grade universe and compare quintile portfolio returns with those for the market-capitalization indices. We find that the period used in
E X H I B I T 9Portfolio Analysis
Analysis of portfolios formed with corporate investment grade bonds in BofA Merrill Lynch indices ranked by DTY. January 1997 to December 2012. Monthly rebalancing. Simple ranking, market value orthgonal, industry orthogonal and rating orthogonal portfolios. Value-weighetd portfolios. All maturities, except for GBP bonds where maturity is capped at 15 years. 1 = lowest DTY. 5 = highest DTY. Δ(1–5) is the difference between statistics for #1 and #5 quintile portfolios.
JFI-CARVALHO.indd 62 3/18/14 8:44:08 AM
THE JOURNAL OF FIXED INCOME SPRING 2014
the back test has been particularly favorable for cor-porate investment grade bonds and the Sharpe ratios are large, reaching +0.80 for Japanese bonds. In such a favorable period, it is clear that reducing the expo-sure of the portfolio to the asset class risk premium by reducing beta will have a negative impact on returns. Despite the positive alpha in low-risk portfolios, this alpha has not been sufficiently large to make investing in low-risk, investment grade portfolios competitive and compensate for the performance drag from low beta, even if Sharpe ratios are higher for low-risk portfo-lios. However, assuming that Sharpe ratios will fall to around +0.3 (this being the expected long-term Sharpe ratio suggested by Dalio [2005]), investing in a low-risk corporate investment grade portfolio should be more appealing in the future as an alternative to the market-capitalization portfolio.
In Exhibit 9, we also see that the information ratio of the alpha, i.e., the alpha divided by its historical vola-tility, is particularly strong for the lower-risk quintile
portfolios. This constitutes evidence that the alpha is indeed significant.
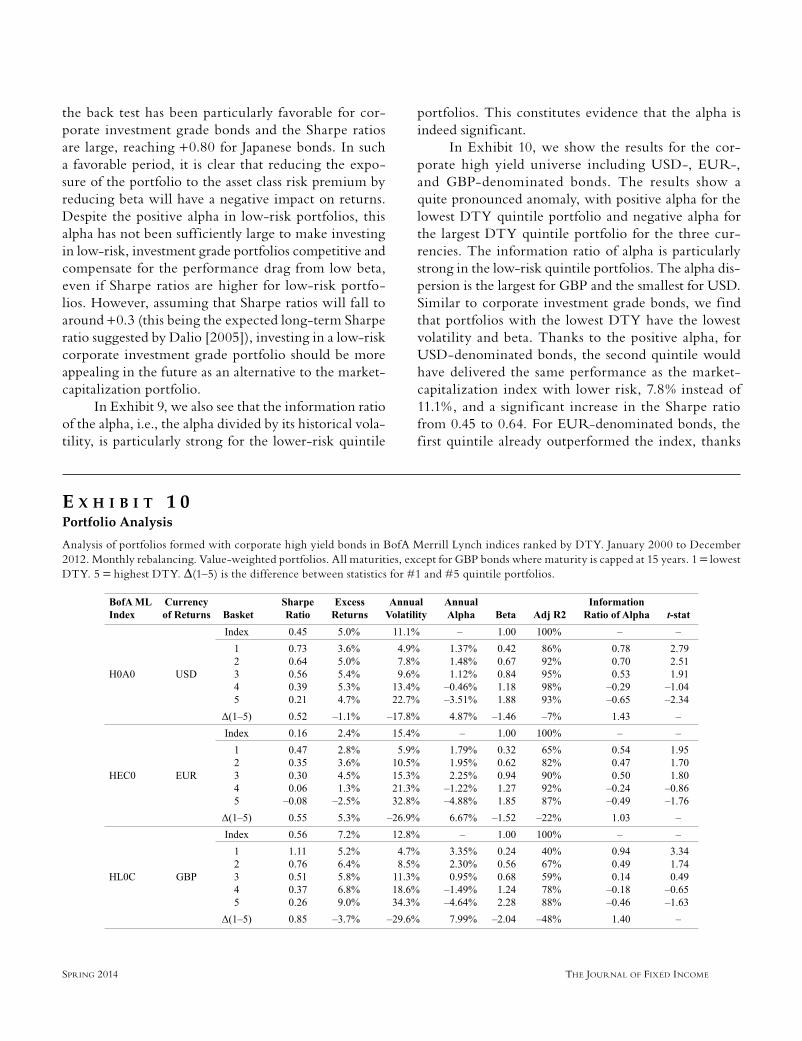
In Exhibit 10, we show the results for the cor-porate high yield universe including USD-, EUR-, and GBP-denominated bonds. The results show a quite pronounced anomaly, with positive alpha for the lowest DTY quintile portfolio and negative alpha for the largest DTY quintile portfolio for the three cur-rencies. The information ratio of alpha is particularly strong in the low-risk quintile portfolios. The alpha dis-persion is the largest for GBP and the smallest for USD. Similar to corporate investment grade bonds, we find that portfolios with the lowest DTY have the lowest volatility and beta. Thanks to the positive alpha, for USD-denominated bonds, the second quintile would have delivered the same performance as the market-capitalization index with lower risk, 7.8% instead of 11.1%, and a signif icant increase in the Sharpe ratio from 0.45 to 0.64. For EUR-denominated bonds, the first quintile already outperformed the index, thanks
E X H I B I T 1 0Portfolio Analysis
Analysis of portfolios formed with corporate high yield bonds in BofA Merrill Lynch indices ranked by DTY. January 2000 to December 2012. Monthly rebalancing. Value-weighted portfolios. All maturities, except for GBP bonds where maturity is capped at 15 years. 1 = lowest DTY. 5 = highest DTY. Δ(1–5) is the difference between statistics for #1 and #5 quintile portfolios.
JFI-CARVALHO.indd 63 3/18/14 8:44:09 AM
LOW-RISK ANOMALIES IN GLOBAL FIXED INCOME: EVIDENCE FROM MAJOR BROAD MARKETS SPRING 2014
to the large alpha and despite a very defensive beta of just 0.32. This is because the Sharpe ratio of EUR-denominated high yield bonds in the period was low at only 0.16, i.e., not much of a risk premium. For GBP-denominated bonds with the largest Sharpe ratio for the underlying market-capitalization index, the positive alpha from low DTY bonds is not sufficiently large to generate outperformance over the index because of the low beta. Only quintile 5 would manage to outperform the index, essentially by increasing market exposure, but with negative alpha, more risk, and a significantly lower Sharpe ratio.
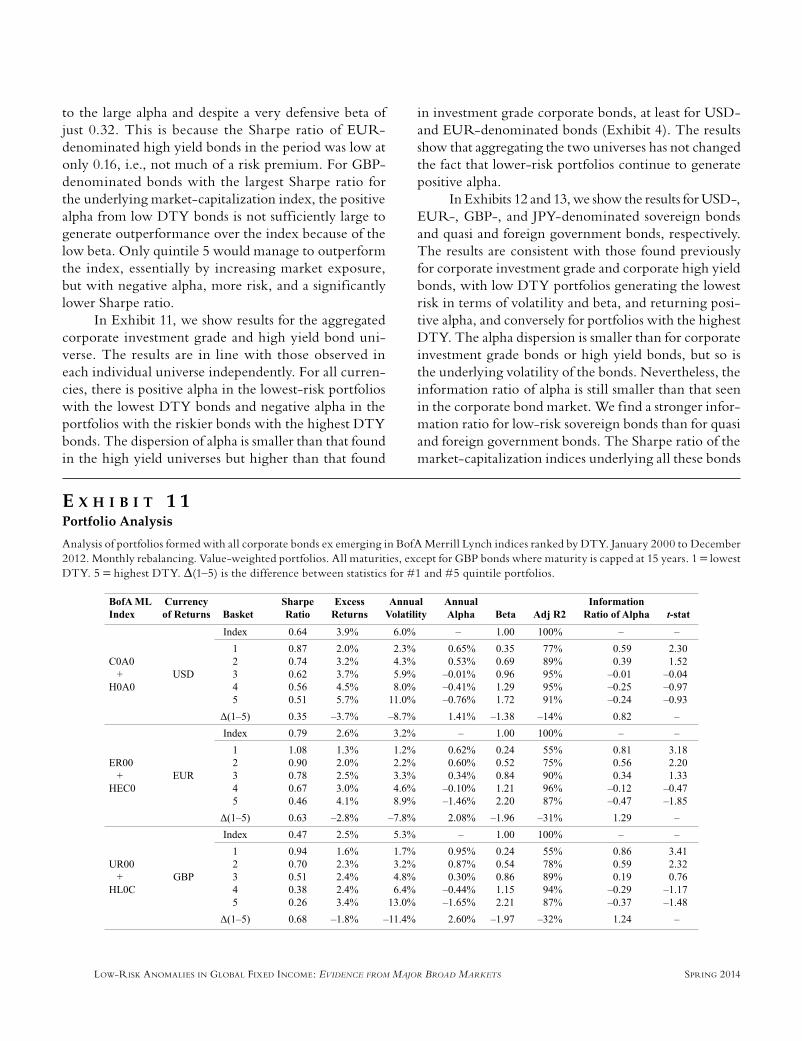
In Exhibit 11, we show results for the aggregated corporate investment grade and high yield bond uni-verse. The results are in line with those observed in each individual universe independently. For all curren-cies, there is positive alpha in the lowest-risk portfolios with the lowest DTY bonds and negative alpha in the portfolios with the riskier bonds with the highest DTY bonds. The dispersion of alpha is smaller than that found in the high yield universes but higher than that found
in investment grade corporate bonds, at least for USD- and EUR-denominated bonds (Exhibit 4). The results show that aggregating the two universes has not changed the fact that lower-risk portfolios continue to generate positive alpha.
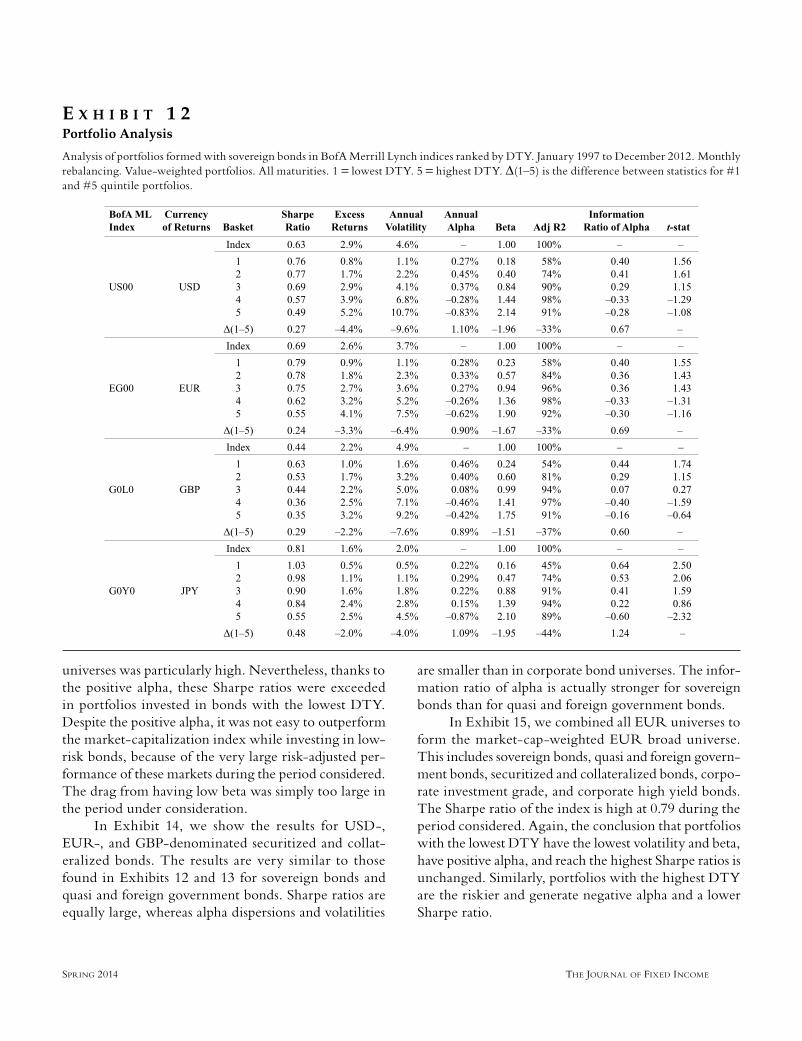
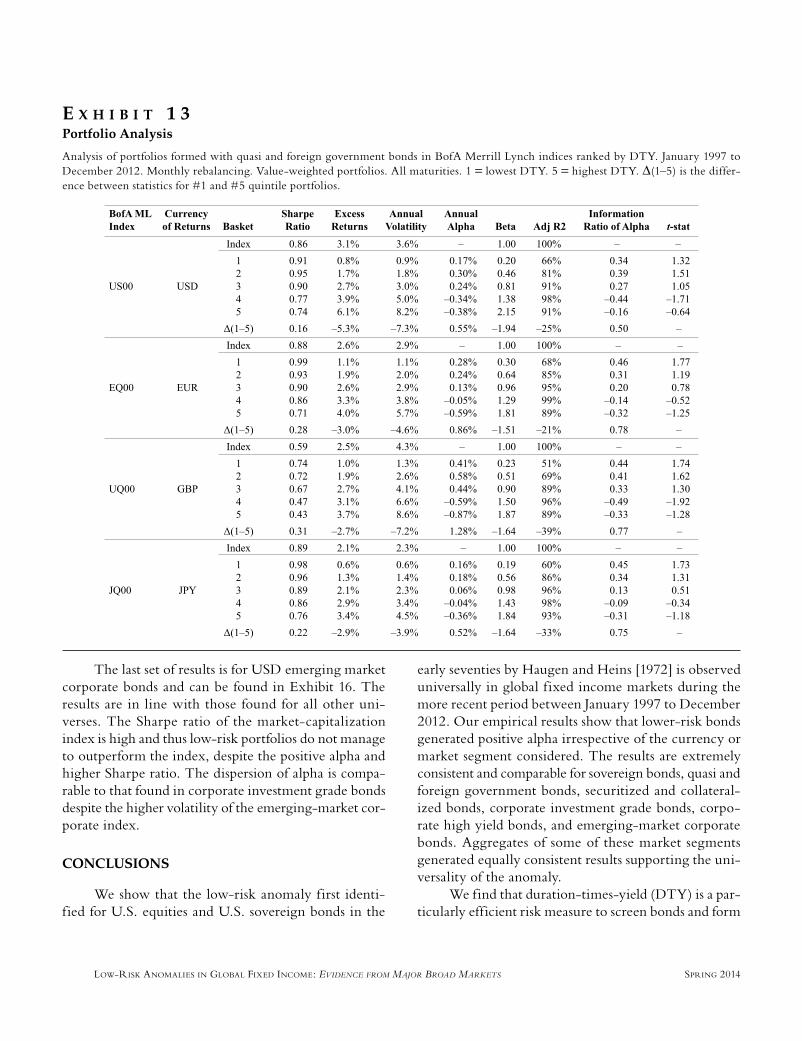
In Exhibits 12 and 13, we show the results for USD-, EUR-, GBP-, and JPY-denominated sovereign bonds and quasi and foreign government bonds, respectively. The results are consistent with those found previously for corporate investment grade and corporate high yield bonds, with low DTY portfolios generating the lowest risk in terms of volatility and beta, and returning posi-tive alpha, and conversely for portfolios with the highest DTY. The alpha dispersion is smaller than for corporate investment grade bonds or high yield bonds, but so is the underlying volatility of the bonds. Nevertheless, the information ratio of alpha is still smaller than that seen in the corporate bond market. We find a stronger infor-mation ratio for low-risk sovereign bonds than for quasi and foreign government bonds. The Sharpe ratio of the market-capitalization indices underlying all these bonds
E X H I B I T 1 1Portfolio Analysis
Analysis of portfolios formed with all corporate bonds ex emerging in BofA Merrill Lynch indices ranked by DTY. January 2000 to December 2012. Monthly rebalancing. Value-weighted portfolios. All maturities, except for GBP bonds where maturity is capped at 15 years. 1 = lowest DTY. 5 = highest DTY. Δ(1–5) is the difference between statistics for #1 and #5 quintile portfolios.
JFI-CARVALHO.indd 64 3/18/14 8:44:09 AM
THE JOURNAL OF FIXED INCOME SPRING 2014
universes was particularly high. Nevertheless, thanks to the positive alpha, these Sharpe ratios were exceeded in portfolios invested in bonds with the lowest DTY. Despite the positive alpha, it was not easy to outperform the market-capitalization index while investing in low-risk bonds, because of the very large risk-adjusted per-formance of these markets during the period considered. The drag from having low beta was simply too large in the period under consideration.
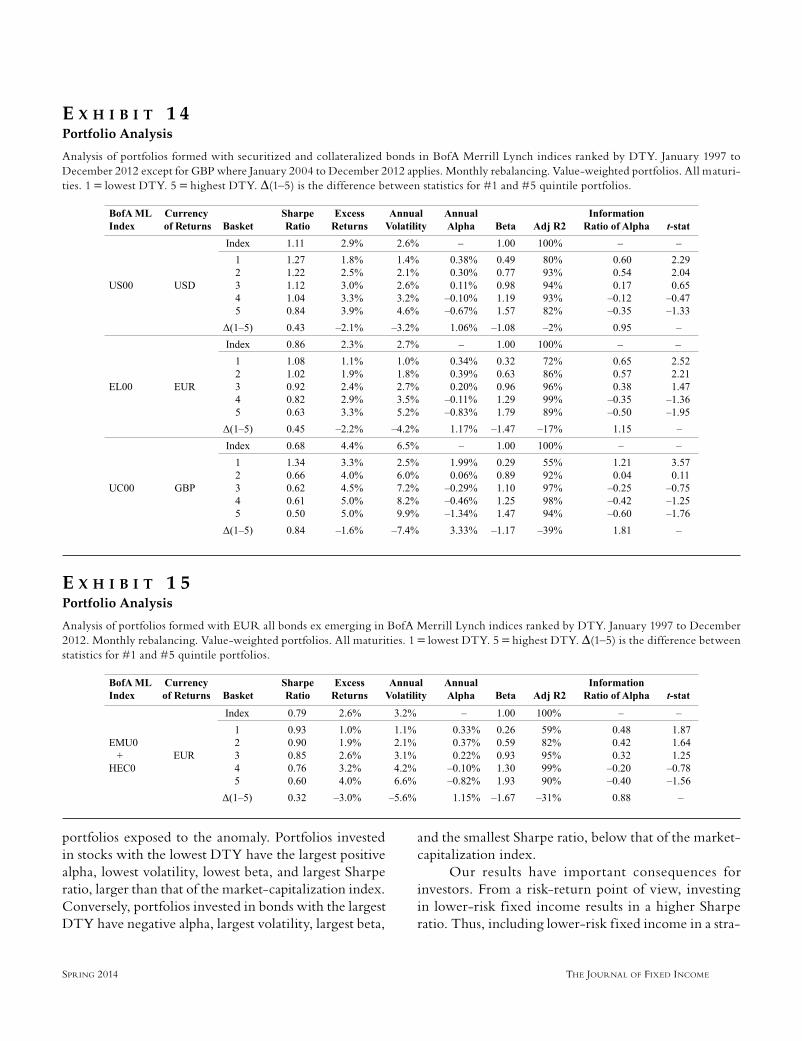
In Exhibit 14, we show the results for USD-, EUR-, and GBP-denominated securitized and collat-eralized bonds. The results are very similar to those found in Exhibits 12 and 13 for sovereign bonds and quasi and foreign government bonds. Sharpe ratios are equally large, whereas alpha dispersions and volatilities
are smaller than in corporate bond universes. The infor-mation ratio of alpha is actually stronger for sovereign bonds than for quasi and foreign government bonds.
In Exhibit 15, we combined all EUR universes to form the market-cap-weighted EUR broad universe. This includes sovereign bonds, quasi and foreign govern-ment bonds, securitized and collateralized bonds, corpo-rate investment grade, and corporate high yield bonds. The Sharpe ratio of the index is high at 0.79 during the period considered. Again, the conclusion that portfolios with the lowest DTY have the lowest volatility and beta, have positive alpha, and reach the highest Sharpe ratios is unchanged. Similarly, portfolios with the highest DTY are the riskier and generate negative alpha and a lower Sharpe ratio.
E X H I B I T 1 2Portfolio Analysis
Analysis of portfolios formed with sovereign bonds in BofA Merrill Lynch indices ranked by DTY. January 1997 to December 2012. Monthly rebalancing. Value-weighted portfolios. All maturities. 1 = lowest DTY. 5 = highest DTY. Δ(1–5) is the difference between statistics for #1 and #5 quintile portfolios.
JFI-CARVALHO.indd 65 3/18/14 8:44:10 AM
LOW-RISK ANOMALIES IN GLOBAL FIXED INCOME: EVIDENCE FROM MAJOR BROAD MARKETS SPRING 2014
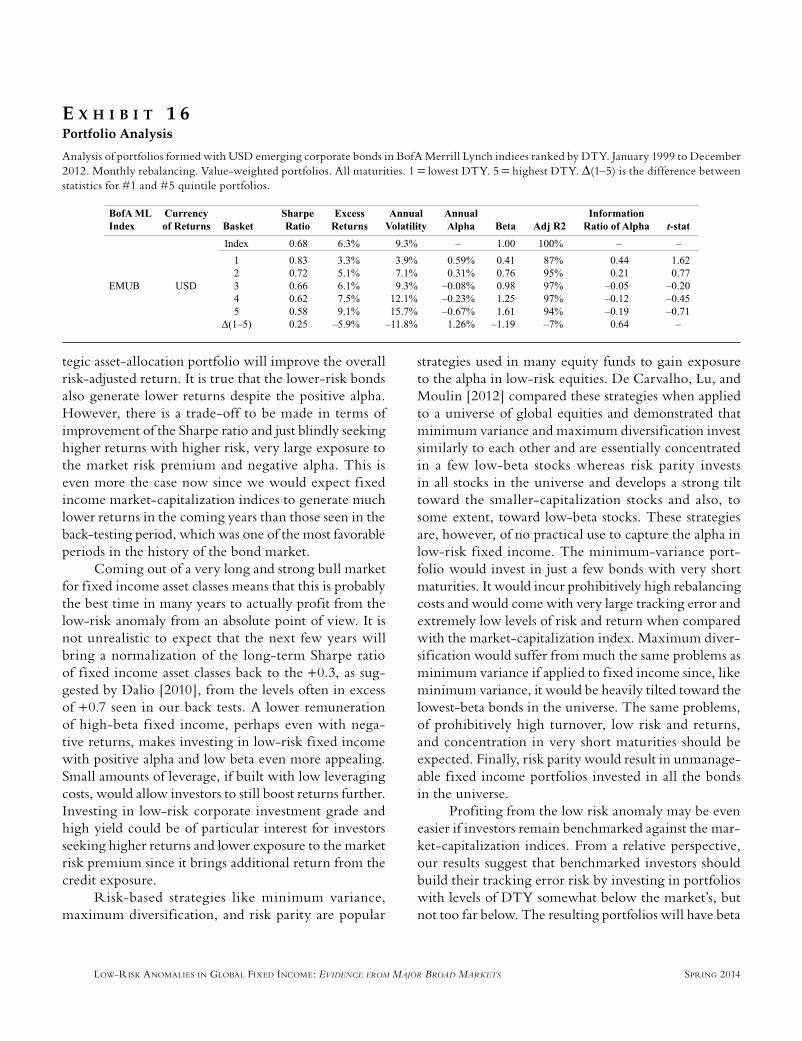
The last set of results is for USD emerging market corporate bonds and can be found in Exhibit 16. The results are in line with those found for all other uni-verses. The Sharpe ratio of the market-capitalization index is high and thus low-risk portfolios do not manage to outperform the index, despite the positive alpha and higher Sharpe ratio. The dispersion of alpha is compa-rable to that found in corporate investment grade bonds despite the higher volatility of the emerging-market cor-porate index.
CONCLUSIONS
We show that the low-risk anomaly first identi-fied for U.S. equities and U.S. sovereign bonds in the
E X H I B I T 1 3Portfolio Analysis
Analysis of portfolios formed with quasi and foreign government bonds in BofA Merrill Lynch indices ranked by DTY. January 1997 to December 2012. Monthly rebalancing. Value-weighted portfolios. All maturities. 1 = lowest DTY. 5 = highest DTY. Δ(1–5) is the differ-ence between statistics for #1 and #5 quintile portfolios.
early seventies by Haugen and Heins [1972] is observed universally in global fixed income markets during the more recent period between January 1997 to December 2012. Our empirical results show that lower-risk bonds generated positive alpha irrespective of the currency or market segment considered. The results are extremely consistent and comparable for sovereign bonds, quasi and foreign government bonds, securitized and collateral-ized bonds, corporate investment grade bonds, corpo-rate high yield bonds, and emerging-market corporate bonds. Aggregates of some of these market segments generated equally consistent results supporting the uni-versality of the anomaly.
We find that duration-times-yield (DTY) is a par-ticularly efficient risk measure to screen bonds and form
JFI-CARVALHO.indd 66 3/18/14 8:44:11 AM
THE JOURNAL OF FIXED INCOME SPRING 2014
portfolios exposed to the anomaly. Portfolios invested in stocks with the lowest DTY have the largest positive alpha, lowest volatility, lowest beta, and largest Sharpe ratio, larger than that of the market-capitalization index. Conversely, portfolios invested in bonds with the largest DTY have negative alpha, largest volatility, largest beta,
and the smallest Sharpe ratio, below that of the market-capitalization index.
Our results have important consequences for investors. From a risk-return point of view, investing in lower-risk fixed income results in a higher Sharpe ratio. Thus, including lower-risk fixed income in a stra-
E X H I B I T 1 4Portfolio Analysis
Analysis of portfolios formed with securitized and collateralized bonds in BofA Merrill Lynch indices ranked by DTY. January 1997 to December 2012 except for GBP where January 2004 to December 2012 applies. Monthly rebalancing. Value-weighted portfolios. All maturi-ties. 1 = lowest DTY. 5 = highest DTY. Δ(1–5) is the difference between statistics for #1 and #5 quintile portfolios.
E X H I B I T 1 5Portfolio Analysis
Analysis of portfolios formed with EUR all bonds ex emerging in BofA Merrill Lynch indices ranked by DTY. January 1997 to December 2012. Monthly rebalancing. Value-weighted portfolios. All maturities. 1 = lowest DTY. 5 = highest DTY. Δ(1–5) is the difference between statistics for #1 and #5 quintile portfolios.
JFI-CARVALHO.indd 67 3/18/14 8:44:11 AM
LOW-RISK ANOMALIES IN GLOBAL FIXED INCOME: EVIDENCE FROM MAJOR BROAD MARKETS SPRING 2014
tegic asset-allocation portfolio will improve the overall risk-adjusted return. It is true that the lower-risk bonds also generate lower returns despite the positive alpha. However, there is a trade-off to be made in terms of improvement of the Sharpe ratio and just blindly seeking higher returns with higher risk, very large exposure to the market risk premium and negative alpha. This is even more the case now since we would expect fixed income market-capitalization indices to generate much lower returns in the coming years than those seen in the back-testing period, which was one of the most favorable periods in the history of the bond market.
Coming out of a very long and strong bull market for fixed income asset classes means that this is probably the best time in many years to actually profit from the low-risk anomaly from an absolute point of view. It is not unrealistic to expect that the next few years will bring a normalization of the long-term Sharpe ratio of fixed income asset classes back to the +0.3, as sug-gested by Dalio [2010], from the levels often in excess of +0.7 seen in our back tests. A lower remuneration of high-beta f ixed income, perhaps even with nega-tive returns, makes investing in low-risk fixed income with positive alpha and low beta even more appealing. Small amounts of leverage, if built with low leveraging costs, would allow investors to still boost returns further. Investing in low-risk corporate investment grade and high yield could be of particular interest for investors seeking higher returns and lower exposure to the market risk premium since it brings additional return from the credit exposure.
Risk-based strategies like minimum variance, maximum diversification, and risk parity are popular
strategies used in many equity funds to gain exposure to the alpha in low-risk equities. De Carvalho, Lu, and Moulin [2012] compared these strategies when applied to a universe of global equities and demonstrated that minimum variance and maximum diversification invest similarly to each other and are essentially concentrated in a few low-beta stocks whereas risk parity invests in all stocks in the universe and develops a strong tilt toward the smaller-capitalization stocks and also, to some extent, toward low-beta stocks. These strategies are, however, of no practical use to capture the alpha in low-risk fixed income. The minimum-variance port-folio would invest in just a few bonds with very short maturities. It would incur prohibitively high rebalancing costs and would come with very large tracking error and extremely low levels of risk and return when compared with the market-capitalization index. Maximum diver-sification would suffer from much the same problems as minimum variance if applied to fixed income since, like minimum variance, it would be heavily tilted toward the lowest-beta bonds in the universe. The same problems, of prohibitively high turnover, low risk and returns, and concentration in very short maturities should be expected. Finally, risk parity would result in unmanage-able fixed income portfolios invested in all the bonds in the universe.
Profiting from the low risk anomaly may be even easier if investors remain benchmarked against the mar-ket-capitalization indices. From a relative perspective, our results suggest that benchmarked investors should build their tracking error risk by investing in portfolios with levels of DTY somewhat below the market’s, but not too far below. The resulting portfolios will have beta
E X H I B I T 1 6Portfolio Analysis
Analysis of portfolios formed with USD emerging corporate bonds in BofA Merrill Lynch indices ranked by DTY. January 1999 to December 2012. Monthly rebalancing. Value-weighted portfolios. All maturities. 1 = lowest DTY. 5 = highest DTY. Δ(1–5) is the difference between statistics for #1 and #5 quintile portfolios.
JFI-CARVALHO.indd 68 3/18/14 8:44:12 AM
THE JOURNAL OF FIXED INCOME SPRING 2014
just somewhat below 1 but not too low, and will have lower volatility than the market-capitalization index. Due to the combination of beta below 1 and the positive alpha from investing in lower DTY bonds, the resulting defensive portfolios should outperform the market-cap-italization index substantially when the market index performs poorly, and when the market performs well, generate similar levels of return to the market since the alpha from the lower DTY bonds should compensate for the drag created from a beta below 1. The resulting portfolios should have a higher Sharpe ratio than the market-capitalization index, a positive information ratio over the medium to long-term, and an asymmetric pro-file of average excess returns, large and positive when the index returns are negative and close to zero when the index returns are positive.
REFERENCES
Aussenegg, W., L. Götz, and R. Jelic. “Common Factors in the Performance of European Corporate Bonds—Evidence Before and After Financial Crisis.” Working paper, http://ssrn.com/abstract=2012688, 2012.
Baker, N.L., and R.A. Haugen. “Low Risk Stocks Outper-form within All Observable Markets of the World.” Working paper, http://ssrn.com/abstract=2055431, 2012.
Ben Dor, A., L. Dynkin, J. Hyman, P. Houweling, E. van Leeuwen, and O. Penninga. “DTSSM (Duration Times Spread).” The Journal of Portfolio Management, 33 (2007), pp. 77-100.
Black, F., M.C. Jensen, and M. Scholes. The Capital Asset Pricing Model: Some Empirical Tests, Studies in the Theory of Capital Markets. Santa Barbara, CA: Praeger Publishers Inc., 1972.
Blitz, D. “Agency-Based Asset Pricing and the Beta Anomaly.” Working paper, http://ssrn.com/abstract=2068535, 2012.
Blitz, D., E.G. Falkenstein, and P. van Vilet. “Explana-tions for the Volatility Effect: An Overview Based on the CAPM Assumptions.” Working paper, http://ssrn.com/abstract=2270973, 2013.
Carhart, M.M. “On Peristence in Mutual Fund Perfor-mance.” Journal of Finance, 52 (1997), pp. 57-82.
Dalio, R. “Engineering Targeted Returns and Risk.” Working paper, 2005, http://www.integrativecapital.com/files/files/Bridgewater.pdf.
De Carvalho, R.L., X. Lu, and P. Moulin, “Demystifying Equity Risk-Based Strategies: A Simple Alpha plus Beta Description.” The Journal of Portfolio Management, 38 (2012), pp. 56-70.
Derwall, J., J. Huij, and G. de Zwart. “The Short-Term Corporate Bond Anomaly.” Working paper, http://ssrn.com/abstract=1101070, 2009.
Duffee, G.R. “Term Premia and Interest Rate Forecasts in Affine Models.” Journal of Finance, 57 (2002), pp. 405-443.
Elton, E.J., M.J. Gruber, and C.R. Blake. “Fundamental Eco-nomic Variables, Expected Returns, and Bond Fund Perfor-mance.” Journal of Finance, 50 (1995), pp. 1229-1256.
Fama, E., and K. French. “The Cross-Section of Expected Stock Returns.” Journal of Finance, 47 (1992), pp. 427-465.
Fisher, L. “Yield Elasticity: A New, Objective Measure of Interest-Rate Risk.” Journal of Applied Finance, 16 (2006), pp. 161-173.
Frazzini, A., and L.H. Perdersen. “Betting Against Beta.” Working paper, 2011, http://ssrn.com/abstract=2049939
Galdi, Ph., P. Peacock, and M. Goldblatt. “Bond Index Almanac: Calculation Methodologies.” Working paper, Bank of America Merrill Lynch, 2012, http://www.mlindex.ml.com/gispublic/bin/getDoc.asp?source=generalmethodology&fn=Sector%20Schema.pdf
Gebhardt, W.R., S. Hvidkjaer, and B. Swaminathan. “The Cross-Section of Expected Corporate Bond Returns: Betas and Characteristics.” Journal of Financial Economics, 75 (2005), pp. 85-114.
Haugen, R.A., and A.J. Heins. “On the Evidence Supporting the Existence of Risk Premiums in the Capital Markets.” Working paper, 1972, http://ssrn.com/abstract=1783797
Huij, J., and J. Derwall. “Hot Hands in Bond Funds.” Journal of Banking and Finance, 32 (2008), pp. 559-572.
Jensen, M.C. “The performance of mutual funds in the period 1945-1964.” Journal of Finance, 23 (1968), pp. 389-416.
JFI-CARVALHO.indd 69 3/18/14 8:44:12 AM
LOW-RISK ANOMALIES IN GLOBAL FIXED INCOME: EVIDENCE FROM MAJOR BROAD MARKETS SPRING 2014
Litterman, R., and J. Scheinkman. “Common Factors Affecting Bond Returns.” The Journal of Fixed Income, 1 (1991), pp. 54-61.
Pilotte, E.A., and F.P. Sterbenz. “Sharpe and Treynor Ratios on Treasury Bonds.” Journal of Business, 79 (2006), pp. 149-180.
Treynor, J.L., and K. Mazuy. “Can Mutual Funds Out-guess the Market?” Harvard Business Review, 44 (1966), pp. 131-136.
To order reprints of this article, please contact Dewey Palmieri at [email protected] or 212-224-3675.
JFI-CARVALHO.indd 70 3/18/14 8:44:12 AM