the journal of rheumatology volume 41, no. 11 …no information was known for a particular gene, we...
TRANSCRIPT

The Journal of Rheumatology Volume 41, no. 11
Rheumatoid ArthritisDeterminants of Erythrocyte Methotrexate Polyglutamate Levels in
Hazes and Robert de JongeEthan den Boer, Maurits C.J.F. de Rotte, Saskia M.F. Pluijm, Sandra G. Heil, Johanna M.
http://www.jrheum.org/content/41/11/2167J Rheumatol 2014;41;2167-2178
http://www.jrheum.org/alerts 1. Sign up for TOCs and other alerts
http://jrheum.com/faq 2. Information on Subscriptions
http://jrheum.com/reprints_permissions 3. Information on permissions/orders of reprints
in rheumatology and related fields. Silverman featuring research articles on clinical subjects from scientists working
is a monthly international serial edited by Earl D.The Journal of Rheumatology
RheumatologyThe Journal of on June 14, 2020 - Published by www.jrheum.orgDownloaded from
RheumatologyThe Journal of on June 14, 2020 - Published by www.jrheum.orgDownloaded from

2167den Boer, et al: Determinants of MTX polyglutamates
Personal non-commercial use only. The Journal of Rheumatology Copyright © 2014. All rights reserved.
Determinants of Erythrocyte MethotrexatePolyglutamate Levels in Rheumatoid ArthritisEthan den Boer, Maurits C.J.F. de Rotte, Saskia M.F. Pluijm, Sandra G. Heil, Johanna M. Hazes, and Robert de Jonge
ABSTRACT. Objective. Low-dose methotrexate (MTX) is the anchor drug in the treatment for rheumatoidarthritis (RA). Response to MTX is related to the intracellular MTX-polyglutamate (MTX-PG)levels and little is known about its determinants. We aimed to define the determinants of erythrocyteMTX-PG concentrations in 2 prospective cohorts of patients with RA.Methods. Patients with RA treated with MTX from 2 longitudinal cohorts were included: 93 fromthe MTX-R study (Rotterdam, the Netherlands derivation cohort), and 247 from the treatment inRotterdam Early Arthritis Cohort study (validation cohort). MTX-PG concentrations were measuredat 3 months of treatment using liquid chromatography/mass spectrometry. The MTX-PG were usedas outcome measure. Various sociodemographic, clinical, biochemical, and genetic factors wereassessed at baseline. Associations with MTX-PG levels were analyzed using multivariate regressionanalysis.Results. Age was positively associated with MTX-PG1 (stβ 0.23, p = 0.033) and total MTX-PG (stβ0.23, p = 0.018) in the derivation cohort, and with all MTX-PG in the validation cohort (MTX-PG1:stβ 0.13, p = 0.04; MTX-PG2: stβ 0.21, p = 0.001; MTX-PG3: stβ 0.22, p < 0.001; MTX-PG4+5:stβ 0.25, p < 0.001; and total MTX-PG: stβ 0.32, p < 0.001). Erythrocyte folate levels werepositively associated with MTX-PG3 (stβ 0.3, p = 0.021) and total MTX-PG levels (stβ 0.32, p =0.022) in the derivation cohort, which was replicated for MTX-PG3 (stβ 0.15, p = 0.04) in thevalidation cohort. Patients with the folylpolyglutamate synthase (FPGS) rs4451422 wild-typegenotype had higher concentrations of MTX-PG3 (p < 0.05), MTX-PG4+5 (p < 0.05), and totalMTX-PG (p < 0.05) in both cohorts. In the combined cohort, MTX dose was positively associatedwith levels of MTX-PG3 (stβ 0.23, p < 0.001), MTX-PG4+5 (stβ 0.30, p < 0.001), and total MTX-PG(stβ 0.20, p = 0.002), but negatively associated with MTX-PG2 levels (stβ –0.22, p < 0.001).Conclusion. Our prospective study shows that higher age, higher MTX dose, higher erythrocytefolate status, and the FPGS rs4451422 wild-type genotype are associated with higher MTX-PGconcentrations. While only up to 21% of interpatient variability can be explained by these determi-nants, this knowledge may aid in the development of personalized treatment in RA. (First ReleaseSept 15 2014; J Rheumatol 2014;41:2167–78; doi:10.3899/jrheum.131290)
Key Indexing Terms:METHOTREXATE ERYTHROCYTES RHEUMATOID ARTHRITISPROSPECTIVE STUDIES SINGLE-NUCLEOTIDE POLYMORPHISM
From the Department of Clinical Chemistry; Department ofRheumatology; Department of Pediatric Hemato-Oncology; ErasmusUniversity Medical Center, Rotterdam, the Netherlands.Supported by treatment in Rotterdam Early Arthritis Cohort (tREACH):Unrestricted grant from Pfizer bv. (0881-102217). RDJ: Dutch ArthritisAssociation (06-02-402 and 09-1-402).E. den Boer, MSc; M.C.J.F. de Rotte, PharmD; S.G. Heil, PhD; R. deJonge, PhD, Department of Clinical Chemistry; J.M. Hazes, MD, PhD,Department of Rheumatology; S.M.F. Pluijm, PhD, Department ofPediatric Hemato-Oncology, Erasmus University Medical Center.Address correspondence to Dr. R. de Jonge, Erasmus University MedicalCenter, Department of Clinical Chemistry, ‘s-Gravendijkwal 230, 3015CE, Rotterdam, the Netherlands. E-mail: [email protected] for publication July 8, 2014.
Low-dose methotrexate (MTX) is the most widely usedtreatment for rheumatoid arthritis (RA) and other arthriticdiseases. Although MTX is effective and safe, about 30% ofpatients with RA encounter adverse events or do not reach
sufficient response1. A pharmacogenetic model for theprediction of MTX efficacy has been proposed previously2.However, at the moment there is no therapeutic drugmonitoring (TDM)-based model for predicting compliance,response, or adverse events during low-dose MTX treatment.
While MTX plasma levels can be measured easily,low-dose MTX is rapidly cleared from plasma and is notroutinely measured. Hence, plasma MTX levels do notcorrelate with response in patients with RA3. The therapeuticeffects of MTX are thought to be mediated by its intracellularlevels4, which are difficult to measure. Intracellular levels ofMTX can predict treatment response, making intracellularMTX an interesting target for TDM5,6,7,8,9,10,11,12,13. We developed a stable isotope dilution liquid chromato-graphy/mass spectrometry (LC-MS/MS) assay to measureerythrocyte MTX polyglutamates (MTX-PG)14.
RheumatologyThe Journal of on June 14, 2020 - Published by www.jrheum.orgDownloaded from

MTX is transported into the cell primarily by the reducedfolate carrier. Once in the cell, MTX is converted byfolylpolyglutamate synthase (FPGS) to MTX-PG byγ-linked sequential addition of glutamic acid residues. In acompeting reaction, the MTX-PG are deconjugated byγ-glutamyl hydrolase (GGH), leading to a variety of chainlengths (MTX-PG2–7). In low-dose MTX treatment, thepentaglutamate (MTX-PG5) is the highest order of glutamy-lation detected, while the triglutamate form (MTX-PG3) ofMTX predominates15,16. Polyglutamylation retains MTX inthe cell because the MTX-PG are a poor substrate for theMTX efflux proteins.
In low-dose MTX, the median time to reach steady-stateMTX-red blood cell (RBC) levels is highly variablebetween patients and increases with the number of PGattached to MTX17. For example, MTX-PG3 has a mediantime to reach steady state of 41.2 weeks (range 19.8–66.7weeks) compared to 139.8 weeks (range 15.5–264.0 weeks)for MTX-PG517. Steady-state levels are also highly variablebetween patients: total erythrocyte MTX-PG concentrationvaried between 90.9–351.5 nmol/8 × 1012 RBC17. Themechanisms behind the highly variable intracellularMTX-PG levels are still not known. Previous research hasshown that increased age, higher dose, route of adminis-tration, and decreased renal function18,19 are associated withhigher MTX-PG levels, as well as multiple single-nucleo-tide polymorphisms (SNP) in MTX pathway genes8,13.However, these studies used cross-sectional cohorts with awide range of treatment duration among patients. Therefore,the aim of our study was to examine clinical, genetic,sociodemographic, and biochemical determinants of erythro-cyte MTX-PG concentrations in patients treated withlow-dose oral MTX using 2 different prospective cohorts.
MATERIALS AND METHODSPatients. Our study includes data of patients with RA treated with MTXfrom 2 prospective cohorts. For the derivation cohort, patients from theMTX in Rotterdam, Netherlands, cohort (MTX-R) were used. The MTX-Ris a longitudinal prospective cohort of patients diagnosed with RA whostarted MTX between January 2006 and March 2011 in the Department ofRheumatology, Erasmus University Medical Center, Rotterdam, theNetherlands. The validation cohort consisted of patients from the treatmentin Rotterdam Early Arthritis Cohort (tREACH). The tREACH is a clinicalmulticenter, stratified single-blinded trial (ISRCTN26791028) and wasdescribed earlier20. Patients were included in the validation cohort if theymet the 2010 American College of Rheumatology/European LeagueAgainst Rheumatism criteria for RA. The medical ethics committee fromthe Erasmus University Medical Center approved both studies, and patientsgave written informed consent before inclusion. Patients from thederivation and validation cohorts were included in our study if they wereprescribed MTX at baseline and 3 months of treatment, and had at least 1MTX-PG measurement at 3 months of treatment. All patients wereMTX-naive at inclusion.
In the derivation cohort, dosage and comedication was chosen by thephysician. MTX was generally given orally. Patients from the validationcohort started with 25 mg/week MTX orally (dosage reached after 3 weeks)and were randomized to treatment with or without sulfasalazine (SSZ),hydroxychloroquine (HCQ), and glucocorticosteroids. Patients in both
cohorts received folic acid (10 mg/week) during MTX treatment as recom-mended by the Dutch Rheumatology Society21. In both cohorts, patientswere assessed at baseline and after 3 months.Patient material. During the first and second study visits, an extra EDTAtube was drawn from the patient. The sample from the first visit was usedfor DNA isolation, whereas the sample from the second visit was immedi-ately put on ice after collection and centrifuged for 10 min at 1700 × g and4°C. Plasma and erythrocyte cell-pellet aliquots were stored at –80°C.MTX-PG quantification.MTX-PG were measured in the cell-pellet aliquotssampled at 3 months of treatment using a recently developed LC-MS/MSmethod14. MTX-PG1 and MTX-PG2 are considered as short chain,MTX-PG3 as medium chain, and MTX-PG4 and MTX-PG5 as long chain.The sum-score of MTX-PG2 to MTX-PG5 was used as the total MTX-PGcontent. Considering the finding that MTX-PG1 can diffuse over the RBCmembrane22, we decided to remove MTX-PG1 out of the model for totalMTX-PG.Genotyping. SNP in genes involved in MTX transport and polyglutamy-lation were selected based on the following criteria: minor allele frequency> 0.10 in the HapMap and National Center for Biotechnology InformationSNP database23,24 or a proven functionality in relation to MTX, juvenileidiopathic arthritis (JIA), RA, or folate metabolism25,26,27,28,29,30,31,32,33. Ifno information was known for a particular gene, we selected tagging SNPby HapMap database and Haploview (version 4.2, 29 April 2008).Preferably, 2 SNP were selected per gene, which were located in differenthaplotype blocks.
The following 28 SNP in 19 genes were selected: ABCB1 rs1128503,rs2032582, rs1045642; ABCC1 rs35592, rs3784862; ABCC2 rs4148396,rs717620; ABCC3 rs4793665, rs3785911; ABCC4 rs868853, rs2274407;ABCC5 rs2139560; ABCG2 rs13120400, rs2231142; ADA rs7359874;ADORA2A rs5751876; AMPD1 rs17602729; ATIC rs2372536; FPGSrs4451422; FOLR2 rs514933; GGH rs10106587, rs3758149; ITPArs1127354; MTHFR rs1801131, rs1801133; MTRR rs1801394; SLC46A1rs2239907; and SLC19A1 rs1051266. The major allele was analyzed aswild-type allele.
SNP genotyping has been described earlier34.Clinical, biochemical, and sociodemographic variables. Various clinical,biochemical, and sociodemographic variables were assessed at baseline. Inthe derivation cohort, the use of other disease-modifying antirheumaticdrugs, HCQ, SSZ, corticosteroids, biological, route of administration ofcorticosteroids, dose of MTX, and route of administration of MTX werereported by patients using question forms. In the validation cohort, theseitems were scored by research nurses. The estimated glomerular filtrationrate-Modification of Diet in Renal Disease (eGFR-MDRD) was calculatedusing the 4-variable MDRD formula, and body surface area was calculatedusing the Mosteller formula.
During our study visit, blood was obtained from patients to determinerheumatoid factor, anticyclic citrullinated peptide antibody, C-reactiveprotein (CRP), 1-h erythrocyte sedimentation rate (ESR), albumin,enzymatic creatinine, erythrocyte folate, serum folate, vitamin B12,vitamin B6, and homocysteine. Questionnaires were used to determinesmoking habits and the consumption of alcohol, cola, coffee, tea, andcigarettes (amount per day).Statistics. Comparison of patient characteristics between cohorts was madeby Student t test, chi-square test, or the Mann-Whitney U test where appro-priate. Multivariate multiple linear regression analysis, stratified by cohort,was used to examine the associations between these potential determinantsand the different MTX-PG concentrations. First, univariate linearregression was performed for all potential determinants with the MTX-PGconcentrations as outcome measure. The strength of the associations wasexpressed as standardized β. Univariate relations between variables andany MTX-PG with a p value less than 0.2 were entered in subsequent multi-variate multiple regression analyses with adjustment for age, sex, and otherpotential determinants that had a p value of less than 0.2 in the univariateanalysis.
2168 The Journal of Rheumatology 2014; 41:11; doi:10.3899/jrheum.131290
Personal non-commercial use only. The Journal of Rheumatology Copyright © 2014. All rights reserved.
RheumatologyThe Journal of on June 14, 2020 - Published by www.jrheum.orgDownloaded from

Continuous determinants were analyzed as continuous variable andtransformed into quintiles to examine possible nonlinear associations. Toestablish nonlinear associations, the quintiles were plotted against the totalMTX-PG levels used. Variables with a nonlinear association were trans-formed into categorical variables and categories were combined whereappropriate. This was done for ESR, GFR, creatinine, alcohol consumption,tea consumption, and days of treatment. Dummy variables were used toanalyze categorical variables with more than 2 categories in linearregression using the first category as reference. Non-normal distributedvariables were transformed using the natural logarithm (ln) for linearregression; this was done for homocysteine, erythrocyte folate, andC-reactive protein.
SNP were divided into dominant, recessive, or additive modelsdepending on the distribution of the total MTX-PG levels per genotype toensure preanalysis selection of an analysis model. ANCOVA was used todetermine significant associations between SNP and MTX-PG levels. ForSNP, estimated marginal means + standard error are reported. SNP indominant model were ITPA rs1127354, AMPD1 rs17602729, ABCC4rs2274407, and ABCC2 rs717620. SNP in recessive model were ABCC1rs35592, ABCC4 rs868853, FPGS rs4451422, and SLC19A1 rs1051266.Other SNP were analyzed as an additive model. All SNP were corrected forage and sex.
It was not possible to test the influence of MTX dose in the separatecohorts because MTX dose was registered at 25 mg/week in the validationcohort and there was low variation in the derivation cohort. To evaluatedose as potential determinant, both cohorts were combined. MTX dose wasentered in an ANCOVA together with age, sex, erythrocyte folate, andFPGS rs4451422.
Multiple testing was not corrected for, as the included variables in ourstudy were carefully chosen for an expected relation to MTX-PG based onthe literature and physiology. Statistical analyses were done with SPSSPASW 20.0.0.1 for Windows (SPSS Inc.) unless stated otherwise. P valuesless than 0.05 were considered significant.
RESULTSPatient characteristics. Ninety-three out of 102 patientsfrom the derivation cohort and 247 out of 285 patients fromthe validation cohort could be included in our study. Theremaining patients were excluded because there was noerythrocyte pellet sample for MTX-PG measurement at 3months.
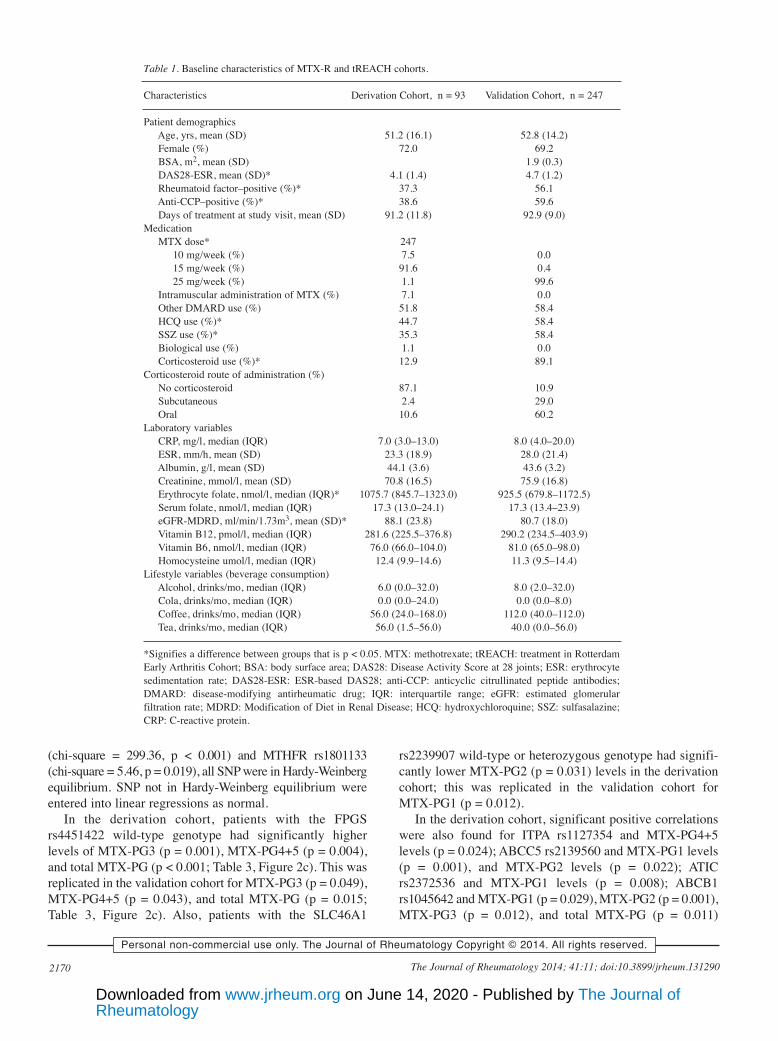
The derivation and validation cohorts were very similarfor most baseline characteristics (Table 1). In the derivationcohort, a smaller percentage of patients used HCQ (44.7%vs 58.4%, p = 0.32), SSZ (35.3% vs 58.4%, p < 0.001), andcorticosteroids (12.9% vs 89.1%, p < 0.001). DiseaseActivity Score at 28 joints was lower in the derivationcohort (4.1 vs 4.7), and the derivation cohort had slightlyhigher eGFR-MDRD (88.1 ml/min/1.73m2 vs 80.7ml/min/1.73m2, p < 0.05) and erythrocyte folate content(1075.7 nmol/l vs 925.5 nmol/l, p < 0.001) than thevalidation cohort. Treatment dose of MTX was significantlydifferent between the cohorts (p < 0.001). Patients in thederivation were treated with 15 mg/week and patients in thevalidation were treated with 25 mg/week as per studyprotocol.MTX-PG levels. After 3 months of MTX treatment, median[interquartile range (IQR)] MTX-PG concentrations in thederivation cohort were 33.8 (22.7–61.6), 23.1 (17.2–31.6),39.8 (24.8–53.6), 8.4 (4.2–17.3), 1.0 (0.0–2.8) nmol/l for
MTX-PG1 to MTX-PG5, respectively, and 79.0 (49.3–106.0)nmol/l for total MTX-PG (Figure 1a). In the validationcohort, median (IQR) MTX-PG concentrations were 30.0(19.8–47.4), 21.2 (15.9–27.4), 49.0 (36.5–61.4), 20.0(11.4–30.2), 4.7 (2.0–9.3) nmol/l for MTX-PG1 toMTX-PG5, respectively (Figure 1a), and 97.9 (71.6–125.3)for total MTX-PG. MTX-PG1 did not differ between thederivation cohort and the validation cohort despite thedifference in MTX dose between cohorts (Table 1). MedianMTX-PG2 concentrations were slightly, but significantlyhigher in the derivation cohort than in the validation cohort(p = 0.015). In contrast, median MTX-PG3, MTX-PG4,MTX-PG5, and total MTX-PG were significantly lower inthe derivation cohort than in the validation cohort (p < 0.001for MTX-PG3-5 and total MTX-PG; Figure 1a).Determinants of MTX-PG. All variables listed in Table 1were entered into a univariate linear regression model(Supplementary Table 1, available online at jrheum.com).Variables that obtained a p value < 0.2 in univariate linearregression were entered into a multivariate linear regressionmodel (Table 2).
In multivariate analysis, in the derivation cohort, therewas a positive association between age at start of treatmentand levels of MTX-PG1 (stβ 0.23, p = 0.033) and totalMTX-PG (stβ 0.23, p = 0.018), while exhibiting a trend forMTX-PG2 (stβ 0.18, p = 0.098) and borderline significancefor MTX-PG3 (stβ 0.21, p = 0.052; Table 2). This findingwas replicated in the validation cohort for all MTX-PG(MTX-PG1: stβ 0.13, p = 0.04; MTX-PG2: stβ 0.21, p =0.001; MTX-PG3: stβ 0.22, p < 0.001; MTX-PG4+5: stβ0.25, p < 0.001; and total MTX-PG: stβ 0.28, p < 0.001;Figure 2a). Erythrocyte folate was positively associatedwith levels of MTX-PG3 (stβ 0.32, p = 0.021) and totalMTX-PG (stβ 0.32, p = 0.022) while exhibiting a trend forsignificance for MTX-PG4+5 (stβ 0.24, p = 0.099) in thederivation cohort. This was replicated in the validationcohort for MTX-PG3 levels (stβ 0.15, p = 0.04) and therewas a trend toward significance for MTX-PG4+5 levels (stβ0.13, p = 0.087) and total MTX-PG levels (stβ 0.14, p =0.053; Figure 2b). Also, in the derivation cohort, there werepositive associations between serum folate concentrationand MTX-PG1 levels (stβ 0.32, p = 0.002), and betweenCRP concentration and levels of MTX-PG1 (stβ 0.29, p =0.043) and MTX-PG2 (stβ 0.32, p=0.022). These findingswere not replicated in the validation cohort.
In the validation cohort, male patients had higher totalMTX-PG levels than female patients (0.14, p = 0.027), andhomocysteine levels were positively associated withMTX-PG4+5 levels (stβ 0.20, p = 0.007). These findingswere not found in the derivation cohort.SNP analysis. A total of 28 SNP in 18 MTX pathway geneswere assessed for their contribution to MTX-PG levels(Table 3; Supplementary Table 2, available online atjrheum.com). With the exception of ABCB1 rs2032582
2169den Boer, et al: Determinants of MTX polyglutamates
Personal non-commercial use only. The Journal of Rheumatology Copyright © 2014. All rights reserved.
RheumatologyThe Journal of on June 14, 2020 - Published by www.jrheum.orgDownloaded from
(chi-square = 299.36, p < 0.001) and MTHFR rs1801133(chi-square = 5.46, p = 0.019), all SNP were in Hardy-Weinbergequilibrium. SNP not in Hardy-Weinberg equilibrium wereentered into linear regressions as normal.
In the derivation cohort, patients with the FPGSrs4451422 wild-type genotype had significantly higherlevels of MTX-PG3 (p = 0.001), MTX-PG4+5 (p = 0.004),and total MTX-PG (p < 0.001; Table 3, Figure 2c). This wasreplicated in the validation cohort for MTX-PG3 (p = 0.049),MTX-PG4+5 (p = 0.043), and total MTX-PG (p = 0.015;Table 3, Figure 2c). Also, patients with the SLC46A1
rs2239907 wild-type or heterozygous genotype had signifi-cantly lower MTX-PG2 (p = 0.031) levels in the derivationcohort; this was replicated in the validation cohort forMTX-PG1 (p = 0.012).
In the derivation cohort, significant positive correlationswere also found for ITPA rs1127354 and MTX-PG4+5levels (p = 0.024); ABCC5 rs2139560 and MTX-PG1 levels(p = 0.001), and MTX-PG2 levels (p = 0.022); ATICrs2372536 and MTX-PG1 levels (p = 0.008); ABCB1rs1045642 and MTX-PG1 (p = 0.029), MTX-PG2 (p = 0.001),MTX-PG3 (p = 0.012), and total MTX-PG (p = 0.011)
2170 The Journal of Rheumatology 2014; 41:11; doi:10.3899/jrheum.131290
Personal non-commercial use only. The Journal of Rheumatology Copyright © 2014. All rights reserved.
Table 1. Baseline characteristics of MTX-R and tREACH cohorts.
Characteristics Derivation Cohort, n = 93 Validation Cohort, n = 247
Patient demographicsAge, yrs, mean (SD) 51.2 (16.1) 52.8 (14.2)Female (%) 72.0 69.2BSA, m2, mean (SD) 1.9 (0.3)DAS28-ESR, mean (SD)* 4.1 (1.4) 4.7 (1.2)Rheumatoid factor–positive (%)* 37.3 56.1Anti-CCP–positive (%)* 38.6 59.6Days of treatment at study visit, mean (SD) 91.2 (11.8) 92.9 (9.0)
MedicationMTX dose* 247
10 mg/week (%) 7.5 0.015 mg/week (%) 91.6 0.425 mg/week (%) 1.1 99.6
Intramuscular administration of MTX (%) 7.1 0.0Other DMARD use (%) 51.8 58.4HCQ use (%)* 44.7 58.4SSZ use (%)* 35.3 58.4Biological use (%) 1.1 0.0Corticosteroid use (%)* 12.9 89.1
Corticosteroid route of administration (%)No corticosteroid 87.1 10.9Subcutaneous 2.4 29.0Oral 10.6 60.2
Laboratory variablesCRP, mg/l, median (IQR) 7.0 (3.0–13.0) 8.0 (4.0–20.0)ESR, mm/h, mean (SD) 23.3 (18.9) 28.0 (21.4)Albumin, g/l, mean (SD) 44.1 (3.6) 43.6 (3.2)Creatinine, mmol/l, mean (SD) 70.8 (16.5) 75.9 (16.8)Erythrocyte folate, nmol/l, median (IQR)* 1075.7 (845.7–1323.0) 925.5 (679.8–1172.5)Serum folate, nmol/l, median (IQR) 17.3 (13.0–24.1) 17.3 (13.4–23.9)eGFR-MDRD, ml/min/1.73m3, mean (SD)* 88.1 (23.8) 80.7 (18.0)Vitamin B12, pmol/l, median (IQR) 281.6 (225.5–376.8) 290.2 (234.5–403.9)Vitamin B6, nmol/l, median (IQR) 76.0 (66.0–104.0) 81.0 (65.0–98.0)Homocysteine umol/l, median (IQR) 12.4 (9.9–14.6) 11.3 (9.5–14.4)
Lifestyle variables (beverage consumption)Alcohol, drinks/mo, median (IQR) 6.0 (0.0–32.0) 8.0 (2.0–32.0)Cola, drinks/mo, median (IQR) 0.0 (0.0–24.0) 0.0 (0.0–8.0)Coffee, drinks/mo, median (IQR) 56.0 (24.0–168.0) 112.0 (40.0–112.0)Tea, drinks/mo, median (IQR) 56.0 (1.5–56.0) 40.0 (0.0–56.0)
*Signifies a difference between groups that is p < 0.05. MTX: methotrexate; tREACH: treatment in RotterdamEarly Arthritis Cohort; BSA: body surface area; DAS28: Disease Activity Score at 28 joints; ESR: erythrocytesedimentation rate; DAS28-ESR: ESR-based DAS28; anti-CCP: anticyclic citrullinated peptide antibodies;DMARD: disease-modifying antirheumatic drug; IQR: interquartile range; eGFR: estimated glomerularfiltration rate; MDRD: Modification of Diet in Renal Disease; HCQ: hydroxychloroquine; SSZ: sulfasalazine;CRP: C-reactive protein.
RheumatologyThe Journal of on June 14, 2020 - Published by www.jrheum.orgDownloaded from

levels. A significant negative correlation was found forABCC1 rs35592 and MTX-PG3 (p = 0.021). None of theseresults were replicated in the validation cohort.
In the validation cohort, significant positive associationswere found for AMPD1 rs17602729 and MTX-PG2 levels(p = 0.015); ABCC1 rs3784862 and MTX-PG1 levels (p =0.014); MTHFR rs1801131 and MTX-PG1 levels (p =0.031); ABCC3 rs3785911 and MTX-PG4+5 (p = 0.004),and total MTX-PG levels (p = 0.029); ABCC3 rs4793665and MTX-PG1 levels (p = 0.038). A significant negativecorrelation was found for ABCC4 rs868853 and MTX-PG1levels (p = 0.038). These results were not observed in thederivation cohort.Combined multivariate model. The significant variablespresent in both cohorts and their confounders were includedin 1 multivariate regression model. The included variableswere age, erythrocyte folate, and FPGS rs4451422. Con-founders included were sex and serum folate. In thederivation cohort, this combined model explained 14% ofMTX-PG1 variability, 4% of MTX-PG2 variability, 21% ofMTX-PG3 variability, 11% of MTX-PG4+5 variability, and21% of total MTX-PG variability (Table 4). However, in thevalidation cohort, the model explained 0% of MTX-PG1variability, 3% of MTX-PG2 variability, 7% of MTX-PG3
variability, 7% of MTX-PG4+5 variability, and 10% of totalMTX-PG variability.MTX dose. Because the variation in MTX dosage in eachcohort was insufficient to adequately determine theinfluence of treatment dose on MTX-PG concentration, theeffect of dosage was studied by grouping both cohorts andcomparing the different treatment doses. Multivariateregression analysis was performed using age, sex, erythro-cyte folate, and FPGS rs4451422 as covariables. Treatmentdose did not have a significant association with MTX-PG1.However, treatment dose had a positive association withMTX-PG3 levels (stβ 0.23, p < 0.001), MTX-PG4+5 levels(stβ 0.30, p < 0.001), and total MTX-PG levels (stβ 0.20, p = 0.002; Figure 1b). Strikingly, there was a negativeassociation with MTX-PG2 levels (stβ –0.22, p < 0.001).The model including dose explained 1% of MTX-PG1variability, 8% of MTX-PG2 variability, 15% of MTX-PG3variability, 15% of MTX-PG4+5 variability, and 16% oftotal MTX-PG variability in the combined cohort.
DISCUSSIONTo the best of our knowledge, we are the first to report theclinical, genetic, sociodemographic, and biochemical deter-minants of erythrocyte MTX-PG accumulation at 3 months
2171den Boer, et al: Determinants of MTX polyglutamates
Personal non-commercial use only. The Journal of Rheumatology Copyright © 2014. All rights reserved.
Figure 1. A. Concentrations of the separate MTX-PG in the derivation (white bars, n = 93) and validation (grey bars, n = 247) cohorts. Brackets denote signifi-cant differences between cohorts. P values are noted above the brackets. MTX-PG2 is significantly lower in the validation cohort, while MTX-PG3,MTX-PG4, and MTX-PG5 are higher in the validation cohort. Significant differences were tested with Mann-Whitney U test. B. Effect of MTX dosage onthe concentration of total MTX-PG in the combined cohort. Increased dose of MTX leads to increased total MTX-PG. ANCOVA was adjusted for age, sex,erythrocyte folate, and rs4451422 in the FPGS gene. P values are from the confounder adjusted data. Boxplots are from unadjusted data. *p < 0.05. **p <0.001. MTX: methotrexate; PG: polyglutamate; RBC: red blood cell.
RheumatologyThe Journal of on June 14, 2020 - Published by www.jrheum.orgDownloaded from

of low-dose MTX treatment in a prospective study using aderivation and validation cohort. In our study, we found age,MTX dosage, erythrocyte folate content, and the FPGSrs4451422 SNP as the major determinants of MTX-PGlevels in both cohorts.
MTX is the “anchor drug” in the treatment of pediatricand adult arthritis because of its high efficacy, low cost, andgood safety profile. Its use is hampered because 20–40% ofpatients are nonresponsive to treatment and 30% of patients
encounter adverse events1,2. To further improve efficacy andreduce toxicity, personalized treatment is mandatory byprescribing patients the right drug in the right concen-tration2,35. The dosage of MTX required to suppress diseaseactivity varies among patients, and TDM of low-dose MTXtherapy is not yet possible because plasma MTX is rapidlycleared and is unrelated to response4,36. This has led to atrial-and-error approach in finding the right MTX dose forpatients with RA. However, intracellular MTX can be
2172 The Journal of Rheumatology 2014; 41:11; doi:10.3899/jrheum.131290
Personal non-commercial use only. The Journal of Rheumatology Copyright © 2014. All rights reserved.
Table 2. Clinical, sociodemographic, and biochemical determinants of erythrocyte MTX-PG levels at 3 months of treatment (multivariate analysis). Variablesshown had p values < 0.1 in univariate analysis for at least 1 of the MTX-PG. All variables have been adjusted for age and sex. In addition, C-reactive proteinwas also adjusted for DAS28-ESR and albumin; erythrocyte folate for serum folate; albumin for C-reactive protein; homocysteine for erythrocyte folate;parenteral administration of MTX for coffee; vitamin B12 for erythrocyte folate; anti-CCP for prednisone route.
Derivation Cohort Validation Cohortstβ stβ
Variable n MTX-PG1 MTX-PG2 MTX-PG3 MTX-PG4+5 Total n MTX-PG1 MTX-PG2 MTX-PG3 MTX-PG4+5 Total MTX-PG MTX-PG
Age (yr) 93 0.23* 0.18# 0.21# 0.17 0.23* 247 0.13* 0.21** 0.22*** 0.25*** 0.28***Sex 93 0.05 –0.10 –0.09 0.03 –0.06 247 0.02 –0.08 –0.12# –0.12# –0.14*DAS28-ESR 80 0.07 –0.01 0.18 0.22# 0.17 247 0.08 0.06 0.09 0.06 0.09Anti-CCP–positive 76 0.06 –0.09 –0.04 0.01 –0.06 198 –0.10 0.06 0.09 0.09 0.10Days of treatment at study visit 87 –0.06 0.15 0.21# –0.08 0.19# 234 0.06 0.06 0.017** 0.04 0.11#Intramuscular administration
of MTX 82 0.09 –0.22 –0.05 –0.07 –0.13 n/a n/a n/a n/a n/a n/aOther DMARD use 85 0.13 0.02 0.12 0.15 0.13 221 –0.12# –0.01 –0.03 –0.04 –0.04HCQ use 85 0.13 –0.29 –0.17 0.1 –0.14 221 –0.12# –0.01 –0.03 –0.04 –0.04SSZ use 85 0.04 0.08 0.19# 0.13 0.18# 221 –0.12# –0.01 –0.03 –0.04 –0.04Corticosteroid use 85 –0.04 –0.05 0.01 0.01 –0.01 221 0.10 0.05 –0.05 0.00 –0.01Corticosteroid IM vs
no corticosteroid 85 –0.07 –0.07 –0.02 0.08 0.00 221 0.13 0.09 –0.17# –0.12 –0.12Corticosteroid oral vs
no corticosteroid 85 –0.01 –0.02 0.02 –0.02 –0.01 221 0.18# 0.08 –0.05 –0.02 0.01CRP, mg/l (ln) 76 0.29* 0.32* 0.07 –0.01 0.15 223 0.08 0.03 0.02 0.06 0.05ESR, > 44 vs < 44 mm/h 91 –0.08 0.05 0.14 0.15 0.15 246 0.00 0.00 0.01 0.04 0.03Albumin, g/l 86 0.07 0.02 –0.18 -0.08 –0.11 223 0.07 0.06 0.10 0.09 0.11Creatinine, > 78 vs < 78
mmol/l 93 –0.03 0.01 0.03 0.02 0.03 98 0.15 0.18 0.20# 0.16 0.21#Erythrocyte folate, nmol/l (ln) 88 –0.18 0.19 0.32* 0.24# 0.32* 218 0.08 0.02 0.15* 0.13# 0.14#Serum folate, nmol/l 89 0.32** –0.07 0.11 0.04 0.05 224 –0.05 –0.05 –0.07 –0.06 –0.08eGFR-MDRD, > 88 vs
< 88 ml/min/BSA 93 0.18 0.04 0.06 –0.11 0.00 98 –0.07 0.03 –0.08 –0.18 –0.12Vitamin B12, pmol/l 88 0.10 –0.05 –0.06 –0.05 –0.07 218 –0.05 0.09 0.03 –0.08 –0.01Homocysteine, μmol /l (ln) 86 0.16 0.04 0.17 0.14 0.16 213 0.03 0.03 0.05 0.20** 0.14#Alcohol consumption, > 4 vs
< 4 glasses per mo 38 0.29 0.10 –0.19 –0.29 –0.20 230 0.03 0.06 0.09 0.04 0.08Alcohol consumption, > 32 vs
< 4 glasses per mo 38 –0.04 –0.06 –0.22 –0.24 –0.30 230 0.02 0.03 0.12 0.04 0.07Cola consumption, > 8 vs
< 6 glasses per mo 82 0.06 0.17 0.29* 0.16 0.27* 227 0.01 –0.15* –0.04 0.09 –0.01Coffee consumption, > 120 vs
< 112 cups per mo 82 –0.01 –0.12 –0.19# -0.18 –0.21# 228 0.10 –0.01 0.07 0.02 0.04Tea consumption,
> 168 cups/mo vs < 168 cups/mo 82 0.12 0.05 0.06 0.1 0.09 225 –0.04 0.04 -0.04 0.01 0
*p < 0.05. **p < 0.01. ***p < 0.001. # = p < 0.1. MTX: methotrexate; PG: polyglutamate; DAS28: Disease Activity Score at 28 joints; ESR: erythrocytesedimentation rate; DAS28-ESR: ESR-based DAS28; anti-CCP: anticyclic citrullinated peptide antibodies; DMARD: disease-modifying antirheumatic drug;IM: intramuscular; ln: natural logarithm; eGFR: estimated glomerular filtration rate; MDRD: Modification of Diet in Renal Disease; HCQ: hydroxychloro-quine; SSZ: sulfasalazine; CRP: C-reactive protein.
RheumatologyThe Journal of on June 14, 2020 - Published by www.jrheum.orgDownloaded from

measured15,37,38, and we have shown in 3 prospective cohortstudies in RA and JIA39,40 that erythrocyte MTX-PG levelspredict response in the first 9 months of treatment. Knowingthe determinants of MTX-PG accumulation and the cutoffconcentration that predicts good response with good sensi-
tivity and specificity might help with targeting treatment forthe individual patient to reach the optimal MTX-PG level.TDM of MTX therapy may also help to identify patientswho do not comply or partially comply with treatment.
In concordance with previous findings18, we found age
2173den Boer, et al: Determinants of MTX polyglutamates
Personal non-commercial use only. The Journal of Rheumatology Copyright © 2014. All rights reserved.
Figure 2. A. Linear regression of age and total MTX-PG. Solid line represents a trend line with its 95% CI (dotted line). In both cohorts, age is positivelyassociated with total MTX-PG. Regression analysis is plotted from the unadjusted data. Stβ and p values are from the confounder adjusted data. B. Linearregression of erythrocyte folate and total MTX-PG. Solid line represents a trend line with its 95% CI (dotted line). In both cohorts, age is positively associatedwith total MTX-PG. Regression analysis is plotted from the unadjusted data. Stβ and p values are from the confounder adjusted data. C. Effect of the FPGSrs4451422 variant allele on the concentration of total MTX-PG. Patients of the FPGS rs4451422 heterozygous and homozygous genotype have significantlylower concentrations of total MTX-PG. ANCOVA was adjusted for age and sex. Brackets denote significant differences between groups. P values are notedabove the brackets. *p < 0.05. **p < 0.001. MTX: methotrexate; PG: polyglutamate; FPGS: folylpolyglutamate synthase; RBC: red blood cell; Wt: wild-typecarriers; het/var: heterozygous combined with homozygous variant carriers.
RheumatologyThe Journal of on June 14, 2020 - Published by www.jrheum.orgDownloaded from

as the predominant determinant for erythrocyte MTX-PGlevels, with increasing age leading to increased concentra-tions of long-chain and total MTX-PG (Figure 2a). Althoughreduced renal function is likely an important part of thiscomplex interaction, eGFR-MDRD and creatinine levels didnot have a significant effect on MTX-PG levels in either ofour cohorts. More extensive research is needed to find theunderlying interactions.
Previous studies have shown that dose is a driving factorfor the accumulation of MTX-PG18,19,41. In our study, thevalidation cohort had elevated MTX-PG3, MTX-PG4, andMTX-PG5 levels, but lower MTX-PG2 levels than thederivation cohort (Figure 1a). This difference in MTX-PG
levels between cohorts is likely caused by the difference indose as the cohorts had significantly different dosingregimens (Table 1).
However, in our cohorts, there was too little variation indosage to be able to demonstrate and validate a relationbetween MTX dosage and erythrocyte MTX-PG accumu-lation in each cohort. Therefore, we studied the effect ofMTX dosage on erythrocyte MTX-PG accumulation bygrouping both cohorts and comparing the treatment doses.Using multivariate analysis, we confirmed that the differ-ences in MTX-PG concentration between our cohorts werelargely attributable to the difference in dose. Patients treatedwith 25 mg/week had 61% higher concentrations of
2174 The Journal of Rheumatology 2014; 41:11; doi:10.3899/jrheum.131290
Personal non-commercial use only. The Journal of Rheumatology Copyright © 2014. All rights reserved.
Table 3. SNP within cellular folate transport and metabolism routes in relation to MTX polyglutamate levels at 3 months of treatment in MTX-R and tREACHcohorts. Analysis was done using ANCOVA with correction for age and sex. Only SNP with a significant correlation with any MTX-PG in the derivation orvalidation cohort are shown (full table in Supplementary Table 2, available online at jrheum.com).
Derivation ValidationEstimated Marginal Means (SE) Estimated Marginal Means (SE)
n MTX-PG1 MTX-PG2 MTX-PG3 MTX-PG4+5 MTX-PG n MTX-PG1 MTX-PG2 MTX-PG3 MTX-PG4+5 MTX-PG Total Total
rs1127354 ITPA C/A WT 81 44.8 (5.4) 27.1 (1.6) 39.1 (2.2) 13.2 (2.1)* 79.3 (4.6) 211 43.3 (3.4) 23.1 (0.7) 50.5 (1.3) 30.4 (1.5) 103.9 (2.8)Het/Var 12 62.0 (13.0) 27.5 (3.8) 49.6 (5.6) 25.1 (4.9)* 102.2 (11.0) 36 40.7 (7.8) 20.6 (1.5) 48.7 (2.8) 27.6 (3.4) 96.9 (6.3)
rs17602729 AMPD1 G/A WT 66 46.7 (6.3) 28.2 (1.8) 41.6 (2.5) 15.6 (2.4) 85.4 (5.3) 198 41.8 (3.6) 21.9 (0.7)* 49.4 (1.3) 29.9 (1.6) 101.2 (2.9)Het/Var 17 54.2 (11.2) 27.3 (3.2) 40.5 (4.5) 14.2 (4.3) 82.0 (9.4) 42 48.4 (7.3) 25.7 (1.4)* 52.6 (2.6) 30.3 (3.2) 108.6 (5.9)
rs35592 ABCC1 T/C WT/Het 76 48.2 (5.8) 27.8 (1.7) 42.6 (2.3)* 16.1 (2.2) 86.5 (4.8) 229 43.3 (3.3) 22.7 (0.7) 50.0 (1.2) 30.2 (1.5) 102.9 (2.7)Var 7 49.9 (17.8) 30.1 (5.1) 25.9 (6.9)* 4.5 (6.7) 60.5 (14.6) 11 36.6 (14.5) 20.7 (2.9) 47.9 (5.2) 23.5 (6.4) 92.1 (11.6)
rs3784862 ABCC1 A/G WT 38 46.8 (7.9) 25.9 (2.2) 42.1 (3.2) 17.8 (3.0) 85.8 (6.7) 133 47.0 (4.2)* 23.6 (0.8) 49.9 (1.5) 28.0 (1.9) 101.5 (3.4)Het 34 52.9 (8.0) 30.9 (2.3) 40.9 (3.3) 12.2 (3.1) 84.0 (6.8) 90 32.7 (5.1)* 21.1 (1.0) 49.9 (1.9) 33.4 (2.3) 104.4 (4.2)Var 11 35.0 (15.0) 24.6 (4.3) 39.6 (6.1) 17.4 (5.8) 81.6 (12.7) 17 63.6 (11.3)* 22.5 (2.3) 50.6 (4.1) 28.2 (5.0) 101.4 (9.2)
rs868853 ABCC4 T/C WT/Het 65 48.4 (6.1) 27.5 (1.7) 41.1 (2.3) 15.3 (2.3) 83.9 (4.9) 205 45.6 (3.5)* 22.8 (0.7) 49.9 (1.3) 29.4 (1.5) 102.0 (2.8)Var 15 51.1 (13.0) 32.2 (3.7) 46.2 (5.0) 16.8 (5.0) 95.3 (10.6) 34 27.5 (8.2)* 21.7 (1.6) 50.9 (2.9) 34.5 (3.6) 107.0 (6.6)
rs2139560 ABCC5 G/A WT 34 34.2 (7.7)** 24.3 (2.3)* 38.5 (3.3) 16.4 (3.2) 79.3 (7.0) 85 40.7 (5.2) 22.5 (1.0) 50.5 (1.8) 31.5 (2.3) 104.5 (4.1)Het 38 48.7 (7.1)** 28.7 (2.1)* 41.5 (3.1) 14.2 (3.0) 84.4 (6.4) 111 45.9 (4.7) 22.9 (0.9) 49.8 (1.7) 29.4 (2.1) 102.1 (3.8)Var 11 90.6 (13.0)** 36.6 (3.9)* 49.2 (5.6) 15.5 (5.5) 101.4 (11.7) 44 40.2 (7.5) 22.0 (1.5) 48.9 (2.7) 27.9 (3.3) 98.8 (6.0)
rs2372536 ATIC C/G WT 37 37.0 (7.7)** 25.9 (2.4) 37.3 (3.2) 15.6 (3.2) 78.8 (6.8) 108 43.5 (4.7) 22.8 (0.9) 50.1 (1.7) 28.7 (2.1) 101.7 (3.7)Het 39 50.1 (7.2)** 29.5 (2.2) 43.1 (3.0) 14.3 (2.9) 86.9 (6.3) 98 42.3 (5.0) 23.0 (1.0) 51.0 (1.8) 32.3 (2.2) 106.3 (4.0)Var 7 94.0 (16.5)** 29.9 (5.0) 50.6 (50.6) 19.1 (6.8) 99.6 (14.6) 34 43.6 (8.2) 21.0 (1.6) 46.5 (2.9) 27.5 (3.6) 94.9 (6.5)
rs4451422 FPGS A/C WT 61 55.8 (10.3) 31.6 (3.0) 52.3 (52.3)** 24.8 (3.8)** 108.7 (8.1)*** 172 46.5 (5.8) 24.3 (1.2) 53.3 (2.1)* 34.3 (2.6)* 111.8 (4.6)*Het/Var 22 46.0 (6.3) 26.9 (1.8) 37.8 (2.4)** 12.2 (2.3)** 76.8 (4.9)*** 68 41.6 (3.8) 21.9 (0.8) 48.6 (1.4)* 28.3 (1.7)* 98.8 (3.0)*
rs1045642 ABCB1 G/A WT 14 37.1 (12.7)* 20.6 (3.5)** 31.7 (5.1)* 10.3 (5.0) 62.6 (10.3)** 52 38.6 (6.8) 22.3 (1.4) 50.5 (2.4) 29.3 (3.0) 102.1 (5.4)Het 41 37.9 (7.3)* 25.0 (2.0)** 38.4 (2.9)* 13.3 (2.9) 76.7 (6.0)** 122 43.9 (4.5) 22.6 (0.9) 49.2 (1.6) 30.5 (2.0) 102.2 (3.6)Var 28 66.0 (8.5)* 34.5 (2.3)** 48.5 (3.4)* 19.5 (3.3) 102.5 (6.9)** 66 44.6 (6.0) 22.9 (1.2) 50.9 (2.1) 29.6 (2.6) 103.4 (4.8)
rs1801131 MTHFR T/G WT 44 45.4 (7.2) 26.4 (2.1) 38.8 (2.9) 15.2 (2.8) 80.5 (6.0) 111 36.1 (4.7)* 22.1 (0.9) 50.9 (1.7) 32.3 (2.1) 105.3 (3.8)Het 29 54.1 (9.4) 29.3 (2.7) 44.8 (3.8) 15.8 (3.6) 90.0 (7.9) 107 45.5 (4.6)* 22.4 (0.9) 48.6 (1.7) 28.4 (2.1) 99.5 (3.7)Var 10 47.7 (14.7) 32.0 (4.2) 44.2 (5.9) 13.9 (5.7) 90.1 (12.3) 22 63.5 (10.0)* 25.8 (2.0) 51.8 (3.6) 26.7 (4.5) 104.4 (8.1)
rs3785911 ABCC3 A/C WT 43 49.0 (7.4) 27.1 (2.1) 40.9 (3.0) 13.8 (2.9) 81.8 (6.2) 126 46.4 (44.4) 22.9 (0.9) 48.3 (1.6) 27.5 (1.9)** 98.7 (3.5)*Het 30 44.7 (8.8) 28.0 (2.5) 41.8 (3.6) 16.8 (3.4) 86.5 (7.4) 93 40.5 (5.0) 22.4 (1.0) 50.6 (1.8) 30.1 (2.2)** 103.0 (4.0)*Var 10 59.4 (15.2) 33.6 (4.4) 41.8 (6.2) 17.4 (5.9) 92.8 (12.8) 21 34.6 (10.3) 21.9 (2.1) 56.8 (3.7) 43.5 (4.5)** 122.2 (8.2)*
rs4793665 ABCC3 T/C WT 22 32.3 (10.1) 23.8 (2.9) 41.8 (4.2) 18.6 (4.0) 84.4 (8.7) 79 44.2 (5.4)* 23.4 (1.1) 49.3 (1.9) 29.1 (2.4) 101.8 (4.4)Het 41 58.7 (7.8) 28.9 (2.3) 40.4 (3.2) 14.2 (3.1) 83.4 (6.7) 119 37.1 (4.4)* 21.8 (0.9) 49.3 (1.6) 30.0 (2.0) 101.1 (3.6)Var 20 46.4 (10.0) 30.3 (2.9) 42.3 (4.1) 14.0 (3.9) 86.6 (8.6) 42 58.6 (7.4)* 23.2 (1.5) 53.5 (2.7) 31.6 (3.3) 108.2 (6.0)
rs2239907 SLC46A1 C/T WT 26 46.9 (9.0) 26.9 (2.5)* 41.4 (3.6) 15.9 (3.5) 84.2 (7.6) 73 37.6 (5.6)* 23.8 (1.1) 51.2 (2.0) 30.7 (2.5) 105.7 (4.6)Het 47 46.4 (7.7) 26.1 (2.1)* 39.7 (3.1) 15.7 (3.0) 81.6 (6.5) 119 39.0 (4.4)* 21.2 (0.9) 48.9 (1.6) 30.5 (2.0) 100.6 (3.6)Var 10 59.7 (14.6) 38.0 (4.0)* 47.1 (5.9) 11.8 (5.6) 96.9 (12.2) 48 60.9 (6.8)* 24.2 (1.4) 50.7 (2.5) 27.6 (3.0) 102.5 (5.5)
*p < 0.05. **p < 0.01. ***p < 0.001. ABCB1/ABCC1/ABCC2/ABCC3/ABCC4/ABCC5/ABCG2: adenosine triphosphate-binding cassette transportersubfamily B/C/G member 1/2/3/4/; FPGS: folylpolyglutamate synthetase; SLC 46A1/SLC19A: solute carrier 46A1/19A1; SNP: single-nucleotide polymor-phism; MTX: methotrexate; tREACH: treatment in Rotterdam Early Arthritis Cohort; PG: polyglutamate; WT: wild type; Het: heterozygous; Var:homozygous variant.
RheumatologyThe Journal of on June 14, 2020 - Published by www.jrheum.orgDownloaded from

long-chain MTX-PG and 18% higher concentrations of totalMTX-PG (Figure 1b) than did patients treated with 15mg/week or less. Interestingly, the group that was treatedwith higher MTX dosage had 21% lower short-chainMTX-PG levels, possibly indicating that the addition ofglutamate groups occurs at a higher rate than the removal ofthe glutamate groups, which would lead the high exposureto MTX to push the equilibrium toward long-chainMTX-PG.
In our validation cohort, strict protocols were applied tocomedication (Table 1). Therefore, we cannot conclusivelydismiss the effect of comedication on the accumulation ofMTX-PG. Corticosteroid supplementation, especially, wasvery strongly correlated to MTX dose. However, none of thecomedications had significant associations with MTX-PGlevels and when entered as covariables in multivariate linearregression, they had no effect on the association.
In addition to dose of treatment, route of administrationhas been shown to affect MTX-PG levels12,19. The effectivedose of subcutaneous administration would be substantiallyhigher because of the increased bioavailability. In ourcohorts, only 7% of the derivation cohort and none of thepatients from the validation cohort received subcutaneousMTX, and we did not see an effect of route of administrationon the MTX-PG levels. This is likely attributable to thesmall number of patients who received subcutaneous MTX,and we expect this to have a stronger effect when morepatients are treated with subcutaneous MTX.
Folic acid use during MTX treatment has no or negativeeffects on MTX efficacy42,43, suggesting that higher concen-trations of folate during MTX treatment facilitate lowereffectiveness of MTX owing to competition with folate for
transporter proteins, polyglutamylation proteins, and targetenzymes. However, we showed in 2 prospective RA cohortsthat high baseline erythrocyte folate was related to responseto MTX44. We speculated that patients with higher concen-trations of baseline erythrocyte folate may be more effectivein accumulating intracellular MTX because of the highstructural similarity of MTX to folate; MTX uses the samecellular machinery for uptake, transport, and metabolism.Baseline erythrocyte folate might be viewed as a functionalmarker for the capacity to take up and accumulate folates,thereby predicting MTX accumulation during treatment. Insupport of this hypothesis, we show that higher baselineerythrocyte folate levels are associated with higher levels ofMTX-PG. We also found that higher baseline serum folatelevels were associated with higher MTX-PG1 levels in thederivation cohort, although not in the validation cohort,which may reflect improved takeup of MTX from theintestine.
It might be speculated that the observed relation betweenage and MTX-PG levels is caused by changes in folate withage. However, although age and baseline erythrocyte folatelevels are correlated in both cohorts (derivation cohort r =0.229, validation cohort r = 0.177), the relation between ageand MTX-PG did not change when erythrocyte folate orserum folate was included in the model as variable,suggesting that age has a distinct effect on MTX-PGaccumulation. In our present study, baseline erythrocytefolate was significantly lower in the validation cohort,whereas this cohort accumulated the highest MTX-PGlevels owing to the much higher doses (25 mg/week). Thedifference in baseline erythrocyte folate between cohortsmight be explained by the slightly higher disease activity in
2175den Boer, et al: Determinants of MTX polyglutamates
Personal non-commercial use only. The Journal of Rheumatology Copyright © 2014. All rights reserved.
Table 4. Multivariate regression model of the 3 strongest determinants. Variables that after correction for confounders had a significant correlation in bothcohorts were included in 1 multivariate regression model. FPGS rs4451422 was dichotomized into wild type versus heterozygous/variant. Correlations withp < 0.05 are considered significant. Confounders are not shown and were serum folate (for erythrocyte folate) and sex (for FPGS rs4451422).
MTX-PG1 MTX-PG2 MTX-PG3 MTX-PG4+5 MTX-PG2–5stβ p stβ p stβ p stβ p stβ p
Derivation cohortAge 0.21 0.06 0.2 0.09 0.24 0.03 0.2 0.08 0.28 0.01Erythrocyte folate –0.19 0.13 0.04 0.75 0.21 0.08 0.18 0.15 0.19 0.1FPGS rs4451422 WT vs het/var –0.08 0.47 –0.17 0.13 –0.36 < 0.001 –0.33 0.003 –0.38 < 0.001R2 0.14 0.04 0.21 0.11 0.21
Validation cohortAge 0.13 0.08 0.22 0.002 0.23 0.001 0.22 0.002 0.28 < 0.001Erythrocyte folate 0.05 0.53 0.03 0.66 0.12 0.09 0.1 0.16 0.11 0.099FPGS rs4451422 WT vs het/var 0.01 0.84 –0.07 0.3 –0.08 0.25 –0.09 0.18 –0.10 0.12R2 0 0.03 0.07 0.07 0.1
Combined cohortDose –0.07 0.26 –0.22 < 0.001 0.23 < 0.001 0.3 < 0.001 0.2 < 0.001Age 0.15 0.013 0.2 0.001 0.23 < 0.001 0.21 < 0.001 0.27 < 0.001Erythrocyte folate 0.03 0.65 0.03 0.66 0.15 0.01 0.11 0.06 0.13 0.024FPGS rs4451422 WT vs het/var –0.01 0.8 –0.09 0.106 –0.16 0.003 –0.15 0.005 –0.18 < 0.001R2 0.01 0.08 0.15 0.15 0.16
FPGS: folylpolyglutamate synthetase; MTX: methotrexate; PG: polyglutamate; WT: wild type; het: heterozygous; var: homozygous variant.
RheumatologyThe Journal of on June 14, 2020 - Published by www.jrheum.orgDownloaded from

the validation cohort; the higher activity of the immunesystem in patients with higher disease activity might lead tohigher folate use, leading to a lower baseline erythrocytefolate in the validation cohort.
Folylpolyglutamate synthetase has a central role in themetabolism of MTX, as it is the enzyme that attaches theglutamate groups to MTX, creating the MTX polygluta-mates. Any changes in function might therefore dramati-cally decrease the longer chain MTX-PG, thereby leading toa slower buildup of MTX-PG and lower steady-stateconcentrations, which in turn can lead to decreased responseto medication45. In our study, we see this effect moststrongly in the derivation cohort, where medium chain andlong chain MTX-PG, as well as total MTX-PG, are signifi-cantly lower (Table 3) in patients with the heterozygous orhomozygous variant genotype of FPGS rs4451422. In thevalidation cohort, the effect is less prominent, with smallerdifferences in concentrations between genotypes. Thehigher MTX dosage in the validation cohort might partiallyoverride the genetic determinants46, leading to a decreasedinfluence of this genotype. This could indicate that patientswith the homozygous variant genotype would benefit froman increase in MTX dose, thereby possibly lowering thetime needed for patients to achieve optimal treatment andmight prevent needless switching to the more expensivebiological.
We also found SLC46A1 rs2239907 to be significantlyassociated with MTX-PG in both cohorts. SLC46A1 is aproton-coupled folate transporter that is responsible for theintestinal uptake of folate. Patients with the SLC46A1rs2239907 homozygous variant allele have significantlyhigher concentrations of short-chain MTX-PG than patientswith the wild-type allele. This could correspond to anincreased uptake of MTX, which would lead to higherplasma MTX levels and increased exposure of the bonemarrow to MTX. Similar to previous studies, the associa-tions of SNP to MTX-PG are weak. In other studies,polymorphisms in the GGH and SLC19 genes have beenfound to influence the long-chain MTX-PG levels6,8. In ourcohorts, there was no significant association of GGH orSLC19 SNP in the derivation cohort, although there was aneffect on long-chain MTX-PG in the validation cohort. Toour knowledge, we are the first to publish an extensiveoverview of the effect of SNP in the MTX pathway on intra-cellular MTX accumulation using a prospective derivationand validation cohort, and linking FPGS rs4451422 andSLC46A1 rs2239907 to MTX-PG accumulation in bothcohorts.
Previous research also found dose of MTX, route ofadministration, age, and renal function15,18,19,41 to bestrongly associated with MTX-PG levels. In concordancewith this data, we found MTX dose and age to be strongdeterminants. However, renal function was not significantlyassociated with MTX-PG levels in our cohorts. The discrep-
ancy between results from previous studies and our studycan be partially explained by the cross-sectional cohorts thatwere used in previous studies. In our study, patients wereprospectively followed while other studies used patients thatwere treated with MTX for up to 19 years6,8,18,19,41. TheMTX-PG accumulation over such a long period would bevery different, mostly in steady state, and possiblycontrolled by different determinants. Previous studies alsoused patients treated with a relatively low dose of MTX,comparable to the derivation cohort in our study. Thevalidation cohort uses an almost 2-fold higher MTX dose,which might override some of the biological and geneticdeterminants, thereby leading to other significant determi-nants of MTX-PG. Despite strong correlations, the determi-nants found in our study explained only up to 21% of thevariability in the derivation cohort, and even less in thevalidation cohort (up to 10%). This was also seen in thecombined cohort, where only up to 16% of variability(MTX-PG2–5) was explained by the model, including doseof treatment. This indicates that there are other undiscoveredfactors that influence the MTX-PG status. One possibilitycould be alternative splicing of FPGS, which has beenshown to influence response to MTX in leukemia celllines47. Alternative splicing leads to loss of function ofFPGS, resulting in a different polyglutamation status andloss of MTX retention in the cell. Another possibility couldbe differences in methylation, causing differences inexpression of the folate pathway genes, thereby leading tovariation in MTX uptake, or polyglutamation.
To the best of our knowledge, our study is the firstprospective study investigating the determinants of intracel-lular MTX-PG using a derivation and validation cohort. Wefound that higher age, higher erythrocyte folate concen-tration, higher MTX dose, and the FPGS rs4451422 wild-type variant all lead to higher accumulation of medium andlong-chain MTX-PG. Knowing these determinants mighthelp target treatment for the individual patient.
ONLINE SUPPLEMENTSupplementary data for this article are available online at jrheum.org.
REFERENCES1. Strand V, Cohen S, Schiff M, Weaver A, Fleischmann R, Cannon G,
et al. Treatment of active rheumatoid arthritis with leflunomidecompared with placebo and methotrexate. Leflunomide RheumatoidArthritis Investigators Group. Arch Intern Med 1999;159:2542-50.
2. Wessels JA, van der Kooij SM, le Cessie S, Kievit W, Barerra P,Allaart CF, et al. A clinical pharmacogenetic model to predict theefficacy of methotrexate monotherapy in recent-onset rheumatoidarthritis. Arthritis Rheum 200;56:1765-75.
3. Bannwarth B, Pehourcq F, Schaeverbeke T, Dehais J. Clinicalpharmacokinetics of low-dose pulse methotrexate in rheumatoidarthritis. Clin Pharmacokinet 1996;30:194-210.
4. Chabner BA, Allegra CJ, Curt GA, Clendeninn NJ, Baram J,Koizumi S, et al. Polyglutamation of methotrexate. Is methotrexatea prodrug? J Clin Invest 1985;76:907-12.
5. Dervieux T, Furst D, Lein DO, Capps R, Smith K, Caldwell J, et al.
2176 The Journal of Rheumatology 2014; 41:11; doi:10.3899/jrheum.131290
Personal non-commercial use only. The Journal of Rheumatology Copyright © 2014. All rights reserved.
RheumatologyThe Journal of on June 14, 2020 - Published by www.jrheum.orgDownloaded from

Pharmacogenetic and metabolite measurements are associated withclinical status in patients with rheumatoid arthritis treated withmethotrexate: results of a multicentred cross sectional observationalstudy. Ann Rheum Dis 2005;64:1180-5.
6. Dervieux T, Furst D, Lein DO, Capps R, Smith K, Walsh M, et al.Polyglutamation of methotrexate with common polymorphisms inreduced folate carrier, aminoimidazole carboxamide ribonucleotidetransformylase, and thymidylate synthase are associated withmethotrexate effects in rheumatoid arthritis. Arthritis Rheum2004;50:2766-74.
7. Dervieux T, Greenstein N, Kremer J. Pharmacogenomic andmetabolic biomarkers in the folate pathway and their associationwith methotrexate effects during dosage escalation in rheumatoidarthritis. Arthritis Rheum 2006;54:3095-103.
8. Dervieux T, Kremer J, Lein DO, Capps R, Barham R, Meyer G, etal. Contribution of common polymorphisms in reduced folatecarrier and gamma-glutamylhydrolase to methotrexate polyglutamate levels in patients with rheumatoid arthritis.Pharmacogenetics 2004;14:733-9.
9. Angelis-Stoforidis P, Vajda FJ, Christophidis N. Methotrexatepolyglutamate levels in circulating erythrocytes and polymorphscorrelate with clinical efficacy in rheumatoid arthritis. Clin ExpRheumatol 1999;17:313-20.
10. Kremer JM, Lee JK. The safety and efficacy of the use ofmethotrexate in long-term therapy for rheumatoid arthritis. ArthritisRheum 1986;29:822-31.
11. Hroch M, Tukova J, Dolezalova P, Chladek J. An improved high-performance liquid chromatography method for quantificationof methotrexate polyglutamates in red blood cells of children withjuvenile idiopathic arthritis. Biopharm Drug Dispos 2009;30:138-48.
12. Becker ML, van Haandel L, Gaedigk R, Lasky A, Hoeltzel M,Stobaugh J, et al. Analysis of intracellular methotrexate polyglutamates in patients with juvenile idiopathic arthritis: effectof route of administration on variability in intracellularmethotrexate polyglutamate concentrations. Arthritis Rheum2010;62:1803-12.
13. Becker ML, Gaedigk R, van Haandel L, Thomas B, Lasky A,Hoeltzel M, et al. The effect of genotype on methotrexate polyglutamate variability in juvenile idiopathic arthritis and association with drug response. Arthritis Rheum 2011;63:276-85.
14. den Boer E, Meesters RJ, Van Zelst BD, Luider TM, Hazes JM,Heil SG, et al. Measuring methotrexate polyglutamates in red bloodcells: a new LC-MS/MS-based method. Anal Bioanal Chem2013;405:1673-81.
15. Dervieux T, Orentas Lein D, Marcelletti J, Pischel K, Smith K,Walsh M, et al. HPLC determination of erythrocyte methotrexatepolyglutamates after low-dose methotrexate therapy in patients withrheumatoid arthritis. Clin Chem 2003;49:1632-41.
16. van Haandel L, Becker ML, Leeder JS, Williams TD, Stobaugh JF.A novel high-performance liquid chromatography/massspectrometry method for improved selective and sensitivemeasurement of methotrexate polyglutamation status in human redblood cells. Rapid Commun Mass Spectrom 2009;23:3693-702.
17. Dalrymple JM, Stamp LK, O’Donnell JL, Chapman PT, Zhang M,Barclay ML. Pharmacokinetics of oral methotrexate in patients withrheumatoid arthritis. Arthritis Rheum 2008;58:3299-308.
18. Stamp LK, O’Donnell JL, Chapman PT, Zhang M, Frampton C,James J, et al. Determinants of red blood cell methotrexate polyglutamate concentrations in rheumatoid arthritis patientsreceiving long-term methotrexate treatment. Arthritis Rheum2009;60:2248-56.
19. Dervieux T, Zablocki R, Kremer J. Red blood cell methotrexatepolyglutamates emerge as a function of dosage intensity and routeof administration during pulse methotrexate therapy in rheumatoid
arthritis. Rheumatology 2010;49:2337-45.20. Claessen SJ, Hazes JM, Huisman MA, van Zeben D, Luime JJ,
Weel AE. Use of risk stratification to target therapies in patientswith recent onset arthritis; design of a prospective randomizedmulticenter controlled trial. BMC Musculoskelet Disord2009;10:71.
21. Nederlandse Vereniging voor Reumatologie. Dutch RheumatologySociety. [Medicijnen methotrexate richtlijn 2009-update 2011].[Article in Dutch; Internet. Accessed July 23, 2014.] Availablefrom: www.nvr.nl/uploads/ki/tO/kitOmw9WmZQBHEq61H4YMQ/NVR-Medicijnen-MTX-richtlijn-2009-update-2011.pdf
22. Weigand M, Frei E, Graf N, Wiessler M. Comparative analysis ofmethotrexate polyglutamates in lymphoblast preparations frombone marrow and blood, and the contribution of residual red bloodcells. J Cancer Res Clin Oncol 2000;126:407-11.
23. International HapMap Project. [Internet. Accessed July 23, 2014.]Available from: http://hapmap.ncbi.nlm.nih.gov
24. National Center for Biotechnology Information. dbSNP shortgenetic variations. [Internet. Accessed July 23, 2014.] Availablefrom: http://www.ncbi.nlm.nih.gov
25. Ranganathan P, Culverhouse R, Marsh S, Mody A, Scott-Horton TJ,Brasington R, et al. Methotrexate (MTX) pathway gene polymorphisms and their effects on MTX toxicity in Caucasian andAfrican American patients with rheumatoid arthritis. J Rheumatol2008;35:572-9.
26. Ranganathan P. An update on methotrexate pharmacogenetics inrheumatoid arthritis. Pharmacogenomics 2008;9:439-51.
27. Gervasini G. Polymorphisms in methotrexate pathways: what isclinically relevant, what is not, and what is promising. Curr DrugMetab 2009;10:547-66.
28. Gradhand U, Tegude H, Burk O, Eichelbaum M, Fromm MF, KonigJ. Functional analysis of the polymorphism -211C>T in theregulatory region of the human ABCC3 gene. Life Sci2007;80:1490-4.
29. Ostergaard M, Ernst A, Labouriau R, Dagiliene E, Krarup HB,Christensen M, et al. Cyclooxygenase-2, multidrug resistance 1,and breast cancer resistance protein gene polymorphisms andinflammatory bowel disease in the Danish population. Scand JGastroenterol 2009;44:65-73.
30. Boyles AL, Wilcox AJ, Taylor JA, Shi M, Weinberg CR, Meyer K,et al. Oral facial clefts and gene polymorphisms in metabolism offolate/one-carbon and vitamin A: a pathway-wide association study.Genet Epidemiol 2009;33:247-55.
31. DeVos L, Chanson A, Liu Z, Ciappio ED, Parnell LD, Mason JB, etal. Associations between single nucleotide polymorphisms in folateuptake and metabolizing genes with blood folate, homocysteine,and DNA uracil concentrations. Am J Clin Nutr 2008;88:1149-58.
32. de Jonge R, Tissing WJ, Hooijberg JH, Jansen G, Kaspers GJ,Lindemans J, et al. Polymorphisms in folate-related genes and riskof pediatric acute lymphoblastic leukemia. Blood 2009;113:2284-9.
33. Ansari M, Sauty G, Labuda M, Gagne V, Laverdiere C, MoghrabiA, et al. Polymorphisms in multidrug resistance-associated proteingene 4 is associated with outcome in childhood acute lymphoblasticleukemia. Blood 2009;114:1383-6.
34. de Rotte MC, Bulatovic M, Heijstek MW, Jansen G, Heil SG, vanSchaik RH, et al. ABCB1 and ABCC3 gene polymorphisms areassociated with first-year response to methotrexate in juvenileidiopathic arthritis. J Rheumatol 2012;39:2032-40.
35. Bulatovic M, Heijstek MW, Van Dijkhuizen EH, Wulffraat NM,Pluijm SM, de Jonge R. Prediction of clinical non-response tomethotrexate treatment in juvenile idiopathic arthritis. Ann RheumDis 2012;71:1484-9.
36. Hornung N, Ellingsen T, Attermann J, Stengaard-Pedersen K,Poulsen JH. Patients with rheumatoid arthritis treated withmethotrexate (MTX): concentrations of steady-state erythrocyte
2177den Boer, et al: Determinants of MTX polyglutamates
Personal non-commercial use only. The Journal of Rheumatology Copyright © 2014. All rights reserved.
RheumatologyThe Journal of on June 14, 2020 - Published by www.jrheum.orgDownloaded from

MTX correlate to plasma concentrations and clinical efficacy. J Rheumatol 2008;35:1709-15.
37. den Boer E, Meesters RJ, van Zelst BD, Luider TM, Hazes JM,Heil SG, et al. Measuring methotrexate polyglutamates in red bloodcells: a new LC-MS/MS-based method. Anal Bioanal Chem2013;405:1673-81.
38. van Haandel L, Becker ML, Williams TD, Leeder JS, Stobaugh JF.Measurement of methotrexate polyglutamates in human erythrocytes by ion-pair UPLC-MS/MS. Bioanalysis 2011;3:2783-96.
39. Bulatovic Calasan M, den Boer E, de Rotte MC, Vastert SJ,Kamphuis S, de Jonge R, et al. Methotrexate polyglutamates inerythrocytes are associated with lower disease activity in juvenileidiopathic arthritis patients. Ann Rheum Dis 2013 (E-pub ahead ofprint).
40. de Rotte MC, den Boer E, de Jong PH, Pluijm SM, BulatovicCalasan M, Weel AE, et al. Methotrexate polyglutamates inerythrocytes are associated with lower disease activity in patientswith rheumatoid arthritis. Ann Rheum Dis 2013 (E-pub ahead ofprint).
41. Stamp LK, Barclay ML, O’Donnell JL, Zhang M, Drake J,Frampton C, et al. Effects of changing from oral to subcutaneousmethotrexate on red blood cell methotrexate polyglutamate concentrations and disease activity in patients with rheumatoidarthritis. J Rheumatol 2011;38:2540-7.
42. Ortiz Z, Shea B, Suarez Almazor M, Moher D, Wells G, Tugwell P.Folic acid and folinic acid for reducing side effects in patientsreceiving methotrexate for rheumatoid arthritis. Cochrane DatabaseSyst Rev 2000:CD000951.
43. Khanna D, Park GS, Paulus HE, Simpson KM, Elashoff D, CohenSB, et al. Reduction of the efficacy of methotrexate by the use offolic acid: post hoc analysis from two randomized controlledstudies. Arthritis Rheum 2005;52:3030-8.
44. de Rotte MC, de Jong PH, Pluijm SM, Calasan MB, Barendregt PJ,van Zeben D, et al. Association of low baseline levels oferythrocyte folate with treatment nonresponse at three months inrheumatoid arthritis patients receiving methotrexate. ArthritisRheum 2013;65:2803-13.
45. Owen SA, Hider SL, Martin P, Bruce IN, Barton A, Thomson W.Genetic polymorphisms in key methotrexate pathway genes areassociated with response to treatment in rheumatoid arthritispatients. Pharmacogenomics J 2013;13:227-34.
46. French D, Yang W, Cheng C, Raimondi SC, Mullighan CG,Downing JR, et al. Acquired variation outweighs inherited variationin whole genome analysis of methotrexate polyglutamate accumulation in leukemia. Blood 2009;113:4512-20.
47. Stark M, Wichman C, Avivi I, Assaraf YG. Aberrant splicing offolylpolyglutamate synthetase as a novel mechanism of antifolateresistance in leukemia. Blood 2009;113:4362-9.
2178 The Journal of Rheumatology 2014; 41:11; doi:10.3899/jrheum.131290
Personal non-commercial use only. The Journal of Rheumatology Copyright © 2014. All rights reserved.
RheumatologyThe Journal of on June 14, 2020 - Published by www.jrheum.orgDownloaded from