the lotos group
TRANSCRIPT
THE LOTOS GROUP MANAGEMENT’S DISCUSSION AND ANALYSIS OF THE FINANCIAL PERFORMANCE IN Q4 2010
(This is a translation of a document originally issued in Polish)
Contents
1 Market Environment ................................................................................................. 2
2 Upstream Segment ................................................................................................... 3
3 Downstream Segment .............................................................................................. 4
4 Other Business ......................................................................................................... 8
5 Impact of the LIFO Inventory Valuation .................................................................. 8
6 Statement of Comprehensive Income ..................................................................... 9
7 Consolidated Statement of Financial Position ..................................................... 10
8 Consolidated Statement of Cash Flows ................................................................ 11
(This is a translation of a document originally issued in Polish)
2 / 12
1 Market Environment
In Q4 2010, the average price of Brent oil (Dated Brent FOB) was 86.47 USD/bbl, more than in Q3 2010 (by 9.61 USD/bbl, or 12.5%) and in Q4 2009 (by 11.94 USD/bbl, or 16.0%).
The average price of Urals CIF Rotterdam was 85.16 USD/bbl, that is higher than in Q3 2010 (by 9.58 USD/bbl, or 12.7%) or in Q4 2009 (by 10.95 USD/bbl, or 14.8%).
Concurrently, the Brent/Urals differential slightly increased, by 0.03 USD/bbl relative to Q3 2010 and by 0.99 USD/bbl compared with Q4 2009.
In the reporting period, the average refining margin was 3.19 USD/bbl, and was higher than in Q3 2010 (by 27.6%) or in Q4 2009 (by 243.0%).
In Q4 2010, the average quarterly market margins on fuels increased relative to those recorded in the previous reporting period (Q3 2010) or in the corresponding period of 2009. At the same time, the margins on heavy fuel oil declined significantly, both relative to Q3 2010 and relative to Q4 2009.
In Q4 2010, the average USD/PLN exchange rate stood at 2.92, meaning an appreciation of the Polish zloty against the US dollar relative to Q3 2010 (by 5.8%) and its depreciation against the US dollar relative to Q4 2009 (by 3.5%). At the end of December 2010, the USD/PLN exchange rate was 2.96. In Q4 2010, the average EUR/PLN exchange rate was 3.97, which means that the Polish currency strengthened against the euro by 1.0% on Q3 2010 and by 4.8% on Q4 2009. At the end of December 2010, the EUR/PLN exchange rate was 3.96.
Table 1: Macroeconomic conditions
Q4 2010 Q3 2010 Q4 2009 Q4 2010
vs. Q3 2010
Q4 2010 vs.
Q4 2009
DATED Brent FOB prices USD/bbl 86.47 76.86 74.53 12.5% 16.0%
Urals CIF Rotterdam prices USD/bbl 85.16 75.58 74.21 12.7% 14.8%
Brent/Urals differential USD/bbl 1.31 1.28 0.32 2.3% 309.4%
Refining margin USD/bbl 3.19 2.50 0.93 27.6% 243.0%
Crack margin: Gasoline USD/t 132.73 119.58 119.00 11.0% 11.5%
Crack margin: Diesel oil (10 ppm)
USD/t 106.82 91.23 64.69 17.1% 65.1%
Crack margin: Light fuel oil USD/t 77.33 70.78 49.71 9.3% 55.6%
Crack margin: Aviation fuel USD/t 131.23 115.92 99.21 13.2% 32.3%
Crack margin: Heavy fuel oil USD/t -190.34 -158.24 -133.21 -20.3% -42.9%
Average quarterly PLN/USD exchange rate
PLN/USD 2.92 3.10 2.82 -5.8% 3.5%
Average quarterly PLN/EUR exchange rate
PLN/EUR 3.97 4.01 4.17 -1.0% -4.8%
Brent prices up by 12.5% on Q3 2010 and by 16% on Q4 2009 Brent/Urals differential up by 0.99 USD/bbl on Q4 2009 Refining margin higher by 2.26 USD/bbl on Q4 2009 PLN stronger against the USD
relative to Q3 2010
(This is a translation of a document originally issued in Polish)
3 / 12
2 Upstream Segment
In Q4 2010, the key operating activities of LOTOS Petrobaltic S.A. included:
oil and gas production from the B3 field,
modernisation of the B3-6 subsea wellhead at the B3 field using the Petrobaltic drilling platform,
further analytical and design work in preparation for development of the B3 field.
In Q4 2010, LOTOS Exploration & Production Norge AS conducted exploration work under the licences it holds, both as the operator (licences PL498, PL503 and PL556) and as an interest holder (licences PL455, PL497 and PL515).
Having performed relevant work, the company submitted applications for the APA 2010 license round and the 21st license round. APA 2010 awards were announced at the beginning of 2011. LOTOS E&P Norge was granted the PL 503B licence (an extension of the PL 503 licence already held by the company). The 21st licence round awards will be announced in Q2 2011.
In Q4 2010, an agreement was signed with Bergen Oilfield Services AS to perform 3D seismic surveys for the PL503 licence, over a sea area of 1.5 thousand sq km (planned for summer 2011).
Under the PL 316/316B production licence, development work continued as part of the YME production project. The company completed the drilling campaign (six boreholes were drilled in the Gamma structure and three in the Beta structure). Work was conducted at the production platform, which arrived at the Rosenberg shipyard in Norway on September 16th 2010. Three legs were installed, the leg lowering system and the platform stability were tested. Work at the platform currently continues in the Rosenberg shipyard until the weather conditions improve sufficiently to allow the platform to be towed and installed on the Yme field.
According to Talisman, the Yme field operator, production from the field is expected to start in mid 2011.
The upstream segment's revenue in Q4 2010 amounted to PLN 48.5m, that is PLN 34.3m (or 41.4%) less than in the corresponding period of the previous year. The segment's lower revenue and poorer performance in Q4 2010 compared with Q4 2009 and Q3 2010 were mainly attributable to lower volumes of Rozewie crude sold, as well as to PLN 48.3m of impairment losses on tangible assets under construction recognised under other operating expenses in Q4 2010. The impairment losses were recognised in connection with the lengthening period of time between when expenditure connected with the B4 and B6 fields was incurred and the potential future development of those fields. There have been no changes regarding reserves in the B4 and B6 fields or the potential for their future development.
PL 503B licence granted to LOTOS E&P Norge PLN 48.3m of impairment losses recognized on expenditure on B4
and B6 fields
(This is a translation of a document originally issued in Polish)
4 / 12
Table 2: Operating results of the upstream segment
Q4 2010 Q3 2010 Q4 2009 Q4 2010 vs.
Q3 2010 Q4 2010 vs.
Q4 2009
Sales of Rozewie crude 000’ t 26.1 28.6 56.5 -8.7% -53.8%
Sales of natural gas mcm 2.3 2.4 3.4 -7.3% -33.7%
Sales revenue PLNm 48.5 51.4 82.8 -5.6% -41.4%
Operating profit/(loss) PLNm -55.1 6.1 -5.6 - -
Depreciation and amortisation
PLNm 14.3 14.8 17.9 -3.4% -20.1%
EBITDA PLNm -40.8 20.9 12.3 - -
In Q4 2010, crude oil output in the Baltic Sea (the B3 field) was 34.1 thousand tonnes, and was lower than the production volumes recorded in Q4 2009 and in Q3 2010 respectively by 25.2% and 9.1%. Production from the B8 field was conducted only Q1 2010. Crude sales to Grupa LOTOS S.A. in Q4 2010 amounted to 26.1 thousand tonnes, which was 30.4 thousand tonnes less than in Q4 2009 and 2.5 thousand tonnes less than in Q3 2010. In the reported period, gas production was 3.7 mcm , which represented a year-on year decrease of 45.6%.
Table 3: Operating data of the upstream segment
Q4 2010 Q3 2010 Q4 2009 Q4 2010
vs. Q3 2010
Q4 2010 vs.
Q4 2009
Crude oil output 000’ t 34.1 37.5 60.9 -9.1% -44.0%
from B3 field 000’ t 34.1 37.5 45.6 -9.1% -25.2%
from B8 field 000’ t 0.0 0.0 15.3 - -
Natural gas output mcm 3.7 4.1 6.8 -9.8% -45.6%
3 Downstream Segment
In Q4 2010, Grupa LOTOS S.A. processed 2,223.9 thousand tonnes of crude oil, up by 42,7% year on year. The increase in the volume of processed crude oil in the reporting period was due to the processing of crude oil in the CDU/VDU unit as part of the 10+ Programme. In connection with the optimisation of crude processing and the new CDU/VDU unit coming on stream, the share of crude types other than Urals in the total volume processed rose in Q4 2010 relative to the same period of 2009 (to over 17.5%).
Table 4: Structure of crude oil refining
Q4 2010 Q3 2010 Q4 2009 Q4 2010 /Q3 2010
Q4 2010 /Q4 2009
Volume of crude processed by the Gdańsk refinery
000’ t 2,223.9 2,196.2 1,558.4 1.3% 42.7%
including:
Urals crude 000’ t 1,833.4 1,731.1 1,305.6 5.9% 40.4%
Rozewie crude 000’ t 49.0 41.8 122.1 17.1% -59.9%
Other types of crude 000’ t 341.5 423.3 130.7 -19.3% 161.3%
Crude oil production in Q4 2010 of 34.1 thousand tonnes Crude volume processed up by 42.7% on Q4 2009 and larger diversification of
crude grades
(This is a translation of a document originally issued in Polish)
5 / 12
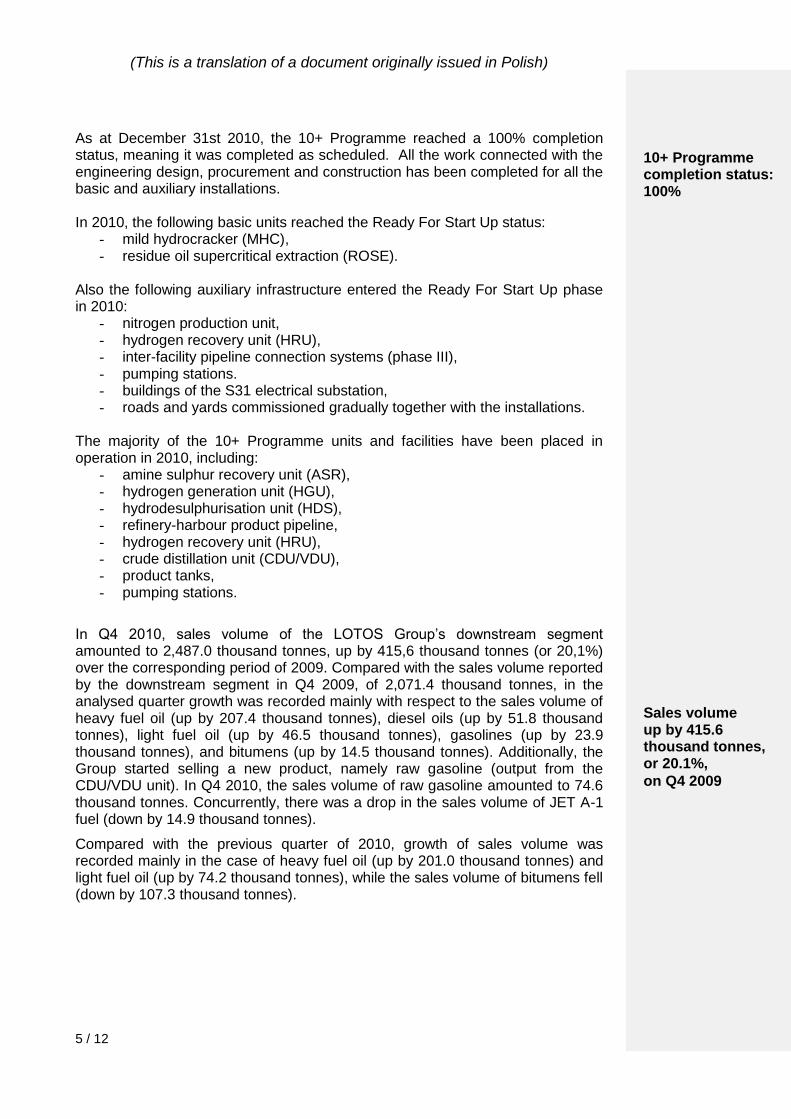
As at December 31st 2010, the 10+ Programme reached a 100% completion status, meaning it was completed as scheduled. All the work connected with the engineering design, procurement and construction has been completed for all the basic and auxiliary installations. In 2010, the following basic units reached the Ready For Start Up status:
- mild hydrocracker (MHC), - residue oil supercritical extraction (ROSE).
Also the following auxiliary infrastructure entered the Ready For Start Up phase in 2010:
- nitrogen production unit, - hydrogen recovery unit (HRU), - inter-facility pipeline connection systems (phase III), - pumping stations. - buildings of the S31 electrical substation, - roads and yards commissioned gradually together with the installations.
The majority of the 10+ Programme units and facilities have been placed in operation in 2010, including:
- amine sulphur recovery unit (ASR), - hydrogen generation unit (HGU), - hydrodesulphurisation unit (HDS), - refinery-harbour product pipeline, - hydrogen recovery unit (HRU), - crude distillation unit (CDU/VDU), - product tanks, - pumping stations.
In Q4 2010, sales volume of the LOTOS Group’s downstream segment amounted to 2,487.0 thousand tonnes, up by 415,6 thousand tonnes (or 20,1%) over the corresponding period of 2009. Compared with the sales volume reported by the downstream segment in Q4 2009, of 2,071.4 thousand tonnes, in the analysed quarter growth was recorded mainly with respect to the sales volume of heavy fuel oil (up by 207.4 thousand tonnes), diesel oils (up by 51.8 thousand tonnes), light fuel oil (up by 46.5 thousand tonnes), gasolines (up by 23.9 thousand tonnes), and bitumens (up by 14.5 thousand tonnes). Additionally, the Group started selling a new product, namely raw gasoline (output from the CDU/VDU unit). In Q4 2010, the sales volume of raw gasoline amounted to 74.6 thousand tonnes. Concurrently, there was a drop in the sales volume of JET A-1 fuel (down by 14.9 thousand tonnes).
Compared with the previous quarter of 2010, growth of sales volume was recorded mainly in the case of heavy fuel oil (up by 201.0 thousand tonnes) and light fuel oil (up by 74.2 thousand tonnes), while the sales volume of bitumens fell (down by 107.3 thousand tonnes).
10+ Programme completion status: 100% Sales volume up by 415.6 thousand tonnes, or 20.1%,
on Q4 2009
(This is a translation of a document originally issued in Polish)
6 / 12
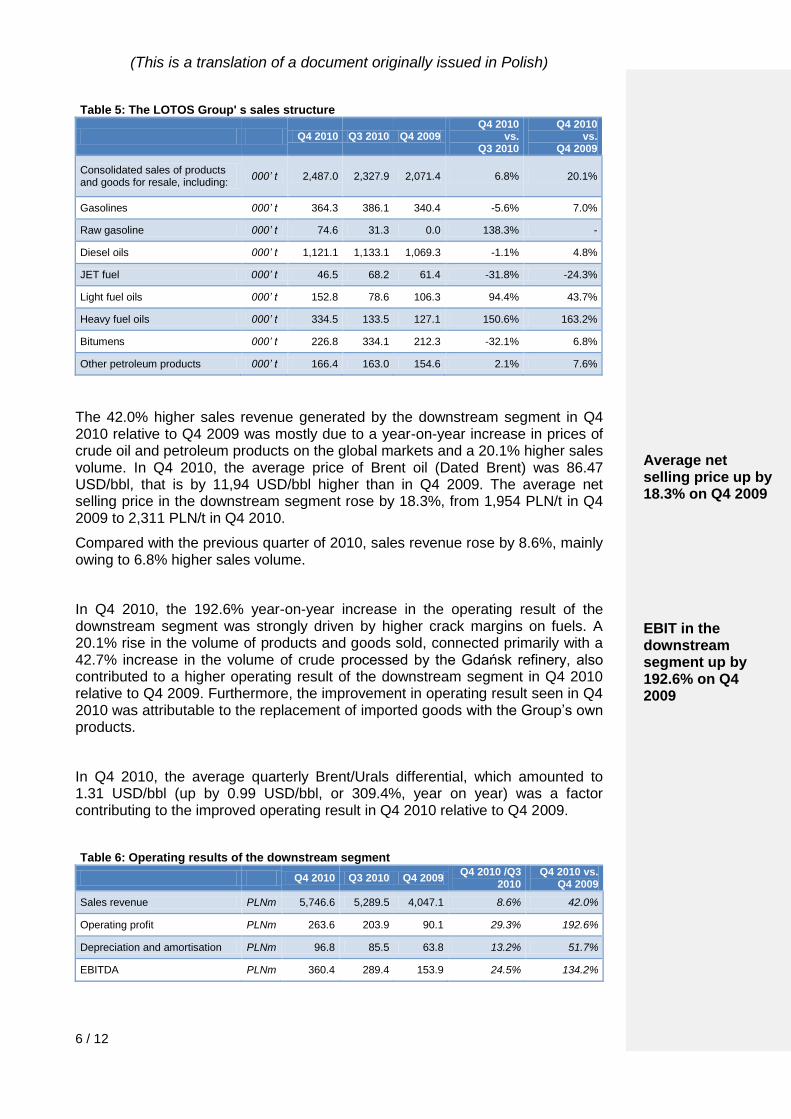
Table 5: The LOTOS Group' s sales structure
Q4 2010 Q3 2010 Q4 2009 Q4 2010
vs. Q3 2010
Q4 2010 vs.
Q4 2009
Consolidated sales of products and goods for resale, including:
000’ t 2,487.0 2,327.9 2,071.4 6.8% 20.1%
Gasolines 000’ t 364.3 386.1 340.4 -5.6% 7.0%
Raw gasoline 000’ t 74.6 31.3 0.0 138.3% -
Diesel oils 000’ t 1,121.1 1,133.1 1,069.3 -1.1% 4.8%
JET fuel 000’ t 46.5 68.2 61.4 -31.8% -24.3%
Light fuel oils 000’ t 152.8 78.6 106.3 94.4% 43.7%
Heavy fuel oils 000’ t 334.5 133.5 127.1 150.6% 163.2%
Bitumens 000’ t 226.8 334.1 212.3 -32.1% 6.8%
Other petroleum products 000’ t 166.4 163.0 154.6 2.1% 7.6%
The 42.0% higher sales revenue generated by the downstream segment in Q4 2010 relative to Q4 2009 was mostly due to a year-on-year increase in prices of crude oil and petroleum products on the global markets and a 20.1% higher sales volume. In Q4 2010, the average price of Brent oil (Dated Brent) was 86.47 USD/bbl, that is by 11,94 USD/bbl higher than in Q4 2009. The average net selling price in the downstream segment rose by 18.3%, from 1,954 PLN/t in Q4 2009 to 2,311 PLN/t in Q4 2010.
Compared with the previous quarter of 2010, sales revenue rose by 8.6%, mainly owing to 6.8% higher sales volume.
In Q4 2010, the 192.6% year-on-year increase in the operating result of the downstream segment was strongly driven by higher crack margins on fuels. A 20.1% rise in the volume of products and goods sold, connected primarily with a 42.7% increase in the volume of crude processed by the Gdańsk refinery, also contributed to a higher operating result of the downstream segment in Q4 2010 relative to Q4 2009. Furthermore, the improvement in operating result seen in Q4 2010 was attributable to the replacement of imported goods with the Group’s own products.
In Q4 2010, the average quarterly Brent/Urals differential, which amounted to 1.31 USD/bbl (up by 0.99 USD/bbl, or 309.4%, year on year) was a factor contributing to the improved operating result in Q4 2010 relative to Q4 2009.
Table 6: Operating results of the downstream segment
Q4 2010 Q3 2010 Q4 2009 Q4 2010 /Q3
2010 Q4 2010 vs.
Q4 2009
Sales revenue PLNm 5,746.6 5,289.5 4,047.1 8.6% 42.0%
Operating profit PLNm 263.6 203.9 90.1 29.3% 192.6%
Depreciation and amortisation PLNm 96.8 85.5 63.8 13.2% 51.7%
EBITDA PLNm 360.4 289.4 153.9 24.5% 134.2%
Average net selling price up by 18.3% on Q4 2009 EBIT in the downstream segment up by 192.6% on Q4 2009
(This is a translation of a document originally issued in Polish)
7 / 12
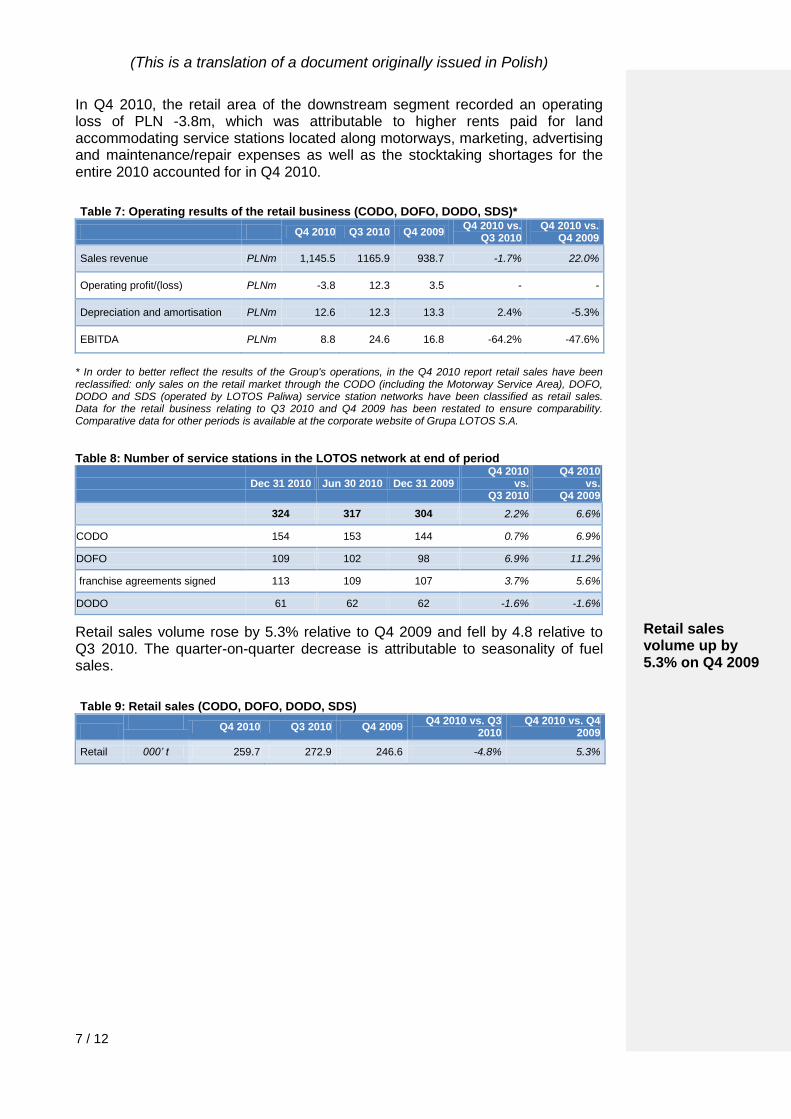
In Q4 2010, the retail area of the downstream segment recorded an operating loss of PLN -3.8m, which was attributable to higher rents paid for land accommodating service stations located along motorways, marketing, advertising and maintenance/repair expenses as well as the stocktaking shortages for the entire 2010 accounted for in Q4 2010.
Table 7: Operating results of the retail business (CODO, DOFO, DODO, SDS)*
Q4 2010 Q3 2010 Q4 2009 Q4 2010 vs.
Q3 2010 Q4 2010 vs.
Q4 2009
Sales revenue PLNm 1,145.5 1165.9 938.7 -1.7% 22.0%
Operating profit/(loss) PLNm -3.8 12.3 3.5 - -
Depreciation and amortisation PLNm 12.6 12.3 13.3 2.4% -5.3%
EBITDA PLNm 8.8 24.6 16.8 -64.2% -47.6%
* In order to better reflect the results of the Group's operations, in the Q4 2010 report retail sales have been reclassified: only sales on the retail market through the CODO (including the Motorway Service Area), DOFO, DODO and SDS (operated by LOTOS Paliwa) service station networks have been classified as retail sales. Data for the retail business relating to Q3 2010 and Q4 2009 has been restated to ensure comparability. Comparative data for other periods is available at the corporate website of Grupa LOTOS S.A.
Table 8: Number of service stations in the LOTOS network at end of period
Dec 31 2010 Jun 30 2010 Dec 31 2009 Q4 2010
vs. Q3 2010
Q4 2010 vs.
Q4 2009
324 317 304 2.2% 6.6%
CODO 154 153 144 0.7% 6.9%
DOFO 109 102 98 6.9% 11.2%
franchise agreements signed 113 109 107 3.7% 5.6%
DODO 61 62 62 -1.6% -1.6%
Retail sales volume rose by 5.3% relative to Q4 2009 and fell by 4.8 relative to Q3 2010. The quarter-on-quarter decrease is attributable to seasonality of fuel sales.
Table 9: Retail sales (CODO, DOFO, DODO, SDS)
Q4 2010 Q3 2010 Q4 2009
Q4 2010 vs. Q3 2010
Q4 2010 vs. Q4 2009
Retail 000’ t 259.7 272.9 246.6 -4.8% 5.3%
Retail sales volume up by 5.3% on Q4 2009
(This is a translation of a document originally issued in Polish)
8 / 12
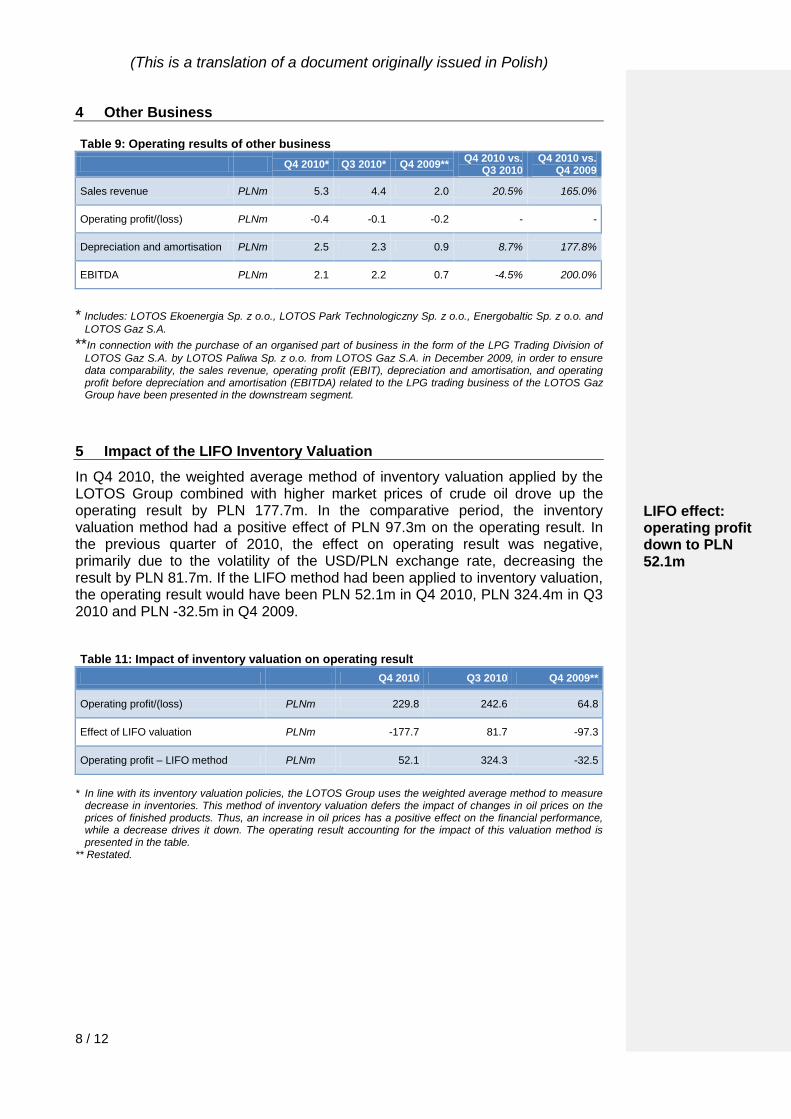
4 Other Business
Table 9: Operating results of other business
Q4 2010* Q3 2010* Q4 2009** Q4 2010 vs.
Q3 2010 Q4 2010 vs.
Q4 2009
Sales revenue PLNm 5.3 4.4 2.0 20.5% 165.0%
Operating profit/(loss) PLNm -0.4 -0.1 -0.2 - -
Depreciation and amortisation PLNm 2.5 2.3 0.9 8.7% 177.8%
EBITDA PLNm 2.1 2.2 0.7 -4.5% 200.0%
* Includes: LOTOS Ekoenergia Sp. z o.o., LOTOS Park Technologiczny Sp. z o.o., Energobaltic Sp. z o.o. and
LOTOS Gaz S.A.
**In connection with the purchase of an organised part of business in the form of the LPG Trading Division of
LOTOS Gaz S.A. by LOTOS Paliwa Sp. z o.o. from LOTOS Gaz S.A. in December 2009, in order to ensure data comparability, the sales revenue, operating profit (EBIT), depreciation and amortisation, and operating profit before depreciation and amortisation (EBITDA) related to the LPG trading business of the LOTOS Gaz Group have been presented in the downstream segment.
5 Impact of the LIFO Inventory Valuation
In Q4 2010, the weighted average method of inventory valuation applied by the LOTOS Group combined with higher market prices of crude oil drove up the operating result by PLN 177.7m. In the comparative period, the inventory valuation method had a positive effect of PLN 97.3m on the operating result. In the previous quarter of 2010, the effect on operating result was negative, primarily due to the volatility of the USD/PLN exchange rate, decreasing the result by PLN 81.7m. If the LIFO method had been applied to inventory valuation, the operating result would have been PLN 52.1m in Q4 2010, PLN 324.4m in Q3 2010 and PLN -32.5m in Q4 2009.
Table 11: Impact of inventory valuation on operating result
Q4 2010 Q3 2010 Q4 2009**
Operating profit/(loss) PLNm 229.8 242.6 64.8
Effect of LIFO valuation PLNm -177.7 81.7 -97.3
Operating profit – LIFO method PLNm 52.1 324.3 -32.5
* In line with its inventory valuation policies, the LOTOS Group uses the weighted average method to measure
decrease in inventories. This method of inventory valuation defers the impact of changes in oil prices on the prices of finished products. Thus, an increase in oil prices has a positive effect on the financial performance, while a decrease drives it down. The operating result accounting for the impact of this valuation method is presented in the table.
** Restated.
LIFO effect: operating profit down to PLN 52.1m
(This is a translation of a document originally issued in Polish)
9 / 12
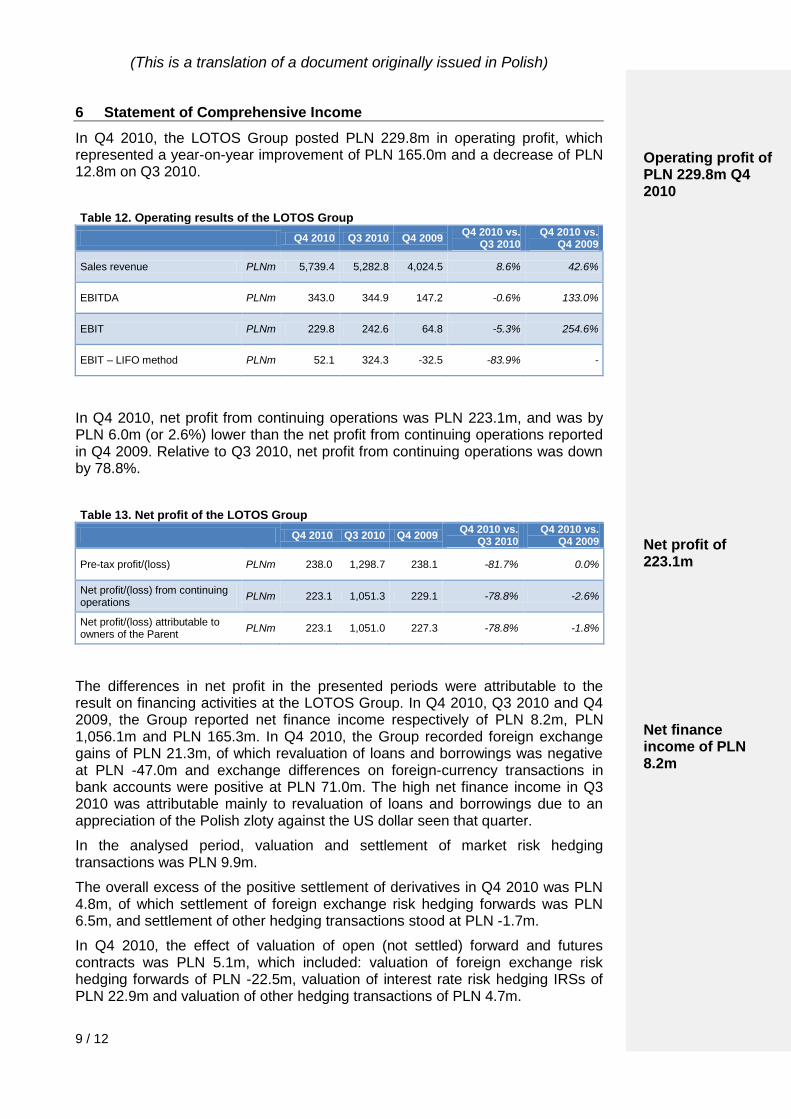
6 Statement of Comprehensive Income
In Q4 2010, the LOTOS Group posted PLN 229.8m in operating profit, which represented a year-on-year improvement of PLN 165.0m and a decrease of PLN 12.8m on Q3 2010.
Table 12. Operating results of the LOTOS Group
Q4 2010 Q3 2010 Q4 2009 Q4 2010 vs.
Q3 2010 Q4 2010 vs.
Q4 2009
Sales revenue PLNm 5,739.4 5,282.8 4,024.5 8.6% 42.6%
EBITDA PLNm 343.0 344.9 147.2 -0.6% 133.0%
EBIT PLNm 229.8 242.6 64.8 -5.3% 254.6%
EBIT – LIFO method PLNm 52.1 324.3 -32.5 -83.9% -
In Q4 2010, net profit from continuing operations was PLN 223.1m, and was by PLN 6.0m (or 2.6%) lower than the net profit from continuing operations reported in Q4 2009. Relative to Q3 2010, net profit from continuing operations was down by 78.8%.
Table 13. Net profit of the LOTOS Group
Q4 2010 Q3 2010 Q4 2009 Q4 2010 vs.
Q3 2010 Q4 2010 vs.
Q4 2009
Pre-tax profit/(loss) PLNm 238.0 1,298.7 238.1 -81.7% 0.0%
Net profit/(loss) from continuing operations
PLNm 223.1 1,051.3 229.1 -78.8% -2.6%
Net profit/(loss) attributable to owners of the Parent
PLNm 223.1 1,051.0 227.3 -78.8% -1.8%
The differences in net profit in the presented periods were attributable to the result on financing activities at the LOTOS Group. In Q4 2010, Q3 2010 and Q4 2009, the Group reported net finance income respectively of PLN 8.2m, PLN 1,056.1m and PLN 165.3m. In Q4 2010, the Group recorded foreign exchange gains of PLN 21.3m, of which revaluation of loans and borrowings was negative at PLN -47.0m and exchange differences on foreign-currency transactions in bank accounts were positive at PLN 71.0m. The high net finance income in Q3 2010 was attributable mainly to revaluation of loans and borrowings due to an appreciation of the Polish zloty against the US dollar seen that quarter.
In the analysed period, valuation and settlement of market risk hedging transactions was PLN 9.9m.
The overall excess of the positive settlement of derivatives in Q4 2010 was PLN 4.8m, of which settlement of foreign exchange risk hedging forwards was PLN 6.5m, and settlement of other hedging transactions stood at PLN -1.7m.
In Q4 2010, the effect of valuation of open (not settled) forward and futures contracts was PLN 5.1m, which included: valuation of foreign exchange risk hedging forwards of PLN -22.5m, valuation of interest rate risk hedging IRSs of PLN 22.9m and valuation of other hedging transactions of PLN 4.7m.
Operating profit of PLN 229.8m Q4 2010 Net profit of 223.1m Net finance income of PLN 8.2m
(This is a translation of a document originally issued in Polish)
10 / 12
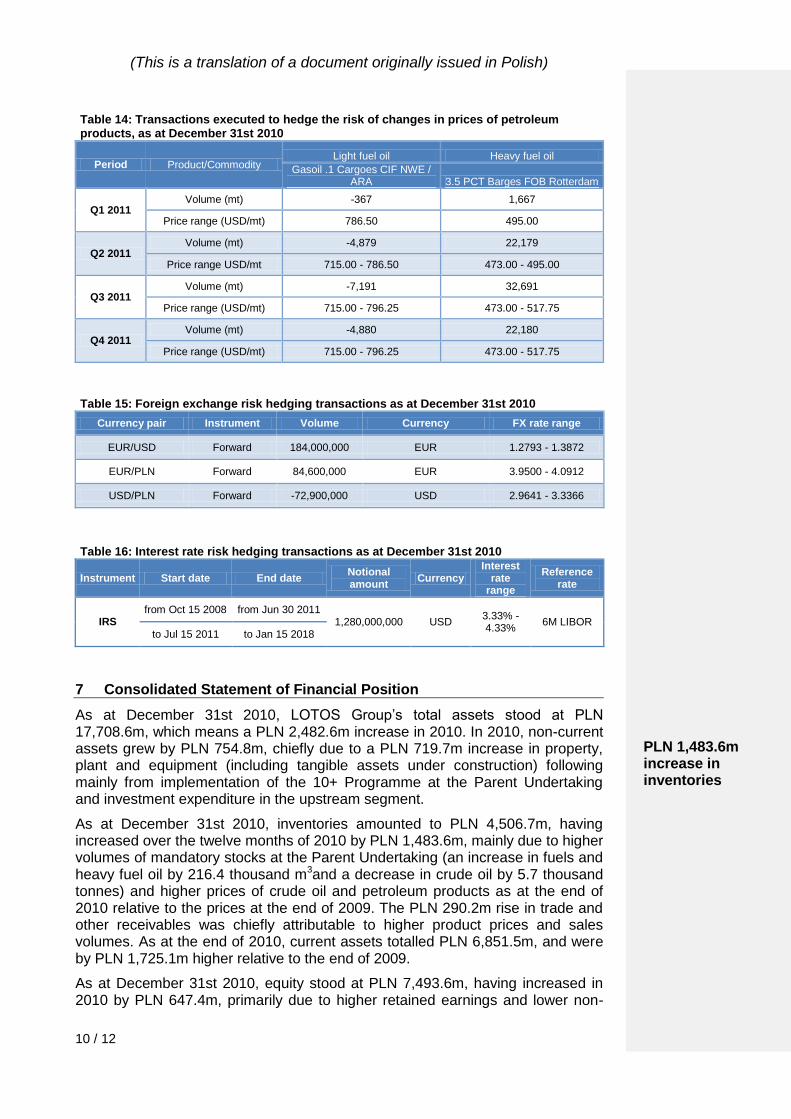
Table 14: Transactions executed to hedge the risk of changes in prices of petroleum products, as at December 31st 2010
Period Product/Commodity Light fuel oil Heavy fuel oil
Gasoil .1 Cargoes CIF NWE / ARA 3.5 PCT Barges FOB Rotterdam
Q1 2011 Volume (mt) -367 1,667
Price range (USD/mt) 786.50 495.00
Q2 2011 Volume (mt) -4,879 22,179
Price range USD/mt 715.00 - 786.50 473.00 - 495.00
Q3 2011 Volume (mt) -7,191 32,691
Price range (USD/mt) 715.00 - 796.25 473.00 - 517.75
Q4 2011 Volume (mt) -4,880 22,180
Price range (USD/mt) 715.00 - 796.25 473.00 - 517.75
Table 15: Foreign exchange risk hedging transactions as at December 31st 2010
Currency pair Instrument Volume Currency FX rate range
EUR/USD Forward 184,000,000 EUR 1.2793 - 1.3872
EUR/PLN Forward 84,600,000 EUR 3.9500 - 4.0912
USD/PLN Forward -72,900,000 USD 2.9641 - 3.3366
Table 16: Interest rate risk hedging transactions as at December 31st 2010
Instrument Start date End date Notional amount
Currency Interest
rate range
Reference rate
IRS from Oct 15 2008 from Jun 30 2011
1,280,000,000 USD 3.33% - 4.33%
6M LIBOR to Jul 15 2011 to Jan 15 2018
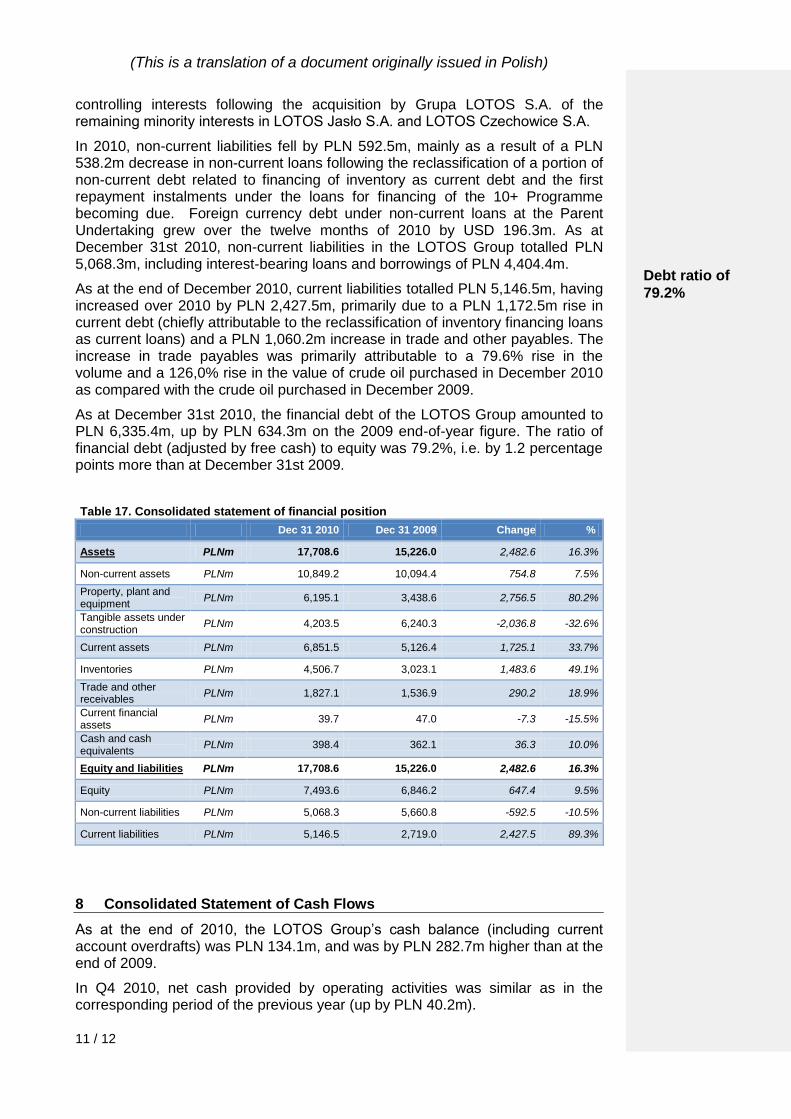
7 Consolidated Statement of Financial Position
As at December 31st 2010, LOTOS Group’s total assets stood at PLN 17,708.6m, which means a PLN 2,482.6m increase in 2010. In 2010, non-current assets grew by PLN 754.8m, chiefly due to a PLN 719.7m increase in property, plant and equipment (including tangible assets under construction) following mainly from implementation of the 10+ Programme at the Parent Undertaking and investment expenditure in the upstream segment.
As at December 31st 2010, inventories amounted to PLN 4,506.7m, having increased over the twelve months of 2010 by PLN 1,483.6m, mainly due to higher volumes of mandatory stocks at the Parent Undertaking (an increase in fuels and heavy fuel oil by 216.4 thousand m3and a decrease in crude oil by 5.7 thousand tonnes) and higher prices of crude oil and petroleum products as at the end of 2010 relative to the prices at the end of 2009. The PLN 290.2m rise in trade and other receivables was chiefly attributable to higher product prices and sales volumes. As at the end of 2010, current assets totalled PLN 6,851.5m, and were by PLN 1,725.1m higher relative to the end of 2009.
As at December 31st 2010, equity stood at PLN 7,493.6m, having increased in 2010 by PLN 647.4m, primarily due to higher retained earnings and lower non-
PLN 1,483.6m increase in inventories
(This is a translation of a document originally issued in Polish)
11 / 12
controlling interests following the acquisition by Grupa LOTOS S.A. of the remaining minority interests in LOTOS Jasło S.A. and LOTOS Czechowice S.A.
In 2010, non-current liabilities fell by PLN 592.5m, mainly as a result of a PLN 538.2m decrease in non-current loans following the reclassification of a portion of non-current debt related to financing of inventory as current debt and the first repayment instalments under the loans for financing of the 10+ Programme becoming due. Foreign currency debt under non-current loans at the Parent Undertaking grew over the twelve months of 2010 by USD 196.3m. As at December 31st 2010, non-current liabilities in the LOTOS Group totalled PLN 5,068.3m, including interest-bearing loans and borrowings of PLN 4,404.4m.
As at the end of December 2010, current liabilities totalled PLN 5,146.5m, having increased over 2010 by PLN 2,427.5m, primarily due to a PLN 1,172.5m rise in current debt (chiefly attributable to the reclassification of inventory financing loans as current loans) and a PLN 1,060.2m increase in trade and other payables. The increase in trade payables was primarily attributable to a 79.6% rise in the volume and a 126,0% rise in the value of crude oil purchased in December 2010 as compared with the crude oil purchased in December 2009.
As at December 31st 2010, the financial debt of the LOTOS Group amounted to PLN 6,335.4m, up by PLN 634.3m on the 2009 end-of-year figure. The ratio of financial debt (adjusted by free cash) to equity was 79.2%, i.e. by 1.2 percentage points more than at December 31st 2009.
Table 17. Consolidated statement of financial position
Dec 31 2010 Dec 31 2009 Change %
Assets PLNm 17,708.6 15,226.0 2,482.6 16.3%
Non-current assets PLNm 10,849.2 10,094.4 754.8 7.5%
Property, plant and equipment
PLNm 6,195.1 3,438.6 2,756.5 80.2%
Tangible assets under construction
PLNm 4,203.5 6,240.3 -2,036.8 -32.6%
Current assets PLNm 6,851.5 5,126.4 1,725.1 33.7%
Inventories PLNm 4,506.7 3,023.1 1,483.6 49.1%
Trade and other receivables
PLNm 1,827.1 1,536.9 290.2 18.9%
Current financial assets
PLNm 39.7 47.0 -7.3 -15.5%
Cash and cash equivalents
PLNm 398.4 362.1 36.3 10.0%
Equity and liabilities PLNm 17,708.6 15,226.0 2,482.6 16.3%
Equity PLNm 7,493.6 6,846.2 647.4 9.5%
Non-current liabilities PLNm 5,068.3 5,660.8 -592.5 -10.5%
Current liabilities PLNm 5,146.5 2,719.0 2,427.5 89.3%
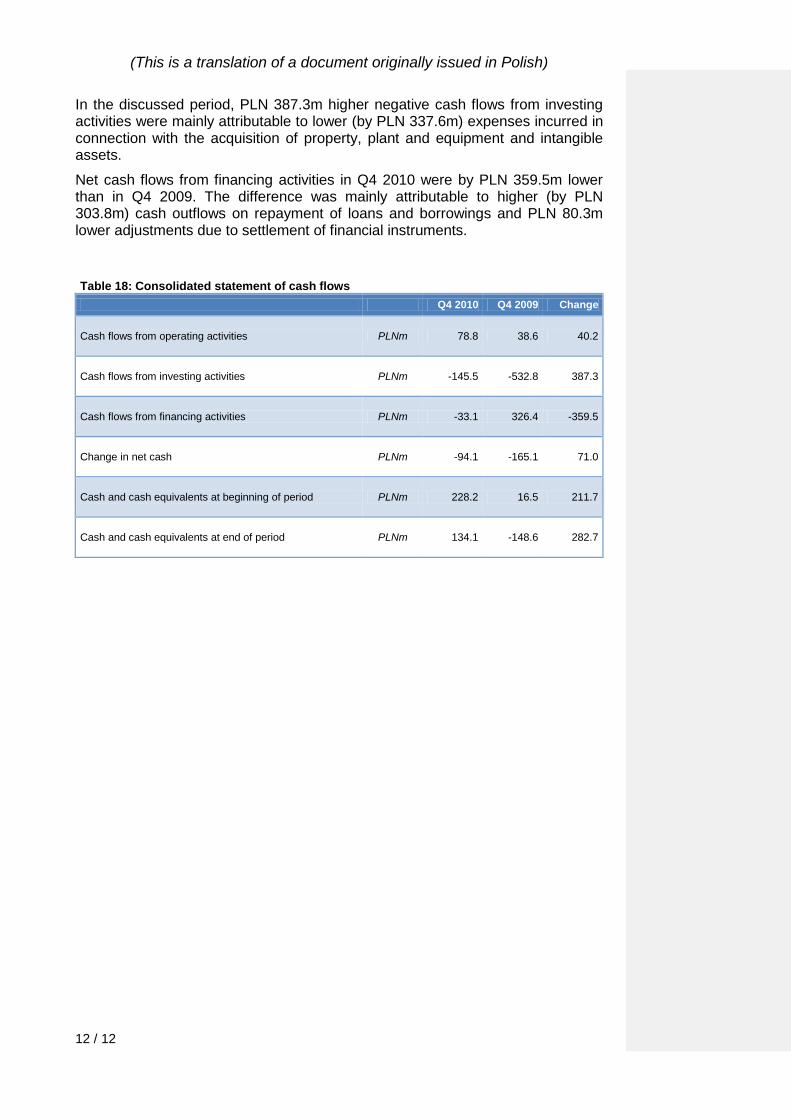
8 Consolidated Statement of Cash Flows
As at the end of 2010, the LOTOS Group’s cash balance (including current account overdrafts) was PLN 134.1m, and was by PLN 282.7m higher than at the end of 2009.
In Q4 2010, net cash provided by operating activities was similar as in the corresponding period of the previous year (up by PLN 40.2m).
Debt ratio of
79.2%
(This is a translation of a document originally issued in Polish)
12 / 12
In the discussed period, PLN 387.3m higher negative cash flows from investing activities were mainly attributable to lower (by PLN 337.6m) expenses incurred in connection with the acquisition of property, plant and equipment and intangible assets.
Net cash flows from financing activities in Q4 2010 were by PLN 359.5m lower than in Q4 2009. The difference was mainly attributable to higher (by PLN 303.8m) cash outflows on repayment of loans and borrowings and PLN 80.3m lower adjustments due to settlement of financial instruments.
Table 18: Consolidated statement of cash flows
Q4 2010 Q4 2009 Change
Cash flows from operating activities PLNm 78.8 38.6 40.2
Cash flows from investing activities PLNm -145.5 -532.8 387.3
Cash flows from financing activities PLNm -33.1 326.4 -359.5
Change in net cash PLNm -94.1 -165.1 71.0
Cash and cash equivalents at beginning of period PLNm 228.2 16.5 211.7
Cash and cash equivalents at end of period PLNm 134.1 -148.6 282.7