the lottery scholarship s fafsa requirement and its impact
TRANSCRIPT

1
The Lottery
Scholarship’s
FAFSA
Requirement
and its impact
on Pell Grants
for
Tennesseans
Tennessee Higher
Education Commission
October, 2012

2
Abstract
In 2003 the Tennessee General Assembly created the Tennessee Education Lottery Scholarship
(TELS) program, the seventh broad-based scholarship program in the U.S. to be funded by state
lottery proceeds. To be eligible to receive a TELS award, students in Tennessee are required to
satisfy certain academic requirements and file a Free Application for Federal Student Aid
(FAFSA). The purpose of this policy brief is to examine the relationship between requiring TELS
recipients to fill out a FAFSA and the amount of need-based federal Pell grant dollars Tennessee
has received. Results show that in the most recent academic year (2011-12) Tennessee
received $9.5 million in additional Pell dollars, and over the 2004-05 to 2011-12 academic years
the cumulative additional Pell dollars gained was over $53.2 million.

3
Table of Contents
Abstract ......................................................................................................................................................... 2
Table of Contents .......................................................................................................................................... 3
Introduction .................................................................................................................................................. 4
Percentage of U.S. high school students filling out a FAFSA by state ........................................................... 5
FAFSA application growth in Tennessee ....................................................................................................... 7
Growth in sophomore Pell eligibility ............................................................................................................ 7
Growth in the number of Pell eligible students in Tennessee ...................................................................... 9
Methodology ................................................................................................................................................. 9
The fiscal impact of requiring FAFSA as the application for a TELS scholarship ......................................... 11
Recent FAFSA Improvements ...................................................................................................................... 13
Conclusion ................................................................................................................................................... 14
References .................................................................................................................................................. 16
Appendix ..................................................................................................................................................... 17

4
Introduction
In June of 2003, the Tennessee General Assembly created the Tennessee Education Lottery
Scholarship (TELS) program, the seventh broad-based scholarship program in the U.S. to be
funded by state lottery revenues. From academic year 2004-05 to 2010-11, four main TELS
programs (HOPE, ASPIRE, GAMS, and ACCESS) funded 371,269 scholarships at a cost of over
$1.3 billion (Tennessee Student Assistance Corporation [TSAC], 2011).1 In 2010, 66 percent of
eligible first-time freshmen attending a public institution in Tennessee received a TELS award.2
The base award amount3 covered 63 percent of the average mandatory tuition and fees at a
four-year institution and 62 percent at a two-year institution (TSAC, 2011; Tennessee Higher
Education Commission, 2011).
In order to receive a TELS award, students are required to fill out a Free Application for Federal
Student Aid (FAFSA). While the primary purpose of the FAFSA is to determine student eligibility
for federal student financial aid programs, such as Pell grants, federal student loans, and
federal work-study programs, the FAFSA also plays an important role in Tennessee student
financial aid policy. In addition to serving as the application for a TELS scholarship, the FAFSA
also serves as students’ application for the Tennessee Student Assistance Award (TSAA), which
provided more than $55 million in need-based grants to 31,377 students in the 2010-11
academic year (TSAC, 2011).
A positive consequence of requiring students to fill out the FAFSA for a TELS scholarship is that
many students learn they have qualified for a Pell Grant, federal student loan, federal work
study program, or a TSAA need-based grant. For example, previous research has shown that 33
percent of students that did not fill out a FAFSA would have qualified for a Pell grant, with
almost half qualifying for the full grant award (Kantrowitz, 2011). Additionally, one of the
primary reasons students cited for failing to submit a FAFSA was that they thought they would
be ineligible for federal aid (Kantrowitz, 2011). The purpose of this policy brief is to examine the
1 The number of scholarships does not represent a distinct count of students served.
2 Includes HOPE, ASPIRE, GAMS, and ACCESS only (excludes non-traditional HOPE awards).
3 In 2010 the HOPE scholarship program awarded students $2,000 per semester at a four-year institution and
$1,000 per semester at a two-year institution. GAMS and ASPIRE are both supplemental awards. GAMS provides
an additional $5,00 per semester for students that meet more stringent high school academic requirements, and
ASPIRE provides an additional $750 supplement for students with an adjusted gross income less than $36,000.

5
relationship, if any, between the TELS program’s FAFSA requirement and the amount of Pell
dollars Tennessee received.
Percentage of U.S. high school students filling out a FAFSA by state
Figure 1 shows that as of April 29, 2012, Tennessee (62 percent) led the nation in the
percentage of its high school seniors who filled out a FAFSA for the 2012-13 academic year.
Tennessee was one of only two states, along with New York, with a FAFSA completion rate of at
least 60 percent. As was previously discussed, the high percentage of high school seniors in
Tennessee filling out a FAFSA means that a greater number of Tennessee students are receiving
federal student financial aid.
Tennessee is one of eight states with an established scholarship program funded by lottery
proceeds. Of these eight states, half (Tennessee, Arkansas, Florida, and West Virginia) require
Figure 1: Percentage of High School Seniors Filling out a FAFSA by State
Source: Presentation by the Office of Federal Student Aid, Department of Education at the 2012
Student Financial Aid Research Network Conference (SFARN) in Memphis, TN.

6
students to fill out a FAFSA in order to be eligible for a lottery scholarship (THEC, 2012). Georgia
does not require students to file a FAFSA; however, students can fill out the FAFSA as their sole
application for a lottery scholarship.
Of the five states using the FAFSA4 as the primary application for a lottery scholarship, three
states (Tennessee, Arkansas, and Georgia) allow (or require) students to use the FAFSA as their
sole application. Tennessee and Georgia are the only states that have used the FAFSA as their
lottery scholarship application for more than two years. Arkansas’ lottery scholarship program,
which was created in 2010, is only in its second year of existence (THEC, 2012). Policymakers
and researchers are interested to see if Arkansas’ decision to require the FAFSA as its sole
application will increase their percentage of high school students submitting a FAFSA.
Table 1 shows the five states with the highest and lowest FAFSA completion rates. States with
the highest completion rates primarily are located in the Northeast, while states with the
lowest completion rates are primarily located in the Midwest and West. Of the five states with
the highest completion rates, Tennessee is the lone representative from the Southeast. The
data presented in this policy brief suggest requiring students to complete a FAFSA as the
application for a TELS scholarship has likely contributed to Tennessee’s number one ranking.
4 Florida and West Virginia require both a state application and the FAFSA.
Table 1: Top five states with the highest and lowest percentages of high school FAFSA filers
Highest Lowest
State High
School Seniors
% HS FAFSA Filers State High
School Seniors
% HS FAFSA Filers
TN 54,712 62% UT 34,011 23% NY 178,994 60% AZ 85,824 25% MA 68,160 56% AK 7,417 33% CT 41,541 55% OK 36,780 33%
RI 12,020 54% AL 46,098 35% Source: Presentation by the Office of Federal Student Aid, Department of Education at the 2012 Student Financial Aid Research Network Conference (SFARN) in Memphis, TN.
7
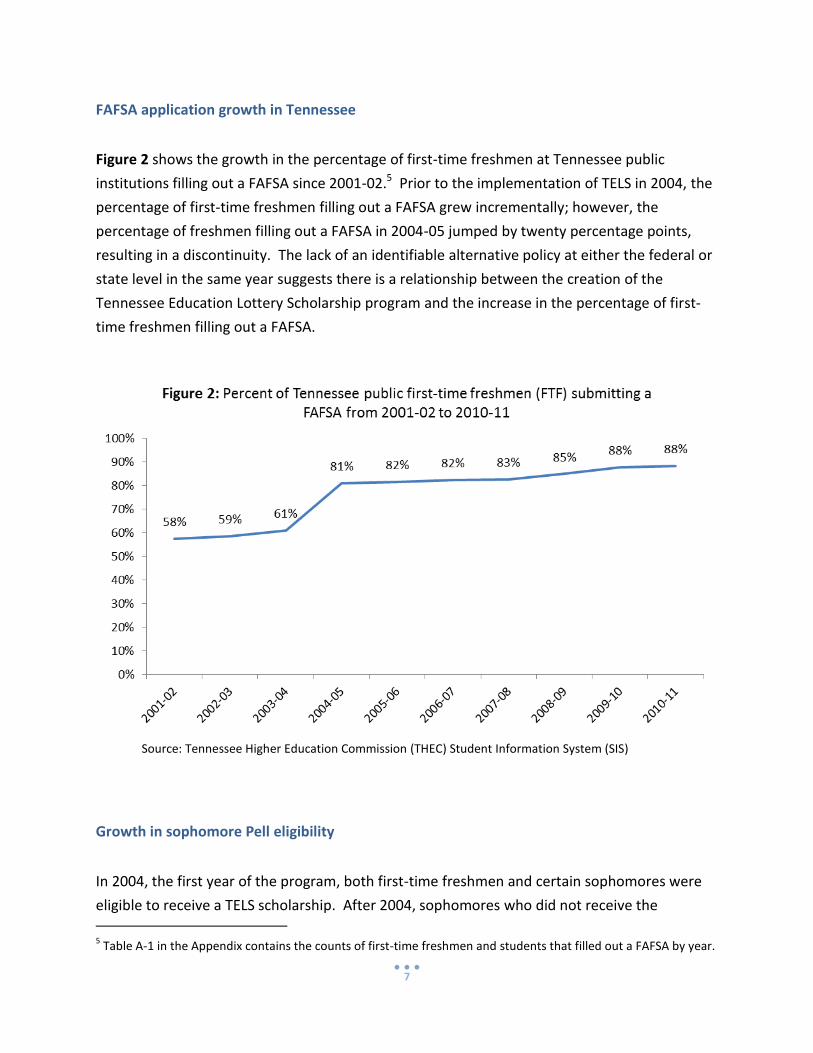
FAFSA application growth in Tennessee
Figure 2 shows the growth in the percentage of first-time freshmen at Tennessee public
institutions filling out a FAFSA since 2001-02.5 Prior to the implementation of TELS in 2004, the
percentage of first-time freshmen filling out a FAFSA grew incrementally; however, the
percentage of freshmen filling out a FAFSA in 2004-05 jumped by twenty percentage points,
resulting in a discontinuity. The lack of an identifiable alternative policy at either the federal or
state level in the same year suggests there is a relationship between the creation of the
Tennessee Education Lottery Scholarship program and the increase in the percentage of first-
time freshmen filling out a FAFSA.
Growth in sophomore Pell eligibility
In 2004, the first year of the program, both first-time freshmen and certain sophomores were
eligible to receive a TELS scholarship. After 2004, sophomores who did not receive the 5 Table A-1 in the Appendix contains the counts of first-time freshmen and students that filled out a FAFSA by year.
Source: Tennessee Higher Education Commission (THEC) Student Information System (SIS)

8
scholarship as freshmen were not eligible. To be eligible for the scholarship, first-time
freshmen were required to have a 21 ACT composite score or a 3.0 high school GPA.
Sophomores in 2004, however, were required to meet both the first-time freshmen eligibility
requirements and the scholarship renewal requirements, a 2.75 GPA in college.
Undoubtedly, in any given year there are sophomores who fill out a FAFSA for the first-time and
are Pell eligible. For example, a sophomore may decide to fill out a FAFSA for the first time
because his/her financial situation changed or he/she was previously unaware of his/her
eligibility for federal or state financial aid. Figure 3 shows the percentage of first-time
freshmen that did not fill out a FAFSA during their freshmen year but did so as sophomores and
were Pell eligible. The figure shows the percentage of sophomores who filled out a FAFSA for
the first time and became Pell eligible has remained relatively flat, with the exception of the
2003 first-time freshmen cohort (sophomores in 2004).
The spike in the percentage of sophomores who filled out a FAFSA for the first time and were
Pell eligible in 2004 may be attributable to the implementation of TELS. Because TELS did not
exist prior to 2004, sophomores were given the opportunity to receive TELS with the inaugural
class of freshmen. With the exception of this class, sophomores are only eligible to renew a
TELS award, not apply for a TELS award for the first time. Given these rules, if the
Source: THEC SIS

9
implementation of TELS had an effect on the percentage of first-time Pell eligible sophomores,
researchers would expect to see a spike in the trend line for the 2003 first-time freshmen
cohort.
Growth in the number of Pell eligible students in Tennessee
Since 2001, the percent of Tennessee public first-time freshmen receiving a Pell grant has
remained relatively stable, increasing by one percentage point annually, with the exception of
2004-05 and 2009-11 (Figure 4). In 2004-05, the year TELS was implemented, the percent of
Tennessee’s first-time freshmen at public institutions receiving Pell grew by three percentage
points, a growth rate three times as high as any previous year’s gain. The growth in 2009-10
and 2010-11 is attributable to substantial increases in Pell expenditures by the federal
government6 and the recession.
Methodology
In order to determine the fiscal impact of requiring TELS students to submit a FAFSA, we treat
the introduction of the TELS program as a natural experiment. Prior to the introduction of TELS,
first-time freshmen’s only incentive to fill out a FAFSA was if they believed that they would be
6 See Pell grant end of year reports http://www.ed.gov/finaid/prof/resources/data/ope.html
Source: THEC SIS

10
eligible for federal financial aid, which is awarded based on financial need, or if it was required
by the institution attended. If students did not believe they would receive any federal aid due
to a perceived lack of need, they may have been less likely to submit a FAFSA.
Existing research has shown a third of students who do not fill out a FAFSA would have received
a Pell grant, with almost half qualifying for the full award (Kantrowitz, 2011). If a portion of
Tennessee students historically had not filled out a FAFSA because they believed they would
not have been eligible for the Pell grant, Tennesseans may have left federal Pell dollars on the
table.
Figure 2 showed that when TELS was introduced in 2004-05 the percentage of first-time
freshmen filing out a FAFSA jumped by twenty percentage points, from 61 to 81 percent, and
has remained above 80 percent. Additionally, there was a clear spike (2.44 percent) in the
2004-05 academic year in the percentage of sophomores (freshmen in 2003-04) who filled out a
FAFSA for the first time and were Pell eligible (Figure 3). As was stated previously, the
sophomores in 2004-05 (freshmen in 2003-04) were the only cohort of sophomores eligible for
a TELS scholarship without having been eligible as freshmen. Specifically, of the 30,605
freshmen in 2003-04 that were sophomores in 2004-05, there were 746 (2.44 percent) that fit
this description. By applying the freshmen-to-sophomore retention rate, we calculate there
would have been 1,036 freshmen in fall of 2003 who did not complete a FAFSA as freshmen,
but did so as sophomores and were Pell eligible.
We do not assume, however, all of these Pell eligible sophomores decided to file a FAFSA for
the first-time as a result of the introduction of TELS. To account for this, we subtracted the
average percentage of Pell eligible sophomore first-time FAFSA filers (0.77 percent) in the
previous and subsequent years. As a result, we determined that for 511 of the 2004-05 Pell
eligible sophomore first-time FAFSA filers, or 1.67 percent of the 2003 first-time freshmen
cohort (30,605), it is reasonable to assume that their decision to submit a FAFSA was due to the
introduction of TELS and its FAFSA submission requirement.
Because students can receive the Pell grant for up to six years,7 in any given academic year,
there are six classes of students who received a TELS scholarship as freshmen who would have
7 Although students are eligible to receive TELS for only five years, it is reasonable to assume that students that
received Pell, and are still enrolled in a sixth year, would fill out a FAFSA to keep the Pell grant for their sixth year
despite hitting the TELS five-year limit.

11
foregone their Pell award had they not filed a FAFSA. Because the percentage of first-time
freshmen receiving Pell has remained constant since the introduction of TELS, it is reasonable
to assume that a portion of future cohorts of students would not have filled out a FAFSA, but
did as a result of TELS and became Pell eligible. Utilizing the most recent cohort retention rates
and the average Pell award for each academic year,8 we extrapolate the 1.67 percent of new
FAFSA filers to future cohorts to estimate the Pell dollars Tennessee students would have left
on the table had the TELS FAFSA requirement not been in effect.
The fiscal impact of requiring FAFSA as the application for a TELS scholarship
Table 2 shows the estimated amount of Pell dollars (2011 dollars) Tennesseans would have
forgone had the FAFSA not been required as the application for TELS. Our analysis shows that
in the most recent academic year (2011-12) the cost to Tennesseans would have been $9.5
million9. For the combined 2004-05 to 2011-12 academic years, the cumulative Pell dollars
Tennesseans would have forgone is $53.2 million. When we examine the costs for all cohorts10
8 Average Pell awards are shown in Table A-1 in the Appendix.
9 Our estimates show that Tennesseans would have forgone about $9 million, or 2 percent of the $460 million in
Pell dollars Tennessee public institutions received in 2010-11.
10 This estimate includes the 2003-2011 first-time freshmen cohorts.
Table 2: Federal Pell dollars (2011 dollars) accruing to Tennessee from the TELS program’s FAFSA requirement.
FTF Cohort Year Academic Year Costs Cohort Costs
2004-05 $3,677,778.32 $6,603,336.29
2005-06 $4,558,487.60 $6,193,658.15
2006-07 $5,355,698.52 $6,294,757.75
2007-08 $6,105,919.84 $6,783,512.59
2008-09* $6,998,757.42 $7,493,404.37
2009-10 $8,121,505.19 $10,716,825.02
2010-11 $8,938,557.83 $10,412,498.13
2011-12 $9,509,900.94 $10,459,530.71
Total $53,266,605.65 $64,957,523.02 * TELS began in 2004; therefore, a full six classes of students were not contributing to the costs until the 2008-09 academic year.

12
throughout their time enrolled,11 Tennessee would have left more than $64.9 million in federal
Pell grant dollars on the table.
Additionally, it is worth noting we believe these are conservative estimates. Specifically, our
analysis underestimates the effect/costs in at least five ways:
1. Our analysis is limited to first-time freshmen at public institutions. Students, however,
are eligible for TELS at both Tennessee public and regionally accredited private
institutions. It seems reasonable to assume the implementation of TELS is responsible
for an increase in the percentage of students attending private institutions filing a FAFSA
as well. The size of the effect for students at private institutions is probably smaller;
however, private institutions depend upon students completing a FAFSA or other
standardized aid application before determining a student’s eligibility for institutional,
state or federal student aid (P. Meldrim, personal communication, October 4, 2012).
2. We also did not capture Tennessee students who enrolled at an out-of-state
institution. Although Tennessee students going out of state are not eligible to receive a
TELS award, students may be undecided on where they will enroll when they submit
their FAFSA. If students are considering attending both an in-state and out-of-state
institution, they may decide to fill out a FAFSA to ensure TELS eligibility (in case they
decide to remain in-state) even if they believe they will not qualify for the Pell grant.
However, even if they enroll in the out-of-state institution and are Pell eligible, they will
still receive Pell. It is possible without the creation of TELS these students may have
chosen not to submit a FAFSA, thereby forgoing federal aid. Once again, the size of this
effect will likely be smaller than the effect of students attending public institutions.
3. Recipients of the HOPE non-traditional scholarship were not included in our analysis.
To be eligible for a HOPE non-traditional award, a student must be 25 years of age and
have a family adjusted gross income below $36,000. Due to the program’s income
restriction, all of the students in this program are Pell eligible.
11
For the 2011-12 academic year and beyond, we assume that average Pell award is the same as the 2010-2011
academic year.

13
4. When calculating the average percentage of sophomores who filled out a FAFSA for
the first time and were Pell eligible from 2003-04 to 2009-10, we included the 2003-04
cohort in our average, thereby reducing the effect of the spike in 2004. Essentially,
including the 2003-2004 average in our average over time means fewer students are
included in our estimates, which leads to lower costs.
5. We used the most recent average Pell award, which does not capture any potential
increases the average Pell award for the current or future years.12
Even without accounting for the additional Pell dollars attributable to these circumstances, the
presented estimates (over $53 million) represent tangible federal need-based aid dollars that
Tennessee students have received to help offset the costs of college.
Recent FAFSA Improvements
Recognizing the FAFSA is a lengthy and complex application, the U.S. Department of Education
has made several modifications over the last three years that have significantly improved the
application process. Specifically, these revisions have:
reduced the amount of information needed to complete the application by allowing
applicants to populate a majority of the financial questions directly from the IRS
using the IRS Data Retrieval Tool,
improved the user interface, and
enhanced the skip logic, which uses applicants’ responses to eliminate unnecessary
questions.
These revisions have reduced the average length of time it takes to complete the application by
a third, from 33 minutes to 22 minutes (U.S. Department of Education, 2012). In addition to the
substantive improvements that have been made in recent years to the application, the
Department of Education has also added new features to the application process. Specifically,
applicants are now provided with information about institutional costs and student success
rates at the institutions they are considering attending. For example, applicants receive
information on the net price of each institution they are considering, as well as the institution’s
graduation, retention, and transfer rates (U.S. Department of Education, 2012).
12
Except for three years, the average Pell award has increased every year from 1981 to 2010 (nominal dollars).

14
Conclusion
Requiring Tennesseans to submit a FAFSA to receive a TELS award is associated with Tennessee
students receiving over $53 million in federal Pell grants since the 2004-05 academic year.
Additionally, Tennessee has seen its percentage of first-time freshmen filing a FAFSA increase
by 20 percentage points, from 61 to 81 percent. As a result, Tennessee now leads the nation in
the percentage of high school FAFSA filers. The fiscal impact of requiring the FAFSA is
underestimated in our report, due to both the limited population included in our analysis, and
the other sources of federal student aid that Tennesseans may have received as a result of the
FAFSA requirement, such as federal work study or federal student loans.
While historically the FAFSA was a complex and lengthy application, the U.S. Department of
Education has made great strides in reducing the burden of completion. Over the last three
years major revisions have been made, including enhanced skip logic and the ability to
automatically import the majority of required financial information from the IRS. These
changes have dropped the average time it takes to complete a FAFSA application to 22 minutes.
Finally, students in Tennessee only have to fill out one application for all state and federal
financial aid programs13, reducing the burden on students and their families. Tennessee is one
of only three states with a lottery scholarship program to have a single state financial
application (FAFSA). By filling out the FAFSA, Tennesseans are eligible for the following
programs: Tennessee Education Lottery Scholarship, Tennessee Student Assistance Award,
Federal Pell grant, Federal student and parent loans, Federal work study programs, and in some
cases institutional aid. Other states are following Tennessee’s lead, in 2011 Florida added the
FAFSA to its required state application to receive a lottery scholarship in an attempt to capture
more federal financial aid for its students (B. Dombrowski, personal communication, October 2,
2012)
The FAFSA completion requirement for TELS eligibility appears to be serving the State well and
has resulted in Tennesseans drawing down over $53 million in additional Pell dollars. Applicant
burden has been greatly reduced by utilizing technology to pre-populate certain fields and by
13
Excluding the Dual Enrollment Grant program, which provides financial aid to high school juniors and seniors,
there are seven boutique state financial aid programs that do not utilize the FAFSA. However, the cumulative
students in these programs represent one percent of all state financial aid recipients and less than one percent of
all state aid expenditures in academic year 2010-11.

15
taking form filers to only those fields they need to complete. As a result, the average FAFSA
completion time has been shortened significantly. Requiring the FAFSA as the uniform
application for all federal and Tennessee aid programs has led to significant increases in student
aid from federal programs. Keeping the FAFSA requirement in place will ensure that future
TELS recipients will also benefit for years to come.

16
References
Kantrowitz, M. (January 18, 2011). Reasons why students do not file the FAFSA.
Retrieved from http://www.finaid.org/educators/20110118nofafsareasons.pdf
Tennessee Higher Education Commission [THEC]. (2012). A comparison of states’ lottery
scholarship programs. Retrieved from
http://thec.ppr.tn.gov/THECSIS/Lottery/Lottery.aspx
Tennessee Higher Education Commission [THEC]. (2011). Tennessee Education Lottery
Scholarship Program Annual Report. Retrieved from
http://thec.ppr.tn.gov/THECSIS/Lottery/Lottery.aspx
Tennessee Student Assistance Cooperation [TSAC]. (September 29, 2011). Grants and
scholarships update. Retrieved from
http://www.tn.gov/tsac/About_Us/board_meetings_new/sept11/II%20B%20-
%20Grants%20and%20Scholarship%20Program%20Update.pdf
U.S. Department of Education. (October 3, 2012). How will you pay for college? Retrieved from
www.ed.gov/blog/2012/01/how-will-you-pay-for-college/

17
Appendix
Table A-1: Counts and Percentage of First-time Freshmen (FTF), FAFSA Filers, and Pell Eligible First-time Freshmen by Academic Year and Average Pell Award
Academic Year
FTF Cohort
FTF that filed a FAFSA
Pell eligible
FTF
% of FTF that filed a
FAFSA
% FTF that were Pell eligible
Average Pell
Award
2002-03 29,746 17,402 9,611 59% 32% $2,473
2003-04 30,605 18,561 10,377 61% 34% $2,477
2004-05 32,746 26,503 12,005 81% 37% $2,456
2005-06 32,021 26,156 11,330 82% 35% $2,482
2006-07 33,242 27,409 11,841 82% 36% $2,648
2007-08 34,542 28,547 12,521 83% 36% $2,971
2008-09 35,305 29,987 13,149 85% 37% $3,706
2009-10 40,338 35,418 19,401 88% 48% $3,833
2010-11 39,190 34,630 20,693 88% 53% $3,833*
Source: THEC SIS and Pell Grant End of Year Reports: http://www.ed.gov/finaid/prof/resources/data/ope.html
*The 2009-10 average Pell award was used in 2010-11