the mbta pension fund’s cliff walk - northfield · the mbta pension fund’s cliff walk...
TRANSCRIPT

The MBTA Pension Fund’s Cliff Walk
Northfield Conference - June 9, 20171
Fletcher Asset Management (FAM) Ponzi Scheme $25 Million MBTA Loss Taken in 2012
Investment Managers:CEO Alphonse “Buddy” Fletcher
CIO Karl E. White
2

Alphonse “Buddy” Fletcher
• 1987 A.B. in Applied Math, Harvard• 2004 Masters in Environmental Management, Yale School of Forestry &
Environmental Studies• Quantitative Equity Trader at Bear Stearns then Kidder Peabody
3
Karl E. White
• 1988 BS, Florida A&M• 1995 MBA, University of Chicago• Former Trustee – University of Massachusetts• Executive Director, MBTA Retirement Fund
April 1, 2002 – June 30, 2006• Leaves the MBTA to become Chief Investment Officer (CIO) for Fletcher Asset Management• On June 7, 2007 the MBTA Retirement Fund invests $25 million in Fletcher Asset Management
4
Fletcher Ponzi Scheme Victims - $172 Million Invested
• 2 European Hedge Fund of Funds invest $42 million between 2004-2008• MBTA invests unknown $ amount in 2004, later redeems for unknown reason• June 7, 2007 the MBTA invests $25 million but does not disclose this investment• 2008 - 3 Louisiana Pension funds invest $100 million & are granted a 12%
“preferred return” • FAM’s 3rd Party Administrator was paying the Louisiana Pension funds’ financial
advisor a “marketing fee” to introduce investors • August 2008 – a private university invests $5 million
5
Fletcher Asset Management
• 06/07/2007 MBTA invests $25 million with FAM• FAM says it invests in liquid, traded securities which it hedges for safety• Instead FAM invests in Buddy Fletcher’s brother’s movie, “Violet & Daisy,” and
invests in illiquid un-hedgeable Real Estate• 03/15/2010 FAM invests $1.5 million in ANTS common stock trading at 90 cents /
share & ANTS warrants• 03/31/2010 FAM marks ANTS investments at $17.3 million, a 1,053% gain after
only 16 days• ANTS 2009 Audit raises “going concern” issues
6
ANTS Valuation Raises the Following Questions
1. Did the MBTA notice the 1,053% gain and question it?2. Did the auditor notice or question the gain? 3. Does the MBTA Pension Staff know how to analyze investments?4. Does the MBTA Pension have access to stock market quotes or an independent
pricing sources? 5. Where were the Gatekeepers? 6. Who does the MBTA’s performance reporting? Is it internal or external?
7
Fletcher’s Performance was Too Good to be True
• In a video-taped March 2008 presentation to Louisiana FAM reported 8.13% annual gains from June 1997 – December 2008
• FAM reported 127 months in a row without a single down month while the market experienced 53 down months during that same period!
• This time period includes the 1998 LTCM Crises & the 2000-2003 bear market periods & the beginning of the 2008 Financial Crises
• 2010’s performance is reported as +15.03%• In March 2011 FAM provides an updated performance record to 2010 which showed 14
down months for 2008-2010 • Performance numbers like these are obviously false. How did the MBTA miss this?• Question: Did the T’s consultant recommend FAM or did the T’s Board decide to invest
in FAM?
8
What Happened to The MBTA’s $25 Million?
• Only $8 million was invested• $17 million was used for/to:
1. Repayments to Citco, an off-shore Third Party Administrator2. Meet margin calls on failed investments3. Pay management fees & fund expenses4. Meet investor redemptions
Question: How did the MBTA not notice the missing $17 million?
9
Aftermath…• March 24, 2011 MBTA requests a partial redemption but receives no money back. • May 9, 2012, Alpha, the fund that MBTA invested in is placed into involuntary
liquidation • MBTA’s 2013 Annual Report (pg. 19) says it took a partial write-down of its FAM
investment in 2011 & 2012 with a full write-down in 2013• Boston Globe’s Beth Healy exposes the MBTA’s $25 million loss on December 20,
2013 in article entitled, “Ex-T pension chief recommended $25m investment that went bust”
• January 17, 2014, MBTA & Fletcher Fixed Income Alpha Fund, Ltd. File civil action v. Grant Thornton Cayman Islands, EiserAmper (Cayman) Ltd. And Quantal International Inc.
• Question: Why didn’t the MBTA sue their former Executive Director Karl E. White?
10
MBTA’s $10 Million investment into the Weston Capital Ponzi Scheme
Source Documents: 2013 MBTA Annual Report, page 19
SEC v. Penthouse International, Charles Samuel & Jason Galanis dated 24 Jan 2005
SEC Litigation Release #20110 dated 10 May 2007
SEC v. Weston Capital Management, Albert Hallac and Keith Wellner dated 23 June 2014
11
How does the MBTA Pick & Monitor Investment Managers?
• 10 May 2007, SEC Litigation Release # 20110 bars Jason Galanis from serving as an officer or director of a public company for 5 years and fines him $60,000 for securities fraud
• 29 June 2009 the T invests $10 million into Weston Capital Management Partners II fund, a private equity fund of funds
• 29 March 2010, Fund.com, a company controlled by Jason Galanis purchases Weston Capital
• MBTARF seemingly exhibits zero due diligence and investment acumen after Jason Galanis purchases Weston Capital Management by staying invested
12
MBTA’s Valuation is too Precise to be believed
• August 2011 – Weston Capital perpetuates a $17 million fraud • 25 September 2013 the MBTARF’s investments are transferred directly to the MBTARF which
values them to the penny at $10,261,412.68 as of 31 December 2013
• 23 June 2014 the SEC files a complaint v. Weston Capital Management for perpetrating a $17 million fraud
• Questions:1. How is it possible for the MBTARF to value an investment in Level II and Level III assets so
precisely and come up with the $412.68?
2. Did this investment really earn a return of approximately ¾ of 1% annually during the 3.5 year time period at Weston Capital?
3. Who did the valuation? 4. How does the T not notice Jason Galanis is running Weston Capital?
13
MBTA Pension Fund Investigation – Targeted Focus
Collectively this investigative team concentrated on eight main areas:
1. Quality and level of Pension Board sophistication and relevant investment experience 2. Validity of MBTA reported pension fund returns to stated asset allocation 3. Actuarial assumptions used, impact on funded ratio and reported assets and liabilities4. MBTA pension operational standards applied 5. MBTA accounting practices6. Standards applied by third parties such as KPMG and Buck Consulting7. Level, quality and transparency of MBTA reporting 8. Administrative fees charged and level of reasonableness
14

Summary Findings – MBTA Pension Fund At Risk
1. Even with limited and opaque financials, this investigation uncovered 12 Red Flags 2. Potential size of discrepancies are in excess of $470 million or 29% of total pension fund value3. Individually, each of these findings were concerning and when combined, they pointed to a
pension fund at risk and significant danger to plan beneficiaries4. The dollar size of potential risk may be even larger as limited reporting in the $320 million
alternative investments/hedge funds segment (20 percent of pension assets) has made it difficult to analyze what could be hidden in this higher-risk and harder to value asset category
15
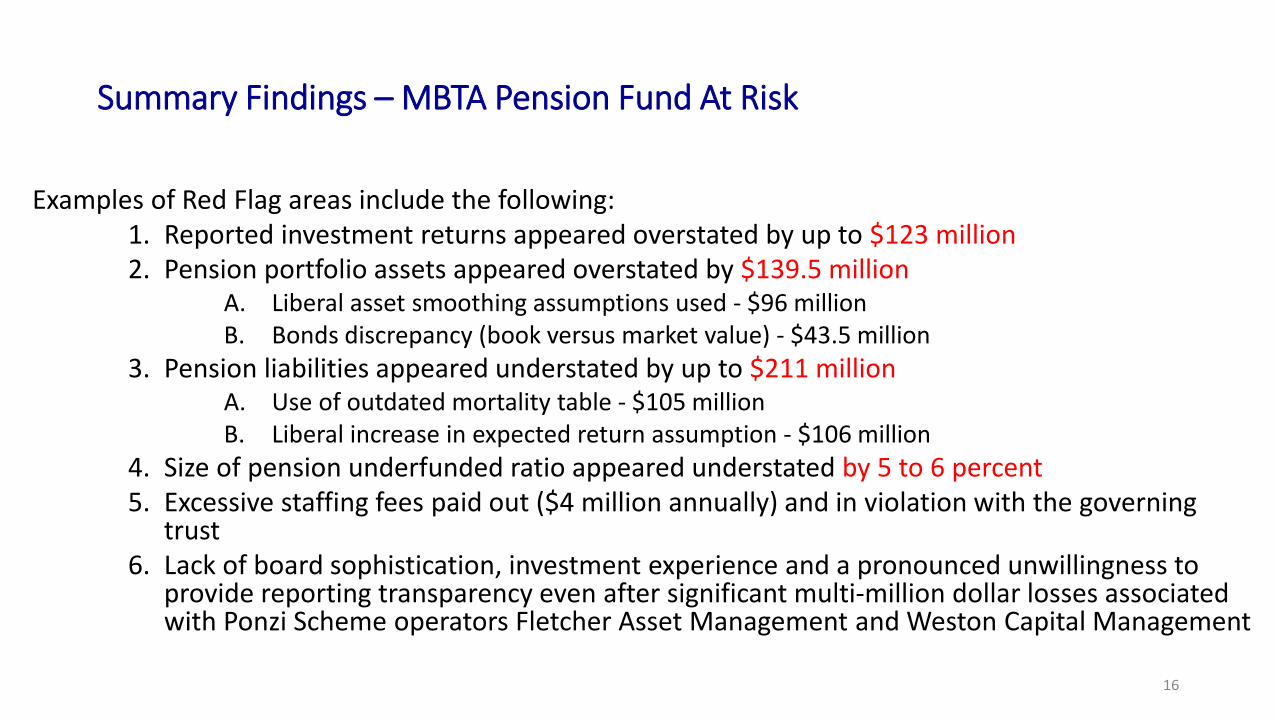
Summary Findings – MBTA Pension Fund At Risk
Examples of Red Flag areas include the following:1. Reported investment returns appeared overstated by up to $123 million 2. Pension portfolio assets appeared overstated by $139.5 million
A. Liberal asset smoothing assumptions used - $96 millionB. Bonds discrepancy (book versus market value) - $43.5 million
3. Pension liabilities appeared understated by up to $211 millionA. Use of outdated mortality table - $105 millionB. Liberal increase in expected return assumption - $106 million
4. Size of pension underfunded ratio appeared understated by 5 to 6 percent5. Excessive staffing fees paid out ($4 million annually) and in violation with the governing
trust6. Lack of board sophistication, investment experience and a pronounced unwillingness to
provide reporting transparency even after significant multi-million dollar losses associated with Ponzi Scheme operators Fletcher Asset Management and Weston Capital Management
16
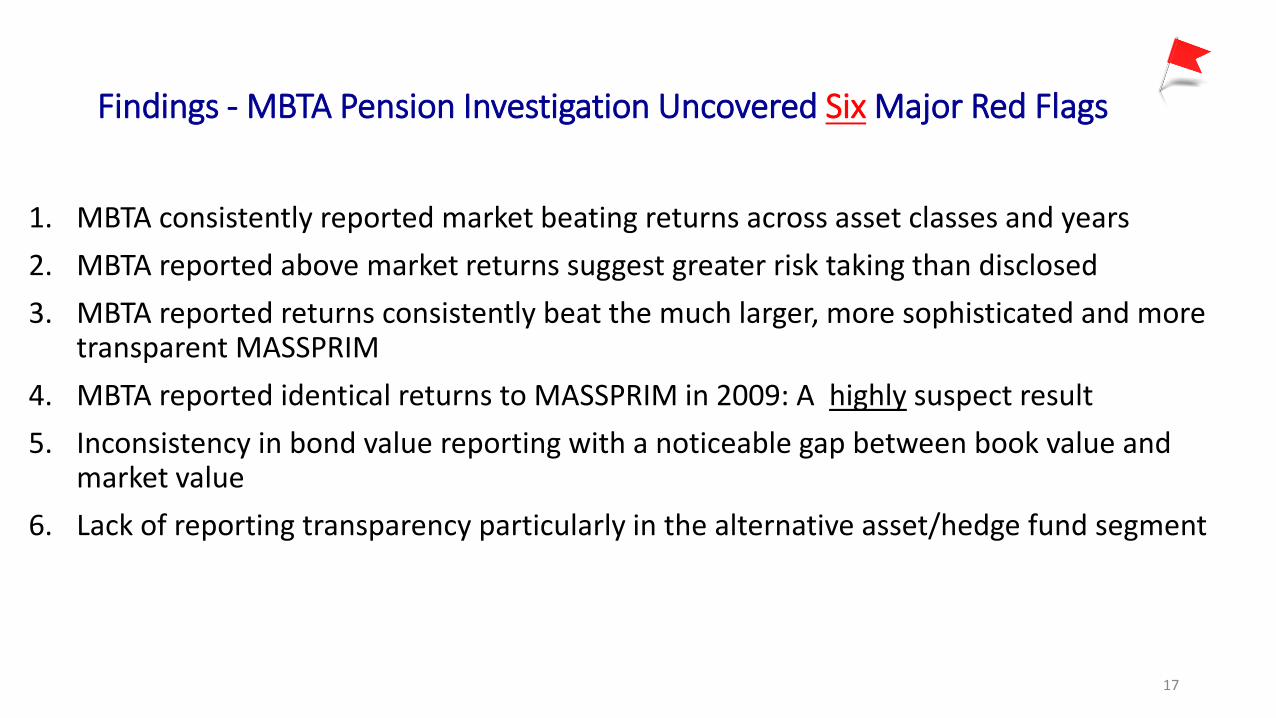
Findings - MBTA Pension Investigation Uncovered Six Major Red Flags
1. MBTA consistently reported market beating returns across asset classes and years2. MBTA reported above market returns suggest greater risk taking than disclosed 3. MBTA reported returns consistently beat the much larger, more sophisticated and more
transparent MASSPRIM4. MBTA reported identical returns to MASSPRIM in 2009: A highly suspect result5. Inconsistency in bond value reporting with a noticeable gap between book value and
market value6. Lack of reporting transparency particularly in the alternative asset/hedge fund segment
17

MBTA Pension Fund Primary Service Providers (2013)
1. Custodian Bank: State Street Bank2. Auditor: KPMG 3. Actuary: Buck Consulting4. Fund Consultant: Marco Consulting5. # of Investment Advisors:71
18
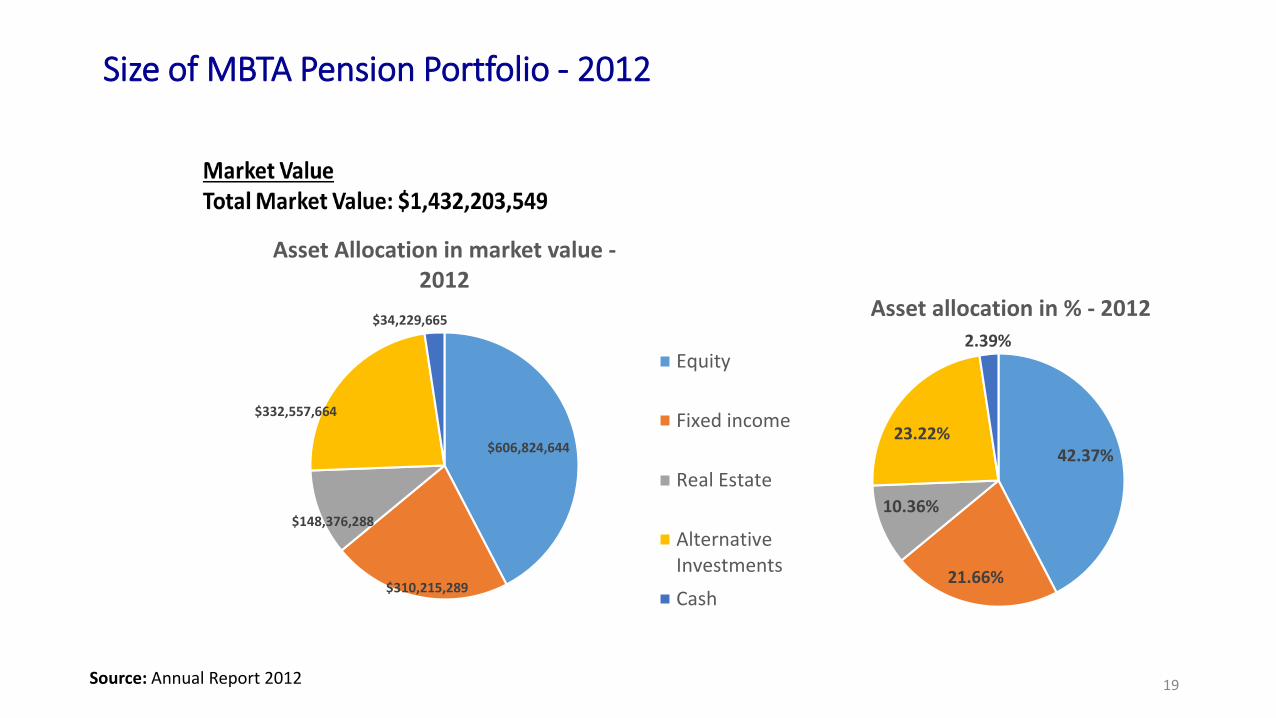
Size of MBTA Pension Portfolio - 2012
Source: Annual Report 2012
$606,824,644
$310,215,289
$148,376,288
$332,557,664
$34,229,665
Asset Allocation in market value -2012
42.37%
21.66%
10.36%
23.22%
2.39%
Asset allocation in % - 2012
Equity
Fixed income
Real Estate
AlternativeInvestmentsCash
19
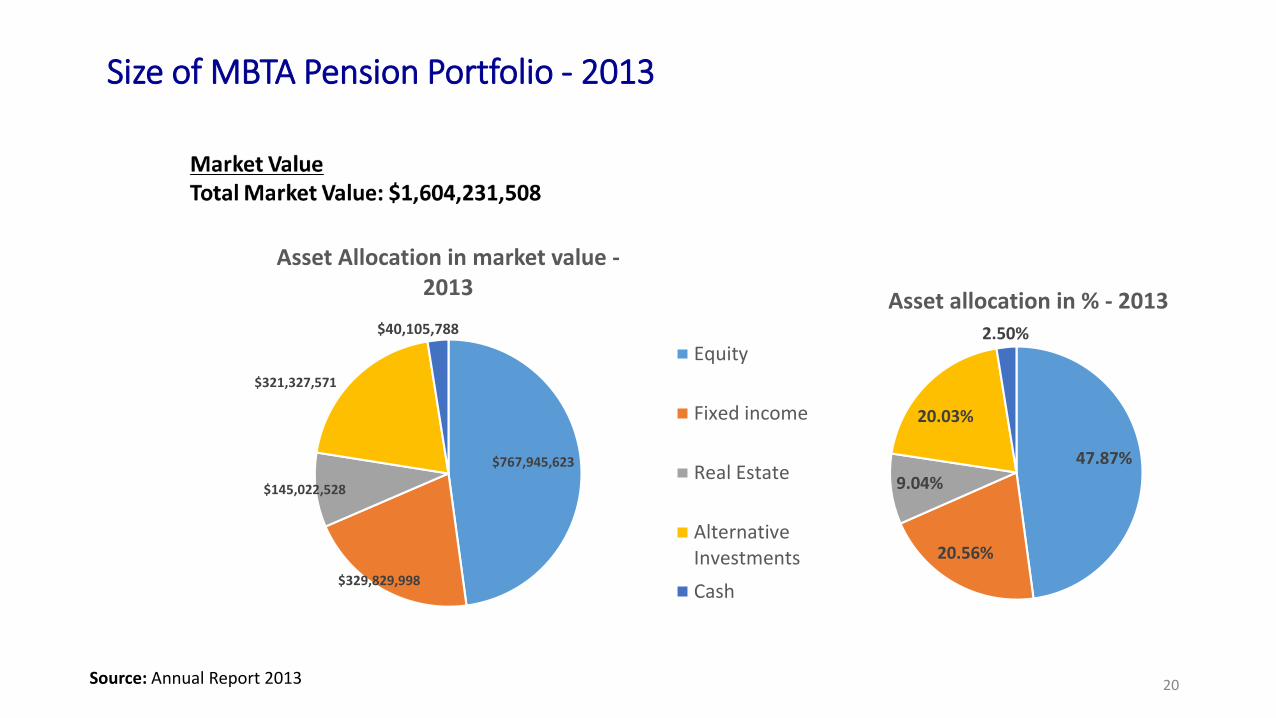
Size of MBTA Pension Portfolio - 2013
Source: Annual Report 2013
$767,945,623
$329,829,998
$145,022,528
$321,327,571
$40,105,788
Asset Allocation in market value -2013
47.87%
20.56%
9.04%
20.03%
2.50%
Asset allocation in % - 2013
Equity
Fixed income
Real Estate
AlternativeInvestmentsCash
20
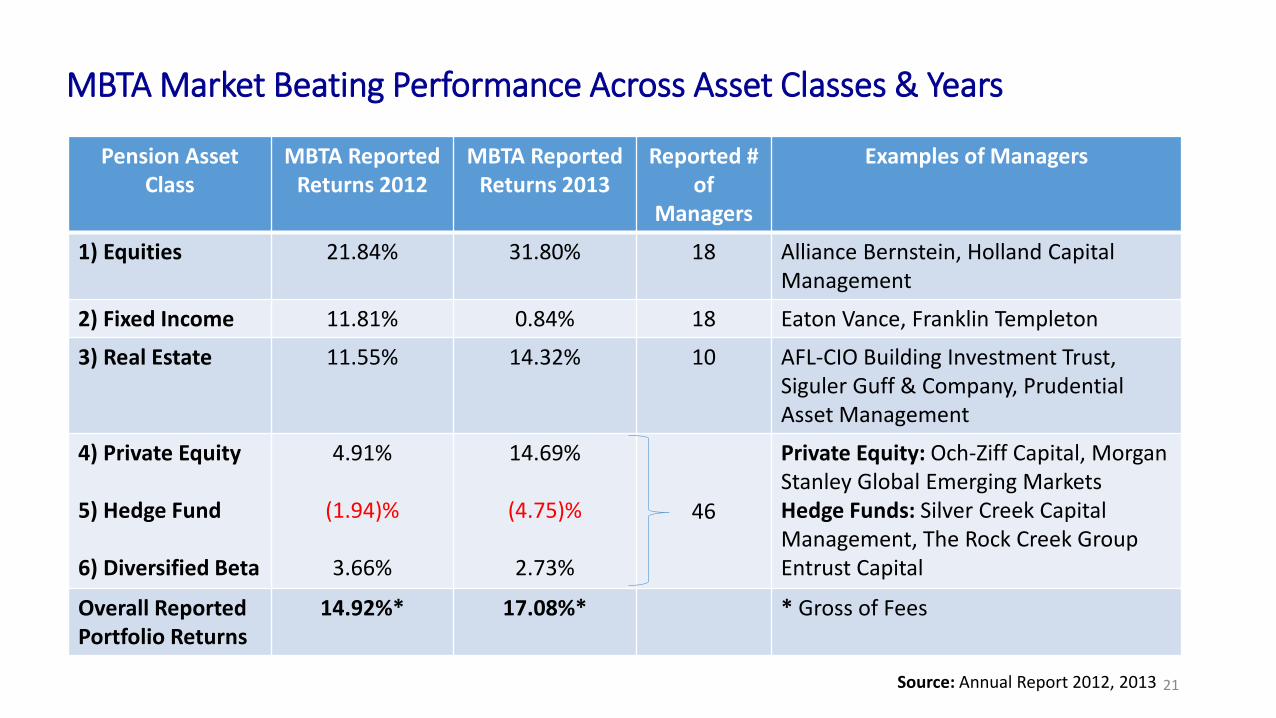
MBTA Market Beating Performance Across Asset Classes & Years
Pension AssetClass
MBTA Reported Returns 2012
MBTA Reported Returns 2013
Reported # of
Managers
Examples of Managers
1) Equities 21.84% 31.80% 18 Alliance Bernstein, Holland Capital Management
2) Fixed Income 11.81% 0.84% 18 Eaton Vance, Franklin Templeton
3) Real Estate 11.55% 14.32% 10 AFL-CIO Building Investment Trust,Siguler Guff & Company, Prudential Asset Management
4) Private Equity
5) Hedge Fund
6) Diversified Beta
4.91%
(1.94)%
3.66%
14.69%
(4.75)%
2.73%
46
Private Equity: Och-Ziff Capital, Morgan Stanley Global Emerging MarketsHedge Funds: Silver Creek Capital Management, The Rock Creek GroupEntrust Capital
Overall Reported Portfolio Returns
14.92%* 17.08%* * Gross of Fees
Source: Annual Report 2012, 2013 21
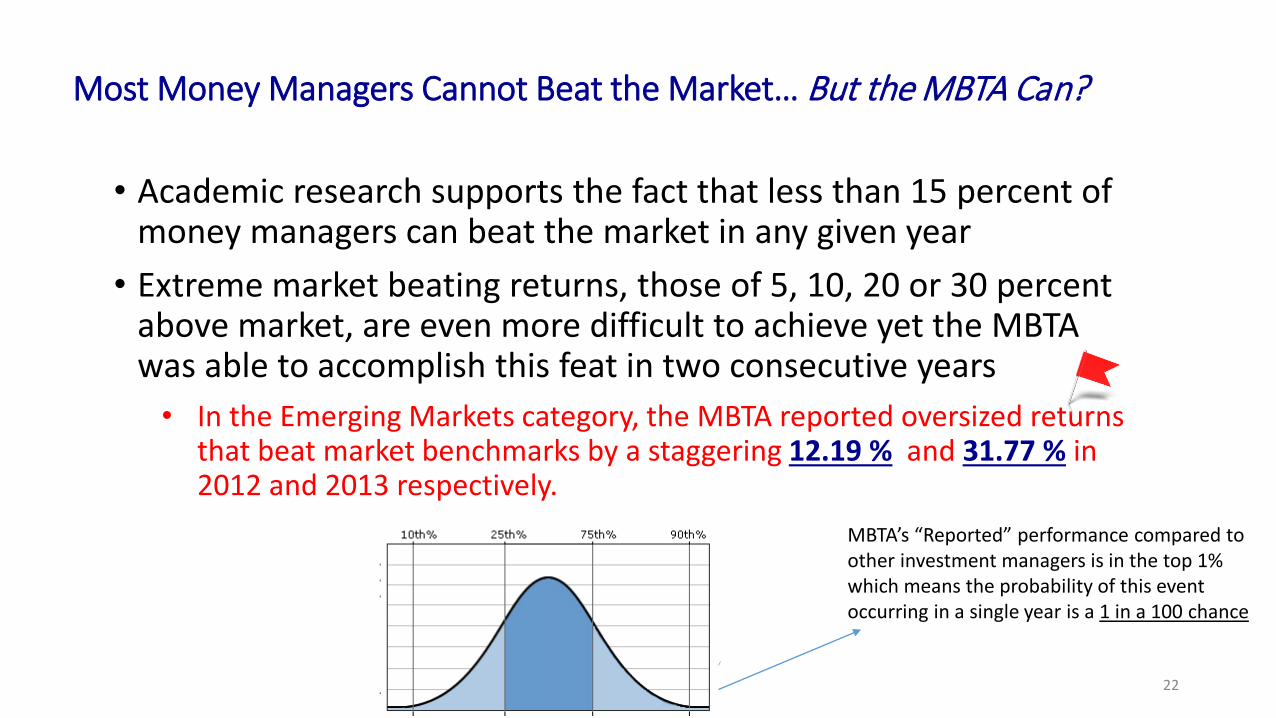
Most Money Managers Cannot Beat the Market… But the MBTA Can?
• Academic research supports the fact that less than 15 percent of money managers can beat the market in any given year
• Extreme market beating returns, those of 5, 10, 20 or 30 percent above market, are even more difficult to achieve yet the MBTA was able to accomplish this feat in two consecutive years
• In the Emerging Markets category, the MBTA reported oversized returns that beat market benchmarks by a staggering 12.19 % and 31.77 % in 2012 and 2013 respectively.
MBTA’s “Reported” performance compared to other investment managers is in the top 1% which means the probability of this event occurring in a single year is a 1 in a 100 chance
22

Highly Unusual - Size and Frequency of Reported Market Beating PerformancePension Asset
ClassMBTA 2012 Reported
Returns BeatMarket (Y/N)
PercentageBeat Market in 2012 (%)
MBTA 2013 Reported
Returns Beat Market (Y/N)
PercentageBeat
Market in 2013 (%)
1) Equity PortfolioCategories
Large Cap EquitiesSmall Cap EquitiesEmerging MarketsInternational
Yes
YesYesYesYes
6.28
4.104.24
12.197.02
Yes
NoNoYesYes
5.63
(.31)(1.05)31.772.05
2) Fixed Income Yes 7.60/1.67* Yes 2.86/.28*
3) Real Estate Yes 1.47 Yes 4.23
4) Private Equity
5) Hedge Fund
6) Diversified Beta
No
(17.94)
(9.61)
(13.77)
No
(9.20)
(14.48)
(11.31)
Source: Annual Report 2012, 2013*applied two separate benchmarks
23
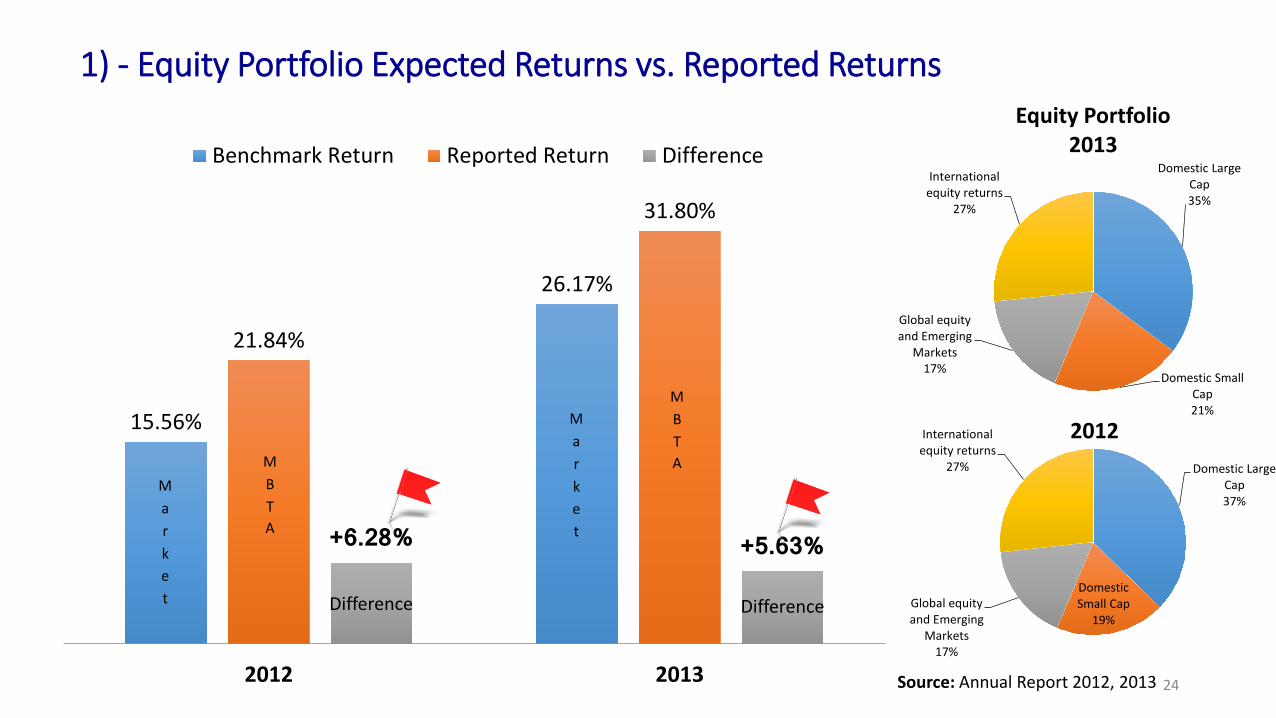
1) - Equity Portfolio Expected Returns vs. Reported Returns
Domestic Large Cap35%
Domestic Small Cap21%
Global equity and Emerging
Markets17%
International equity returns
27%
Equity Portfolio 2013
Domestic Large Cap37%
Domestic Small Cap
19%Global equity and Emerging
Markets17%
International equity returns
27%
201215.56%
26.17%
21.84%
31.80%
+6.28% +5.63%
2012 2013
Benchmark Return Reported Return Difference
Market
Market
MBTA
MBTA
Difference Difference
Source: Annual Report 2012, 2013 24
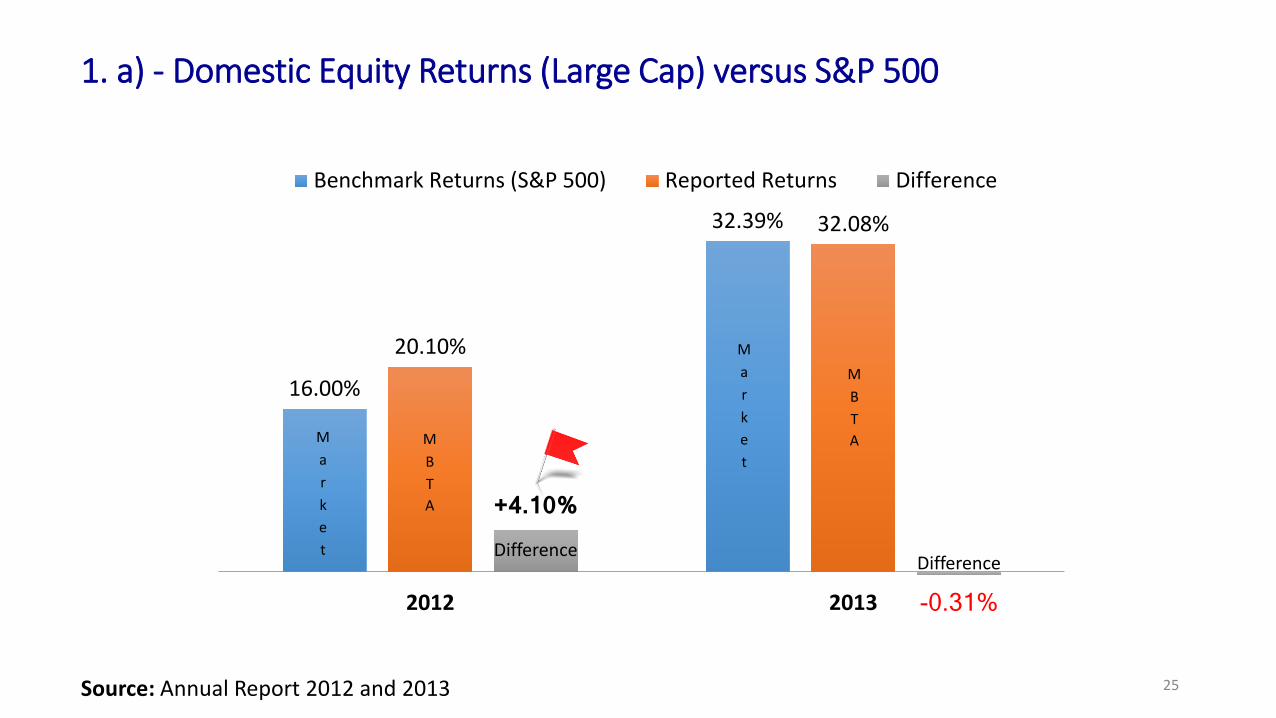
1. a) - Domestic Equity Returns (Large Cap) versus S&P 500
Source: Annual Report 2012 and 2013
16.00%
32.39%
20.10%
32.08%
+4.10%
-0.31%2012 2013
Benchmark Returns (S&P 500) Reported Returns Difference
Market
MBTAM
arket
MBTA
DifferenceDifference
25
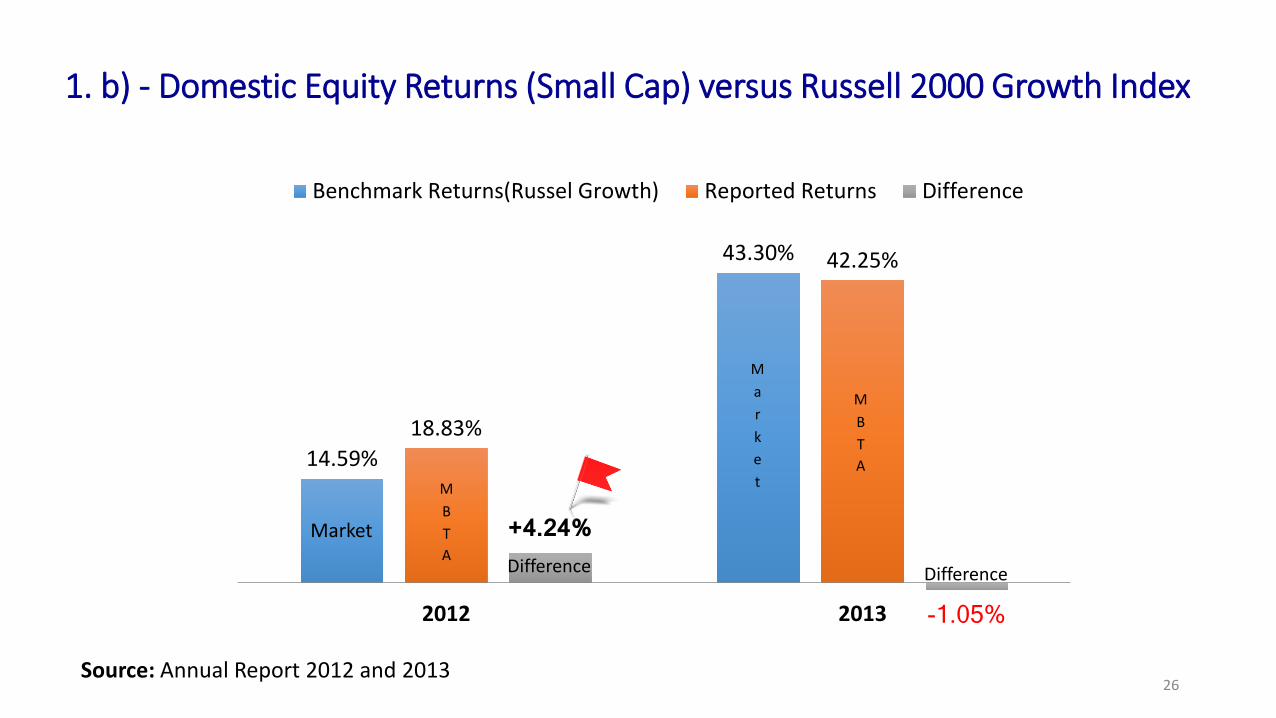
1. b) - Domestic Equity Returns (Small Cap) versus Russell 2000 Growth Index
14.59%
43.30%
18.83%
42.25%
+4.24%
-1.05%2012 2013
Benchmark Returns(Russel Growth) Reported Returns Difference
Source: Annual Report 2012 and 2013
MBTA
MBTA
Market
Market
Difference Difference
26
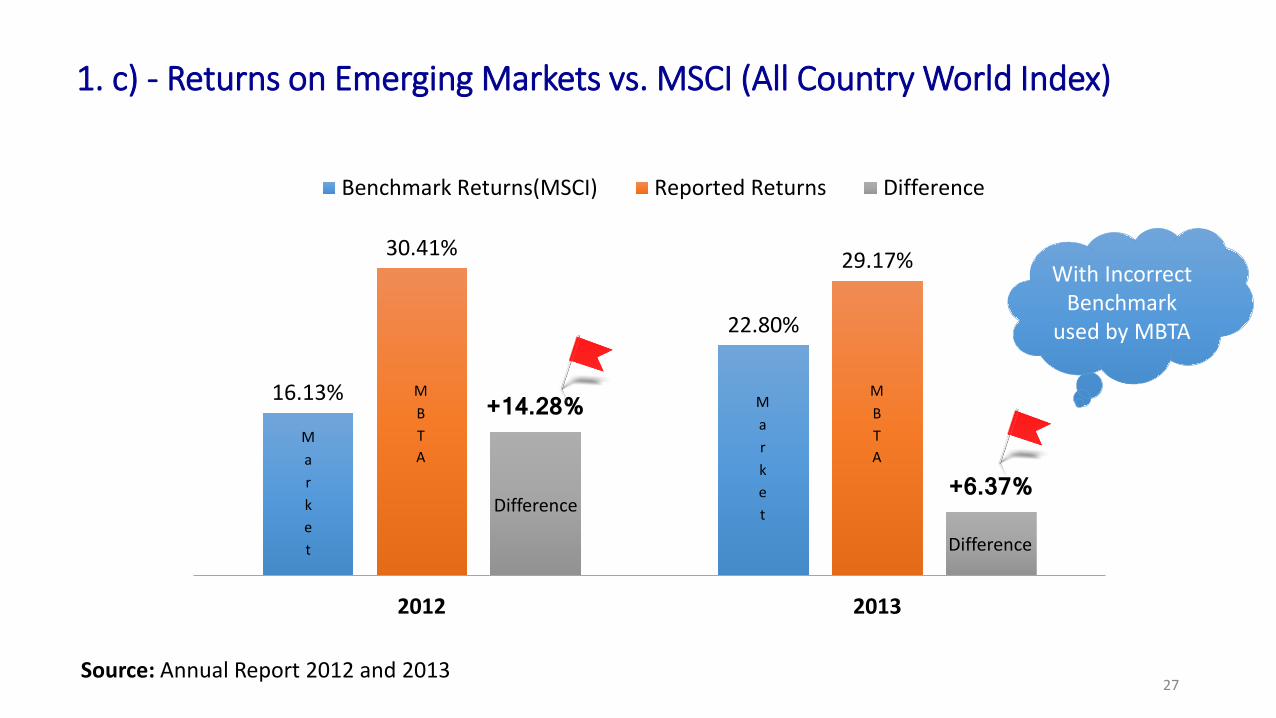
1. c) - Returns on Emerging Markets vs. MSCI (All Country World Index)
16.13%
22.80%
30.41% 29.17%
+14.28%
+6.37%
2012 2013
Benchmark Returns(MSCI) Reported Returns Difference
Source: Annual Report 2012 and 2013
With Incorrect Benchmark
used by MBTA
MBTA
MBTA
Market
MarketDifference
Difference
27
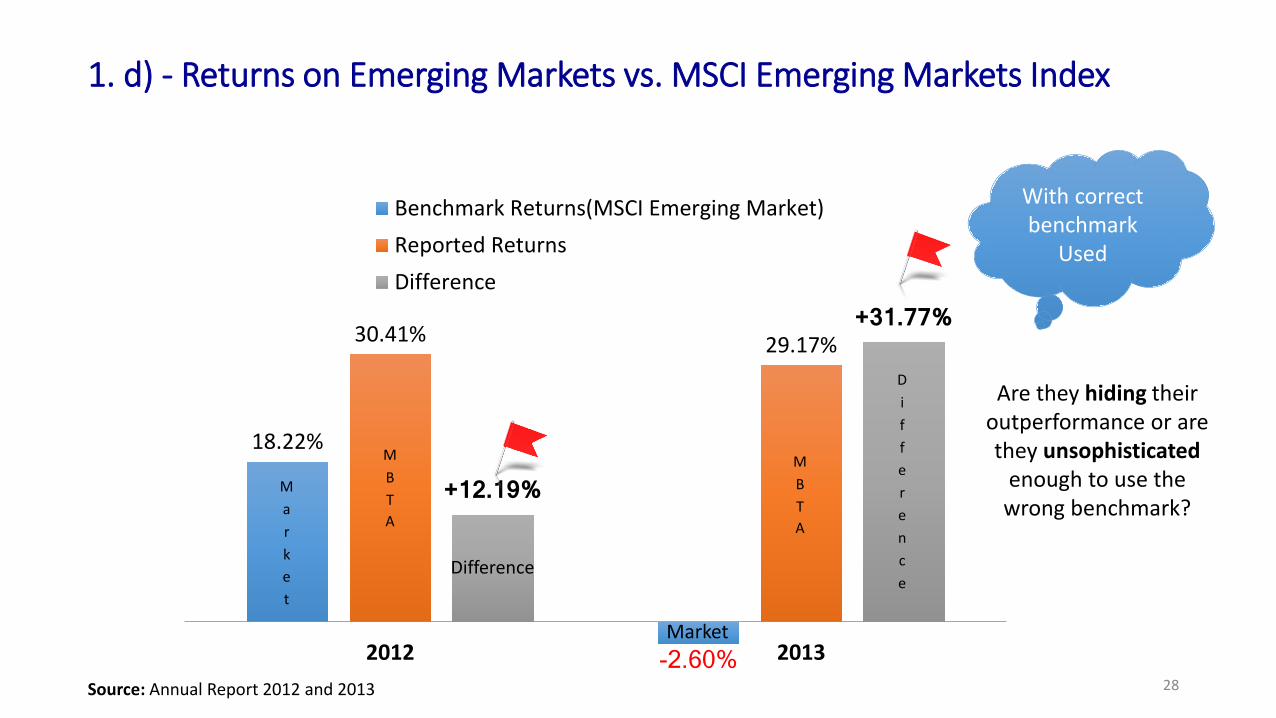
1. d) - Returns on Emerging Markets vs. MSCI Emerging Markets Index
18.22%
-2.60%
30.41% 29.17%
+12.19%
+31.77%
2012 2013
Benchmark Returns(MSCI Emerging Market)Reported ReturnsDifference
With correct benchmark
Used
MBTA
MBTA
Market
Market
Difference
Difference
Are they hiding their outperformance or are they unsophisticated
enough to use the wrong benchmark?
Source: Annual Report 2012 and 2013 28

1. e) - Returns on International Equities vs. Citigroup PMI Index
Source: Annual Report 2012 and 2013
13.96%
22.78%20.98%
24.83%
+7.02%
+2.05%
2012 2013
Benchmark Returns (Barclays Global Aggregate) Reported Returns Difference
Market
MBTA
Market
MBTA
Difference
Difference
29
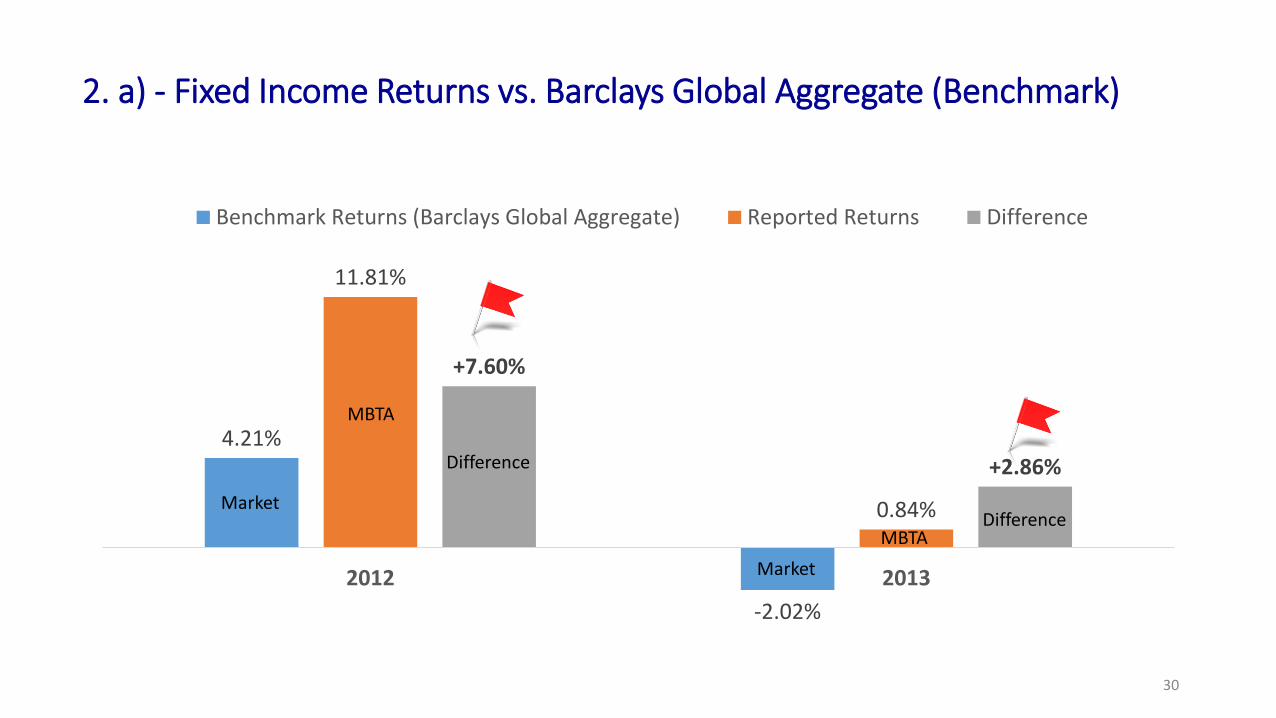
2. a) - Fixed Income Returns vs. Barclays Global Aggregate (Benchmark)
4.21%
-2.02%
11.81%
0.84%
+7.60%
+2.86%
2012 2013
Benchmark Returns (Barclays Global Aggregate) Reported Returns Difference
Difference
DifferenceMarket
Market
MBTA
MBTA
30
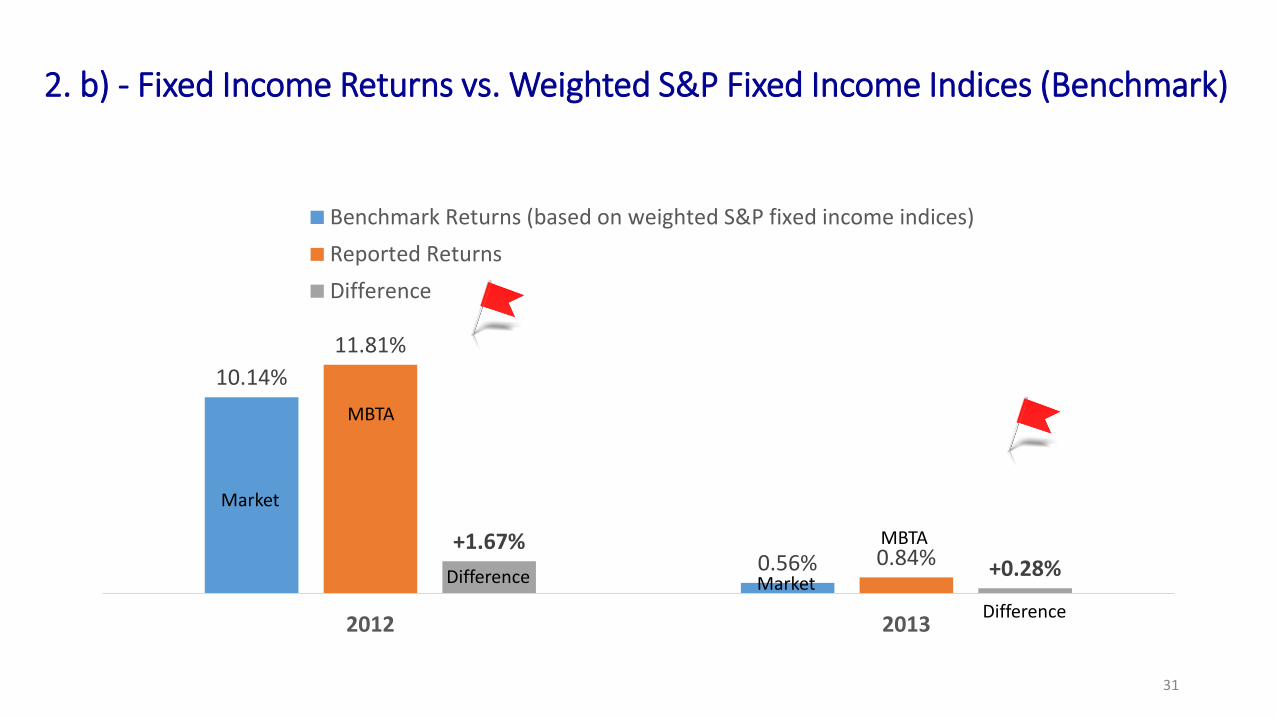
2. b) - Fixed Income Returns vs. Weighted S&P Fixed Income Indices (Benchmark)
10.14%
0.56%
11.81%
0.84%+1.67%
+0.28%
2012 2013
Benchmark Returns (based on weighted S&P fixed income indices)Reported ReturnsDifference
Difference
Difference
Market
Market
MBTA
MBTA
31
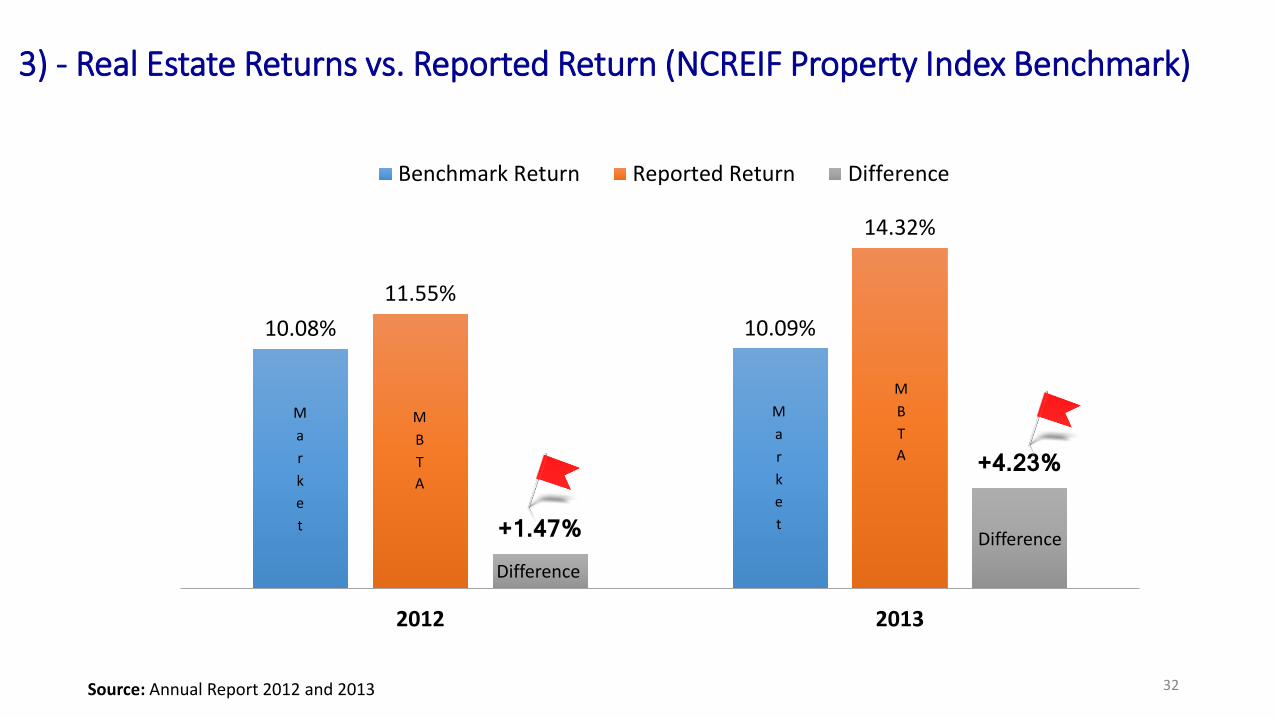
3) - Real Estate Returns vs. Reported Return (NCREIF Property Index Benchmark)
10.08% 10.09%11.55%
14.32%
+1.47%
+4.23%
2012 2013
Benchmark Return Reported Return Difference
MBTA
MBTA
Market
Market
Difference
Difference
Source: Annual Report 2012 and 2013 32
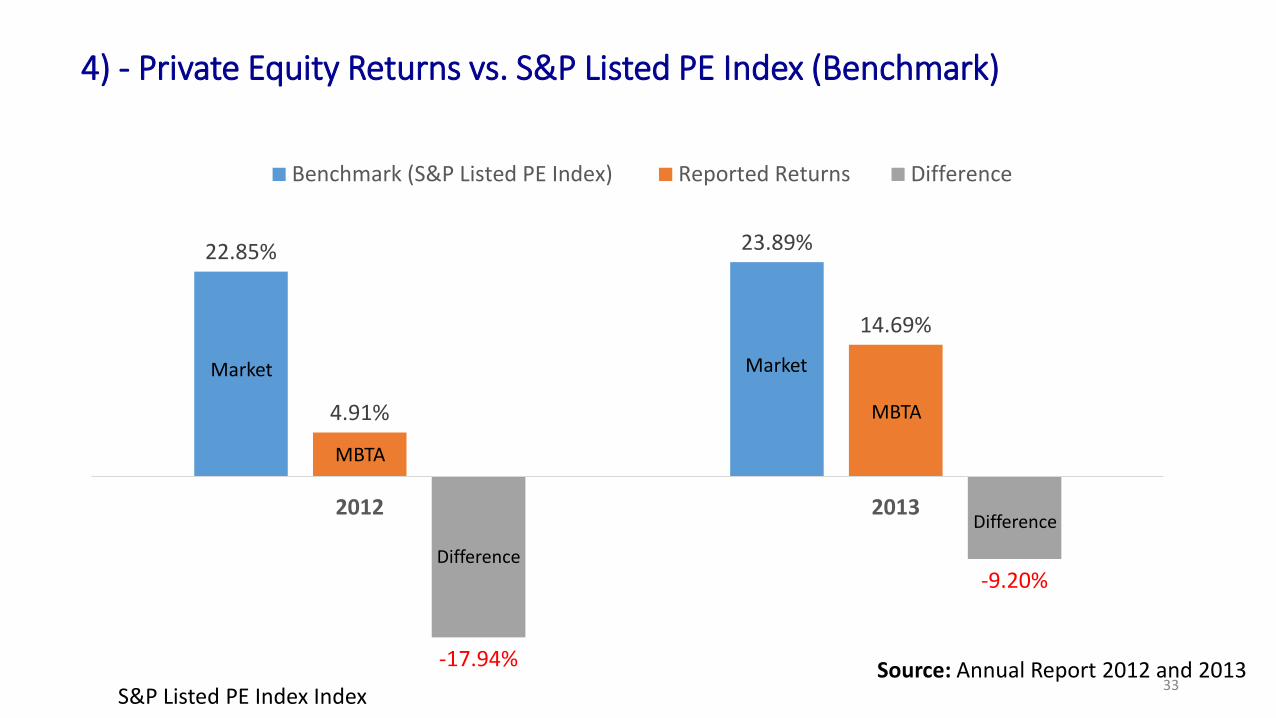
4) - Private Equity Returns vs. S&P Listed PE Index (Benchmark)
Source: Annual Report 2012 and 2013S&P Listed PE Index Index
22.85% 23.89%
4.91%
14.69%
-17.94%
-9.20%
2012 2013
Benchmark (S&P Listed PE Index) Reported Returns Difference
Difference
Market Market
MBTA
MBTA
Difference
33
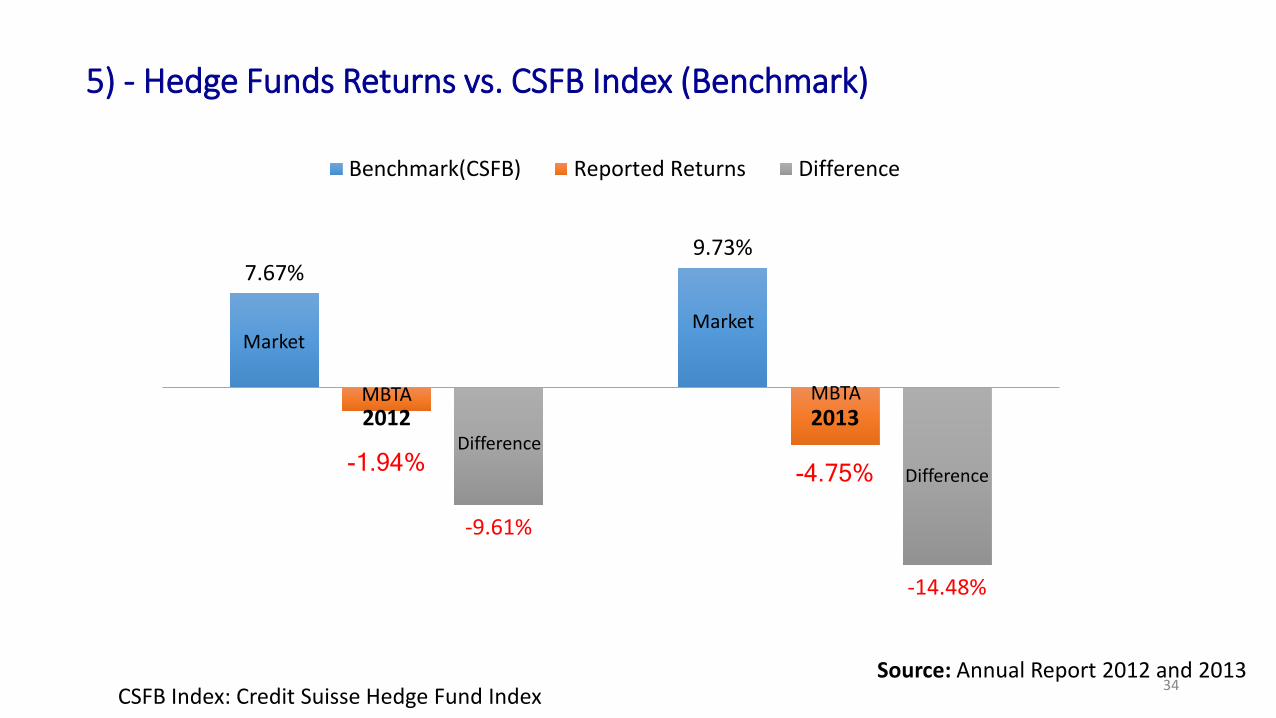
5) - Hedge Funds Returns vs. CSFB Index (Benchmark)
7.67%9.73%
-1.94% -4.75%
-9.61%
-14.48%
2012 2013
Benchmark(CSFB) Reported Returns Difference
Source: Annual Report 2012 and 2013CSFB Index: Credit Suisse Hedge Fund Index
MarketMarket
MBTA MBTA
Difference
Difference
34
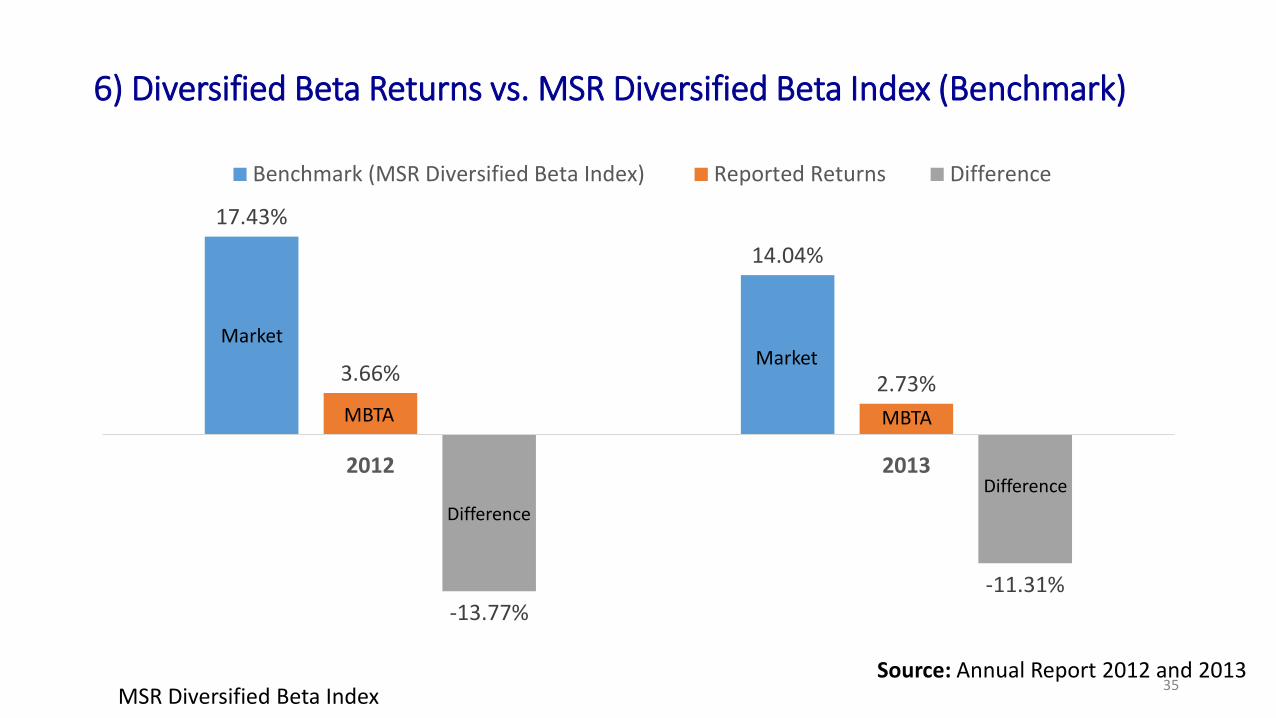
6) Diversified Beta Returns vs. MSR Diversified Beta Index (Benchmark)
Source: Annual Report 2012 and 2013MSR Diversified Beta Index
17.43%
14.04%
3.66% 2.73%
-13.77%-11.31%
2012 2013
Benchmark (MSR Diversified Beta Index) Reported Returns Difference
Difference
MarketMarket
MBTA MBTA
Difference
35
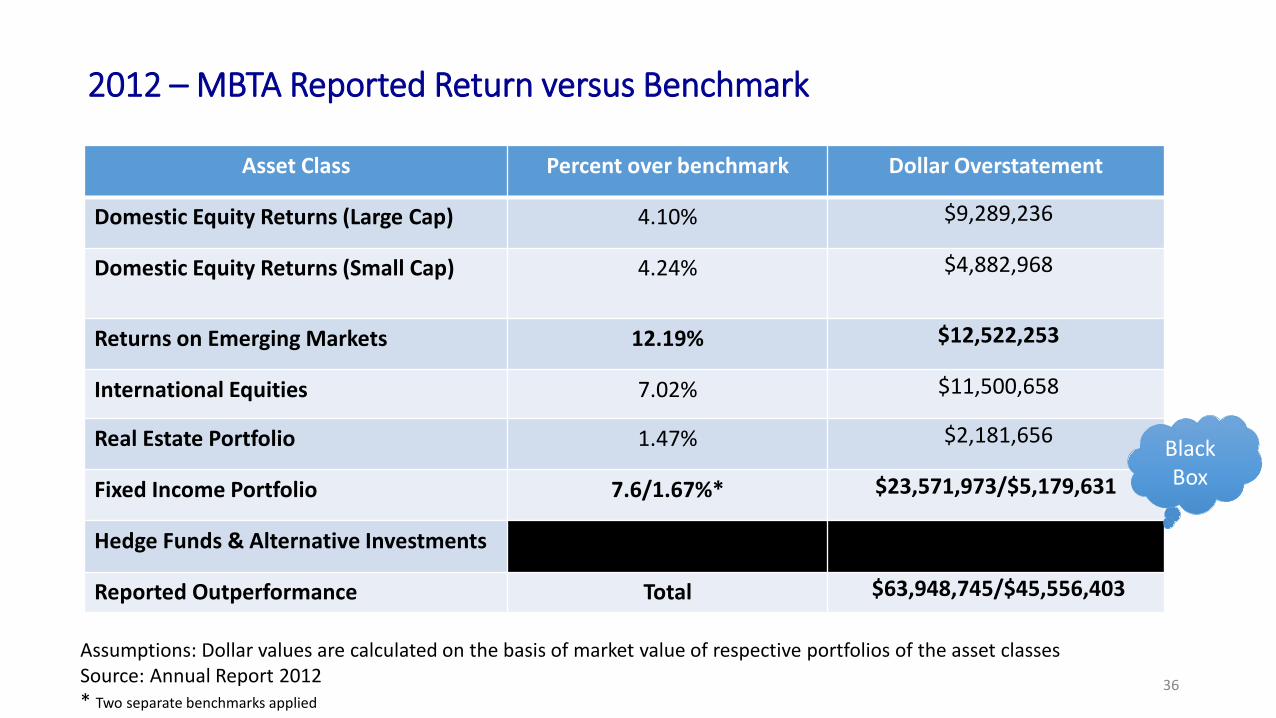
2012 – MBTA Reported Return versus Benchmark
Asset Class Percent over benchmark Dollar Overstatement
Domestic Equity Returns (Large Cap) 4.10% $9,289,236
Domestic Equity Returns (Small Cap) 4.24% $4,882,968
Returns on Emerging Markets 12.19% $12,522,253
International Equities 7.02% $11,500,658
Real Estate Portfolio 1.47% $2,181,656
Fixed Income Portfolio 7.6/1.67%* $23,571,973/$5,179,631
Hedge Funds & Alternative Investments
Reported Outperformance Total $63,948,745/$45,556,403
Assumptions: Dollar values are calculated on the basis of market value of respective portfolios of the asset classesSource: Annual Report 2012 * Two separate benchmarks applied
Black Box
36

2013 – MBTA Reported Return versus Benchmark
Asset Class Percent over benchmark $ Dollar Overstatement
Domestic Equity Returns (Large Cap) -0.31% $(838,533)
Domestic Equity Returns (Small Cap) -1.05% $(1,701,536)
Returns on Emerging Markets 31.77% $41,577,293
International Equities 2.05% $4,194,280
Real Estate Portfolio 4.23% $6,136,953
Fixed Income Portfolio 2.86/0.28% $9,431,375/923,351
Hedge Funds & Alternative Investments
Reported Outperformance Total $58,799,832/$50,291,808 Assumptions: Dollar values are calculated on the basis of market value of respective portfolios of the asset classesSource: Annual Report 2013* Two separate benchmarks applied
Black Box
37
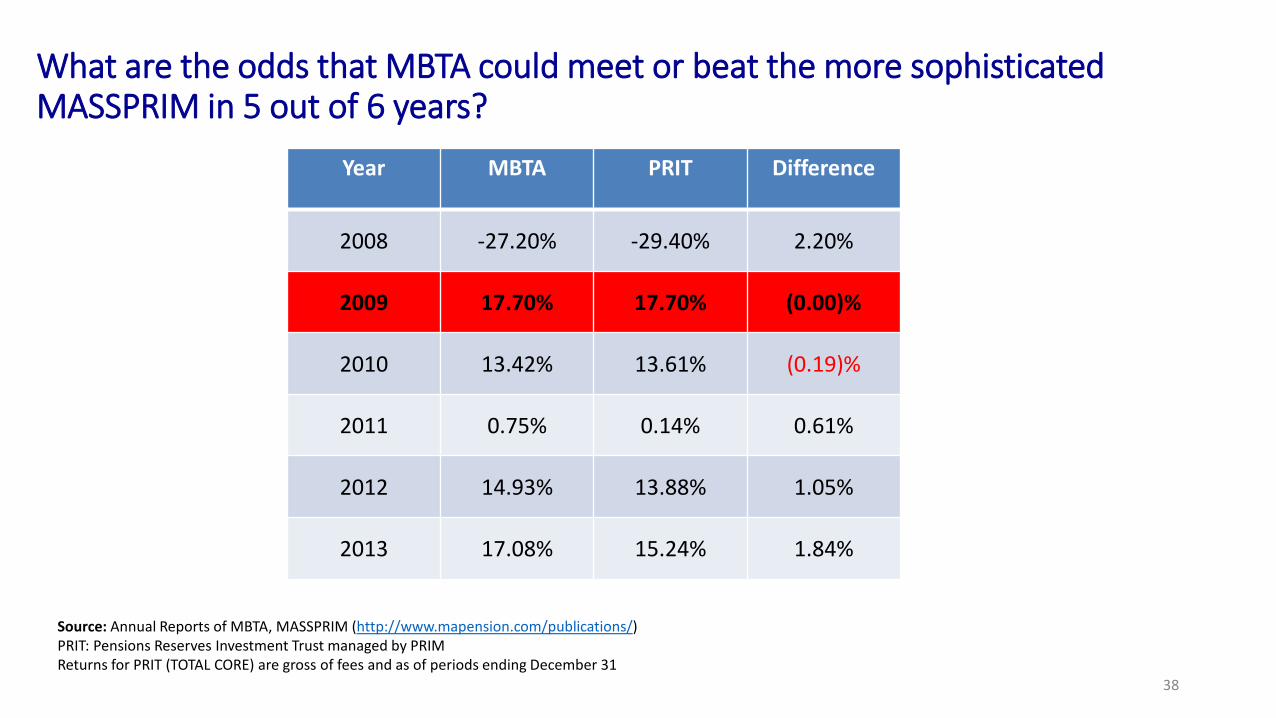
What are the odds that MBTA could meet or beat the more sophisticated MASSPRIM in 5 out of 6 years?
Source: Annual Reports of MBTA, MASSPRIM (http://www.mapension.com/publications/)PRIT: Pensions Reserves Investment Trust managed by PRIMReturns for PRIT (TOTAL CORE) are gross of fees and as of periods ending December 31
38
Year MBTA PRIT Difference
2008 -27.20% -29.40% 2.20%
2009 17.70% 17.70% (0.00)%
2010 13.42% 13.61% (0.19)%
2011 0.75% 0.14% 0.61%
2012 14.93% 13.88% 1.05%
2013 17.08% 15.24% 1.84%
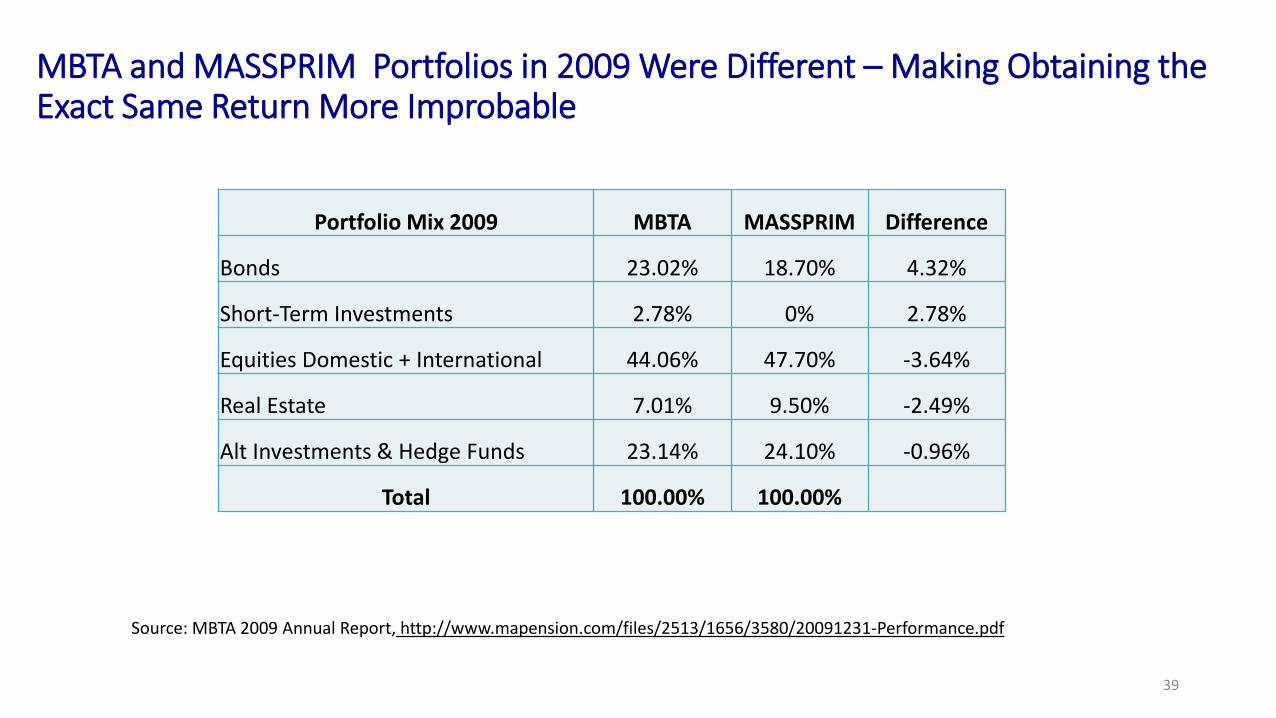
MBTA and MASSPRIM Portfolios in 2009 Were Different – Making Obtaining the Exact Same Return More Improbable
39
Portfolio Mix 2009 MBTA MASSPRIM Difference
Bonds 23.02% 18.70% 4.32%
Short-Term Investments 2.78% 0% 2.78%
Equities Domestic + International 44.06% 47.70% -3.64%
Real Estate 7.01% 9.50% -2.49%
Alt Investments & Hedge Funds 23.14% 24.10% -0.96%
Total 100.00% 100.00%
Source: MBTA 2009 Annual Report, http://www.mapension.com/files/2513/1656/3580/20091231-Performance.pdf
MBTA’s use of an outdated mortality table
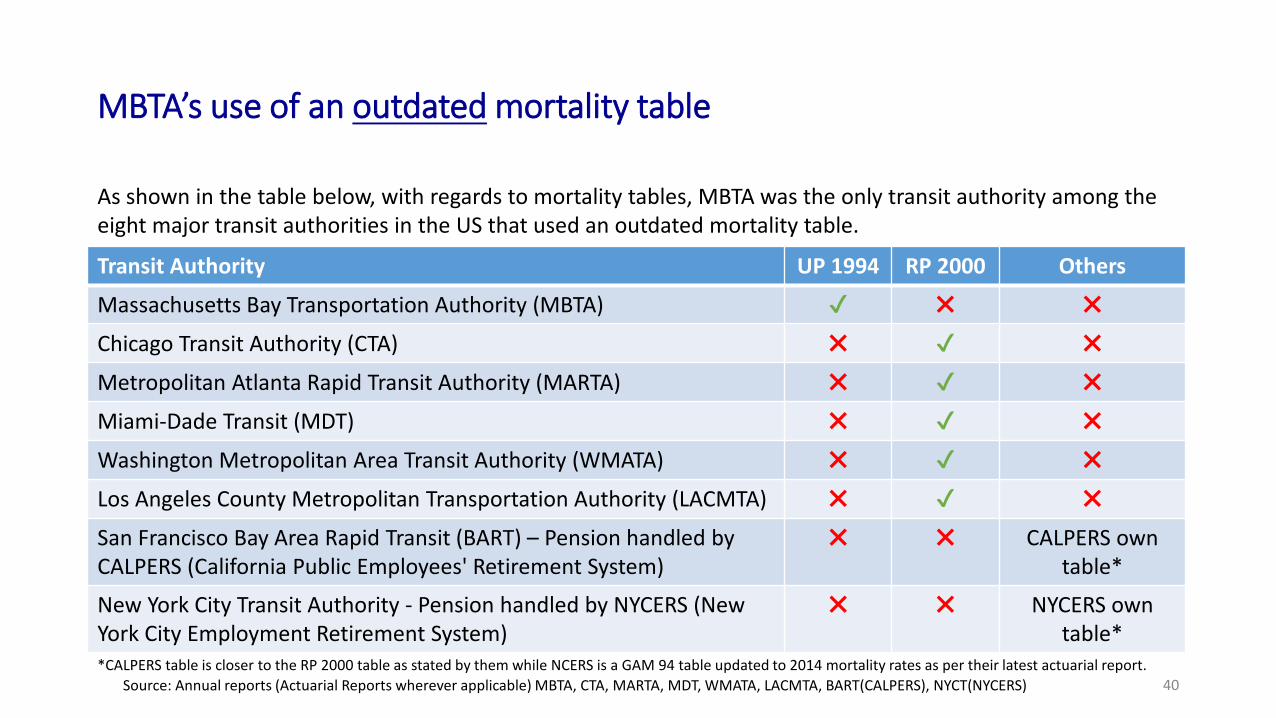
Transit Authority UP 1994 RP 2000 Others
Massachusetts Bay Transportation Authority (MBTA) ✔ ✖ ✖Chicago Transit Authority (CTA) ✖ ✔ ✖Metropolitan Atlanta Rapid Transit Authority (MARTA) ✖ ✔ ✖Miami-Dade Transit (MDT) ✖ ✔ ✖Washington Metropolitan Area Transit Authority (WMATA) ✖ ✔ ✖Los Angeles County Metropolitan Transportation Authority (LACMTA) ✖ ✔ ✖San Francisco Bay Area Rapid Transit (BART) – Pension handled by CALPERS (California Public Employees' Retirement System)
✖ ✖ CALPERS own table*
New York City Transit Authority - Pension handled by NYCERS (New York City Employment Retirement System)
✖ ✖ NYCERS own table*
As shown in the table below, with regards to mortality tables, MBTA was the only transit authority among the eight major transit authorities in the US that used an outdated mortality table.
*CALPERS table is closer to the RP 2000 table as stated by them while NCERS is a GAM 94 table updated to 2014 mortality rates as per their latest actuarial report.Source: Annual reports (Actuarial Reports wherever applicable) MBTA, CTA, MARTA, MDT, WMATA, LACMTA, BART(CALPERS), NYCT(NYCERS) 40
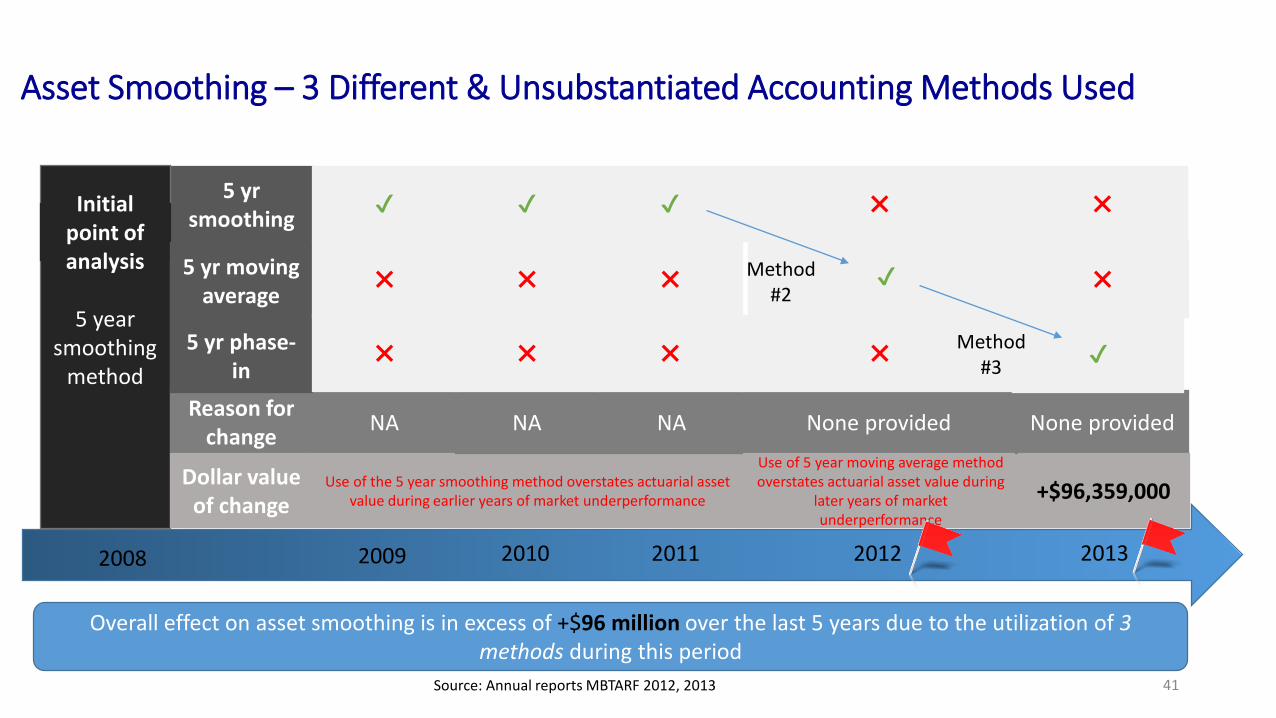
Source: Annual reports MBTARF 2012, 2013
2010 2011 2012
5 yr smoothing
5 year smoothing
method
20092008
✔Initial point of analysis
Reason for change
Dollar value of change
NA
Use of the 5 year smoothing method overstates actuarial asset value during earlier years of market underperformance
✔
NA
✔
NA
✖
None providedUse of 5 year moving average method overstates actuarial asset value during
later years of market underperformance
2013
✖
None provided
+$96,359,000
Overall effect on asset smoothing is in excess of +$96 million over the last 5 years due to the utilization of 3 methods during this period
Asset Smoothing – 3 Different & Unsubstantiated Accounting Methods Used
5 yr moving average
5 yr phase-in
✖ ✖ ✖ ✔ ✖
✖ ✖ ✖ ✖ ✔
Method #2
Method #3
41
MBTA Changed Return Assumptions in the Opposite Direction Than Industry
• Going against the trend, in 2012, the MBTA increased its portfolio return assumption by ½ percent to 8 percent while other pension funds were moving in the opposite direction
• In contrast, by 2013, the Chicago Transit Authority (CTA) and MASSPRIM both decreased their return assumption by ¼ percent.
• This change also set the return assumption at the same rate (8%) as the much bigger and more sophisticated CTA and MASSPRIM. Yet the support for this change was not provided.
• In moving the return assumption estimate up to 8 percent, MBTA reduced the perceived (and not necessarily the actual) amount of contribution that should have been made into the fund.
Source: Annual reports MBTARF 2012, 2013 42
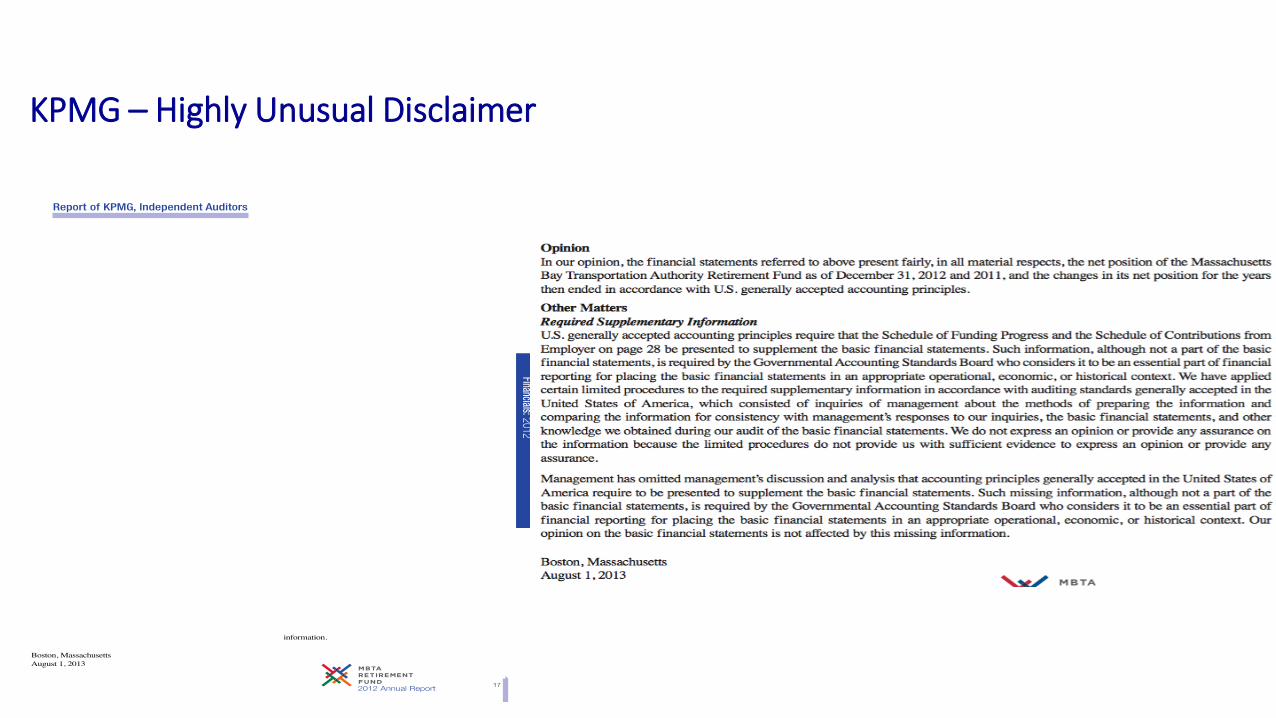
KPMG – Highly Unusual Disclaimer
MBTA Alternatives Managers Under-perform Benchmarks by Wide Margins
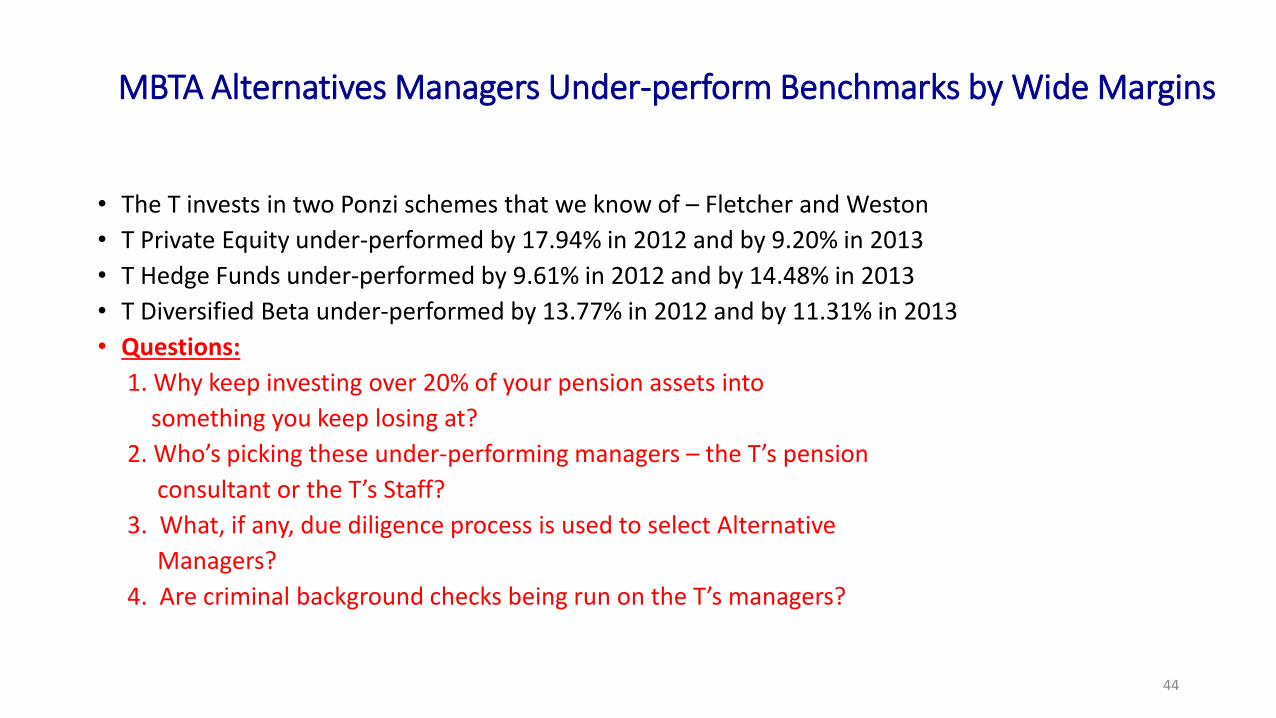
• The T invests in two Ponzi schemes that we know of – Fletcher and Weston• T Private Equity under-performed by 17.94% in 2012 and by 9.20% in 2013• T Hedge Funds under-performed by 9.61% in 2012 and by 14.48% in 2013• T Diversified Beta under-performed by 13.77% in 2012 and by 11.31% in 2013• Questions:
1. Why keep investing over 20% of your pension assets into something you keep losing at?
2. Who’s picking these under-performing managers – the T’s pension consultant or the T’s Staff?
3. What, if any, due diligence process is used to select Alternative Managers?
4. Are criminal background checks being run on the T’s managers?
44