the national campaign for the arts -...
TRANSCRIPT

The National Campaign for the Arts
Arts IndexA measure of the vitality of Arts and Culture in England
2013 Edition
distributed by

2
Welcome to the National Campaign for the Arts 2013 Arts Index
The NCA publishes the Arts Index as a health check of the arts in this country. Of course art can never simply be reduced to a set of figures; assessing the health of any organism is a complex business. But policymakers need to know what’s happening. They need independent and objective information. The Arts Index provides it.
The way the arts are funded in this country is changing. The mixture of private and public support the arts receive is changing. So is the type of public support. Now, more than ever, the Arts Index is needed to track those changes.
The Index is made up of twenty measures; we call them indicators. They measure what goes in, like investment, and what comes out, like audience sizes. The can go up or down, and they’re measured against a base year.
The 2013 edition (including new data for the years 2010/11 and 2011/12) sees both heartening and worrying developments.
The HeadlinesIn the last three years, there have been big gains in Trusts and Foundations’ contributions (up 18), Lottery funding (up 17) and proportion of the adult population both participating in the arts and reporting that experience as high quality (up 7 and 5 respectively).
The big falls have been, as expected, in Treasury funding (down 21), Local Government funding (down 16) and also Business contribution to the arts (down 11).
The twenty indicators can be combined into one overall figure; this year, that figure is slightly up. This is good news; we aren’t here to moan. But the data also allow us to look below the surface, where some interesting trends emerge.
Local government funding for the arts has fallen by 19% in the last three years, a proportion much greater than the savings local authorities have been asked to make. Campaigns such as My Theatre Matters! have recently been set up

3
to question these disproportionate cuts, which perhaps see the arts as a soft touch.
Meanwhile, since the end of the Olympics, the Government has refocused Lottery spend on the original ‘good causes‘ and investment in the arts has gone up. The increase of lottery funding is to some extent making up for the shortfall in Local and Central Government grants. But this may not be sustainable. No lottery lasts for ever, and historically, lottery income can vary hugely depending on the mood of the people.
The Arts Council England’s attitude to Lottery funding is also changing. Their challenge in the past has been to maintain the principle of additionality: that Lottery funding is a very nice ‘and’, but it mustn’t be an ‘or’. While ACE still believe strongly in additionality, Treasury funding has recently been reduced so much that upholding the principle may force ACE to withdraw funds to some arts organisations, which would close. As a result, some Arts Council National Portfolio Organisations may become wholly supported by Lottery funds.
Are there disadvantages to this? Perhaps. The NCA believes that public money brings public accountability and public benefit. A publicly-funded theatre (for instance) belongs to its audience. Lottery funding can threaten the connection with and pride in an arts organisation that local people support through their local authority.
Business contributions, despite government initiatives, continue to fall fast – over 30% in five years. Trusts and Foundations have made up some of the shortfall, but we doubt this is sustainable given pressure on the value of investments.
Although wages and savings are squeezed, there has been a slight increase in the number of adults attending an arts event. We see this as encouraging, and a vindication of the essential place art holds at the centre of a civilised society. Even in an economic downturn – or perhaps particularly in one – people need a good night out.

4
The FutureThe NCA believes the best way to maintain a thriving, profitable, world-renowned arts industry is stable support. Planning for the future becomes impossible if funds are constantly under threat.
We are approaching an election. We would like the Arts Index to inspire debate. We want to begin a conversation about the whole way the arts are funded. On the back of the Index we ask some big questions.
We hope you find them, and the Index itself, provocative and useful.
Samuel West Chair of the NCA
Note:
The 2013 Index includes data for 2010/11 and 2011/12. The Index for 2012/13 will be published in April 2014. This year, we have only compiled figures for England. The NCA would like to report across the four UK nations, but doesn’t yet have the resources. We hope to release a revised version of this edition covering all four UK nations in 2014.
The last Index showed regional data, and highlighted the big discrepancy between London and the regions (Treasury funding of £1.89 in the East of England, for instance, compared to £22.43 in Greater London). Data for the nine English regions are no longer published by the Office for National Statistics and Arts Council England, so regional reporting is not possible after 2011/12. We see this as regrettable, and hope that the publication of the Arts Index will be part of the drive to reintroduce this data collection.

5
BIG QUESTIONS
Planning for the Future: Lottery funding is no longer icing, it’s cake. In order for the arts to hedge against historic volatility of lottery funding, is it right to have a fixed percentage of public spending (say 0.1%) made up of Lottery and Treasury funding, however constituted?
Statutory funding: Should some kind of arts provision become statutory for Local Authorities? Perhaps there is a middle ground between completely discretionary and statutory? The pattern of 100% cuts started by Somerset must not continue.
Match Funding: Should a Local Authority get more access to Lottery money for Local Government activities in its area if it matches that in funding for the arts?
Naming and Shaming: Would it be useful to publish a list of councils that spend the least on arts funding for their citizens? And a corresponding list of those who spend the most?
What should we spend? What is a reasonable investment by Local Authorities in the arts and culture? What do the public think their local councils should be investing per person in these challenging times?
Where should the money come from? There seems to be a fundamental shift taking place in the proportion of funding for the arts coming from national government, local government and the Lottery. How can this transition be managed to ensure that everyone in England still has access to great art?
Will reserves last? The Index is holding steady but combined Reserves of arts organisations are going down. Are we heading for a crisis when all the money prudently saved in better times is spent?
Is philanthropy working? This Government has placed its focus on increasing business sponsorship and individual giving for the arts. Has this policy failed, or would the figures have been considerably worse without the new initiatives in this area?

6
Can Trusts and Foundations plug all the gaps? We are seeing a greater dependency on arts funding from Trusts and Foundations. Is this sustainable?
How do we keep the good stuff going? Despite the economic climate, indicators related to the public’s engagement with arts are going up: more people are taking part in the arts and a higher proportion are reporting a positive experience. How do we ensure this momentum continues?

7
ABOUT THE INDEX
What is an index?‘A measure of the value of a variable relative to its value at some base date or state’ – The Oxford Dictionary of Statistics.
An index allows us to understand how something being observed has changed. In the Arts Index, this change has now been measured over a five-year period.
An index also allows people to compare a number of different sources of information on the same scale, often set so that its base value is 100. That is the approach used here.
If a particular figure increases over time then the corresponding index will increase, and if a figure decreases the index will drop. From the index you can gauge the extent of change. For example, if the index increases from 100 to 125 then this represents a 25% increase; if it drops to 75, this represents a drop of 25%.
Building an index about the UK arts sectorThe first UK Arts Index covered three financial years from 2007/08 to 2009/10. It brought together a number of different sources of information, in a way that allowed comparisons to be made between these years across the English regions, across the four nations and across the UK as a whole.
There are twenty separate indicators that feed into the Index, each of which has been chosen because it gives us insight into the health and vitality of the arts sector. The indicators are grouped together into seven categories. The diagram on the next page shows the relationship between these different financial, economic, cultural and community inputs and outputs.

8
NCAARTSINDEX
FinancialInputOther
FinancialInputPublic
Funding
Non-FinancialInput
FinancialInput/Output
Cultural/CommunityOutput –
Attendance &Participation
Cultural/Community
OutputSatisfaction
FinancialOutput
How these indicators are used in the UK Arts IndexTo arrive at the score for each indicator, the figures behind them have been compared to the base UK figures for 2007/08. Where this data wasn’t available, two rules have been applied:
1. The earliest year available for the data is the base year. In most cases this is 2007/08.
2. If data is available from an earlier year but gaps exist in later years then the data has been brought forward to fill the gaps. This keeps the Index as comparable as possible across the years.
Where either of the above rules has been applied, we note and elaborate on this.
This approach means that the Index has been built using best practice, while acknowledging that the data is not complete in every area.

9
Weighting the IndexWe have considered the following specific variables when creating the Index:
- Population at each geographical level has been taken into account so that areas can be compared ‘like for like’.
- Financial figures across the years have been adjusted to take account of inflation using the Consumer Price Index (CPI).
There is no weighting applied to the data in terms of how the twenty indicators are combined to create the overall Index; each of the indicators contributes an equal 1/20 of the input.
The 2013 IndexThe original Index published in 2011 was published after a year of complex research and analysis across the four UK nations by the NCA, Audiences UK and, in the latter stages, Audiences London.
An anecdotal indicator of the changes in the arts sector in the two years since is the changes in these organisations: neither the NCA nor Audiences UK now employs permanent staff and Audiences London is now part of The Audience Agency.
The research for this updated English edition of the Index has been produced by NCA volunteers steered by David Brownlee, who as the former Chief Executive of Audiences UK led the work on the original Index.
The original Index reported across the four UK nations as well at a regional level in England. The NCA aspires to produce the Index in this level of detail in the future, but requires additional financial resources to do so. It is hoped that a revised version of this report covering all four UK Nations can be released in 2014.
It should also be noted that regional reporting in England will become impossible after 2011/12; key bodies who provide data, such as the Office for National Statistics and Arts Council England, no longer publish that data for the nine historically recognised English regions.

10
The NCA BoardThis edition of the Arts Index has been produced by the National Campaign for the Arts Research and Education’s new Board of unpaid volunteers:
• Samuel West (Chair), Actor and Director
• Ruth Mackenzie CBE, previously Director of the London 2012 Cultural Olympiad; now Interim Launch Director of The SPACE and Artistic Director Designate of the Holland Festival.
• Bob & Roberta Smith, Visual Artist
• Peter Manning, Conductor and Violinist
• Leonora Thomson, Director of Audiences and Development at the Barbican
• Julia Payne, Director of The Hub, an arts and creative enterprise development practice
• David Brownlee, Executive Director of the TMA (which will be renamed the UK Theatre Association in January 2014)
In this new edition of the Index, each of the NCA’s Directors has contributed reflections on some of the Indicators. These are meant to put some flesh on the Index’s bones; without turning into Cassandras, we nevertheless wanted to express our hopes and fears for the future. The comments are personal and do not necessarily reflect the views of the NCA Board as a whole or of the organisations we work for.

11
THE OVERALL INDEX FOR ENGLAND
2007/08
2008/09
2009/10
2010/11
2011/12 107
102
106
101
99
0 20 40 60 80 100 120 140 160
The overall Index for England increased in 2008/09 and 2009/10. It dipped in 2010/11 but rose again in 2011/12 to 107, slightly ahead of the overall figure for 2009/10 when the Index was last published.
While overall changes across the 20 indicators have been slight, there have been major fluctuations in many individual indicators.

12
Summary of changes in England since the last Index was published*
14Proportion of adult population ‘digitally’ attending and/or participating in an arts activity
+20
6 Trusts and Foundation contributions to the arts per person +18
2 Lottery Funding for the arts per person +17
12 Proportion of adult population participating in an arts activity +7
15Proportion of adult population reporting that their last arts experience was of a ‘High Quality’
+5
11 Proportion of adult population attending an arts activity +2
4 Earned Income by revenue funded Arts Organisations per person +2
13Proportion of children and young people attending and/or participating in an arts activity
+1
7 Individual Giving to the arts per person (Philanthropy) +1
16 Satisfaction with Local Provision -
8HE Students studying Creative Arts as %age of population (UK Figures)
-0
17 Income from West End Theatre -3
10 Combined Reserves of Regularly Funded Organisations per person -6
18Combined expenditure of Regularly Funded Organisations per person
-7
5 Business Contributions to the arts per person -11
3 Local Government Funding for the arts per person -16
1 National Treasury Funding for arts councils per person -21
* = indicators 9, 19 and 20 are based on samples where statistically insignificant changes may have a large impact on their Index scores and are therefore not included in this summary table.

13
FINANCIAL INPUTS – PUBLIC FUNDING
This category contains three indicators:
1. Treasury Funding for arts councils per person
2. Lottery Funding for the arts per person
3. Local Government Funding for the arts per person
Combined score for this category
2007/08
2008/09
2009/10
2010/11
2011/12
0 20 40 60 80 100 120 140 160
The combined score is worked out by adding together the funding per head for each year across the three indicators and comparing it to the 2007/08 figure.
In England the cumulative amount per person invested from these three sources continued to grow until 2009/10, when it reached an inflation adjusted £19.64 (boosted by Arts Council England Sustain funding). It then fell by almost £2 to £17.68 in 2010/11 and by a further £1.26 to £16.42 in 2011/12.

14
Indicator 1: Treasury Funding for arts councils per person
2007/08
2008/09
2009/10
2010/11
2011/12
0 20 40 60 80 100 120 140 160
What the indicator tells usAfter it remained constant for the first three years of the Index, inflation adjusted Treasury funding dropped from £8.24 in 2009/10 to £7.57 in 2010/11 and then again to £6.49 in 2011/12. This represents one of the biggest falls of any indicator in the Index.
Calculating the scoreThe score is based on money per person per year. The 2007/08 baseline was calculated by taking Grant in Aid figures from in the Annual Reports of all four of the UK’s national Arts Councils, divided by the population for each nation in that year (based on UK National Statistics). Financial values stated are adjusted so that they are comparable with 2007/08 prices, using the Consumer Price Index. It should be noted that this does not represent the entirety of national government investment in the arts in England as DCMS makes direct grants to a number of institutions.

15
“It’s very difficult to get a real picture of what’s happening to national arts funding when so many different figures are quoted. The Arts Index has always divided Lottery and Treasury funding; the Government now likes to quote them together. Our figures have always only included the ‘arms-length’ funding from government to arts councils rather than direct grants they make themselves, including large revenue grants to organisations like the Tate and the National Gallery. Although it is only part of the funding picture, there is no doubt that funding to Arts Council England has dropped considerably in real terms in both 2010/11 and 2011/12.” – Ruth Mackenzie

16
Indicator 2: Lottery Funding for the arts per person
2007/08
2008/09
2009/10
2010/11
2011/12
0 20 40 60 80 100 120 140 160
What the indicator tells usFigures for Lottery Funding are based on when funds were awarded rather than spent. There is large variability across years, partly to do with when major funding programmes are announced. However we can already see from data published for 2012/13 that the increase in 2011/12 is sustained and even enhanced. This is largely due to Lottery funding of the 2012 Olympics coming to an end and a shift in Government policy to increase the proportion of Lottery funding being allocated to the original good causes, including the arts.
Calculating the scoreData for this indicator has been taken from the Department for Culture, Media & Sport (DCMS) Lottery database, and includes arts grants made by all distributing bodies, not just the Arts Councils.
There is some variation in the figures in the original Index because some grants are geographically specific and others UK-wide. To maintain consistency, the only figures included for England in this report are those that the database tags to a specific area. This is one reason why the figures in the Index cannot be compared to the amount of Lottery funding reported as distributed in Arts

17
Council England’s Annual Reports. It should also be noted that the DCMS Lottery database reports on when a grant is offered, not when the money is spent. For some programmes, such as Capital, there may be a lag of several years between the award and use of funding.
“Anyone who cares about the arts will be delighted that the Government has refocused Lottery funding back to the original four ‘good causes’. With the end of the Olympics and Lottery sales going up in financially challenging times, Lottery funding is becoming ever more important. Government controls how much Grant in Aid it distributes but it can’t control how many Lottery tickets are sold. An economic recovery is likely to mean fewer people buying Lottery tickets and therefore a cut in funding to the arts. Can this be right?” – Samuel West

18
Indicator 3: Local Government Funding for the arts per person
2007/08
2008/09
2009/10
2010/11
2011/12
0 20 40 60 80 100 120 140 160
What the indicator tells usCumulative local government funding for the arts in England rose until 2009/10 when it dropped from an inflation adjusted £9.59 per person per annum to £9.29. There was a further steeper fall to £8.77 in 2010/11 and a steeper fall still to just £7.53 in 2011/12. This fall of over 20% is hugely disproportionate to the cuts local government has had to make during this period.
Calculating the scoreThe way that Local Government income and expenditure figures are expressed across the UK nations varies. The categorisations of types of funding that were used to create the 2007/08 UK baseline were:
– England: Arts development and support / Museums and galleries / Theatres and public entertainment.
– Scotland: Museums and art galleries / Other culture and heritage.
– Wales: Museums and art galleries / Arts development and support / Theatres and public entertainment.
– Northern Ireland: Arts development and support.

19
In all cases we used the net expenditure, excluding Capital Charges to calculate the baseline and annual changes, dividing this by the population numbers in that year. Figures for Scotland were higher because they include all culture and heritage spending, not just arts spending.
“Local Government has been the unsung hero of arts funding in the UK for many decades, providing support for cultural activities in local communities long before a national arts council was established. This long history is being threatened all over the country as the threat of ‘cultural desertification’ spreads from hard-pressed District Councils into larger authorities and even some of our major cities. Where increased Lottery funding is helping to fill the gaps in national funding, there is no quick fix to replace the investment of Local Authorities in the cultural life of their local communities.” – David Brownlee

20
FINANCIAL INPUTS – OTHER
This category contains four indicators:
4. Earned Income by revenue funded arts organisations per person
5. Business Contributions to the arts per person
6. Trust and Foundation Contributions to the arts per person
7. Individual Giving to the arts per person
Combined score for this category
2007/08
2008/09
2009/10
2010/11
2011/12
0 20 40 60 80 100 120 140 160
The combined score is worked out by adding together the income in England per head for each year across the four indicators and comparing it to the 2007/08 figure for the UK.
During the baseline year (2007/08) England outperformed the rest of the UK in this category, with a combined total of £12.09 per person. Adjusting for inflation, this fell for the following three years. In 2011/12 there was a small increase from £10.60 to £10.89 largely thanks to an increase in income from Trusts and Foundations.
21
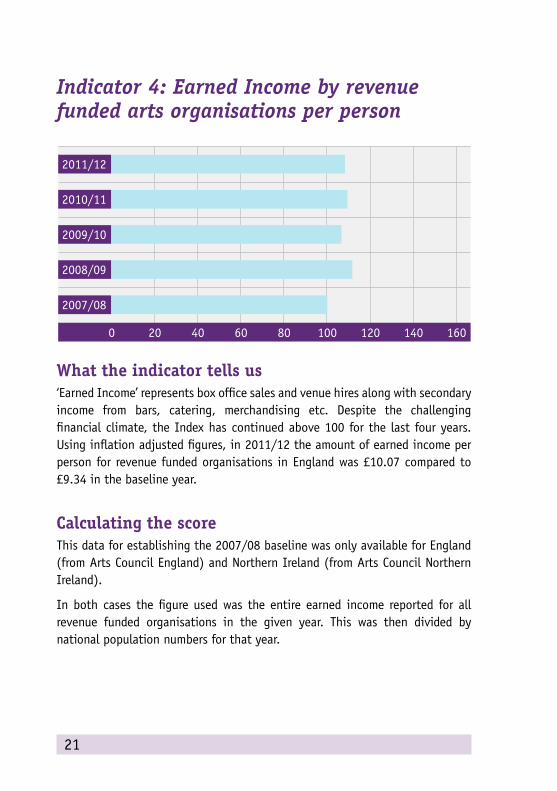
Indicator 4: Earned Income by revenue funded arts organisations per person
2007/08
2008/09
2009/10
2010/11
2011/12
0 20 40 60 80 100 120 140 160
What the indicator tells us‘Earned Income’ represents box office sales and venue hires along with secondary income from bars, catering, merchandising etc. Despite the challenging financial climate, the Index has continued above 100 for the last four years. Using inflation adjusted figures, in 2011/12 the amount of earned income per person for revenue funded organisations in England was £10.07 compared to £9.34 in the baseline year.
Calculating the scoreThis data for establishing the 2007/08 baseline was only available for England (from Arts Council England) and Northern Ireland (from Arts Council Northern Ireland).
In both cases the figure used was the entire earned income reported for all revenue funded organisations in the given year. This was then divided by national population numbers for that year.

22
“The increase in this figure is to be welcomed but is it disappointingly small, given the increased emphasis on selling tickets for shows and creating popular related products to sell? Conversion rates in cafes could be expected to be better given the improvement in these facilities and the new importance given to earned income. In a recession, is the capacity for institutions to replace or supplement grant in aid more limited than we might have been led to believe?” – Bob & Roberta Smith

23
Indicator 5: Business Contributions to the arts per person
2007/08
2008/09
2009/10
2010/11
2011/12
0 20 40 60 80 100 120 140 160
What the indicator tells usThe inflation adjusted decline in Business Contributions to the arts in England has been continual throughout the five years of the Index. The drop in 2011/12 was in fact the smallest to date, but despite Government initiatives to encourage greater sponsorship the sector has seen a 30% drop in five years. The per capita figure per person fell from £2.70 in 2007/08 to a low of £1.88 in 2011/12.
Calculating the scoreThe data for establishing this benchmark came from Arts & Business’ Benchmarking Tool for the UK, dividing the overall figure by the UK population. This data refers to contributions made not just to the arts, but also to heritage, libraries and archives.
“Even the efforts of Secretaries of State haven’t stopped a huge and ongoing decline in sponsorship for culture; we know from Arts & Business’ figures that raising sponsorship is even harder outside London and the South East.” – Julia Payne
24
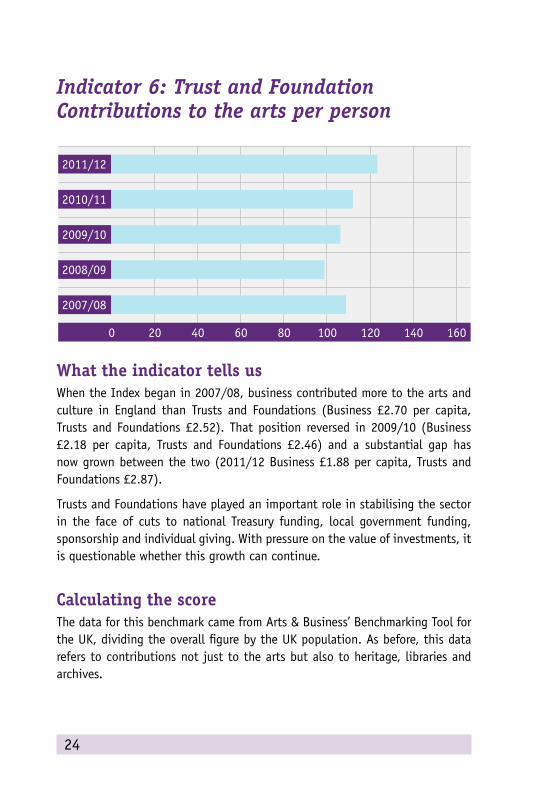
Indicator 6: Trust and Foundation Contributions to the arts per person
2007/08
2008/09
2009/10
2010/11
2011/12
0 20 40 60 80 100 120 140 160
What the indicator tells usWhen the Index began in 2007/08, business contributed more to the arts and culture in England than Trusts and Foundations (Business £2.70 per capita, Trusts and Foundations £2.52). That position reversed in 2009/10 (Business £2.18 per capita, Trusts and Foundations £2.46) and a substantial gap has now grown between the two (2011/12 Business £1.88 per capita, Trusts and Foundations £2.87).
Trusts and Foundations have played an important role in stabilising the sector in the face of cuts to national Treasury funding, local government funding, sponsorship and individual giving. With pressure on the value of investments, it is questionable whether this growth can continue.
Calculating the scoreThe data for this benchmark came from Arts & Business’ Benchmarking Tool for the UK, dividing the overall figure by the UK population. As before, this data refers to contributions not just to the arts but also to heritage, libraries and archives.

25
“As other sources of funding have retreated, trusts and foundations may have filled important gaps. The question is, is this a short term effect or will trusts be able to sustain long-term support of organisations and events?” – Bob & Roberta Smith

26
Indicator 7: Individual Giving to the arts per person
2007/08
2008/09
2009/10
2010/11
2011/12
0 20 40 60 80 100 120 140 160
What the indicator tells usThroughout the period of the Index to date, cumulative individual contributions in England have been greater than the figures for Business and Trusts and Foundations combined. After a major drop from £6.27 per person in 2007/08 to £5.38 in 2009/10, fortunes in this area of seem to have stabilised and begin to improve in the last two reported years. This period saw increased government-led encouragement of philanthropy and the launch of new funding schemes to support arts organisations in this area.
Calculating the scoreThe data for establishing this benchmark came from Arts & Business’ Benchmarking Tool for the UK, dividing the overall figure by the UK population. As before, this data refers to contributions made not just to the arts, but also to heritage, libraries and archives.

27
“We should remember that this figure represents a huge belief in the arts on the part of generous individuals. But does a +1 increase represent the shift in a culture of giving that was hoped by Jeremy Hunt and Ed Vaizey? Does the recession and financial crisis mean that there is just not the money around to sustain and grow organisations from these wealthy individuals?” – Bob & Roberta Smith

28
NON-FINANCIAL INPUTS
This category contains two indicators:
8. Higher Education Students Studying Creative Arts as a percentage of population
9. Adults Volunteering in the arts as a percentage of population
Because of concerns about the quality of the data for volunteering a summary table is not included in this section.
29
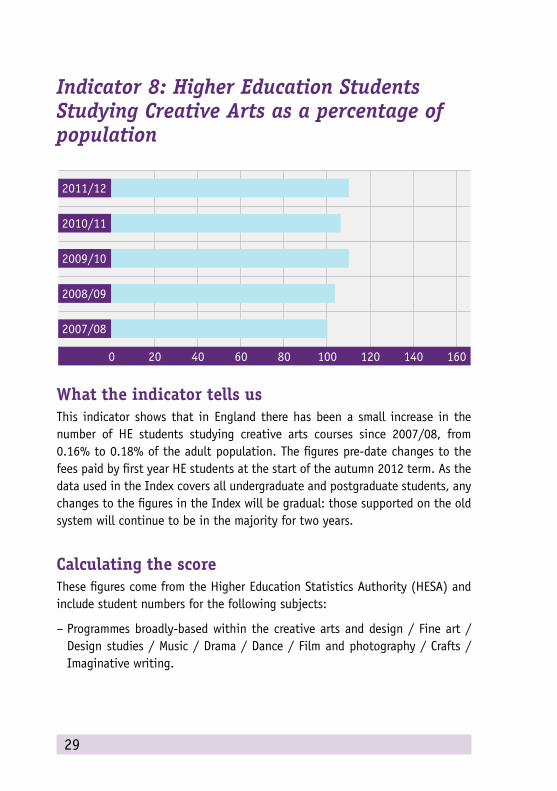
Indicator 8: Higher Education Students Studying Creative Arts as a percentage of population
2007/08
2008/09
2009/10
2010/11
2011/12
0 20 40 60 80 100 120 140 160
What the indicator tells usThis indicator shows that in England there has been a small increase in the number of HE students studying creative arts courses since 2007/08, from 0.16% to 0.18% of the adult population. The figures pre-date changes to the fees paid by first year HE students at the start of the autumn 2012 term. As the data used in the Index covers all undergraduate and postgraduate students, any changes to the figures in the Index will be gradual: those supported on the old system will continue to be in the majority for two years.
Calculating the scoreThese figures come from the Higher Education Statistics Authority (HESA) and include student numbers for the following subjects:
– Programmes broadly-based within the creative arts and design / Fine art / Design studies / Music / Drama / Dance / Film and photography / Crafts / Imaginative writing.

30
Figures include all full-time and part-time postgraduate, first degree and other undergraduate students.
“There is a great fear in the arts community that this figure will drop sharply in the coming years as a result of the changes in fees and pressures on creative subjects in the curriculum. Many are worried that the arts will only be an option for those who can afford to take on major debts and then work in an area where pay can be low. Could we be entering an era when the arts become truly elitist organisations?” – Peter Manning

31
Indicator 9: Adults Volunteering in the arts as a percentage of population
2007/08
2008/09
2009/10
2010/11
2011/12
0 20 40 60 80 100 120 140 160
What the indicator tells usWhile the previous indicator is based on the known actual number of students, this indicator is based on an estimated number using a representative sample of the English population. Sampling in this way always leaves a margin for error. The Index suggests there has been a 46% rise in adult volunteering in the arts in England from 2007/08 to 2011/12. However as this change only amounts to 0.8% of the adult population (1.7% in 2007/08 rising to 2.5% in 2011/12), it may not be a statistically significant change when margins of error are taken into account.
The period reported predates the 2012 Olympics and Cultural Olympiad. A further substantial rise for 2012/13 will demonstrate a significant change in the proportion of adult volunteering in the arts, which could be attributed to the Games.
Calculating the scoreThis data has comes from the DCMS Taking Part Survey. Figures have only ever been available for England.

32
“If the most recent figures are to be believed, 1 in 40 adults volunteered in the arts in 2011/12. This is an increase on previous years, but in these challenging times, when 69% of the population attend and 48% actively participate, could the sector be doing more to encourage a higher proportion to give their time rather than just their money?“ – Leonora Thomson

33
FINANCIAL INPUT / OUTPUT (RESERVES)
There is just one indicator in this category – the Combined Reserves of regularly funded arts organisations per person.

34
Indicator 10: Combined Reserves of regularly funded arts organisations per person
2007/08
2008/09
2009/10
2010/11
2011/12
0 20 40 60 80 100 120 140 160
What the indicator tells usReserves are a good way of measuring arts sustainability. This indicator shows a three-year increase in the combined reserves of regularly funded arts organisations, from £22.34 per person in 2007/08 to £24.55 in 2009/10, before falls in 2010/11 and 2011/12.
Calculating the scoreThis data comes from Arts Council England and is only available for England. The figure used is the entire combined reserves reported for all regularly funded organisations in any given year. The total has been divided by the population of England in each year.
35
“Anyone who worked in the arts before the days of the Lottery and the subsequent significant increases in Treasury funding will remember a time of crumbling buildings and growing deficits. We went into this economic downturn having reached a very different place; many arts organisations had benefitted greatly from capital investment and been able to clear historic debts and build reserves. It took almost a decade and a half to move from widespread crisis to general stability, and this good financial health helped the sector weather the early part of the financial storm. This health is now worsened: prudently established reserves are going down, threatening the resilience of individual organisations and the sector as a whole. Organisations with no reserves cannot grow.” – Samuel West

36
CULTURAL / COMMUNITY OUTPUTS – ATTENDANCE AND PARTICIPATION
This category contains four indicators:
11. Adults Attending an arts activity as a percentage of population
12. Adults Participating in an arts activity as a percentage of population
13. Children and Young People Attending and/or Participating in an arts activity as a percentage of population
14. Adults ‘Digitally’ Attending and/or Participating in an arts activity as a percentage of population
Combined score for this category
2007/08
2008/09
2009/10
2010/11
2011/12
0 20 40 60 80 100 120 140 160
The combined score is calculated by adding together and averaging the individual indicator scores for each year. The year-on-year rise is largely due to the ongoing increase in those digitally attending or participating.

37
Indicator 11: Adults Attending an arts activity as a percentage of population
2007/08
2008/09
2009/10
2010/11
2011/12
0 20 40 60 80 100 120 140 160
What the indicator tells usAround 67% of adults in England reported attending an arts event in the years from 2007/08 to 2010/11; a small increase to 69% was reported for 2011/12. The change in economic climate has clearly had no impact on the numbers of adults attending at least once a year.
Calculating the scoreThe figures used to establish the 2007/08 baseline were from the DCMS Taking Part Survey in England, and from the arts councils in other nations. The total number of adult attendances across the UK was divided by the adult (16+) population for each year for each nation. It should be noted that there is no common definition of what constitutes an arts activity across the four UK nations, so variations in levels of engagement between the nations cannot be accurately measured. The definition in England was more narrow than in the other UK nations, which may be the cause of England only scoring 98 in the baseline year of 2007/08.

38
“The public continue to be the biggest funders of the arts, largely through buying tickets. It’s great to see more people than ever attending arts events in England, despite the ongoing economic challenges. The UK has an international reputation for the quality and creativity of its arts marketing and audience engagement and this has played a major role in attracting a larger and more diverse audience to the arts.” – Leonora Thomson

39
Indicator 12: Adults Participating in an arts activity as a percentage of population
2007/08
2008/09
2009/10
2010/11
2011/12
0 20 40 60 80 100 120 140 160
What the indicator tells usThe small dip in adult participation in the arts in England in 2008/09 and 2009/10 has been reversed: in 2011/12, 48% of adults said they participated in an arts activity at least once a year compared to 47% in 2007/08.
Calculating the scoreThe figures used to establish the 2007/08 baseline were from the DCMS Taking Part Survey in England, and from the arts councils in other nations. The total number of adult attendances across the UK was divided by the adult (16+) population for each year for each nation. It should be noted that there is no common definition of what constitutes an arts activity across the four UK nations so variations in levels of engagement between the nations cannot be accurately measured. The definition in England was more narrow than in the other UK nations, which may be the cause of England only scoring 98 in the baseline year of 2007/08.

40
“From acting to painting, from DJ-ing to crochet, England is a nation half-full of creative people who love to express themselves through the arts. With an aging population, active arts participation could be playing an even bigger role in keeping minds and bodies healthy and active and ensuring individuals feel part of local communities.” – Peter Manning

41
Indicator 13: Children and Young People Attending and/or Participating in an arts activity as a percentage of population
2007/08
2008/09
2009/10
2010/11
2011/12
0 20 40 60 80 100 120 140 160
What the indicator tells usIn England the number of children reporting they are attending or participating in arts activities at least once a year has risen from 98% in 2007/08 to 99% in 20011/12.
Calculating the scoreOnly limited data was available in 2007/08, so 2008/09 was used as the base year for this indicator. This is why there is no score shown in the graph for 2007/08.
The data used for the 2008/09 baseline came from a number of sources and is only available for England, Wales and Northern Ireland.
– English data comes from the DCMS Taking Part Survey.
– Welsh data is from The Children’s Omnibus Survey, produced by Arts Council Wales.

42
– Northern Irish data is from The Young Persons’ Behaviour & Attitudes Survey, carried out by the Northern Ireland Statistics and Research Agency.
“99% of young people in England taking part in the arts is impressive. Will we ever reach 100% or are we at a high water mark? Will changes to the curriculum and the structure of exams squeeze the chance to explore the arts out of the school lives of young people?” – Samuel West

43
Indicator 14: Adults ‘Digitally’ Attending and/or Participating in an arts activity as a percentage of population
2007/08
2008/09
2009/10
2010/11
2011/12
0 20 40 60 80 100 120 140 160
What the indicator tells usThe indicator is based on 2008/09 data because no 2007/08 data was available. The way this question was asked changed in 2010/11, which explains why the trend of significant annual growth paused.
This increase is by far the largest across all of the indicators and is a significant factor in the rise for the England-wide Index score between 2008/09 and 2011/12.
Calculating the scoreData for this indicator comes from DCMS’ Taking Part Survey, and is only available for England. It refers to the proportion of adults who have digitally participated in culture in each year. The way the question was asked changed in 2010/11, making accurate trend analysis impossible.

44
“The arts are growing in relevance in our busy, distracted, digital lives. But more than that they are becoming central to our awareness of our online voice. The arts help us shape our identities online and offline. As digital life expands, the relevance of online engagement will expand, both as a means of engaging with offline culture and as a way of developing our own online platforms and art forms.” – Bob & Roberta Smith

45
CULTURAL / COMMUNITY OUTPUTS – SATISFACTION
This category contains two indicators:
15. Adults Reporting ‘High Quality’ Experience
16. Adults Reporting Satisfaction with local arts provision
While other elements of the Index look purely at input and output numbers, this section focuses on the impact for individuals, tracking the perceived quality of recent arts experiences and the satisfaction with local arts provision.
Sadly, satisfaction with local provision is no longer measured: the most recent data we have is from 2008/09. This means it is not possible to give a meaningful summary chart for this section.

46
Indicator 15: Adults Reporting ‘High Quality’ Experience
2007/08
2008/09
2009/10
2010/11
2011/12
0 20 40 60 80 100 120 140 160
What the indicator tells usIn 2007/08, 57% of adults rated their most recent arts experience as ‘High Quality’, increasing slightly to 60% in 2008/09. Arts Council England ceased to publish this figure as part of their standard reporting after this point but specially analysed the most recent Taking Part data to give us an up-to-date figure for the Index. The figure has risen to 63% which is a statistically significant increase on the figure we last reported.
Calculating the scoreThe data comes from DCMS’ Taking Part Survey, and has only ever been available for England. The figure reported is based on a number of questions in the survey.

47
“In addition to the number people taking part in the arts, a higher proportion is really enjoying them and saying they are high quality. It may be that in difficult times people appreciate more the time they spend with the arts and value great art more. This number also shows our artists are outstanding, doing a wonderful ground-breaking job!” – Bob & Roberta Smith

48
Indicator 16: Adults Reporting Satisfaction with local arts provision
2007/08
2008/09
2009/10
2010/11
2011/12
0 20 40 60 80 100 120 140 160
What the indicator tells usThis data has not been collected since 2008/09 so the last historic figure is used in the Index. While it was previously collected by Local Authorities and could be used to assess levels of satisfaction down to Borough level, there is no reason why the question could not be included in another national survey (e.g. Taking Part) to track national trends now and in the future.
Calculating the scoreThe data for this indicator has only ever been available in England. It was originally collected through BVPI (Best Value Performance Indicator) surveys and then through the Place Survey.
49
“With so much pressure on Local Government funding and disproportionate cuts to the arts, we need now more than ever to track the public’s satisfaction with what is culturally on offer at a local level. The lack of current local satisfaction data means that many Councils are making decisions that are not properly informed by the views of their residents.” – Ruth Mackenzie

50
FINANCIAL OUTPUTS
This category contains four indicators:
17. Income from West End Theatre
18. Combined Expenditure of revenue funded arts organisations per person
19. Gross Value Added (GVA) of ‘Creative, arts and entertainment activities’ as a proportion of the whole economy
20. Employment in ‘Creative, arts and entertainment activities’ as a proportion of total employment (UK figures)
2007/08
2008/09
2009/10
2010/11
2011/12
0 20 40 60 80 100 120 140 160
Combined score for this categoryThe combined score is worked out by adding together and averaging the individual indicator scores for each year. There was an increase in 2008/09 and then a small decrease in all three successive years. The negative trend is largely due to the indicators for GVA and expenditure of Arts Council revenue funded organisations.
This set of indicators reflects some of the ways in which the arts contribute back into the economy. The set is not exhaustive, but provides a balanced mix of indicators to monitor ongoing changes.

51
Indicator 17: Income from West End Theatre
2007/08
2008/09
2009/10
2010/11
2011/12
0 20 40 60 80 100 120 140 160
What the indicator tells usWhile West End theatre does not represent all the commercial arts, it is a good proxy in a sector that is generally considered to be sensitive to changes in the financial climate. Data about the West End has also been collected for a considerable period.
The data suggests that the health of the West End has been relatively unaffected by economic downturn over the last five years, although when inflation is taken into consideration there has been a small drop in income over the last two years.
Calculating the scoreFigures come from the Society of London Theatre, and refer to total revenue (including VAT) across all West End theatres.

52
“West End Box Office income has kept rising since the economic downturn began, but at less than the rate of inflation. Many of the biggest shows of recent years began their life in the subsidised theatre. By cutting funding to the organisations that produced these shows, are we also cutting our national ‘R & D’ budget for one of the most important drivers of the UK’s visitor economy?” – Samuel West

53
Indicator 18: Combined Expenditure of regularly funded arts organisations per person
2007/08
2008/09
2009/10
2010/11
2011/12
0 20 40 60 80 100 120 140 160
What the indicator tells usFor every £1 invested by Arts Council England in its revenue funded portfolio in England in 2010/11, a further £2.11 was spent by the arts organisation. In 2011/12 this figure increased to £2.49, but as the number of organisations being funded and the cumulative amount they were being funded decreased, the overall contribution to the economy of this portfolio decreased.
From a high of 109 in 2008/09, the Index in England has now dropped to 102 in 2011/12.
Calculating the scoreThe data to establish the 2007/08 baseline came from Arts Council England and Arts Council Northern Ireland. In each case, the figure used is the entire expenditure reported by all regularly funded organisations in each year divided by the population in that area in any year.

54
“Lots of economic arguments for the arts are based around ‘leverage’. It could be argued that funders are getting better value for every £1 that is invested in the arts now compared to previous years, but when this figure is considered alongside the reduction in reserves, it seems that the sustainability of the sector is being chipped away.” – Julia Payne
55
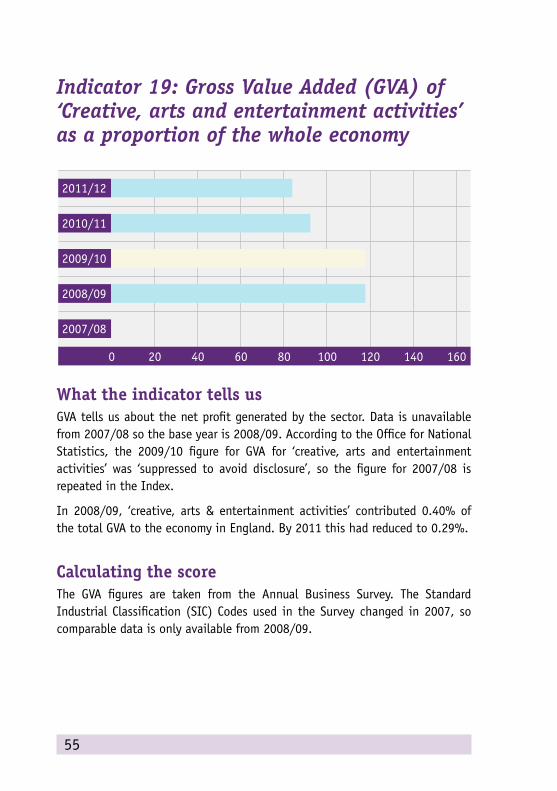
Indicator 19: Gross Value Added (GVA) of ‘Creative, arts and entertainment activities’ as a proportion of the whole economy
2007/08
2008/09
2009/10
2010/11
2011/12
0 20 40 60 80 100 120 140 160
What the indicator tells usGVA tells us about the net profit generated by the sector. Data is unavailable from 2007/08 so the base year is 2008/09. According to the Office for National Statistics, the 2009/10 figure for GVA for ‘creative, arts and entertainment activities’ was ‘suppressed to avoid disclosure’, so the figure for 2007/08 is repeated in the Index.
In 2008/09, ‘creative, arts & entertainment activities’ contributed 0.40% of the total GVA to the economy in England. By 2011 this had reduced to 0.29%.
Calculating the scoreThe GVA figures are taken from the Annual Business Survey. The Standard Industrial Classification (SIC) Codes used in the Survey changed in 2007, so comparable data is only available from 2008/09.

56
“This is another figure in the Index that needs to be treated with caution, as margins of error in the ONS’s sampling may mean that substantial moves in the Index may be statistically insignificant. However, the figures do show that ‘creative arts and entertainment activities’ continue to make a positive contribution to the English economy that is almost three times greater than the whole of agriculture, forestry and fishing combined.” – David Brownlee

57
Indicator 20: Employment in ‘Creative, arts and entertainment activities’ as a proportion of total employment (UK figures)
2007/08
2008/09
2009/10
2010/11
2011/12
0 20 40 60 80 100 120 140 160
What the indicator tells usThis indicator shows employment in the arts sector as a proportion of total UK employment.
Data is unavailable from 2007/08 so the base year in 2008/09. From 2008/09 to 2011/12 the figure estimated by the Office for National Statistics has varied between 0.38% and 0.4% of the UK population as a whole.
Calculating the scoreThe baseline was established using employment figures taken from the Office for National Statistics’ Annual Business Survey for the whole of the UK. Comparable data was only available from 2008/09.

58
“The arts may not employ a massive proportion of the UK’s adult workers, but they do offer fulfilling and creative options for many people who do not find ‘traditional’ careers interesting or sustainable.” – Peter Manning

59
Thanks
The NCA Arts Index analyses data collected by other organisations. We would like to thank the following for their continued investment in the high quality primary research on which the Index relies:
• Arts & Business/Business in the Community
• Arts Council England
• The Department for Culture, Media and Sport
• The Office for National Statistics
• Society of London Theatre
We must also thank Erica Bolton for help with publicity and Nica Burns for her support.