the navy’s environmental restoration program in the … county... · navfac southwest . derral...
TRANSCRIPT

NAVFAC SOUTHWEST
Derral Van Winkle, PG Environmental Remediation PLC NAVFAC Southwest
The Navy’s Environmental Restoration Program in the Southwest
Society of American Military Engineers
Orange County Post
March 2014
2 NAVFAC Southwest
Presentation Focus Areas
•Overview of NAVFAC SW Environmental Program •EV Restoration Statistics
–Financials –Metrics
•EV Restoration Challenges •EV Restoration Initiatives •EV Restoration Procurement
3/27/2014

3 NAVFAC Southwest 3/27/2014
Environmental Areas of Responsibility
Environmental Quality Programs: –Environmental Compliance & Services –Environmental Planning –Environmental Assessments & Special Programs –Natural and Cultural Resources including Marine Biology
Environmental Restoration Program –Chemical and Munitions Cleanup
Sustainable Solid Waste Management (SW only) Base Realignment and Closure (BRAC)
4 NAVFAC Southwest
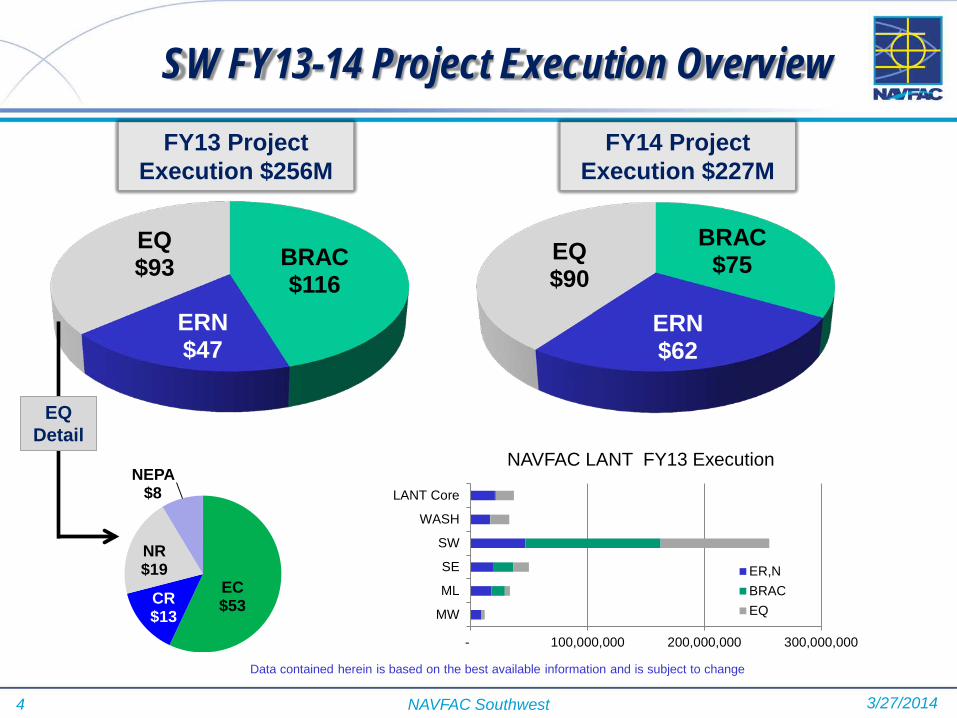
SW FY13-14 Project Execution Overview
Data contained herein is based on the best available information and is subject to change
BRAC $116
ERN $47
EQ $93
EC $53 CR
$13
NR $19
NEPA $8
FY13 Project Execution $256M
EQ Detail
3/27/2014
FY14 Project Execution $227M
NAVFAC LANT FY13 Execution
BRAC $75
ERN $62
EQ $90
- 100,000,000 200,000,000 300,000,000
MW
ML
SE
SW
WASH
LANT Core
ER,NBRACEQ

5 NAVFAC Southwest
SW Environmental Funding Profiles
3/27/2014
0
10,000,000
20,000,000
30,000,000
40,000,000
50,000,000
60,000,000
70,000,000
FY14
FY15
FY16
FY17
FY18
FY19
FY20
57 47
55 51 41
19 15
5 7
7 7 22
26 35
IRP MRP
IRP vs MRP
131
181
130
73
209
148
235
200 177
107
142 116
75 73 95
0
50
100
150
200
250
BRAC ($M)
65 64 76
89
71 59
64 61
47
62 54
62 58 63
45 50
82
0102030405060708090
100
ERN ($M)

6 NAVFAC Southwest
NAVFAC Southwest ER,N Requirements Overall Cost to Complete (CTC): $766M
54% Installation Restoration Program -- 46% Munitions Response Program
IRP $411
MRP $355
ER,N Total CTC
Navy $252
MC $160
Installation Restoration CTC
Navy $306
MC, $49
Munitions Response CTC
61% Navy -- 39% MC 86% Navy -- 14% MC 3/27/2014

7 NAVFAC Southwest
Southwest ER,N Program Execution Plan – IRP vs. MRP ($M); Comparison 2012 - 2014
-5
5
15
25
35
45
55
65
75
FY14 FY15 FY16 FY17 FY18 FY19 FY20 FY21
IRP 2012 Plan
IRP 2013 Plan
IRP 2014 Plan
MRP 2012 Plan
MRP 2013 Plan
MRP 2014 Plan

8 NAVFAC Southwest 3/27/2014
Cost-to-Complete by Navy/Marine Corps Installation
$0 $20,000,000 $40,000,000 $60,000,000 $80,000,000SAN DIEGO CA MCRD
SAN DIEGO CA FLT&INDSUPCTLOS ANGELES CA NMCRC
SPAWARSYSCEN PACIFIC SDSAN DIEGO CA NISE-WEST
NAVBASE POINT LOMAAZUSA CA NCCOSC MORRIS DA
SAN DIEGO CA NTCSAN DIEGO CA AUXLNDFLD
CORONADO CA NAVPHIBASEDIXON CA NAVRADFAC-T
IMPERIAL BEACH CA NAVALFSAN PEDRO DFSC
PORT HUENEME CA NFELCBRIDGEPORT CA MWTC
LEMOORE CA NASNAS PT MUGU CA NAVAIRWARCFALLBROOK CA NWS SBCH DET
TWENTYNINE PALMS CA MAGCCYUMA AZ MCASFALLON NV NAS
EL CENTRO CA NAFCHINA LAKE CA NAWCWPNSDIV
SEAL BEACH CA WPNSUPFACMIRAMAR CA MCASBARSTOW CA MCLB
NAVBASE CORONADOCAMP PENDLETON CA MCB
NAVBASE SAN DIEGO
IRP MRP
Top 5 ER.N Budgets 1. NBSD (UXO 100 $250M) 2. Camp Pendleton 3. NAVBASE Coronado 4. Barstow 5. Miramar

9 NAVFAC Southwest 3/27/2014
CERCLA Process – Phases and Milestones
10 NAVFAC Southwest 3/27/2014
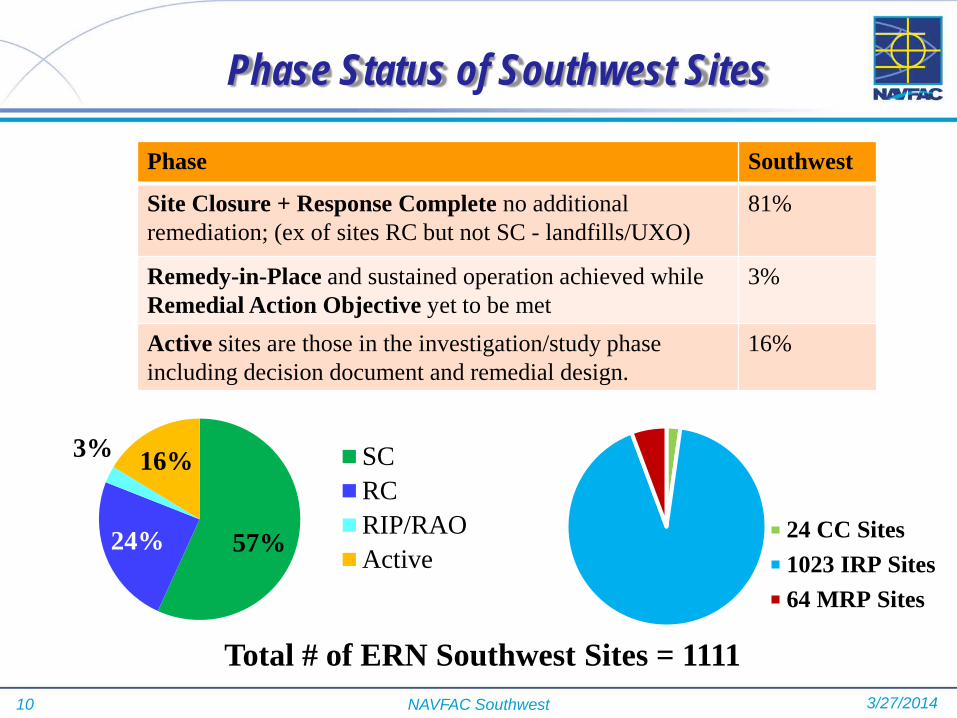
Phase Status of Southwest Sites
Phase Southwest
Site Closure + Response Complete no additional remediation; (ex of sites RC but not SC - landfills/UXO)
81%
Remedy-in-Place and sustained operation achieved while Remedial Action Objective yet to be met
3%
Active sites are those in the investigation/study phase including decision document and remedial design.
16%
57% 24%
3% 16% SCRCRIP/RAOActive
24 CC Sites1023 IRP Sites64 MRP Sites
Total # of ERN Southwest Sites = 1111

11 NAVFAC Southwest 3/27/2014
Office Secretary of Defense Planning Guidance Goals
Total SW Sites Sites Remaining
to reach RC
EOY FY 18 % Projection
FY to reach 90%
EOY FY 21 % Projection
FY to reach 95%
Sites
Remaining after EOY FY 21
1111 277 95% 2016 98% 2021 18
0
200
400
600
800
1000
1200
1986 1992 1997 2002 2007 2012 2017 2024 2037
DPG Goals: • 90% Sites
RC by FY18 (yellow line)
• 95% Sites RC by FY21(red line)
RC metric tied to RC document with Agency concurrence
12
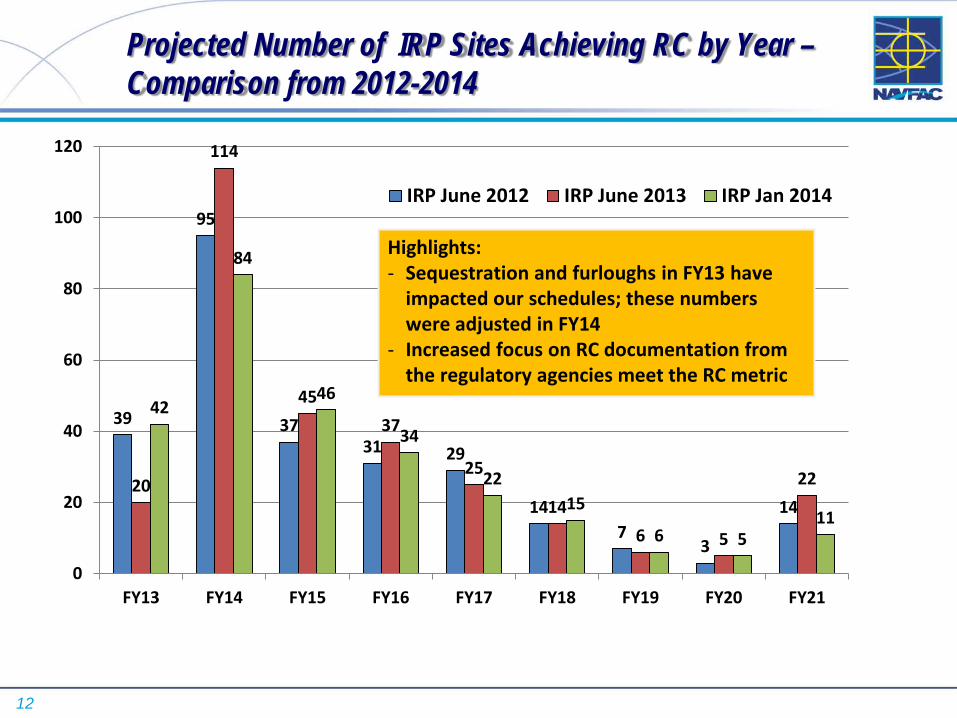
Projected Number of IRP Sites Achieving RC by Year – Comparison from 2012-2014
39
95
37 31 29
14 7
3
14 20
114
45 37
25
14 6 5
22
42
84
46
34
22 15
6 5 11
0
20
40
60
80
100
120
FY13 FY14 FY15 FY16 FY17 FY18 FY19 FY20 FY21
IRP June 2012 IRP June 2013 IRP Jan 2014
Highlights: - Sequestration and furloughs in FY13 have
impacted our schedules; these numbers were adjusted in FY14
- Increased focus on RC documentation from the regulatory agencies meet the RC metric

13
Projected Number of MRP Sites Achieving RC by Year – Comparison from 2012-2014
0 0
3 3
8
11
13
4
2
0
1
3 3
5
6
12
8
7
0
1
3
1
5
8 8
7
9
0
2
4
6
8
10
12
14
FY13 FY14 FY15 FY16 FY17 FY18 FY19 FY20 FY21
MRP June 2012 MRP June 2013 MRP Jan 2014
Highlights: -MRP funding continues to be pushed out which affects sites reaching RC -Technology limitations - Navy working internally on risk assessment tools

14 NAVFAC Southwest 3/27/2014
Challenge Areas – Environmental Restoration
•Long Operation and Maintenance and Long Term Monitoring Tails
–Enhanced Optimization Review
•Munitions Program –Cleanup Costs –Underwater Evaluations –Risk Assessment
•Emergent Contaminants –1,4-Dioxane –Vapor Intrusion – TCE –Perflourinated Compounds (PFC’s) –Asbestos –Lead
•Sediment Cleanup •Future Radiation Evaluation/Cleanup
–BRAC = Now –ER,N = Future

15
Terrestrial: Remedial Investigation focus over next several years
•Support technology transfer of new advanced sensors and algorithms into mainstream use (Advanced Classification)
Munitions Response CTC Focus
Photos courtesy of ESTCP.
Underwater: Expanded Wide Area Assessment and Enhanced Resolution Sensors
Geometrics Metal Mapper

16 NAVFAC Southwest
Initiatives within NAVFAC Restoration Program
•5 Year Review Toolkit –Similar to Record of Decision Toolkit
•Standard ARARs Toolkit –Nationwide tool patterned after NAVFAC Southwest efforts
•Significant NIRIS Enhancement –Version 2.0 fully functional –New tools being added regularly
•Vapor Intrusion Evaluation Tool –CSM and Alternatives Analysis
3/27/2014

17 NAVFAC Southwest
Initiatives – Revised and Enhanced NAVFAC Installation Restoration Information Solution Tool
3/27/2014

18 NAVFAC Southwest
Initiatives – New Tools for Teams – Vapor Intrusion Evaluation Tool
3/27/2014

19 NAVFAC Southwest
PROGRAM FY13
Execution
FY14 Planned
Execution
FY14 Contract
Capacities
FY14 Planned
Solicitations Restoration/ BRAC $163M $152M $1,090M $100M Compliance/ ORC $53M $51M $149M $150M NEPA/NCR $40M $39M $55M $125M TOTALS $256M $242M $1,294M $375M
SW Environmental Contract Capacities
3/27/2014

20 NAVFAC Southwest
NAVFAC SW Restoration Procurements - Currently Underway ** Data contained herein is based on the best available information and is subject to change
Contract Type Scope Location of Work
Contract Capacity/ Duration
Type RFP Date
Projected Award
Environmental Restoration RAC Single Award IDIQ; Cost-Plus Award Fee
Restoration SW AOR $100M/ 5 yrs
Small Business
June 2011 4th Qtr FY14
8(a) CERCLA/RCRA Single Award IDIQ; Fixed Price
Restoration SW AOR $20M/ 5 yrs
Small Business
March 2013
3rd Qtr FY14
Environmental Compliance
A-E Compliance Single Award IDIQ; Fixed Price
Storm Water- incidental potable water, wastewater, GW, water quality
NAVFAC Wide
$30M/ 5 yrs
Small Business
June 2011 3rd Qtr FY14

21 NAVFAC Southwest 3/27/2014
** Data contained herein is based on the best available information and is subject to change NAVFAC SW Restoration Planned Procurements
Contract Type Scope Location
of Work Contract Capacity/ Duration
Type RFP Date
Projected Award
Environmental Compliance / Restoration Operational Range Sustainment EMAC
Compliance SW AOR $100M/ 5 yrs
Small Business
2nd QTR FY14
4th Qtr FY14
Restoration 8(a) EMAC
Restoration SW AOR $50M/ 5 yrs
Small Business
3rd Qtr FY14
3rd Qtr FY15
Restoration SB EMAC
Restoration SW AOR $100M/ 5 yrs
Small Business
3rd Qtr FY14
3rd Qtr FY15

22 NAVFAC Southwest
• Listing of expected NAVFAC Environmental Contract Opportunities • NAVFAC Webpage: www.navfac.navy.mil
• Small Business Program Office Webpage: https://smallbusiness.navfac.navy.mil
• Federal Business Opportunities: www.fedbizops.gov
3/27/2014
More Information

23 NAVFAC Southwest 3/27/2014
Questions?

24 NAVFAC Southwest 3/27/2014
Supporting Slides

25 NAVFAC Southwest
Growth in the Southwest
3/27/2014
•Plant Replacement Value –$31.6B
•Land Acreage –1,421,277
•Ships and Aircraft –58 Surface Ships –6 Submarines –2 Aircraft Carriers –556 Aircraft
•Commands –480 Tenant Commands –1 Hospital –1 Research Graduate School
Estimates for 2017 –Ships and Aircraft
• 68 Surface Ships • 6 Submarines • 3 Aircraft Carriers • 584 Aircraft
–Commands • 634 Tenant Commands • 1 Hospital • 1 Research Graduate School
020406080
100120
Load
ing
57% Increase in Projected Vessel Loading by 2021

26
Installation Restoration CTC Focus Optimization / Green and Sustainable Remediation (GSR)
- Optimization efforts leading to more effective and efficient remediation solutions - Achieved cost avoidance of $177M over last 7 years
• Expanded optimization program to include Green and Sustainable Remediation (GSR) • New HQ initiative to review O&M and Long
Term Monitoring that extend many years (30+)
ROI of 5.0 (Actual Cost) or 9.9 (Potential Cost)
Optimization Study Cost
Optimization Remedy
Implement Cost
Actual Cost Avoidance
Potential Cost Avoidance
$ 16,532,813 (599 sites –
NAVFAC-Wide) $ 18,964,422 $ 177,602,506 $ 352,775,248
27 NAVFAC Southwest 3/27/2014
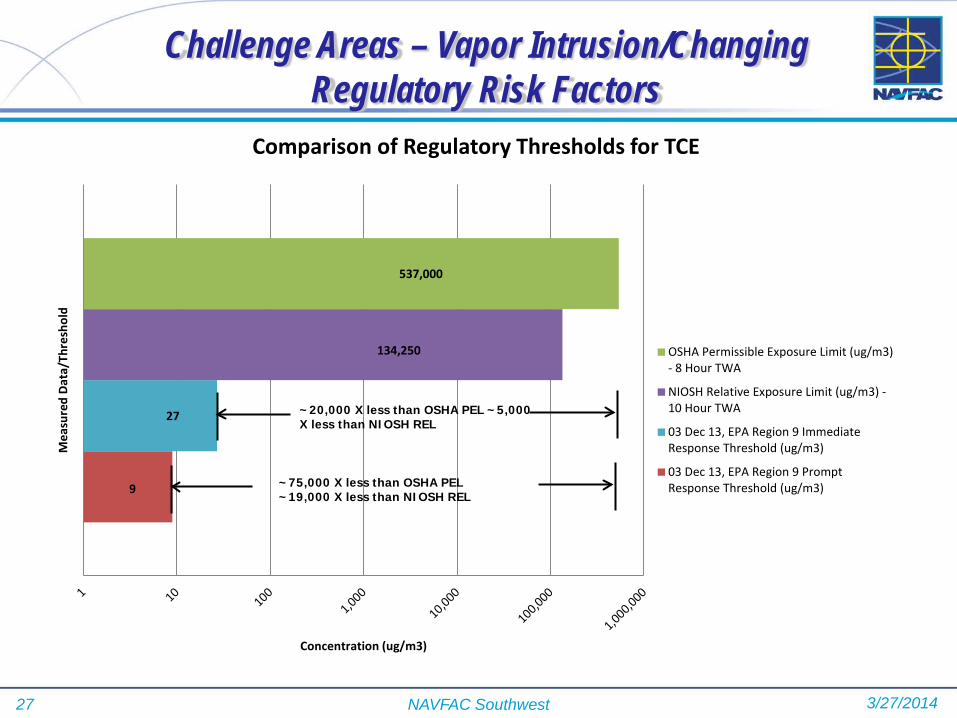
9
27
134,250
537,000
Mea
sure
d D
ata/
Thre
shol
d
Concentration (ug/m3)
Comparison of Regulatory Thresholds for TCE
OSHA Permissible Exposure Limit (ug/m3)- 8 Hour TWA
NIOSH Relative Exposure Limit (ug/m3) -10 Hour TWA
03 Dec 13, EPA Region 9 ImmediateResponse Threshold (ug/m3)
03 Dec 13, EPA Region 9 PromptResponse Threshold (ug/m3)
~20,000 X less than OSHA PEL ~5,000 X less than NIOSH REL
~75,000 X less than OSHA PEL ~19,000 X less than NIOSH REL
Challenge Areas – Vapor Intrusion/Changing Regulatory Risk Factors

28
Advanced Munitions Classification
Courtesy: CECOS Advanced Munitions Site Management, 2012

29
• NAVFAC partnering with Naval Surface Warfare Center Panama City to leverage Fleet MCM resources for Munitions Response Program
• Laser Scalar Gradiometer (LSG) • Small Synthetic Aperture Minehunter (SSAM)
• NAVFAC able to perform cost effective wide-area surveys to support characterization of MR sites
• Utilize currently fielded sensors • Use of “in-house” Navy resources • Added value for expanded mission on ONR
sensor/vehicle investment • Comparable capabilities unavailable from private
sector
EOD using REMUS 600
REMUS 600 Laser Scalar Gradiometer / Small Synthetic Aperture Minehunter
Leveraging Mine Countermeasures (MCM) Unmanned Undersea Vehicles (UUVs) for UXO

30
Same contact, different systems
Comparison between SSAM and best available commercial equipment.
Bomb Sunken canoe Rockets (warhead into sediment)
Leveraging Mine Countermeasures (MCM) Unmanned Undersea Vehicles (UUVs) for UXO