the open chemical engineering journal · fermentation intensification by maxblend the open chemical...
TRANSCRIPT

Send Orders for Reprints to [email protected]
88 The Open Chemical Engineering Journal, 2016, 10, 88-109
1874-1231/16 2016 Bentham Open
The Open Chemical EngineeringJournal
Content list available at: www.benthamopen.com/TOCENGJ/
DOI: 10.2174/1874123101610010088
RESEARCH ARTICLE
Intensifying the Fermentation of Aspergillus oryzae in a StirredBioreactor Using Maxblend Impeller
Narges Ghobadia, Chiaki Oginob and Naoto Ohmurab,*
aDepartment of Chemical Science and Engineering, Graduate School of Engineering, Kobe University 1-1Rokkodaicho, Nada-ku, Kobe 657-8501, JapanbDepartment of Chemical Science and Engineering, Graduate School of Engineering, Kobe University, Rokkodaicho,Nada-ku, Kobe 657-8501, Japan
Received: March 3, 2016 Revised: August 8, 2016 Accepted: August 9, 2016
Abstract:
Background:
The intensification of fermentation in stirred bioreactors is an attractive approach for commercial interests and industries that workwith biochemical products. Alpha amylase is an enzymatic bio-products that is produced largely from Aspergillus oryzae. Usingadaptable agitator can be an efficient way for stirred fermentation.
Objective:
This study, concentrated on enhancing the mixing process in order to intensify Aspergillus oryzae fermentation. A straight type ofMaxblend® impeller was used as an agitator to investigate the incubation parameters compared with the use of a 6-blade doubleRushton turbine.
Method:
Stirred fermentation was done in batch condition. Effect of flow pattern of mixing on fermentation parameters was investigated aftereach sampling.
Results:
The results showed that the Maxblend® significantly intensified both enzyme activity and growth rate at low and moderate rates ofpower consumption (P). The main reason for the decreases in the growth rate and the enzyme activity during agitation by theRushton turbine at low and high Pv was the lack of oxygen and mycelial damage, respectively. Additionally, use of the Maxblend®
significantly intensified the KLa at low and moderate rates of power consumption.
Conclusion:
Axial and uniform mixing by Maxblend® impeller was resulted in improving the fermentation characteristics and enzyme activity.
Keywords: Alpha amylase activity, Aspergillus oryzae, Fermentation, Intensification, Mixing, Maxblend.
1. INTRODUCTION
Aspergillus oryzae is known as a suitable fungus for the production of heterologous proteins. One of the importantadvantages of A.oryzae is that it can be genetically manipulated [1]. The ability to secrete large amounts of alpha
* Address correspondence to this author at the Department of Chemical Science and Engineering, Graduate School of Engineering, Kobe University,1-1 Rokkodaicho, Nada-ku, Kobe 657-8501, Japan; Tel/Fax: +81 78 803 6199; E-mail: [email protected]
Fermentation Intensification by Maxblend The Open Chemical Engineering Journal, 2016, Volume 10 89
amylase and the development of a transformation system has facilitated the usage of A. oryzae in modern biotechnology[2, 3]. Mixing development of fungus fermentation is one of the ways to reach a desirable level of enzyme activity inagitated submerged cultures. According to the literature [4 - 6], achieving homogene fermentation medium can result inan efficient mass transfer and a high quality and quantity of production. Many researchers have sought optimalconditions for agitation, because mycelial damage at high stirrer speeds or power inputs can limit the capability andvolumetric productivity of a fermenter [7]. In addition, agitators with high volumetric power consumption (Pv=P/V) canhave a major effect on a microorganism such as damage to cells, morphological changes, and variations in growth rateand product formation. For each submerged culture, the optimal conditions for agitation depend partly on the resistanceof hyphae to the mechanical forces and also on its physiological state [8]. For the fragmentation of fungal pelletsinduced by different power inputs, there are 4 main mechanisms: interaction between pellets [9], turbulent eddies, theimpact of the impellers on pellets, and collision among pellets. Therefore, study of the flow characteristics in a STR byfocusing on power consumption is crucial to the design and scale-up of a fungal fermentation process [9 - 12].
The use of standard impellers is often associated with poor bulk motion and an inhomogeneous distribution of thevarious phases [13]. In addition, it was reported [9], that during the STR-fermentation of A.oryzae, agitated by threeRushton-style impellers, oxygen mass transfer occurred mainly in the vicinity of the impeller [9].
Because of an existing dynamic relationship between fermentation conditions and fungal growth patterns, animproved impeller that was sufficiently flexible for submerged cultures would be an advantage in the design offermentation system. One method would be enlargement of multi-stage impellers, and another would be the use ofclose-clearance designs such as anchors, helical ribbons or Maxblend® (MB). Hydrodynamic advantage of MB impelleris mixing at low power consumption and dispersion in a wide range of Re. This is a wide impeller that combines a lowerpaddle and a grid. The paddle at the vessel bottom produces a strong tangential flow and a weak axial flow. Commonimpellers, such as the Intermig, RT and PBT induce mainly radial and axial flows by the moving action of their blades,but in the case of the MB, the nature of the upper part of the impeller reduces the drag and also promotes the formationof pressure gradients. The pumping effect and centrifugal acceleration imposed by MB impeller to the surrounding fluidis minimal [14].
In terms of shearing constant (ks= NpRe), the MB impeller is more efficient than that of a turbine [15]. The MB iseffective when mixing performance is important in non-Newtonian cultures such as with a fermentation broth. Themixing performance of the MB and other large impellers in boiling STRs also was investigated by Takahashi et al. [16]and found that the MB had essentially the same performance as competing impellers for these types of applications. TheMB has been employed in fermentation processes [17, 18] under aerated conditions showing very significant masstransfer coefficients while keeping the broth culture very well mixed. A numerical investigation was conducted [19] ondispersive mixing involving the MB and a comparison with double helical ribbon impellers and indicated that the MBexhibited a satisfactory local dispersive mixing performance. An experimental study [13] was performed with a wedge-shaped MB impeller and showed that mixing time decreases with the reciprocal of the Re with Newtonian and non-Newtonian fluids in the laminar regime.
Using new large-scale agitators in fermentation to reduce the P and increase the productivity is one of the newapproaches in mixing intensification. In this study, we have investigated the fermentation process of A.oryzae with twoimpeller configurations generating two distinct flow fields: one with traditional double RT impellers, generating highshear rates and a non-uniform shear rate distribution [9], and the other the straight type of large-scale impeller,Maxblend®, MB (Sumitomo Heavy Industries Co., Ltd., Tokyo, Japan), that does not produce significant radial or axialfluid motion directly [14]. The wide geometrical impeller was used to intensify the incubation parameters comparedwith the stirring of a 6-blade double Rushton turbine (DRT), as a multi stage impeller. In the experimental set-up,adjusting the agitation by both impellers at the same power density was not possible because of some limitations. Forthis reason, the fermentation study was attempted at roughly close values of Pv for three different ranges (low, moderateand high values).
2. MATERIALS AND METHODS
2.1. Strain and Inoculum Preparation
The microorganism used in the present study was wild type A.oryzae (OSI1013). The fungus was maintained in petridishes of agar. After inoculation, the dishes were incubated at 30 oC for 5-6 days and subsequently stored at 4 oC. A
90 The Open Chemical Engineering Journal, 2016, Volume 10 Ghobadi et al.
suspension of spores was obtained by washing the petri dish cultures using a sterile aqueous solution of Tween- 80(0.05 wt %, Polyoxyethylene (20) Sorbitan monooleate, Wako Co., Kyoto, Japan). The spores were dislodged using asterile inoculation loop under strict aseptic conditions, and the number of viable spores in the suspension wasdetermined using a hemocytometer (Bürker Türk) (NanoEnTek Inc., Gyeonggi, Korea). The inoculum of A.oryzae wasprepared in 100 mL Erlenmeyer flasks containing 15.0 mL of nutrient broth with 1.5×10⁷ spores mL-1. The flasks weresterilized in an autoclave at 121 °C (105 Pa pressure) for 15 min. The medium was aseptically inoculated withsuspended spores. The flasks after inoculation were incubated for 3 days on an incubator shaker at 30 °C and 200 rpm.
2.2. Fermentation Experiments and Fermenter Configuration
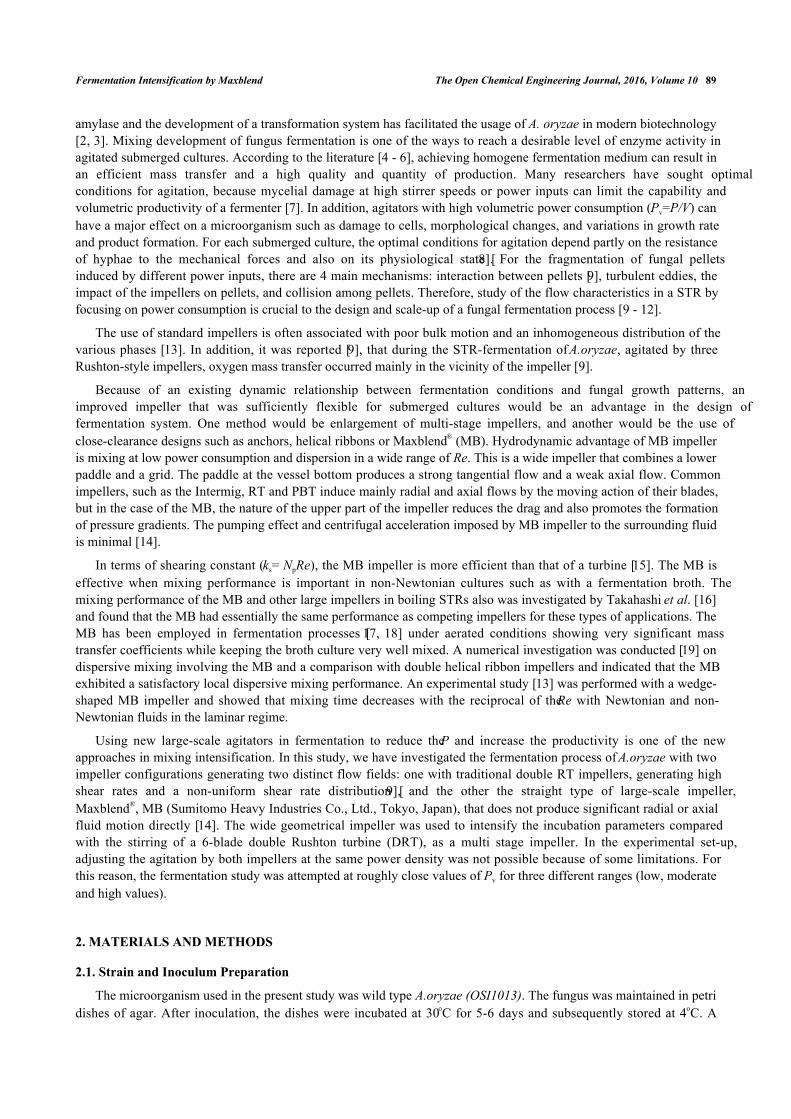
The fermentation experiments for the production of alpha amylase from A.oryzae were carried out in a laboratory-scale, 2.0 L, stirred-tank batch bioreactor, (STBR) (DPC-3A Jar, ABLE BIOTT Co., Tokyo, Japan) with a workingvolume of 1.5 L. Fermentations were conducted in a cylindrical bioreactor with a vessel inner diameter, H of 0.114 m,with a flat bottom and a broth height to a vessel diameter ratio of 1.3. Agitation was provided by two differentimpellers: (a) the DRT and (b) the MB. The DRT had D/H ratio of 0.38 and W/D ratio of 0.2. The spacing between theimpellers was 1.6D and the lower impeller was located at a distance of 1.4D above the base of the tank. The MBimpeller had D/T ratio of 0.54 and W/D ratio of 2.35. The other details of the two impellers and fermenter configurationare shown in Fig. (1). The bioreactor was equipped with monitors, which were used to measure and control the foam,temperature, pH, stirring rate, torque, and dissolved oxygen (DO). The vessel of the bioreactor was equipped with aperistaltic pump to control the foam and pH via the automatic addition of an antifoam agent (KM-70, silicon agent,Shin-Etsu CO., Ltd. Tokyo, Japan) and an acid/base, respectively, also a mechanical foam breaker was used at the topof the culture. The fermentation medium (1.5L) was made up of the following (in g/100mL): Glucose, 3; KCl, 0.2;KH2PO4, 0.1; MgSO4.7H2O, 0.05; Peptone, 1.0; Yeast extract, 0.5 (all from Wako Pure Chemical Industries, Osaka,Japan); and, soluble starch, 10 (Nacalai Tesque, Co., Kyoto, Japan). The medium was added to a fermenter andsterilized in an autoclave, then it was inoculated with 15 mL of previously prepared seed culture. A ring sparger wasused to aerate the culture at 1.00 v.v.m. The DO during fermentation was measured using a commercial sensor (ABLE-DO, SDOC-12FL220, ABLE Co., Tokyo, Japan). An external jacket was used to maintain the broth temperature at30 °C. For a batch operation, the fermenter was run for 72 h. After a fixed interval of incubation, the fermented brothwas sampled, then filtered using a 150 mL-20 µm bottle-top filter (Non-pyrogenic and sterile filter, Corning Inc.,California, USA), and the supernatant was assayed for alpha amylase activities.
Fig. (1). (a) Geometry of fermenter, (b) DRT impeller shaft (c) and MB impeller shaft.
2.3. Alpha Amylase Activity Assay, Glucose Concentration and Dry Cell Weight Measurement
Alpha amylase activity was measured for a 1.0 mL fermentation culture containing 0.5 mL of 2.0% (w/v) solublestarch in 0.1 M phosphate buffer (pH 7.0) and the enzyme solution. The reaction was carried out for different intervals
a b c

Fermentation Intensification by Maxblend The Open Chemical Engineering Journal, 2016, Volume 10 91
at 30 °C, and the reducing sugar produced was determined via the dinitrosalicylic acid (DNS) method with glucose asthe standard. One unit of the enzyme was defined as the amount of enzyme that would produce reducing sugarscorresponding to 1 µmol of glucose from soluble starch in 1 minute under the assay conditions. The culture sampleswere also analyzed to assay the quality of the glucose. This was determined by 3, 5-dinitrosalicylic acid reaction [20,21], spectrophotometrically at 540 nm. Alpha amylase activity and glucose concentration were measured a minimum of5 times during each sampling. Average of these values was recorded with standard deviation as the data shown in thediagrams.
Biomass were measured in units of dry cell weight (DCW). The fermentation broth was diluted up to 5 times andfiltered. The cell pellet was re-suspended and washed with 20 mL distilled water and filtered again. The pellet was thentransferred to a pre-weighted plate and was dried in an oven at 100 °C until reaching a constant weight.
2.4. Morphology Analysis
Microscopic images of the fungal pellet were taken using a digital microscope (VHX-100K, KEYENCECorporation, Osaka, Japan). The microscope was equipped with image processor software to measure the microscopicmorphology parameters. Broth samples were diluted by distilled water then filtered, and this process was performed 3times followed by storage at 4 °C until analysis. The pellet diameter, hyphae length and hyphae diameter weremeasured for more than 100 cells during each sampling. Besides for analyzing the fungal morphology at least 200pictures were taken and on each picture the diameter and length of the hyphae were measured 3 times, then average andstandard deviation were determined. The morphology factors are shown in Fig. (2).
Fig. (2). Illustrations of morphology parameters measured in this study.
2.5. Power Consumption and Power Number Measurement
The power consumption, P, was measured via the torque sensor and calculated as shown in equation (1), where N isthe impeller rotational speed [s-1] and T is the torque [Nm]. Also, for measuring the torque with high accuracy, the finaltorque of fermentation culture was measured by attaching the fermentation jar to the SATAKE torque meter (SATAKEChemical Equipment MFG., LTD., Japan). Based on the torque values, the Pv and Np (=P/ ρN3D5) of fermentationculture using this type of torque meter was shown in Table 1.
In addition, viscosity of fermentation culture after each sampling was measured using B type viscometer (ModelB8L, TOKIMEC INC. Tokyo, Japan, the rotor NO. 1 at 0.6 rpm was used). Then the Re (= ρND2/µ) of fermentationculture was measured using the experimentally measured viscosity. The average Re values during each sampling wasshown in Table 1.
Pellet diameter(mm)

92 The Open Chemical Engineering Journal, 2016, Volume 10 Ghobadi et al.
Table 1. Mixing parameters of submerged fermentation using DRT and MB impellers.
Impeller γ˙ave (s-1) Pv
(Wm-3)Maximum Flow velocity*
(ms-1)Theatrical impeller
tip speed(ms-1)
(= πND)
µeff** Reave,lam Np rps
(Pa s) (s-1)
DRT 19.2 152 0.31 0.35 0.316 77.43 76.97 1.67
MB 33.4 148 0.30 0.32 0.171 106.83 93.23 1.67
DRT 57.5 630 0.92 1.05 0.147 31.61 11.85 5.00
MB 100 687 0.90 0.97 0.08 162.7 9.6 5.00
DRT 95.5 1487 1.46 1.75 0.103 72.13 6.33 8.33
MB 166.0 1524 1.58 1.62 0.056 81.53 4.23 8.33
*: Maximum flow velocity (impeller tip) was used from simulation results by R-Flow software.**: µeff was measured using Metzner and Otto method.
(1)
2.6. Average Shear Rate and Effective Viscosity Measurement
When growing the cells and producing non-Newtonian cell suspensions, it was useful to show the shear rate in thefermenter via a single parameter such as the fluid dynamic behavior. Many of the terms used in this field were proposedby Metzner and Otto [22]. They proposed equation (2) to estimate the average shear rate ( γ˙ave [s-1]), in a non-Newtonian culture.
(2)
Where k is the constant used by Metzner and Otto [22]. In this study, k = 11.5 was used for the DRT as in manyother studies [23, 24], and k = 20 was recommended to us for MB impeller by Sumitomo Heavy Industries, Ltd [25].The shear rate constants depend only on the impeller geometry under non-Newtonian conditions. Results of theeffective shear rate by MB and DRT impellers are shown in Table 1.
For non-Newtonian fluids, the effective viscosity (µeff) could be defined by the definition used in the Metzner andOtto`s method [22] shown in equation (3).
(3)
In the equation (3), μeff is the effective viscosity (Pa s), and K and n are the consistency and flow index for power-law fluids. In many previous studies on the rheological model extracted for fungi such as submerged fermentation, therheological model has been compatible with the power-law model [26 - 28]. In the present study cell adherence andsome problems with dense pellet cells caused unwanted fluctuations while working with the rheometer (HAAKETMviscometer-550, Thermo scientific, USA) to measure shear stress versus shear rate. However, these measurementsshowed that after t = 24h the behavior of culture completely changed from Newtonian to non-Newtonian (shear-thinning), but finding an accurate value for constant parameters of the power-law models was difficult. The power-lawmodel of Tang et al. [9] was compatible with the rheological behavior of culture in this study and was used as arheological model of current fermentation culture. The calculated data follows the Ostwald-de Waele model with n =0.3, K = 2.5 Pa sn and (RT case), 1.82 Pa sn (when using an impeller by the axial flow pattern). Also these values wereused for fluid flow simulation.
2.7. Velocity Distribution Simulation by R-Flow
Analysis of the 2-dimensional velocity in the 2 types of impellers was performed using the fluid dynamics software“R-FLOW” (R-flow Co., Ltd., Saitama, Japan) based on Navier-Stokes equations. In the present study, the Eulerian 2-
���� = �̇ave��
�̇ave = ��
P=2πNT

Fermentation Intensification by Maxblend The Open Chemical Engineering Journal, 2016, Volume 10 93
phase model was used to model the gas-liquid flow in a stirred bioreactor. According to the results of viscositymeasurement (Fig. 3), most of the fermentation time was done in high-viscosity at relatively low Re.
Due to a thixotropic behavior of culture, the maximum and minimum and average viscosity of culture obtained fromeach sampling was used to simulate the fluid flow at average Re during different mixing condition and this is one of thedifficulty of simulation in the present study. The cell-fluid interactions were ignored, because these would have beendifficult to monitor simultaneously with the gas flow in the tank. We noted that during the simulation, the air-flow ratewas the same as that for the fermentation experiment. The gas phase was set as that of ambient air at 30 ◦C, and was setwith a bubble diameter of 2 mm without considering the break-up and coalescence effects.
The governing equations in this approach can be derived by ensemble averaging of the conservation equations foreach phase. The governing equation to a flow-velocity field, uses the mass balance continuity and momentum equation,as follows (equations (4) and (5)):
(4)
(5)
where ρ, p, v, g, F respectively are the fluid density, pressure, velocity, gravity and external force. F (F = FTD+FD, lg)is defined as an interface force between different phases and is defined as assumption of turbulent drag force (FTD), (Itwas zero in this study because non-turbulent laminar flow simulation) and FD, lg is the drag force between gas-liquidphases. The FD, lg was calculated according to the equation (6). Where, αd, αc, db and CD are the dispersed phase volumefraction, continuous volume fraction, bubble diameter and the drag coefficient of one bubble against the fluid,respectively. The drag coefficient defined in equation (7).
Fig. (3). Experimental viscosity of culture versus fermentation time during the use of (a) MB and (b) DRT impellers.
(6)
It is noticed that CD is estimated with the formula of the resistance near the bubble as can be seen in equation (7) and(8). In equation (8), ρc, vd, vc and µd are density of continues phase, velocity of dispersed phase, velocity of continuous
0
0.2
0.4
0.6
0.8
1
1.2
0 24 48 72
Vis
cosi
ty [P
a s]
Fermentation time [h]
MB- 148 Wm-3
MB- 687 Wm-3
MB- 1524 Wm-3
0
0.2
0.4
0.6
0.8
1
1.2
0 24 48 72
Vis
cosi
ty [P
a s]
Fermentation time [h]
DRT- 152 Wm-3
DRT- 630 Wm-3
DRT- 1487 Wm-3
b
a
Wm-3
Wm-3
Wm-3
Wm-3
Wm-3
��,�� = 34
�����
����|�⃗� − �⃗�|(�⃗� − �⃗�)
∇. (��⃗ ) = 0
��⃗ ∙ ∇�⃗ = �∇��⃗ − ∇� + �� + �

94 The Open Chemical Engineering Journal, 2016, Volume 10 Ghobadi et al.
phase and viscosity of dispersed phase respectively.
(7)
(8)
For the two fluid models, the continuous (fermentation culture) and dispersed (bubble) phases are separatelyexpressed using the equations of conversation of momentum and mass continuity.
2.8. Visualization of Flow Pattern
Visualization of flow pattern of steady-state mixing using MB and DRT impellers was done. The gas-liquid stirredtank at laminar flow was illuminated by laser slit beam, (SUWTECH laser, LCD-1500 (SHANGHAI UNIWAVETechnology, China)). Glycerol ((99% (mass/mass), Wako Co., Kyoto, Japan) was used as a fluid (µ = 0.096 ± 0.005 Pas, ρ = 1149 kgm-3). The air-flow rate and Pv of each study was adjust the same as that for the fermentation experiment.
Fig. (4). DCW versus fermentation time at different Pvs during the use of MB and DRT impellers, (a); low Pv, (b): moderate Pv; (c):high Pv.
2.9. Statistic Efficacy
It was noticed that, all of the obtained data were extracted by doing at least three times independent experimental
Low power density
Moderate power density
High power density
0
2
4
6
8
6 12 24 30 36 48 54 60 72
DC
W [g
L-1]
Fermentation time [h]
MB- 148 Wm-3
DRT- 152 Wm-3
0
3
6
9
12
15
6 12 24 30 36 48 54 60 72
DC
W [g
L-1]
Fermentation time [h]
MB- 687 Wm-3
DRT- 630 Wm-3
0
3
6
9
12
15
6 12 24 30 36 48 54 60 72
DC
W [g
L-1]
Fermentation time [h]
MB- 1524 Wm-3
DRT- 1487 Wm-3
b
c
a
�� = �!"#16(1 + 0.15$%&.'*-) $%/,2 0.447
$%� =��|89 − 8:|�;
�<

Fermentation Intensification by Maxblend The Open Chemical Engineering Journal, 2016, Volume 10 95
processes. Each of repeated experimental process and analysis was done at the same condition.
3. RESULTS AND DISCUSSION
3.1. Effect of an Impeller on Biomass Intensification and Alpha Amylase Activity
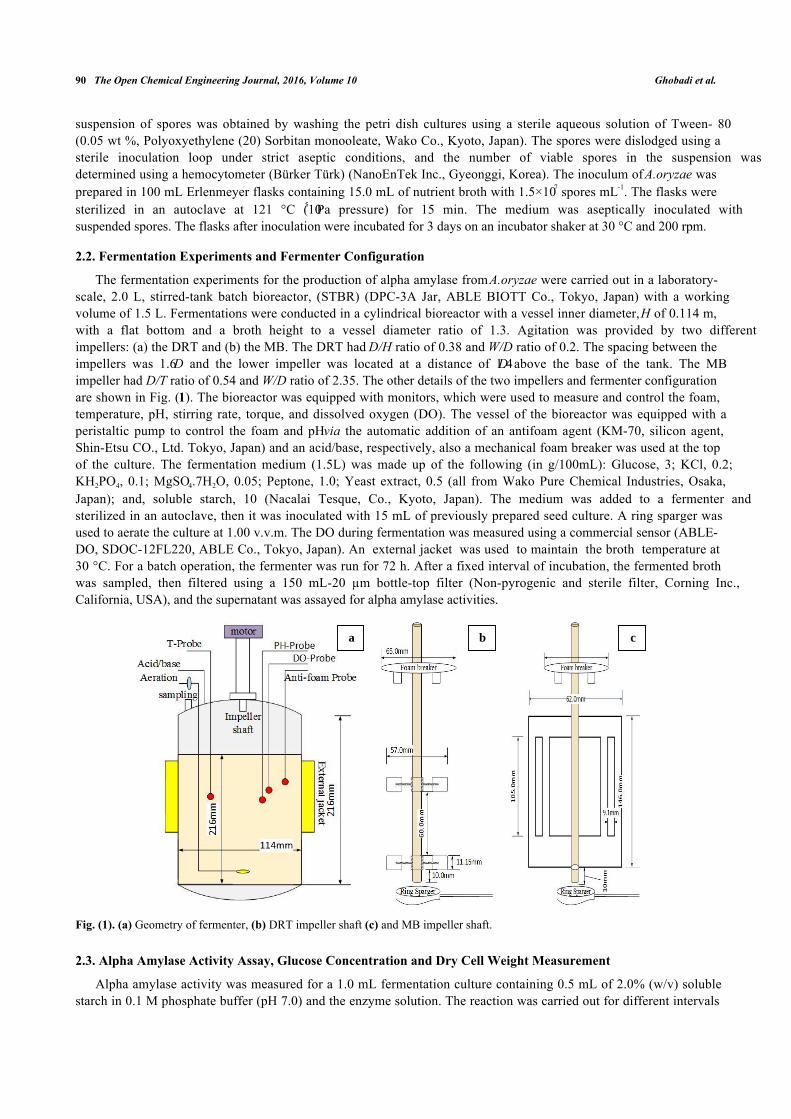
After sampling and extracting the supernatant via filtration of the culture broth, (DCW) was measured, and theresults are shown in Fig. (4). It was appeared that in all cases by increasing the power density (Pv) the DCW has beenincreased. A significant difference between the biomass production by MB and DRT impellers was seen by changingthe Pv. Analysis of the results in Fig. (4b) clearly show that when using the DRT at a high Pv, the DCW production waslower than conditions using either MB or DRT under moderate energy consumption. The DCW of cells agitated by theMB impeller at low and moderate ranges of Pv were higher compared with that when using the DRT. Also, the resultsshow that the Pv of the culture broth and a changing of the radial mixing by MB influenced the growth rate of fungi. Inaddition, the experimental data clearly show that fermentation via the MB impeller at 1524 Wm-3 resulted in the highestgrowth rate. However, growth rate of fungi when using DRT impeller at high Pv was significantly decreased. Theresults of DCW versus Pv at t =72 h (Fig. 5) were also compatible with the results shown in Fig. (4).
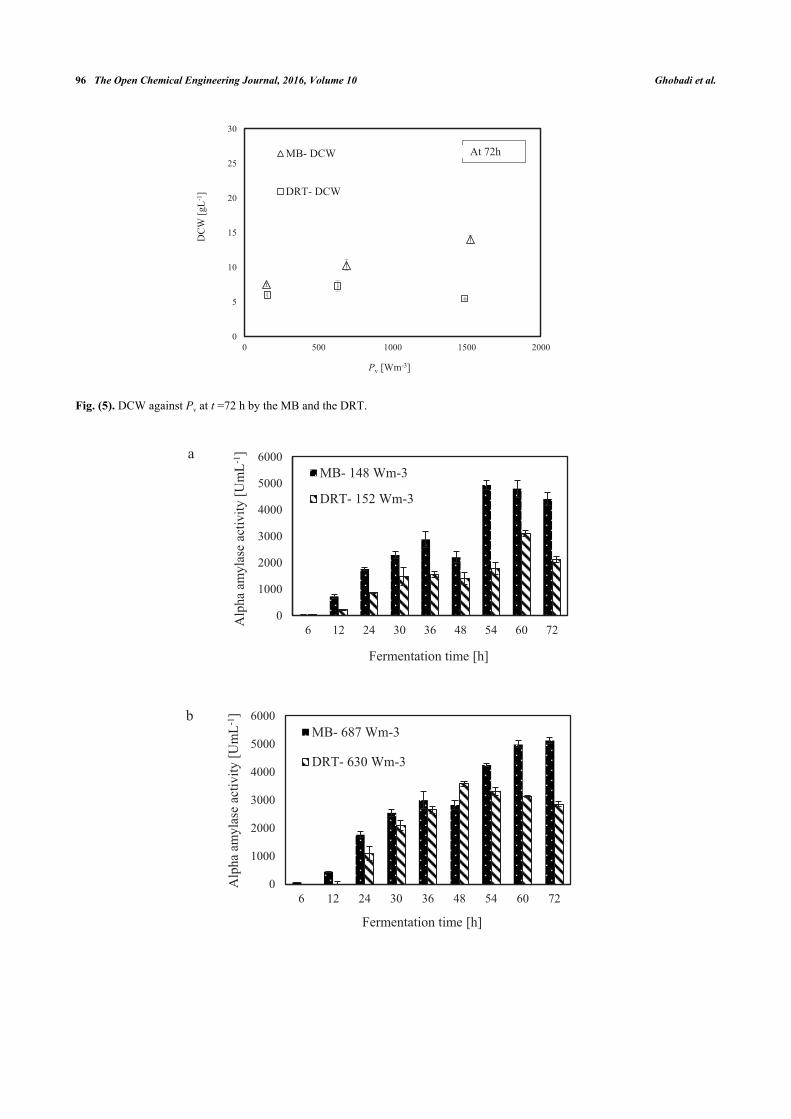
The alpha amylase activity of the fermentation culture was measured after filtration of the culture broth during eachsampling. These results are shown in Fig. (6). It is clear that in all cases by increasing the Pv from low to moderate, theenzyme activity was increased, but at high Pv the activity, would be decreased. Diagram of changing Re (Fig. 7) duringeach fermentation condition showed that the time of cells exposing to the turbulent regime when using MB impeller athigh Pv were the highest (Re>1000 until t = 42h). These results are important as a validation of exposure time to stresswhen using MB impeller at high Pv. Because by increasing the Pv the shear stress (particularly near the grid section ofblade) dramatically has been increased and morphology of cells were damaged. Therefore, the enzyme production wasdecreased however the KLa and DO concentration was increased.
The experimental results of this study showed that increasing the Pv during the fermentation by both impellers had asignificant negative effect on both enzyme activity and also the costs of energy consumption. The results of the powerdensity effect on enzyme activity at t = 72 h are shown in Fig. (8). The data show that at low Pv, the mixing by the MBcan enhance the enzyme activity in comparison with mixing by the DRT much more than that of the fermentation atmoderate and high Pv. Regarding to the results shown in Fig. (5), biomass production could not be the main reason forthe large differences between the enzyme activity of the MB and the DRT impellers at low Pv, because the differencebetween the DCW of fungi agitated at low Pv was not large.
3.2. The Morphology Properties of Fungi at Different Power Densities by the MB and the DRT
For the production of enzyme by fungi, the pellet is usually reported as being the desired morphology [26]. Freefilamentous mycelia give a viscous culture broth as a result of low gas-liquid mass transfer, and high powerconsumption. Here, the pellet diameter and hyphae length of mycelium were two morphological factors measured atdifferent Pvs. Effect of changing the Pv by MB and DRT on these morphology factors were shown in Fig. (9a and b). Inaddition, Images of the pellet cell formation during fermentation are shown in Fig. (9c). These indicate that changes inthe Pv using the MB impeller caused significant changes in the pellet diameter. The main reason could have been thehigh mean shear rate when using the MB impeller based on the method established by Metzner [22], and was shown inTable 1. The results of Fig. (9c) show that the cells of A.oryzae were more hairy than the case when the DRT was usedat low Pv. Pellets mixed by the DRT at high Pv were attached with large hairy zones, but as shown in Fig. (9c), most ofthe pellet hairs were broken by the high shear stress at the tip of the blades. In particular, the cells were more subject todamage near the turbine tips where the highest speed gradient were reached. The microscopic image of pellet cells inFig. (9d) also shows that agitation at high Pv prevented optimized growth of the cells when using the DRT, and,therefore, the morphology of the pellets began to form clumps (pellets with a weak core zone and loosely hair zone).The stressed pellets that were agitated by the MB impeller at high power consumption were without any branched hairyportions.
96 The Open Chemical Engineering Journal, 2016, Volume 10 Ghobadi et al.
Fig. (5). DCW against Pv at t =72 h by the MB and the DRT.
0
5
10
15
20
25
30
0 500 1000 1500 2000
DC
W [g
L-1]
Pv [Wm-3]
MB- DCW
DRT- DCW
At 72h
0
1000
2000
3000
4000
5000
6000
6 12 24 30 36 48 54 60 72Alp
ha a
myl
ase
activ
ity [U
mL-1
]
Fermentation time [h]
MB- 148 Wm-3
DRT- 152 Wm-3
0
1000
2000
3000
4000
5000
6000
6 12 24 30 36 48 54 60 72
Alp
ha a
myl
ase
activ
ity [U
mL-1
]
Fermentation time [h]
MB- 687 Wm-3
DRT- 630 Wm-3
a
b

Fermentation Intensification by Maxblend The Open Chemical Engineering Journal, 2016, Volume 10 97
Fig. (6). Alpha amylase activity versus fermentation time during fermentation by MB and DRT at (a): low Pv, (b): moderate Pv; (c):high Pv.
Fig. (7). Changing the Re in each sampling during the fermentation using MB and DRT impellers.
0
1000
2000
3000
4000
5000
6000
6 12 24 30 36 48 54 60 72
Alp
ha a
myl
ase
activ
ity [U
mL-1
]
Fermentation time [h]
MB- 1524 Wm-3
DRT- 1487 Wm-3
c
1
10
100
1000
10000
0 12 24 36 48 60 72
Re
Fermentation time [h]
MB- 148 W/m3
MB- 687 W/m3
MB- 1524 W/m3
1
10
100
1000
10000
0 12 24 36 48 60 72
Re
Fermentation time [h]
DRT- 152 W/m3
DRT- 630 W/m3
DRT- 1487 W/m3
a
b
Wm-3
Wm-3
Wm-3
Wm-3
Wm-3
Wm-3

98 The Open Chemical Engineering Journal, 2016, Volume 10 Ghobadi et al.
Fig. (8). Alpha amylase activity against Pv during fermentation by MB and DRT at 72 h.
Fig. (9). Pellet diameter versus fermentation time at different Pvs, (a): MB, (b): DRT.
0
1000
2000
3000
4000
5000
6000
0 500 1000 1500 2000
Alp
ha a
myl
ase
activ
ity [U
mL-1
]
Pv [Wm-3]
MB- Enzyme activity
DRT- Enzyme activity
0
2
4
6
8
10
12
0 6 12 18 24 30 36 42 48 54 60 66 72
Pelle
t dia
met
er [m
m]
Fermentation time [h]
MB- 148 Wm-3MB- 687 Wm-3MB- 1524 Wm-3
0
2
4
6
8
10
12
0 6 12 18 24 30 36 42 48 54 60 66 72
Pelle
t dia
met
er [m
m]
Fermentation time [h]
DRT- 152 Wm-3DRT- 630 Wm-3DRT- 1487 Wm-3
a
b

Fermentation Intensification by Maxblend The Open Chemical Engineering Journal, 2016, Volume 10 99
Fig. (9c). Pellet macro morphologies of A.oryzae during the fermentation by MB and DRT at low, moderate and high Pvs.
Fig. (9d). Mixing effect at low and high Pv using MB and DRT impellers on macro-morphology.
Micromorphology studies (Fig. 10a and b), have shown that changing the Pv by two impellers did not affect thehyphae diameter but the hyphae length of fungi could be changed at low, moderate and high Pv. Measurement results(Fig. 10a and b) showed that by increasing the average shear rate during mixing by the MB at low and high Pv theaverage hyphae length was decreased from (38.37±8.55) µm to (26.3±5.50) µm. Fig. (10c) shows that because of a highmean shear rate at the tip of the turbine blade most of the hyphae and mycelium was mechanically damaged and cut.Breakage of the hyphae might result in preventing formation of the active tips during fermentation and decreasing theenzyme activity. Microscopic images of changing the hyphae length by changing the impeller type and the Pv from lowto moderate values are shown in Fig. (11a). Comparison among hyphae lengths in all four cases showed that the hyphae
Low Pv
Moderate Pv
High Pv
MB-148 Wm-3 DRT-152 Wm-3
MB- 1487 Wm-3 DRT-1524 Wm-3
Low Pv
High Pv
A B
D C

100 The Open Chemical Engineering Journal, 2016, Volume 10 Ghobadi et al.
of pellets agitated using the MB at low Pv, were longer than the samples agitated by the DRT. Therefore, MB provideda convenient medium for elongation of hyphae at low mixing intensity. Fig. (11a and c), show that by changing the Pv
of the MB impeller from 148 to 687 Wm-3, the maximum hyphae length of A.oryzae was approximately decreased from(220 ±3.199) µm to (60 ±8.003) µm. Moreover, however fermentation using MB impeller at low Pv, was intensified theenzyme production and also the local stagnant zone could be decreased, but by increasing the Pv the morphology(macro-morphology and micro-morphology) could not be controlled. Also, increasing the Pv during fermentation whenusing a DRT impeller resulted in the maximum hyphae length reduction. It was of from (109 ±2.553) µm to (70 ±2.523)µm, (Fig. 11b and d).
Fig. (10). Hyphae length versus fermentation time at low, moderate and high Pvs, (a): MB, (b): DRT.
Fig. (10c). Microscopic image of the effect of agitation by the DRT at moderate and high Pv on hyphae fragmentation, (500x).
3.3. Intensification of Oxygen Mass Transfer
In the present study, a survey on the effect of agitation and impellers on oxygen mass transfer was accomplished bymeasuring the DO [ppm] in culture media. The recorded values are shown in Fig. (12). In this study, it would be
0
20
40
60
80
100
120
0 6 12 18 24 30 36 42 48 54 60 66 72
Hyp
hae
leng
ht [m
icro
met
er]
Fermentation time [h]
MB- 148 Wm-3MB- 687 Wm-3MB- 1524 Wm-3
0
20
40
60
80
100
120
0 6 12 18 24 30 36 42 48 54 60 66 72
Hyp
hae
leng
ht [m
icro
met
er]
Fermentation time [h]
DRT- 152 Wm-3
DRT- 630 Wm-3
DRT- 1487 Wm-3
a
b
1487 Wm-3 630 Wm-3

Fermentation Intensification by Maxblend The Open Chemical Engineering Journal, 2016, Volume 10 101
important to note that because the cells had adhered to the DO sensor, the real DO concentration could not be easilyrecorded. Although the culture DO had not reached zero at 48-54 h after fermentation, the DO probe showed that theconcentration of the oxygen was near zero. Therefore, qualitative observations show that the MB impeller may providebetter oxygen transfer. Decreasing the mixing time (Appendix) in comparison with DRT at the same Pv could be one ofthe reason of increasing the DO when using MB. Also, for approving the impact of impeller design as a secondary gasdispersion object, the monitored DO concentration in fermentation culture using both impeller was compared with theDO values in culture that was not agitated (only used ring sparger for aeration) as shown in Fig. (13). Results of Fig.(13) indicate that using the MB impeller can control and keep the DO mixing concentration at high value. Besides, thecoalescence of bubble in three different mixing condition were agreed with the recorded concentration of DO mixing.These results were compatible with the other findings [16], it was showed when a large cross-section impeller wasoperated at a high level Pv, the total level of oxygen inside the impeller was increased. Also, it was found [29] thatcontrol of the DO concentration during the mixing of BC (bacterial cellulose) cells using turbine impellers was notpossible, and controlling the DO level was not effective for maintaining a high degree of BC productivity. The mostdistinctive difference between the MB and turbine impellers is the configuration around the sparger [29]. To betterunderstand the effect of impeller configuration, static method [17] was used to measure the average KLa of afermentation culture. Results of KLa Fig. (14) indicates, the MB significantly intensified KLa at low and moderate powerinput in comparison with high power input. In addition, the decrease in enzyme activity at high Pv during fermentationby the MB was due to the incomplete growth of the stressed cells. By increasing the KLa, fungal growth rate and alsothe thixotropic behavior of fermentation culture (changing the Re at different sampling time was the representative ofviscosity change by time (Fig. 7) have been increased by an un-controlled way when using MB impeller at high Pv. Asshown in Fig. (9d), however, the biomass was increased, but the cells would not grow branches until the end of thefermentation process.
Fig. (11). Microscopic image of the effect of agitation by the MB ( (a) and (c) ), and DRT ( (b) and (d) ) at low and moderate Pv onhyphae length (1000x).s
3.4. Properties of Average Shear Rate and Velocity Distribution at Different Pvin Submerged Culture Using theMB and DRT
The average shear rates listed in Table 1 show that these greatly influenced the morphology of the cells in thefermenter. According to the results shown in Table 1 and in Fig. (10a and b), by increasing the difference between themean shear rates of the impellers, the difference between the hyphae lengths of the cultures was also increased. Studyon the behavior of mixing by the MB showed that there was a big difference between the average shear rates (133 s-1) at
(c) (d)
(b) (a)
MB
152 Wm-3
630 Wm-3
148 Wm-3
687 Wm-3
DRT

102 The Open Chemical Engineering Journal, 2016, Volume 10 Ghobadi et al.
low and high Pvs, which caused a significant decrease in the hyphal lengths and the pellet diameters. Finally, it can beconcluded that changing the power of impellers affects the way of the cells relate to the surrounding environment.Besides, the growth and product formation rates are also influenced. In the present study, at Pv = 148 Wm-3 with theMB, the effective shear rate was more than that with the DRT, but because of uniform culture velocity distribution, cellsgrew like hairy pellets with a big core zone that formed an appropriate media for mass transfer during fermentation. Thesimulation results were compatible with the literature [17], showed that the MB dispersed the bubbles with a highdegree of shear between the bottom and the tip of the impeller.
Fig. (12). Effect of impeller type and Pv on DO mixing concentration in a fermentation culture by MB and DRT (a): Low Pv , (b):Moderate Pv , (c): High Pv.
0
2
4
6
8
10
12
14
0 6 12 18 24 30 36 42 48 54 60 66 72
DO
[ppm
]
Fermentation time [h]
A MB- 148 Wm-3
DRT- 152 Wm-3
0
2
4
6
8
10
12
14
0 6 12 18 24 30 36 42 48 54 60 66 72
DO
[ppm
]
Fermentation time [h]
DRT- 630 Wm-3
MB- 687 Wm-3
0
2
4
6
8
10
12
14
16
0 6 12 18 24 30 36 42 48 54 60 66 72
DO
[ppm
]
Fermentation time [h]
A DRT- 1487 Wm-3
MB- 1524 Wm-3
a
b
c

Fermentation Intensification by Maxblend The Open Chemical Engineering Journal, 2016, Volume 10 103
Fig. (13). Comparison between the DO mixing values during fermentation with impeller and without impeller.
Fig. (14). Effect of impeller and input power consumption on KLa intensification.
The results of the effective viscosity according to Metzner and Otto`s method for each of the average shear rates ofthe impellers are listed in Table 1. Table 1 showed that using the MB at low Pv (148 Wm-3) could result in a lower µeff
(0.171 Pa s), it was compared with using the DRT at moderate Pv, (630 Wm-3), 0.147 Pa s. For example, the µeff offermentation when using the MB (152 Wm-3) was 0.080Pa s, and when the DRT impellers was used at 630 Wm-3 the µeff
reached 0.103 Pa s. This is because increasing the viscosity reduces the circulation that is induced by the DRT impeller[30]. To sum up, it could be concluded that using the MB impeller could intensify the production of low-viscositycultures (Table 1). Therefore, low-viscosity cultures can enhance the oxygen and nutrient mass-transfer.
0
2
4
6
8
10
12
14
0 6 12 18 24 30 36 42 48 54 60 66 72
DO
[ppm
]
Fermentation time [h]
MB- 148 Wm-3DRT- 152 Wm-3noimpeller
0
50
100
150
200
250
300
350
400
0 0.5 1 1.5 2
KLa
[ h-1
]
Input power consumption [W]
DRTMB

104 The Open Chemical Engineering Journal, 2016, Volume 10 Ghobadi et al.
Fig. (15). Simulation of velocity distribution combined with laser flow pattern visualization (using air-glycerol) in stirredfermentation by (a): DRT (b): MB, in (Y-Z) plane.
It is noticed that, besides of flow simulation, the gas-liquid flow pattern of mixing at the Pv (similar to fermentationconditions) and aeration rate was visualized using laser beam (Fig. 15a). The results of a velocity simulation (Fig. 15a)showed that when the Pv of mixing with the DRT was increased from 152 to 630 Wm-3, the local velocity near the bladetip was increased from 0.31 ms-1 to 0.92 ms-1 (Table 1 ). Also, while the velocity distribution of the MB (Fig. 15b) wasuniform at low Pv, the local velocity, or shear rate, for the DRT was changed. However, the Pv of the DRT (152 Wm-3)was lower than that for the MB, but the local velocity at the center of the DRT fermenter, 0.18 ms-1, was higher than itwas for the MB (0.1 ms-1). This local difference could result in a local difference in mass transfer and cell growth andcould produce a stagnant zone near the tank wall. The formation of a stagnant zone at the bottom and wall of afermenter results in cell fluidization, as shown in Fig. (16). At a high Pv when using the DRT, a high velocity profilecovered the entire cross-section of the tank (0.31 ms-1) and significantly damaged the cells. Also, the comparison offluid flow velocity (Table 2) with the recent literatures [14, 19, 30 - 32] was shown as quantitative validation of flowvelocity.
Flow velocity (ms-1)
(a) DRT
High and Same Pv Moderate and Same Pv Low and Same Pv
N = 8.33 s-1 N = 5.17 s-1 N = 5.00 s-1 N = 3.10 s-1 N =1.67 s-1 N = 1.00 s-1
Flow velocity (ms-1)
(b) MB
High and same Pv Moderate and same Pv Low and same Pv
N = 500 s-1 N = 267 s-1 N = 300 s-1 N = 170 s-1 N = 100 s-1 N = 57 s-1

Fermentation Intensification by Maxblend The Open Chemical Engineering Journal, 2016, Volume 10 105
Fig. (16). Effect of agitation by the MB and the DRT on cell fluidization in the fermentation of A.oryzae in an image study at lowand moderate Pv.
Generally, the results of the effective shear rate and viscosity agreed with the results from the velocity simulation.This means that by uniform changes in the velocity distribution when using the MB impeller at low Pv, the µeff wasdecreased, and the cell growth and enzyme activity also was increased. It was shown [31] that the local KLa values inthe mixing of Xanthan gum by a 3-RT near the bottom of the impeller were 1.4 times greater with a local KLa that wasstrongly dependent on the local flow field. The results of the velocity distribution (Fig. 15a), show that mixing with theDRT at 630 Wm-3 produced a strong velocity profile near the impellers, and also caused a large degree of loopcirculation between the blades, but the region near the shaft and at the inter-zone section of this big loop exhibited highviscosity during the fermentation. The local difference in velocity distribution [33] when using the DRT resulted in adifference between the KLa and the viscosity in the culture. Under these conditions the cells cannot grow sufficiently toproduce high enzyme activity. When using the MB impeller (Fig. 15b), however, the velocity distribution was roughlyuniform, with the noted exception of a small region near the external grid. The velocity distribution at moderate Pv
300-rpm 100-rpm
Local cell fluidization and
high shear stress near the
blade, stagnant zone at
bottom and near the wall
zone
Local cell fluidization and
non-uniform cell growth,
stagnant zone far away of
central region of reactor
Uniform cell fluidization
Uniform shear distribution
Uniform cell fluidization
Uniform shear distribution
A-630 Wm-3
DRT
MB
B-152 Wm-3
C-687 Wm-3 D-148 Wm-3

106 The Open Chemical Engineering Journal, 2016, Volume 10 Ghobadi et al.
showed that the velocity of the fermentation culture when using the MB was uniformly distributed. The fluid velocitydistribution study, also showed that the velocity of the culture near the wall when using the MB was more uniform thanwhen using the DRT at moderate power consumption. Besides, according to last studies [34] by increasing the workingvolume during mixing a non-Newtonian fluid by increasing the scale of tanks, the Pv and dimension less mixing timeexhibited similar behavior. Also working principles of MB impeller is always the same but exhibits higher or lowefficiency depending on the flow regime. It means that this work also has a potential for future works to be donesuccessfully in larges scales.
Table 2. Comparison between the results of flow velocity simulation in this study and literatures.
Impeller type RheologicalModel of fluid
Flow regime- Medium Velocity aroundthe blade (ms-1)
VelocityNear the tank
wall (ms-1)
References
MB Shear-thinning (n = 0.18, K = 33.1) Laminar(Re = 30, 65, 120);
Xanthan gum solution 3.5%
(0.33,0.38, 0.66) (0.27, 0.41,0.58)
[30]
DPP*3-6ABDT**3-6ABDT***
Shear-thinning (n = 0.71, K =0.032)
Turbulent,(Re = 1156); fermentation culture ofS.avermitilis
1.501.201.13
0.600.500.41
[29]
DRT Newtonian Turbulent 2.0 0.48 [31]MB Newtonian Laminar - (Re = 32.4) 0.6 - 0.8 0.45 [19]MB Newtonian Turbulent- (Re = 18000)
(Solution of polyethylene glycol 25 wt%)0.6 0.2 [14]
MB Shear-thinning (n = 0.3, K = 1.8) Laminar- fermentation culture of A.oryzae(Reave,lam = 162 )
0.85 0.36 This study
DRT Shear-thinning (n = 0.3, K= 2.5) Laminar- fermentation culture of A.oryzae(Reave,lam = 31 )
0.70 0.30 This study
*; down-pumping propellers**;6-curved-blade disk turbine***;6-arrowy-blade disk turbine
CONCLUSION
The present study showed that at low power consumption the enzyme activity and biomass production was greatlyintensified when using the MB in comparison with the use of the DRT. At low Pv, the difference in the Pv between thetwo impellers was very small, but the difference in the average shear rate was relatively large. The cell agitation at lowPv when using the MB was larger and more high-branched with higher enzyme activity than when using the DRT. Atthe highest levels of Pv during agitation by the MB, there was good axial mixing and oxygen mass transfer with nodamage to the cells, but the high average shear rate conditions led to inefficient cell activity and finally low enzymeactivity.
LIST OF ABBREVIATIONS
CD = Drag coefficient -
D = Impeller diameter [m]
F = Force [N]
H = Internal vessel diameter of fermenter [m]
k = k Metzner-Otto coefficient -
K = Consistency index [Pa sn]
KLa = Volumetric mass transfer coefficient [h-1]
Ks = Shearing constant -
N = Rotational rate [s-1]
NP = Power number -
n = Flow index -
P = Pressure [Pa]
Pv = Power consumption per unit volume [Wm-3]
Re = Reynolds number -

Fermentation Intensification by Maxblend The Open Chemical Engineering Journal, 2016, Volume 10 107
Tm = Torque [Nm]
Tm = Mixing time [s]
W = Width of impeller [m]
μ = Drag coefficient [Pa s]
μmax = Maximum specific growth rate [h-1]
μeff = Effective viscosity [Pa s]
ρ = Density of culture broth [kgm-3]
= Flow velocity [ms-1]
τ = Shear stress [Pa]
γ˙ave = Average shear rate [s-1]
α = Phase volume fraction -
DO = Dissolved oxygen [ppm]
DCW = Dry cell weight [gL-1]
MB = Maxblend -
DRT = Double Rushton turbine -
STR = Stirred tank reactor -
APPENDIX
Results of Table A1 and A2 indicates in the condition using DRT, the NTm and Tm were strongly depended on Reand Pv, and also it was seen that at the same Pv and ReTm of mixing by MB was lower than that of the DRT.
Table A1. Correlations of NTm -Re for different impellers using water.
Impeller Correlation ( Re: ~ ) R2DRT NTm = 983.3 Re-0.375 0.865MB NTm = 198.0 Re-0.190 0.815
Table A2. Correlations of Tm -Pv for different impellers using water.
Impeller Correlation R2DRT Tm = 2478.0 Pv
-1.055 0.972
MB Tm = 918.0 Pv-0.747 0.855
CONFLICT OF INTEREST
The authors confirm that this article content has no conflict of interest.
ACKNOWLEDGEMENTS
This work was supported by Special Coordination Funds for Promoting Science and Technology, the Creation ofInnovation Centers for Advanced Interdisciplinary Research Areas (Innovative Bioproduction Kobe) from the Ministryof Education, Culture, Sports, Science and Technology (MEXT), Japan. We gratefully thank Sumitomo HeavyIndustries Co., Ltd., Tokyo, Japan.
REFERENCES
[1] D. Aubert, J. Lehmbeck, M.T. Hansen, and C. Hjort, "High level Aspergillus production of proteins", Microb. Cell Fact., vol. 5, pp. 1-2, 2006.[http://dx.doi.org/10.1186/1475-2859-5-S1-S27] [PMID: 16396686]
[2] M. Machida, K. Asai, M. Sano, T. Tanaka, T. Kumagai, G. Terai, K. Kusumoto, T. Arima, O. Akita, Y. Kashiwagi, K. Abe, K. Gomi, H.Horiuchi, K. Kitamoto, T. Kobayashi, M. Takeuchi, D.W. Denning, J.E. Galagan, W.C. Nierman, J. Yu, D.B. Archer, J.W. Bennett, D.Bhatnagar, T.E. Cleveland, N.D. Fedorova, O. Gotoh, H. Horikawa, A. Hosoyama, M. Ichinomiya, R. Igarashi, K. Iwashita, P.R. Juvvadi, M.Kato, Y. Kato, T. Kin, A. Kokubun, H. Maeda, N. Maeyama, J. Maruyama, H. Nagasaki, T. Nakajima, K. Oda, K. Okada, I. Paulsen, K.Sakamoto, T. Sawano, M. Takahashi, K. Takase, Y. Terabayashi, J.R. Wortman, O. Yamada, Y. Yamagata, H. Anazawa, Y. Hata, Y. Koide,T. Komori, Y. Koyama, T. Minetoki, S. Suharnan, A. Tanaka, K. Isono, S. Kuhara, N. Ogasawara, and H. Kikuchi, "Genome sequencing andanalysis of Aspergillus oryzae", Nature, vol. 438, no. 7071, pp. 1157-1161, 2005.[http://dx.doi.org/10.1038/nature04300] [PMID: 16372010]
8>>⃗

108 The Open Chemical Engineering Journal, 2016, Volume 10 Ghobadi et al.
[3] E. Ichishima, Unique enzymes of Aspergillus fungi used in Japanese bio industries., Nova Science Publishers Inc., 2011.
[4] Z.J. Li, V. Shukla, K.S. Wenger, A.P. Fordyce, A.G. Pedersen, and M.R. Marten, "Effects of increased impeller power in a production-scaleAspergillus oryzae fermentation", Biotechnol. Prog., vol. 18, no. 3, pp. 437-444, 2002.[http://dx.doi.org/10.1021/bp020023c] [PMID: 12052056]
[5] G. Enrique, and W. Alvin, "Mixing of highly viscous simulated Xanthan fermentation broths with the Lightnin A-315 impeller", Biotechnol.Prog., vol. 8, pp. 233-239, 1992.[http://dx.doi.org/10.1021/bp00015a009]
[6] J. Audet, M. Lounes, and J. Thibault, "Pullunan fermentation in a reciprocating plate bioreactor", J. Bioproc. Eng., vol. 15, pp. 209-214, 1996.[http://dx.doi.org/10.1007/BF00369484]
[7] A. Amanullah, L. Serrano-Carreon, B. Castro, E. Galindo, and A.W. Nienow, "The influence of impeller type in pilot scale xanthanfermentations", Biotechnol. Bioeng., vol. 57, no. 1, pp. 95-108, 1998.[http://dx.doi.org/10.1002/(SICI)1097-0290(19980105)57:1<95::AID-BIT12>3.0.CO;2-7] [PMID: 10099183]
[8] M. Papagianni, M. Mattey, and B. Kristiansen, "Design of a tubular loop bioreactor for scale-up and scale-down of fermentation processes",Biotechnol. Prog., vol. 19, no. 5, pp. 1498-1504, 2003.[http://dx.doi.org/10.1021/bp030002y] [PMID: 14524711]
[9] W. Tang, A. Pan, H. Lu, J. Xia, Y. Zhuang, S. Zhang, J. Chu, and H. Noorman, "Improvement of glucoamylase production using axialimpellers with low power consumption and homogeneous mass transfer", Biochem. Eng. J., vol. 99, pp. 167-176, 2015.[http://dx.doi.org/10.1016/j.bej.2015.03.025]
[10] S. Kelly, L.H. Grimm, J. Hengstler, E. Schultheis, R. Krull, and D.C. Hempel, "Agitation effects on submerged growth and product formationof Aspergillus niger", Bioprocess Biosyst. Eng., vol. 26, no. 5, pp. 315-323, 2004.[http://dx.doi.org/10.1007/s00449-004-0368-y] [PMID: 15309605]
[11] E.M. Rodriguez Porcel, J.L. Casas Lopez, J.A. Sanchez Perez, J.M. Fernandez Sevilla, and Y. Chisti, "Effects of pellet morphology on brothrheology in fermentations of Aspergillus terreus", Biochem. Eng. J., vol. 26, pp. 139-144, 2005.[http://dx.doi.org/10.1016/j.bej.2005.04.011]
[12] Y.Q. Cui, R.G. van der Lans, and K.C. Luyben, "Effect of agitation intensities on fungal morphology of submerged fermentation", Biotechnol.Bioeng., vol. 55, no. 5, pp. 715-726, 1997.[http://dx.doi.org/10.1002/(SICI)1097-0290(19970905)55:5<715::AID-BIT2>3.0.CO;2-E] [PMID: 18636582]
[13] A. Iranshahi, C. Devals, M. Heniche, L. Fradette, and P.A. Tanguy, "Hydrodynamics characterization of the Maxblend impeller", J. Chem.Eng. Sci., vol. 62, pp. 3641-3653, 2007.[http://dx.doi.org/10.1016/j.ces.2007.03.031]
[14] A. Hidalgo Millán, R. Zenit, C. Palacios, R. Ytomi, H. Horiguchi, P.A. Tanguy, and G. Ascanio, "On the hydrodynamics characterization ofthe straight Maxblend impeller with Newtonian fluids", Chem. Eng. Res. Des., vol. 90, pp. 1117-1128, 2012.[http://dx.doi.org/10.1016/j.cherd.2012.01.006]
[15] C. Devals, M. Heniche, K. Takenaka, and P.A. Tanguy, "CFD analysis of several design parameters affecting the performance of theMaxblend impeller", Comput. Chem. Eng., vol. 32, pp. 1831-1841, 2008.[http://dx.doi.org/10.1016/j.compchemeng.2007.09.007]
[16] K. Takahashi, H. Horiguchi, M. Mishima, and R. Yatomi, "Mixing characteristics in a vessel agitated by large paddle impeller Maxblend",Proceedings of 12th European Conference on Mixing. June 27-30, Bologna, Italy, 2006, pp. 628-634.
[17] T. Kouda, H. Yano, F. Yoshloaga, M. Kaorbtoyama, and M. Kamiwano, "Characterization of non-Newtonian behavior in the mixing ofbacterial cellulose in a bioreactor", J. Ferment. Bioeng., vol. 82, pp. 382-386, 1999.[http://dx.doi.org/10.1016/0922-338X(96)89155-0]
[18] O. Hiruta, K. Yamamura, H. Takebe, T. Futamura, K. Iinuma, and H. Tanaka, "Application of Maxblend fermentor for microbial processes",J. Ferment. Bioeng., vol. 83, pp. 79-86, 1998.[http://dx.doi.org/10.1016/S0922-338X(97)87331-X]
[19] W. Yao, M. Mishima, and K. Takahashi, "Numerical investigation on dispersive mixing characteristics of Maxblend and double helicalribbons", Chem. Eng. J., vol. 84, pp. 565-571, 2001.[http://dx.doi.org/10.1016/S1385-8947(01)00135-8]
[20] P. Benfield, "Amylases, α and ß", Methods in Enzymology. Academic Press Inc., vol. 1, pp. 149-158, 1995.
[21] H. Sata, M. Umeda, C.H. Kim, H. Taniguchi, and Y. Maruyama, "Amylase-pullulanase enzyme produced by B. circulans F-2", J. Biochimicaet Biophysica Acta, vol. 991, pp. 388-394, 1989.[http://dx.doi.org/10.1016/0304-4165(89)90062-7]
[22] A.B. Metzner, and R.E. Otto, "Agitation of non-Newtonian fluids", AIChE J., vol. 3, pp. 3-11, 1957.[http://dx.doi.org/10.1002/aic.690030103]
[23] J.C. Gabelle, E. Jourdier, R.B. Licht, F. Ben Chaabane, I. Henaut, J. Morchain, and F. Augier, "Impact of rheology on the mass transfercoefficient during the growth phase of Trichoder mareesei in stirred bioreactors", Chem. Eng. Sci., vol. 75, pp. 408-417, 2012.[http://dx.doi.org/10.1016/j.ces.2012.03.053]

Fermentation Intensification by Maxblend The Open Chemical Engineering Journal, 2016, Volume 10 109
[24] A.W. Nienow, G. Hunt, and B.C. Buckland, "A fluid dynamic study using a simulated viscous, shear thinning broth of the retrofitting of largeagitated bioreactors", Biotechnol. Bioeng., vol. 49, no. 1, pp. 15-19, 1996.[http://dx.doi.org/10.1002/(SICI)1097-0290(19960105)49:1<15::AID-BIT2>3.3.CO;2-6] [PMID: 18623548]
[25] Sumitomo Heavy Industries, Available at: http://www.shi.co.jp/maxblendclub/e-index.html.
[26] P. Znidarsic, and A. Pavko, "The morphology of filamentous fungi in submerged cultivations as a bioprocess parameter", Food Technol.Biotechnol., vol. 39, pp. 237-252, 2001.
[27] A. Leduy, A.A. Marsan, and B. Coupal, "A study of the rheological properties of a non-Newtonian fermentation broth", Biotechnol. Bioeng.,vol. 16, no. 1, pp. 61-76, 1974.[http://dx.doi.org/10.1002/bit.260160106] [PMID: 4855899]
[28] E. Olsvik, and B. Kristiansen, "Rheology of filamentous fermentations", Biotechnol. Adv., vol. 12, no. 1, pp. 1-39, 1994.[http://dx.doi.org/10.1016/0734-9750(94)90288-7] [PMID: 14547817]
[29] T. Kouda, H. Yano, and F. Yoshinaga, "Effect of agitator configuration on bacterial cellulose productivity in aerated and agitated culture", J.Ferment. Bioeng., vol. 83, pp. 371-37, 1997.[http://dx.doi.org/10.1016/S0922-338X(97)80144-4]
[30] J-Y. Xia, Y-H. Wang, S-L. Zhang, N. Chen, P. Yin, Y-P. Zhuang, and J. Chu, "Fluid dynamics investigation of variant impeller combinationsby simulation and fermentation experiment", Biochem. Eng. J., vol. 43, pp. 252-260, 2009.[http://dx.doi.org/10.1016/j.bej.2008.10.010]
[31] H. Ameur, M. Bouzit, and M. Helmaoui, "Hydrodynamic study involving a maxblend impeller with yield stress fluids", J. Mech. Sci. Tech.,vol. 2, pp. 1523-1530, 2012.[http://dx.doi.org/10.1007/s12206-012-0337-3]
[32] M. Taghavi, and R. Zadghaffari, "J, Moghaddas, and Y. Moghaddas, “Experimental and CFD investigation of power consumption in a dualRushton turbine stirred tank", Chem. Eng. Res. Des., vol. 89, pp. 280-290, 2011.[http://dx.doi.org/10.1016/j.cherd.2010.07.006]
[33] M-H. Xie, J-Y. Xia, Z. Zhou, G-Z. Zhou, J. Chu, Y-P. Zhuang, S-l. Zhang, and H. Noorman, "Power consumption, local and averagevolumetric mass transfer coefficient in multiple-impeller stirred bioreactors for Xanthan gum solutions", Chem. Eng. Sci., vol. 106, pp.144-156, 2014.[http://dx.doi.org/10.1016/j.ces.2013.10.032]
[34] D. Patel, F. Ein-Mozaffari, and M. Mehrvar, "Improving the dynamic performance of continuous-flow mixing of pseudoplastic fluidspossessing yield stress using Maxblend impeller", Chem. Eng. Res. Des., vol. 90, pp. 514-523, 2012.[http://dx.doi.org/10.1016/j.cherd.2011.08.022]
© Ghobadi et al.; Licensee Bentham Open
This is an open access article licensed under the terms of the Creative Commons Attribution-Non-Commercial 4.0 International Public License(CC BY-NC 4.0) (https://creativecommons.org/licenses/by-nc/4.0/legalcode), which permits unrestricted, non-commercial use, distribution andreproduction in any medium, provided the work is properly cited.