the organic presentation tool - semantic scholar · 3.1 basic features in the organic presentation...
TRANSCRIPT

The Organic Presentation ToolDavy Vanacken, Kris Luyten, Karin Coninx
Hasselt University – tUL – IBBT Expertise Centre for Digital Media
Wetenschapspark 2, 3590 Diepenbeek, Belgium
Maarten Cardinaels TinkerTouch
Wetenschapspark 4, 3590 Diepenbeek, Belgium
ABSTRACT In this paper, we present the Organic Presentation Tool. The conventional presentation software suits a very specific style of presenting, but other ways of navigation and visualization are often preferred. Only a few tools break away from the typical slideware approach. We present an alternative presentation tool that combines features such as planar information structures, focus-plus-context visualizations and multi-touch interaction. Our main goal is to enable presenters to create stories, but also to make sure that they can easily divert from and return to these stories ‘on-the-fly’, while giving the presentation. We explore how this type of tool can make a combination of creative storytelling and interaction with the audience (influencing the flow of the presentation) possible.
Categories and Subject Descriptors H.5.2 [Information interfaces and presentation]: User Interfaces - Interaction styles.
Keywords Presentation tool, on-the-fly presentation, multi-touch.
1. INTRODUCTION Current presentation software is still built around interaction metaphors originating from old-school slide projectors, which have been around since the 1950’s. Slide projectors pass light through a transparent slide and lens, resulting in the projection of an enlarged image onto a screen. Information was structured and presented as a linear sequence of slides, not because it is the best way to organize the data, but because of the limitations of the existing technology.
In recent years, there is a noticeable evolution towards a presentation style that is much more story-based. Storytelling is a far more natural way of presenting, and improves the communication between speaker and audience. Among others, Scott Berkun, a highly regarded speaker, points out that storytelling is an important development in the methodology of presenting [4]. In story-based presentations, the flow of information is no longer considered to be strictly linear and completely predefined. The flow of information is not only determined by the presenter, but also by the audience and the circumstances under which the presentation takes place. The audience may have a different
background than expected and more contextual information is needed, the talk may have to be shortened a little due to unexpected circumstances, a graph that is not part of the presented material may be convenient to shed light on a particular question, etc.
The present-day slideware approaches, however, are not built with flexible, story-based presentations in mind. Although the current technical possibilities are far less constraining than the old-fashioned slide projectors, current presentation software still limits us to the use of rectangular, equal sized slides, ordered as a strictly linear, predefined sequence.
In this paper, we explore the idea of ‘on-the-fly’ presentations that allow much more flexibility and creativity than the traditional slideware approaches. We present the Organic Presentation Tool, which supports planar information structures and focus-plus-context visualizations. The tool allows the preparation of a presentation in advance, as well as on-the-fly adaptations during the presentation with quick and easy multi-touch techniques.
In the next section, we will discuss the related work that served as an inspiration in the development of the Organic Presentation Tool. Section 3 will describe our tool in detail, from the basic features and support for non-linear presentations and on-the-fly adaptations, to the multi-touch interface. We end this paper with our major findings and conclusions.
2. RELATED WORK Edward Tufte, a renowned specialist in the field of information design, recently indicated that traditional approaches such as Microsoft PowerPoint can have a harmful impact on the quality of a presentation [19]. He argues slideware weakens verbal and spatial reasoning and has a negative impact on the correct visualization of (statistical) data. In our work, we are interested in finding improvements for the former issue, but we do not cover this particular visualization problem. Lichtschlag et al. [11] categorize three major issues, based on previous assessments of slideware [6][8][15][19]: content cutting, time dominance, and the detail trap.
• Content cutting is the result of having to split up the information in discreet chunks, in order to fit it on slides. All slides have equal dimensions, but the size of coherent chunks of information can vary significantly. This often results in overfull slides, leaving content out, the use of a small font size, etc.
• The sequence of slides essentially forms a ‘timeline’ of the talk. This timeline is constructed at the moment of creation, and is strictly linear, forcing the user to project all non-linear content onto the time dimension, or leave this content out.
• While creating slides, the author is often excessively focused on designing the individual slides, rather than on the

overall story of the presentation. The author can try to clarify the global picture by manually outlining it on supplementary slides.
Regardless of the generally acknowledged criticism, only a few tools explore alternative solutions. Graphs [6][13] and concept-maps with automated layout [7] have been used to overcome the problems of the linear presentation flow of slideware. These approaches allow a more natural way of structuring information and convey context through visible connections. It is also possible to support different paths throughout the information.
Zoomable user interfaces (ZUIs) [2][3] are another option, allowing information to be arranged in a spatial layout, where users can change the scale of the viewed area in order to see more or less detail. ZUIs can employ spatial arrangement, size and depth to convey context. Prezi [16] is an online tool to create presentations with the use of a ZUI. CounterPoint [5] and pptPlex [12] are plugins that provide Microsoft PowerPoint a supplementary virtual canvas with ZUI capabilities. These tools allow you to zoom in and out of slides and present information in a non-linear fashion. Following a presentation path relies heavily on animations, which can help to preserve the context, but can also be disorienting. SLITHY [21] is a script-based system for creating animated presentations, with an emphasis on ‘meaningful’ animations, based on a number of animation principles.
Fly [11] has shown with several user studies that planar information structures inspired by the natural thought processes of data chunking, association, and spatial memory provide better authoring support than the slide metaphor, and can avoid the before mentioned issues of content cutting, time dominance, and the detail trap.
All these tools were an important source of inspiration, and a lot of their features and solutions can be found in our Organic Presentation Tool. However, these tools primarily focus on new ideas of structuring information and mostly rely on customary interaction, such as mouse and keyboard input. Our focus is on new ways of interacting with the information, not only during the authoring process, but also while giving the presentation. To this end, we explore quick and easy multi-touch techniques that try to minimize the overhead of using the tool. Others have already discussed some new methods of interacting with slides. Classroom Presenter [1] and PaperPoint [17] allow annotating slides by using a digital pen. PaperPoint uses paper with a unique Anoto pattern to create ‘interactive’ hand-outs, which allow you to control a PowerPoint presentation. Pens have also been used for sketching informal presentations [10]. Palette [14] prints slide content on physical index cards. The presenter controls the presentation by directly manipulating these cards. pptPlex [12] can be controlled from a distance with simple gestures, using a Wii controller or 3D camera.
Recently, multi-touch interfaces are being explored in this context, because such interfaces are known to be intuitive and easy to use when properly designed. Prezi can, for example, be used on an Apple iPad [16] and pptPlex supports multi-touch interaction on a Microsoft TouchWall, or any multi-touch enabled device running Microsoft Windows 7 [12]. IntuiFace [9] and So touch Presentation [18] are comparable multi-touch presentation software. However, in general, the multi-touch interaction is essentially limited to the habitual swipe and pinch gestures to go forward or backward, and to zoom in and out. We want to explore the opportunities of a richer multi-touch interface, not only for authoring and giving presentations, but also for adapting
presentations on-the-fly. Furthermore, the Organic Presentation Tool is designed from the ground up with multi-touch in mind, while other tools often add multi-touch support afterwards, on top of an already existing interface.
3. ORGANIC PRESENTATION TOOL The Organic Presentation Tool offers presenters a lot more freedom in preparing and giving a presentation. Similar to tools such as Fly [11], the Organic Presentation Tool tries to overcome the typical problems of content cutting, time dominance, and the detail trap by using planar information structures and focus-plus-context visualizations. In this section, we will look at some of the basic features of the Organic Presentation Tool, we will discuss how the tool supports focus-plus-context and non-linear presentations, we will describe the multi-touch interactions that allow the user to create and control the presentation, and we will go into some additional features.
3.1 Basic Features In the Organic Presentation Tool, presentations are no longer considered to be a predefined and strictly linear sequence of slides, but rather a collection of logically structured information that the presenter can access in support of the story being told. The tool provides two interaction modes: the composition mode allows the author to create a presentation, the presentation mode is intended for controlling the flow of the presentation during a talk.
Figure 1. Overview of the Organic Presentation Tool when in
composition mode: (1) connected information clouds, (2) menu to switch mode, open the timeline, etc., (3) elements and
templates that can be added to the presentation. In composition mode, authors start with a blank, infinite canvas, and can add all the usual elements to the presentation: text (typed or handwritten), shapes, pictures, movies, and audio fragments (Figure 1). The customary single-touch and multi-touch gestures are available to pan, zoom and rotate the canvas or move, resize and rotate elements. Elements can be grouped together in what we call ‘clouds’, naturally structuring elements on the canvas as “clouds of information”. A cloud is a collection of closely and logically related information, visualized by a graphical representation that indicates there is a containment relationship (in our first prototype, a cloud is visualized as a circle that contains elements, as seen in Figure 1). The author can add elements either directly to the canvas, or to an existing cloud on the canvas. When an element is directly added to the canvas, the Organic Presentation Tool automatically creates a new cloud that encloses this element. Cloud management such as creating or deleting clouds is done

automatically in order to keep the interaction with the system as unobtrusive as possible.
Clouds can be hierarchically structured (e.g. parent-child relationships, such as clouds containing clouds, etc.). As it is mainly a matter of semantics, the current prototype does not visualize the containment of clouds within clouds (when adding one cloud to another, both clouds are simply merged), but allows the explicit depiction of such relationships through the semantics of the inter-cloud relationships, as described in the next paragraph. This approach can easily be replaced by an actual containment visualization, should the presenter prefer it.
While a single cloud can group closely related information, it can also have correlations (besides the parent-child relationships) with other clouds on the canvas. Authors can visualize these relationships by creating connections between clouds (in our prototype, visualized as a dotted line, as seen in Figure 1). In this way, it is possible to create presentations that are structured as a graph, a tree structure, a radial hierarchy, a linear sequence, etc. This means that the author has the freedom to create topic maps, concept maps, mind maps, and so on, but it is also possible to build more traditional presentations.
In presentation mode, features such as adding content and connections are disabled, and a simple gestural interface allows the presenter to control the presentation. However, the presenter can switch between modes at any time during a presentation, should on-the-fly editing be required. Changing the presentation while presenting it is still very much unexplored and requires specific editing techniques. We imagine these techniques to be similar to the ones used during brainstorms. In our current prototype, we did not yet evaluate this feature to a great extent, but mainly provided the infrastructure to enable on-the-fly editing of the presentation. More details on the presentation mode and the gestural interface will be discussed in Section 3.4.
3.2 Focus-plus-context The virtual canvas of the Organic Presentation Tool is infinite in size and zoomable. The spatial arrangement of the information clouds on the canvas, combined with the possible connections between the clouds, allows authors to clearly visualize the context of an element. The ZUI lets the presenter change the scale of the viewed area in order to see more or less detail, and more or less of the context.
Figure 2. Thumbnails at the edge of the central cloud visualize
the connected clouds that are largely off-screen. Zooming in provides the audience more detailed information on a cloud, or an element inside the cloud. As the presenter zooms in, less and less of the context is visible on the screen. To preserve
the most important context when zoomed in to a cloud, the Organic Presentation Tool visualizes small thumbnails of the connected clouds that are largely off-screen at the edge of the cloud (Figure 2). It would be possible to visualize all the surrounding clouds and not only those connected to the cloud of interest, but care has to be taken to avoid a cluttered screen. Zooming out provides the audience with an overview of the presentation, which is a distinctive advantage over the current slideware, where the author is responsible for creating additional slides to provide a clear overview. As mentioned before, traditional tools often lead to authors concentrating on the design of the individual slides rather than the presentation as a whole, which can lead to a disoriented and confused audience.
When moving or resizing a cloud, it often overlaps other clouds in the surrounding area. These other clouds, however, can be useful in offering the appropriate context. The Organic Presentation Tool implements a spring-mass system as one of the layout management techniques for dynamically focusing on subparts of the presentation. For the spring-mass system to function, the connections between the clouds act as rigid springs. When a cloud is being moved or resized, the springs either pull associated clouds closer, or they prevent the current cloud from overlapping directly associated clouds by pushing them out of the away, without allowing them to completely disappear when feasible (Figure 3). Although clouds can overlap other clouds, as much context as possible stays present on the screen, while the current focus is emphasized.
Figure 3. Spring-mass system. Connections between clouds act
as springs, avoiding related clouds from overlapping when moving or resizing, to preserve the context. The big arrows
indicate the spring forces when expanding the central cloud. The Organic Presentation Tool also supports semantic zooming [2][3] on text elements. The author can create a hierarchy of headings inside a text element, or use predefined ‘slide’ templates to do so. When zoomed out passed a certain threshold, only the highest level in the hierarchy (e.g. the main title) is visible. When zooming in, the subsequent levels of text gradually appear on the screen, providing more and more detail. This technique prevents text that becomes too small to read when zooming out from cluttering the screen.
3.3 Divert and Return In practice, the speaker occasionally has to adapt during a presentation. The Organic Presentation Tool provides much more flexibility than traditional slideware by supporting deviations from a predefined presentation path.

The author can prepare the flow of a presentation beforehand by defining a path (but it is not mandatory to do so). In contrast with the traditional slideware, rather than projecting the content onto a timeline immediately, the author can construct a path throughout the content after it has been structured on the canvas. The path is in fact the major storyline of the talk, and can be constructed by adding ‘snapshots’ to a list (Figure 4). A snapshot is simply defined as the current viewpoint (its position, rotation, and zoom factor) on the canvas. The current prototype only allows one path to be defined within the tool. However, a list of snapshots can be saved to file, so it is possible to create multiple paths throughout the available information on the canvas.
During the talk, the presenter can easily follow the predefined path by using simple gestures to go back and forward, very much like in the traditional slideware tools. When moving from one snapshot to the next, the Organic Presentation Tool automatically animates from the current viewpoint to the next. Because of the spatial layout of the information on the canvas, these transitions are much more meaningful than ‘jumping’ from one slide to another. In addition to following the predefined path, the presenter can divert from the major storyline whenever necessary, navigating freeform through the information. At any time, a simple gesture returns the presenter to the current position on the path.
Figure 4. Overview of the Organic Presentation Tool when in
presentation mode: (4) snapshots determine a predefined path, (5) pie menu to save the presentation, configure the pen style, etc., (6) timeline of the actual path that was followed, (7)
brief feedback on the user’s actions. By recording and visualizing all the presenter’s actions on a timeline (Figure 4), the tool keeps track of the actual path that is being followed. The timeline contains small thumbnails of earlier states of the canvas and allows a quick return to a previous state in the presentation. This timeline is essentially an undo that not only takes into account changes in the content, but also changes in the viewpoint. We do not provide a redo function, but we simply add an undo action to the back of our timeline, so all actions that happened between the state being restored and the current state are still available.
If the system would record each and every action, the timeline would quickly become too cumbersome to handle. Therefore, only significant changes are recorded, and only when that change is completed (e.g. when zooming in on an item several times in a row, we consider these separate manipulations as one zoom action). In addition, the number of actions visualized on the timeline is limited. Instead of always removing the oldest action
when the maximum is reached, the oldest actions are thinned, so the presentation path that was followed stays intact, but merely becomes less detailed.
3.4 Multi-touch Interface One of the major concerns is the additional mental load that the use of a more flexible tool such as the Organic Presentation Tool imposes on the speaker during a presentation. Traditional slideware is generally restricted to going to the next or the previous slide. A tool that offers more freedom also needs more interaction capabilities. We therefore opted for an intuitive and very simple gestural interface, making the system very light-weight to use. As mentioned before, the Organic Presentation Tool provides two interaction modes: one mode allows the author to create a presentation, the other mode is intended for controlling the flow of the presentation during a talk. We separated these two modes, because creating the presentation typically requires slightly more advanced interaction than controlling the basic flow of the presentation. In presentation mode, we try to minimize the additional mental load the system imposes, so the presenter can fully concentrate on the presentation, rather than on the application. In composition mode, the traditional gestures are available to pan, zoom and rotate the canvas or move, resize and rotate elements on the canvas. Whenever possible, we use well-known and straightforward techniques, such as a drag-and-drop to add a new element to the canvas or dragging from the edge of one cloud to another to add a connection. Only when we consider it an enhancement compared to the alternatives, we employ slightly more complex gestures. To add an element to a cloud or to remove it from the cloud, for example, we need to differentiate between manipulating the element itself, and the element’s relationship to the cloud. In this case, we found pinning down the cloud with one hand and dragging the element in or out of the cloud with the other hand to be an intuitive and very easy to use, more so than solutions such as adding a button or using a pie menu.
In presentation mode, we keep the gestures as simple as possible. Flicking to the right or left means go to next or previous snapshot, thereby allowing the presenter to follow the predefined path. Other gestures allow the presenter to divert from the path in a targeted manner. Flicking upwards means go up one level in the hierarchy by zooming out, while a double tap goes down one level in the hierarchy, zooming in on an item. Pressing the thumbnail that visualizes an off-screen cloud that is connected to the current cloud (described in Section 3.2), causes the viewpoint to center on that associated cloud. Finally, flicking downwards returns the viewpoint to the last visited snapshot on the predefined path, after having diverted from it. This way, the presenter can easily control the flow of the presentation in a very flexible manner, without having to pay too much attention to the interaction with the Organic Presentation Tool.
3.5 Additional Features In this section, we briefly discuss two additional features of the Organic Presentation Tool, namely annotations and help, because they prove to be valuable in creating a usable and practical tool.
Much like the Classroom Presenter [1] and PaperPoint [17], which allow annotating slides by means of a digital pen, the Organic Presentation Tool supports annotations by using a finger (or even multiple fingers) to write on the canvas or on a virtual piece of
paper that can be attached to a cloud (Figure 5). Annotations can be useful when preparing the presentation (e.g. quickly write down some notes, create a rough sketch, etc.), but also during the presentation (e.g. draw the attention of the audience to a particular part of a picture, make a sketch in response to a question, etc.). The presenter can access the pie menu to configure the “pen style”, or to erase an annotation (Figure 4).
Figure 5. Annotations directly on the canvas and on a virtual
piece of paper. Most users are familiar with traditional slideware, and when first confronted with an alternative tool, they need to learn how to handle the new aspects: the somewhat unfamiliar user interface, the planar canvas and information structures, the possibility to divert from the predefined path, the multi-touch interaction, etc. Previous work shows, for example, that users often experience difficulties with multi-touch interaction, because of the novel concept of multiple input points, and the lack of visibility and affordances of a gestural interface [20].
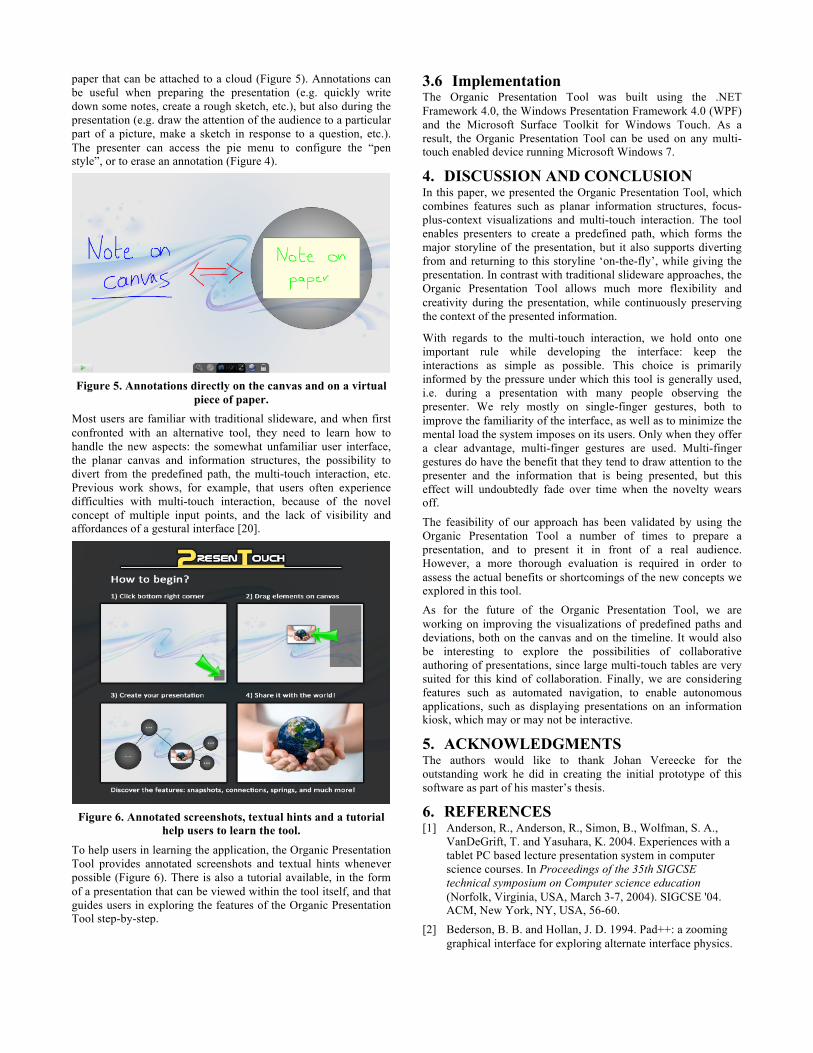
Figure 6. Annotated screenshots, textual hints and a tutorial
help users to learn the tool. To help users in learning the application, the Organic Presentation Tool provides annotated screenshots and textual hints whenever possible (Figure 6). There is also a tutorial available, in the form of a presentation that can be viewed within the tool itself, and that guides users in exploring the features of the Organic Presentation Tool step-by-step.
3.6 Implementation The Organic Presentation Tool was built using the .NET Framework 4.0, the Windows Presentation Framework 4.0 (WPF) and the Microsoft Surface Toolkit for Windows Touch. As a result, the Organic Presentation Tool can be used on any multi-touch enabled device running Microsoft Windows 7.
4. DISCUSSION AND CONCLUSION In this paper, we presented the Organic Presentation Tool, which combines features such as planar information structures, focus-plus-context visualizations and multi-touch interaction. The tool enables presenters to create a predefined path, which forms the major storyline of the presentation, but it also supports diverting from and returning to this storyline ‘on-the-fly’, while giving the presentation. In contrast with traditional slideware approaches, the Organic Presentation Tool allows much more flexibility and creativity during the presentation, while continuously preserving the context of the presented information.
With regards to the multi-touch interaction, we hold onto one important rule while developing the interface: keep the interactions as simple as possible. This choice is primarily informed by the pressure under which this tool is generally used, i.e. during a presentation with many people observing the presenter. We rely mostly on single-finger gestures, both to improve the familiarity of the interface, as well as to minimize the mental load the system imposes on its users. Only when they offer a clear advantage, multi-finger gestures are used. Multi-finger gestures do have the benefit that they tend to draw attention to the presenter and the information that is being presented, but this effect will undoubtedly fade over time when the novelty wears off.
The feasibility of our approach has been validated by using the Organic Presentation Tool a number of times to prepare a presentation, and to present it in front of a real audience. However, a more thorough evaluation is required in order to assess the actual benefits or shortcomings of the new concepts we explored in this tool. As for the future of the Organic Presentation Tool, we are working on improving the visualizations of predefined paths and deviations, both on the canvas and on the timeline. It would also be interesting to explore the possibilities of collaborative authoring of presentations, since large multi-touch tables are very suited for this kind of collaboration. Finally, we are considering features such as automated navigation, to enable autonomous applications, such as displaying presentations on an information kiosk, which may or may not be interactive.
5. ACKNOWLEDGMENTS The authors would like to thank Johan Vereecke for the outstanding work he did in creating the initial prototype of this software as part of his master’s thesis.
6. REFERENCES [1] Anderson, R., Anderson, R., Simon, B., Wolfman, S. A.,
VanDeGrift, T. and Yasuhara, K. 2004. Experiences with a tablet PC based lecture presentation system in computer science courses. In Proceedings of the 35th SIGCSE technical symposium on Computer science education (Norfolk, Virginia, USA, March 3-7, 2004). SIGCSE '04. ACM, New York, NY, USA, 56-60.
[2] Bederson, B. B. and Hollan, J. D. 1994. Pad++: a zooming graphical interface for exploring alternate interface physics.

In Proceedings of the 7th annual ACM symposium on User interface software and technology (Marina del Rey, California, USA, November 2-4, 1994). UIST '94. ACM, New York, NY, USA, 17-26.
[3] Bederson, B. B., Meyer, J. and Good, L. 2000. Jazz: an extensible zoomable user interface graphics toolkit in Java. In Proceedings of the 13th annual ACM symposium on User interface software and technology (San Diego, California, USA, November 06-08, 2000). UIST '00. ACM, New York, NY, USA, 171-180.
[4] Berkun, S. 2009. Confessions of a Public Speaker. O'Reilly Media, Inc., USA.
[5] Good, L. and Bederson, B. 2002. Zoomable user interfaces as a medium for slide show presentations. Information Visualization, 1, 1 (March 2002), 35-49.
[6] Gopal, K. and Morapakkam, K. 2002. Incorporating Concept Maps in a Slide Presentation Tool for the Classroom Environment. In Proceedings of the 2002 World Conference on Educational Multimedia, Hypermedia & Telecommunications (Denver, Colorado, USA, June 24-29, 2002). ED-MEDIA '02. AACE, Norfolk, VA, USA, 634-640.
[7] Holman, D., Stojadinović, P., Karrer, T. and Borchers, J. 2006. Fly: an organic presentation tool. In CHI 2006 extended abstracts on Human factors in computing systems (Montréal, Canada, April 22-27, 2006). CHI '06. ACM, New York, NY, USA, 863-868.
[8] House, R., Watt, A. and Williams, J. 2005. What is PowerPoint? Educating Engineering Students in its Use and Abuse. In Proceedings of the 35th Annual ASEE/IEEE Conference on Frontiers in Education (Indianapolis, Indiana, USA, October 19-22, 2005). FIE '05. IEEE, F3C-15-16.
[9] IntuiLab. IntuiFace Presentation. Accessed February 28, 2011. http://www.intuilab.com/solutions/intuiface-presentation.
[10] Li, Y., Landay, J. A., Guan, Z., Ren, X. and Dai, G. 2003. Sketching informal presentations. In Proceedings of the 5th international conference on Multimodal interfaces (Vancouver, Canada, November 5-7, 2003). ICMI '03. ACM, New York, NY, USA, 234-241.
[11] Lichtschlag, L., Karrer, T. and Borchers, J. 2009. Fly: a tool to author planar presentations. In Proceedings of the 27th
international conference on Human factors in computing systems (Boston, Massachusetts, USA, April 4-9, 2009). CHI '09. ACM, New York, NY, USA, 547-556.
[12] Microsoft Office Labs. pptPlex. Accessed February 28, 2011. http://www.officelabs.com/projects/pptPlex.
[13] Moscovich, T., Scholz, K., Hughes, J. F., and Salesin, D. 2004. Customizable presentations. Technical Report CS-04-16, Computer Science Department, Brown University.
[14] Nelson, L., Ichimura, S., Pedersen, E. R. and Adams, L. 1999. Palette: a paper interface for giving presentations. In Proceedings of the SIGCHI conference on Human factors in computing systems (Pittsburgh, Pennsylvania, USA, May 15-20, 1999). CHI '99. ACM, New York, NY, USA, 354-361.
[15] Parker, I. 2001. Absolute PowerPoint: Can a software package edit our thoughts? The New Yorker (May 28, 2001), The Condé Nast Publications, Inc., USA, 76-87.
[16] Prezi Inc. Prezi. Accessed February 28, 2011. http://prezi.com.
[17] Signer, B. and Norrie, M. C. 2007. PaperPoint: a paper-based presentation and interactive paper prototyping tool. In Proceedings of the 1st international conference on Tangible and embedded interaction (Baton Rouge, Louisiana, USA, February 15-17, 2007). TEI '07. ACM, New York, NY, USA, 57-64.
[18] So touch. So touch Presentation. Accessed February 28, 2011. http://www.so-touch.com/#/software/presentation.
[19] Tufte, E. R. 2006. The Cognitive Style of PowerPoint: Pitching Out Corrupts Within, Second Edition. Graphics Press, Cheshire, CT, USA.
[20] Vanacken, D., Demeure, A., Luyten, K., Coninx, K. 2008. Ghosts in the Interface: Meta-user Interface Visualizations as Guides for Multi-touch Interaction. In Proceedings of IEEE Tabletops and Interactive Surfaces 2008 (Amsterdam, the Netherlands, October 1-3, 2008). TABLETOP '08. IEEE, 87-90.
[21] Zongker, D. E. and Salesin, D. H. 2003. On creating animated presentations. In Proceedings of the 2003 ACM SIGGRAPH/Eurographics symposium on Computer animation (San Diego, California, USA, July 26-27, 2003). SCA '03. Eurographics Association, Aire-la-Ville, Switzerland, 298-308.