the production and fate of fats, oils and grease from
TRANSCRIPT

Project Title: The Production and Fate of Fats, Oils and Grease from
Small Dairy-Based Food Service Establishments.
FINAL REPORT
Submitted to: Washington Suburban Sanitary Commission
14501 Sweitzer Lane
Laurel, MD 20707
www.wsscwater.com
Attn: Wayne Ludwig
FOG Unit Coordinator
301-206-8719
Date: 4/22/2011
Allen P. Davis, Ph.D., P.E.
Professor
301-405-1958
Golnaz Khorsha
Graduate Student
Alba Torrents, Ph.D.
Professor
301-405-1979
Joel DuCoste Ph.D.
Professor
919-515-8150
Department of Civil, Construction, and Environmental Engineering
North Carolina State University
Raleigh, NC 27695
Fax: 919-515-7908
Department of Civil and Environmental Engineering
University of Maryland
College Park, MD 20742
Fax: 301-405-2585

Table of Contents
Executive Summary……....................................................................................................................i
Glossary.......................................................................................................................................1
Introduction .................................................................................................................................2
Chapter 1: Literature Review ........................................................................................................4
WASTEWATER CHARACTERIZATION AND FOG TRAPS ............................................................................................................ 4
FOG CONTROL PROGRAMS .............................................................................................................................................. 5
DAIRY CHEMISTRY AND PHYSICS ...................................................................................................................................... 10
Milk Constituents and Properties ........................................................................................................................ 10
Effect of pH and Temperature on Dairy Wastewater Properties ........................................................................ 12
Dairy Partitioning ................................................................................................................................................ 17
CONCLUSIONS AND PREDICTED BEHAVIOR ......................................................................................................................... 21
Chapter 2: Characterization Studies and Laboratory Analysis ...................................................... 24
INTRODUCTION ............................................................................................................................................................ 24
UNIVERSITY OF MARYLAND DINING SERVICES ..................................................................................................................... 25
Student Stamp Union Coffee Bar ........................................................................................................................ 26
PARTITIONING BEHAVIOR OF DAIRY ................................................................................................................................. 28
Dairy Suspension and pH: .................................................................................................................................... 29
Dairy Suspension and Temperature .................................................................................................................... 33 Methodology .................................................................................................................................................................... 33 Results and Discussion ..................................................................................................................................................... 34
STANDARD METHODS FOR FOG ANALYSIS ........................................................................................................................ 43
Methodology for Fat Determination of Dairy Wastewater ................................................................................. 44
CONCLUSION ............................................................................................................................................................... 46
Chapter 3: Field Studies and Separation Analysis ........................................................................ 47
INTRODUCTION ............................................................................................................................................................ 47
FATE OF FAT ................................................................................................................................................................ 47
Methodology for Quantification of Fractioned Fat ............................................................................................. 47
Partitioning of Dairy Fat ...................................................................................................................................... 49
WASTEWATER ANALYSIS ................................................................................................................................................ 51
Wastewater Collection Procedure....................................................................................................................... 51
Procedure for Testing Wastewater Samples ....................................................................................................... 52
Wastewater Fat Content ..................................................................................................................................... 53
DETERMINATION OF FOG IN WASTEWATER ...................................................................................................................... 53
Methodology for FOG Determination ................................................................................................................. 54
FOG Analysis ....................................................................................................................................................... 54
FIELD STUDIES ............................................................................................................................................................. 58
Predicting Wastewater Behavior ........................................................................................................................ 58
Grease Abatement Devices ................................................................................................................................. 61 Sampling of Grease Interceptors ...................................................................................................................................... 62 Ice Creamery Grease Interceptor ..................................................................................................................................... 63 Specialty Coffee Shop Grease Interceptor ....................................................................................................................... 71

CONCLUSION ............................................................................................................................................................... 78
Chapter 4: Concluding Research and Field Studies: ...................................................................... 80
Chapter 5: Recommendations and Further Research ................................................................... 86
SURVEY CHECKLIST FOR DAIRY PRODUCT REGULATION ........................................................................................................ 86
FUTURE WORK ............................................................................................................................................................ 90
Work Cited ................................................................................................................................. 93
Appendix ................................................................................................................................... 95

i
Executive Summary
In recent years there has been growing concerns for sewer collection system capacity,
management, operation and maintenance (CMOM), and the prevention of sewer system overflows
(SSOs). Grease accumulation in sewers has been cited as the leading cause of sewer blockages
resulting in SSOs. Such blockages can be attributed to fats, oils, and grease (FOG) discharged from
food preparation and manufacturing facilities, concentrated residential areas, and even single
family homes. WSSC has responded to this problem by implementing FOG management programs
directed to food service establishments (FSEs) with obvious FOG production (frying, cooking using
oil, meat processing, etc). While current FOG regulations have successfully reduced FOG blockages
and subsequent SSO events, they have not been eliminated. WSSC is currently under consent
decree to reduce SSOs. At issue here is whether oils and fats from coffee and dairy products
contribute to pipe deposits and thus SSOs. In this study the potential accumulation of FOG
originating from dairy sources, such as ice creams, frozen dairy drinks, and hot dairy-based
beverages, was investigated.
While nationwide FOG control programs are being updated, many state municipalities, such as
Connecticut, do not cite dairy FOG as a contributor to pipeline blockages while others such as
Florida, Town of Louisburg and Salisbury in North Carolina among others regard dairy products as
a source of FOG and enforce installation of GADs in all their FSEs including coffee and ice cream
shops. The number of states and municipalities regulating FOG from coffee and ice cream shops is
limited, and so is the scientific-based knowledge to promote sound regulations. Thus an important
consideration is to evaluate the nature of dairy products served in such FSEs (coffee shops, ice
cream shops).
The fundamentals of dairy physics and chemistry were reviewed in order to understand the
behavior of dairy products under different conditions and assess their potential to form a separate
phase while discharged into sewer collection systems. These findings suggested that a dairy solid
phase, composed of different proteins and fat globules has a high potential to separate. The time
frame required for the separation process to take place and thus whether currently used
interceptors and grease abatement devices could be efficient were of great interest.
Temperature and pH were noted as the most significant environmental factors that are expected to
affect dairy suspension and cause separation of dairy products in wastewater. Research studies
were conducted to examine the effects of temperature and pH on separation employing synthesized

ii
dairy wastewater in batch settings. In the case of warm tap water, the higher kinetic energy of the
system caused more rapid separation while in room temperature systems, the separation occurred
at a slower rate. Nevertheless, in both cases ultimately comparable results were obtained. The
effects of detergents and other surface‐active materials used for cleaning were also studied. The
addition of detergents slightly enhanced the separation of dairy constituents except for vanilla latte,
in which slightly lower separation levels were observed. As a general trend, separation for mixtures
with higher fat content resulted in a complete floating layer, as observed for half and half, or a
mixture of floating and sinking phases (ice cream), signaling the entanglement of fats and proteins
in separated phases. Further separation of the phases was also witnessed in coffee‐based synthetic
wastewater. The separation of samples was found to be relatively fast, with samples found to reach
steady fractionation after 3 hours, which could become more compact via centrifuging.
In an attempt to quantify the partitioning tendencies, Standard Method 5520B was used. However,
this test was determined to be incompatible for dairy fat determination as upon addition of hexane
to the mixture, a viscous gelatin layer formed because of the potential low solubility of dairy fats
and proteins in non‐polar hexane. An industry acceptable standard method for testing dairy
products was employed, and the separated phases (curd layers) were found to hold almost all the
fat residing in the sample, with little fat residing in the solution for samples of higher fat (whole
milk and ice cream:<4.%). Fresh wastewater sample representing practices in a local coffee shop
were collected and found to hold a small mass fraction of fat (average of 0.02 ± 0.004% for first
shift, and 0.03 ± 0.003% for second shift).
Samples were also collected from grease interceptors of a specialty coffee shop as well as an ice
creamery for the duration of 3-4 weeks. Based on analysis of these GADs, with an average
retention time of 2 days obtained for the ice cream grease interceptor, separation of dairy
constituents from wastewater was observed. In the case of the interceptor treating the specialty
coffee shop wastewater, the floating and the settling fractions could be witnessed, with the degree
of partitioning reducing from the inlet to the outlet chambers. Similar to the dairy dilutions tested,
the solution segment of the samples had a marginal fat content, and fats partitioned in the
separated phases in the sediment phase and were found to be the major constituent of the floating
phase. Accumulation of separated layers, as well as increase in fat content of each phase, was
observed during the 3 weeks of GAD sampling and laboratory study. In the interceptor samples
collected from the ice cream facility, on the other hand, separation could be witnessed prior to the
most recent cleaning of the interceptor, and the separated phases were found to be most

iii
commonly floating, slowly sinking only when disturbed in the sampling column. Furthermore,
partitioning in this GAD seemed to be slow, with the greatest fractionation occurring in the outlet
compartment. Further studies of GAD interceptors, as well as emphasis on protein and fat
suspension and emulsion will help better determine the fate of dairy constituents. Sampling for
this study occurred during the colder months of December and January, when the sales of frozen
dairy beverages and desserts are minimal. Continuing this study in the warmer months would be
beneficial to account for variations in sales, potentially leading to different retention times.
Seasonal studies should also investigate the effects of temperature on GAD separations, and the
affinity of dairy constituents with one another. Characterization of fresh wastewater and sewer
samples would be beneficial in mapping the fate of dairy products in wastewater.
Based on laboratory and field observations, it is expected that partitioning tendencies of
wastewaters rich in milks and ice cream-like products is substantial enough to justify installation of
grease traps. To assist in future characterization, a checklist was prepared to assess the feasibility
of GAD treatment on different dairy FSEs

1
Glossary
Terminology for Food Service Establishments:
1. Ice Creamery: Retail store supplying soft or frozen ice cream, custard, shakes, sundaes,
and/or yogurt in one or more serving options (cones, cups, etc.)
2. Regular Coffee Shops: Coffee shops that serve only pre-made coffee drinks, without
serving any specialty drinks prepared by personnel per customer’s request.
3. Specialty Coffee Shops: Coffee shops that in addition to serving only coffee, prepare
coffee drinks that may use dairy product, which are prepared on site per customer’s
request.
Terminology for Dairy Systems:
1. Creaming: deposition of aggregates of dairy fats to the surface in milks and/or other
dairy products.
2. Curd: separated settled or floated phase of dairy products comprised of proteins and
fats, which form as a result of dissolution of calcium phosphate at ZPC pH (see definition
4).
3. Serum: the suspended or clear solution of dairy products, which contains aqueous dairy
constituents. At ZPC pH of caseins, curdling of milk occurs, which results in separation
of the casein proteins and fats from the serum. At this pH, the serum appears as a
transparent solution distinguishable from the separated curd layer. Serum and
suspended phase are interchangeably used throughout this report paper.
4. Zero Point of Charge pH (ZPC pH): also known as isoelectric point, describes the
acidity level at which the electric charge density of the surface is zero, which should
promote agglomeration and separation of materials from a bulk fluid phase.

2
Introduction
The U.S. EPA has found that Sanitary Sewer Overflows (SSOs) caused by poor sewer
collection system management pose a substantial health and environmental challenge as they
spill raw sewage into basements or out of manholes and onto city streets, playgrounds and into
streams, before it can reach a treatment facility. Such overflows represent health risks to
communities (as they carry bacteria, viruses, and parasites) as well as damaging or having the
potential to damage properties, our water resources budget and recreational water supplies.
While there are different causes that contribute to SSOs, such as pipe breaks, increased inflow
due to infiltration, power failures and an insufficient system capacity, most studies attribute
over 40% of the SSOs to pipe blockages (FOGSCIENCE). Many of these blockages are a result of
retention of fats, oils and grease (FOG) in the sewer lines. Food service establishments (FSE)
serving food directly to people have the potential to contribute heavily to sewer outflows. If
discharged without installation of a grease abatement device (GAD), their wastewater can
contain large quantities of fats, vegetable oils, lards, shortenings, margarine, butter, grease, and
other FOG-based products.. Once FOG makes its way through the drain, it is only a matter of
time before it may block the arteries of sewers and result in overflows.
Although an average of 40% of the nationwide SSOs are attributed to FOG clogs, FOG’s
impact can exceed this percentage on a state by state basis. For example, the U.S. EPA states that
85% of the SSOs in the state of California were connected to FOG clogs. Moreover, the Wall
Street Journal reported that 75% of the sewer systems in the U.S. worked only to half capacity
because of FOG clogs (FOGSCIENCE.COM). The problem becomes more severe as rainfall adds
to the sewer load and water levels exceed the already reduced capacity of the pipelines.
EPA and other Environmental state agencies are seeking solutions and have
implemented the practice of regulating FOG discharges. FSEs, serving and preparing hot food
have been identified as the major contributors to FOG buildups. This problem has become

3
excessively severe due to the increase in the number of FSEs in the U.S. As more and more
people choose to dine out, more FOG has the potential to be discharged to our sewers from
FSEs. Many Food Service Establishments preparing food on site produce brown grease, a very
sticky and “difficult-to-manage” waste (Scherffius, 2007). EPA has developed a statewide Fats,
Oils, and Grease Model program for discharges to sanitary sewage systems to assist
municipalities with the collection and disposal of FOG. Most of these regulations address FSEs
preparing and serving food to public with obvious FOG production (frying, cooking using oil,
meat processing, etc). However, other situations and facilities, such as coffee and dairy shops
are less obvious. Food establishments that use only dairy and/or coffee products have
suggested that physical treatment will be ineffective with their wastewater, yet some evidence
exists to the contrary. There is a need to investigate whether further regulations to control
FOG discharges from coffee and dairy shops could limit the amount of dairy fat or other
suspended solids entering sanitary sewage systems and thus preventing FOG deposits.
To date, there is no research available to assess whether current FOG removal devices
(GRDs) can remove dairy fats and residues, and whether such devices are effective only under
certain conditions.
This paper will first, in Chapter 1, present a literature review of several key FOG
programs nationwide, dairy FOG characterization, and dairy constituents’ physical and chemical
behavior. Chapter 2 will present characterization studies and laboratory analyses of actual
dairy FOG samples, while Chapter 3 will provide a description of field studies and separation
analysis of dairy FOG. Conclusions and recommendations, based on this research, follow.

4
Chapter 1: Literature Review
Wastewater Characterization and FOG Traps
The most important parameters that would control the fate of FOG in sewer systems are
wastewater composition, temperature and pH. Chemical properties of FOG components and
many dairy and wastewater bacterial microorganisms’ livelihood are both strongly influenced
by pH. The pH of typical wastewater tends to fall around 6.5 (Gross, 2004). Temperature is
another important variable that influences biochemical reactions and also the physical
treatment processes. This becomes important in wastewater originating from several FSEs,
which prepare and serve hot food to their cliental (FOGSCIENCE). Wastewater discharged from
these sites typically contains high concentrations of FOG. FOG is removed from these drains via
plumbing the kitchen drains through GADs. These devices hold the wastewater long enough to
allow the fats to float. Congealed FOG tends to be lighter than water, and the grease needs to
cool enough to congeal and separate from the water carrying the grease away from the kitchen.
Therefore, the temperature of water entering the grease trap as well as the temperature of the
actual device is of importance. A long retention time may be required to allow for sufficient
separation of grease. Since most FSEs tend to use very hot temperatures to clean their dishes,
the wastewater entering the GAD tends to be too hot, resulting in a longer retention time for
partitioning to occur (Scherfius, 2010). Updating the grease abatement devices and regulations
is essential as many of them apply to animal fat, which used to be more popular than vegetable
oil. Overall, the temperature, time and emulsion properties of the FOG in the wastewater affect
the efficiency of the interceptor.
Dish detergents are also important variables that need to be considered as they have
surfactive properties and can keep the FOG suspended or emulsified in the waste stream, and
ultimately allowing the grease to escape and cause further problems. Typical outflow of a
restaurant ranges between 2-4 gallons/unit area/day, thus it is essential to understand the

5
characteristics and load of wastewater prior to beginning of study (Gross, 2004). This brief
description only touches on the complexity of the design and ordinance required to efficiently
diminish FOG clogs. A nationwide review of FOG Control Programs is presented in the next
section.
FOG Control Programs
As generation of FOG imposes a threat to our water supplies, almost all states have
come up with FOG control programs. This part can be referred to as a guideline for steps taken
by different cities and states to reduce FOG discharge into sewers.
First to be considered is that FSEs cover a wide range of facilities, from restaurants to
some convenience stores and can be classified for clarity. This paper refers to classification of
FSEs according to states, such as Connecticut, which group FSEs into four types. First is Class I,
which refers to establishments serving only prepackaged foods and/or beverages. Class II
includes establishments using cold or ready-to-eat processed foods. Establishments exposing
foods prepared by hot processes and consumed within 4 hours of preparations fall in Class III.
Finally Class IV is defined as establishments exposing foods prepared by hot processes held for
4 hours or more prior to consumption (FOG Guidance, CT). The Department of Environmental
Protection (DEP) in Connecticut has developed a statewide FOG model for discharge to sanitary
sewerage systems to diminish SSOs. Similar to other states, active and passive FOG
pretreatment equipment in forms of automatic and passive grease interceptors are used.
Pretreatment regulations on discharge of grease are intended for FSEs. GADs are required in
FSE classes that introduce FOG to the drains (i.e., III and IV). Connecticut has determined that
Class I and Class II establishments are not typically significant FOG generators. Therefore, they
have concluded that establishments producing hot/cold dairy products have negligible
influence on the sewerage intake of FOGs and they do not have regulations for FOG originating
from dairy sources (FOG guidance, CT).

6
Although this state does mention some of the ice cream shops as Class III food serving
establishments, the reason is not the potential generation of FOG clogs from dairy sources.
These FSEs are controlled because they offer “potentially hazardous” foods, which are not made
on site but are kept hot until sold. An example of this type of establishment would include take-
out services with limited seating. Furthermore, satellite doughnut shops and coffee shops are
also included in Class III. These facilities serve pastries that could have been prepared at a
central kitchen and shipped to the satellite shops. Some Dunkin Donut locations are included in
this program (FOG guidance, CT). Thus, it seems that these facilities are regulated not for their
FOG discharge but rather for the health concerns over the food they serve.
Elsewhere on the east coast, it is seen that the New York City DEP requires that grease
interceptors be installed in all waste lines receiving grease, including those originating from pot
wash sinks, food scrap sinks, scullery sinks, meat, poultry, and fish preparation sinks, floor
drains, automatic dishwashers, and other plumbing fixtures in all restaurants, cafeterias, clubs,
butcher shops, slaughterhouses, fish markets, supermarket food processing areas,
delicatessens, and other non-residential establishments where grease may be introduced into
the drainage system. The state provides guidelines to FSEs regarding proper installation and
adequate sizing, and maintenance of interceptors as their best management practices (BMPs).
There is no mention of coffee shops, ice cream shops, or other institutes introducing FOGs to the
pipelines via dairy fats, but as stated above, the FSEs include all non-residential facilities that
introduce grease into the drains. Therefore, this code may include dairy shops as part of FSE,
yet no records, or documents directly citing coffee or dairy shops were found (Preventing
Grease Discharge).
The Florida DEP is also promoting policies to drastically reduce FOG discharge to the
sewers. For example, in the city of Atlantic Beach, BMPs, including guidelines to reduce FOG
discharge, are imposed, which help facilities meet environmental regulations and prevent

7
polluting the environment. Florida is more specific in identifying FOG sources and lists them as
cooking meats, mayonnaise and salad dressings, butter, ice cream and other dairy products,
creams and sauces. All FSEs, including ice cream shops, and coffee shops, discharging FOG from
the listed sources are required to abide with applicable state, local or federal rules and
regulations, which includes installation of properly sized and operational GADs (FOG BMP, FL).
The city of Salisbury in North Carolina enforces the ordinance and installation of interceptors in
all FSEs as well, so any facility preparing food or serving prepared food, including Class I and II
in which ice cream shops and other dairy shops tend to fall, are obligated to use GADs. Similarly,
the town of Louisburg, NC lists dairy products as a contributor to FOG, and requires all
commercial kitchens to install grease traps. This city also prescribes residential practices to
diminish the discharge of FOG in the sewer (FOG Regulations, Louisburg, NC). The Hampton
Roads Planning District Commission also implements a “fat free drain program” in which dairy
products are listed as FOG contributors, and requires all restaurants and other FSEs to install
grease traps (FatFreeDrains.com). Another city, where dairy products are recognized as a FOG
source is Indianapolis where installation of grease interceptors by all restaurants and other
FSEs are called for. In Columbus, Ohio all new or remodeled FSEs seeking a plumbing permit
have been required to install outside interceptors since 2005.
The state of Texas Commission on Environmental Quality states that fats, oils, and
grease come from meat fats in food scraps, cooking oil, shortening, lard, butter and margarine,
gravy, and food products such as mayonnaise, salad dressings, and sour cream” (keeping Fats,
Oils, and Grease out of Our Sewers, State of Texas). Since the state mentions sour cream as a
source for FOG generation, other dairy products such as creams and ice creams with a typical
fat content of approximately 10%1 may be considered as a source for them. This state does not
impose ordinance on FSEs but prescribes best management practices for both commercial and
1 Average fat content of cream products such as ice creams or whipped cream is 10%. This number is
determined from analyzing the cream sediment composition in creaming processes (Walstra, 1984).

8
household kitchens. In Milwaukee, OR, FOG discharge from all sources is controlled, and the
program regulates a wide range of FOGs. This city lists dairy products as a source of fat
(Milwaukie FOG Program). Similarly, Town of Louisiana, NC currently lists dairy products as a
source for FOG, and requires all commercial kitchens to install grease traps.
Similar to Ohio, California also requires all remodeled FSEs to install outside
interceptors but does not include coffee shops and ice cream shops explicitly. In Orange County,
Classes III and IV FSEs are required to use interceptors while the City of Los Angeles followed
somewhat confusing guidelines as it does not define a specific definition for FOG discharge.
They have successfully minimized their SSOs and require the ordinance to be enforced in all
FSEs that have the potential to generate waste FOG unless a conditional waiver is granted.
While there was no mention of coffee shops or other dairy shops as being included in their FOG
regulations in June 2010, in their most recent document, dairy products are included as a
source for FOG, and all FSEs as well as big apartment buildings to install grease traps
(Protecting your sewer systems from FOG, lacounty.gov).
The city of San Francisco is another site in the state of California which does not identify
coffee shops or any other Class I and II facilities as a threat to sewerage and imposes no
regulations on them for grease abatement actions (sustainablog). Their FOG Control Ordinance
includes limiting total oil and grease discharge and has specific grease capacity equipment. FSEs
are defined as facilities engaged in preparation of food for consumption by public such as
restaurants, commercial kitchens, caterers, schools, hotels and etc. Although this city does not
list coffee shops and ice cream shops as contributors to FOG discharge, they define FOG as
organic polar compounds derived from vegetable, plant, or animal sources composed of long
chain triglycerides, which is the major form of dairy fat and perhaps leaving dairy shop FOG
discharge open to negotiation. It seems surprising that with their FOG definition, they should
leave dairy shops out of FOG pretreatment program (San Francisco FOG Ordinance).

9
In summary, it is seen that while a number of states do regulate FSEs, their definition of
FOG may be inconsistent with one another, and coffee and ice cream shops are not always
included in their FOG control programs. For example, the states of New York and Connecticut,
the city of San Francisco, and Orange County do not categorize coffee shops and ice cream shops
as obligated facilities in their FOG control program. On the other hand, Florida is very rigid and
counts such establishments as sources of FOG and enforces regulations, and L.A. County, a few
cities in North Carolina, and Colorado include dairy products as a source of FOG.
Nationwide, regulations on the FOG control program are setting a reference on ways to
diminish discharge of FOG into the sewer system. This step reduces discharge of FOG from as
many restaurants and other food establishments preparing and serving food as possible, within
certain limitations. Some establishments, however, including dairy shops operate under
relatively loose conditions. These facilities tend to serve prepared foods and hot/cold
beverages, and do not involve preparing/making food. Most states tend not to require these
places to install grease traps and consider their FOG input negligible, if at all.
Dairy product can contain high concentrations of fats and proteins, which may separate
in the sewerage. Therefore, a study of composition, structure, and properties of milk and other
dairy products and their possible contribution to FOG input seems essential.
While the regulation framework is not completely settled with respect to FOG
discharges from coffee and ice cream shops, at issue is whether the currently used interceptors
or traps would be efficient in removing FOG from such wastewaters; no information currently
exists on this respect. In order to assess whether partitioning occurs in dairy wastewater, it is
necessary to study the building blocks of dairy products as well as their densities and
tendencies to form separate phases that would either float or precipitate.

10
Dairy Chemistry and Physics
While it is argued that restaurants and other FSEs that use animal fats are heavily
responsible for generation of FOGs in the pipelines, there has been little research on the
potential FOG from other FSEs serving dairy products, such as ice cream shops or coffee shops
serving hot and cold beverages impose on our sewer systems. In the following section, different
milk constituents prone to separation, their chemistry, and the processes of partitioning are
discussed.
Milk Constituents and Properties
Milk is a complex fluid containing as many as 100, 000 different molecular species in
different dispersed states (Webb, 1975). Milk composition depends on many environmental,
physiological (age and stage of lactation), and genetic factors. Nevertheless, regardless of its
origins, water clearly predominates, giving an average of 89.3% of its composition. Table 1.1
gives the average composition of milk in lowland breeds. Besides water, milk structure includes
lactose, fats, proteins, minerals, organic acids, and other miscellaneous compounds (Webb et al.,
1975). Table 1.1 shows that the nonfat solid portion of milk is averaged to be 8.8%, and the
weight percentage of fat in dry matter has a mean value of 31%. It can thus be clearly seen that
fat is one of the principle compounds found in dairy products, averaging 3.9 weight percentage.
Fats also have nutritional value and provide consumers with energy. They include fatty
acids and vitamins and consist of numerous different lipids. The two most abundant lipid
classes of milk include neutral (bearing an overall net charge of zero) glycerides (tri-, di-, and
monoglycerides), and saturated and unsaturated forms of free fatty acids (C4-C10), each with a
distinct water solubility. Although composed of many different lipids, nearly all fat exist in
separate small globules, with a size distribution of 0.1 - 15.0 μm. Each globule is surrounded by
a thin protective membrane, giving a total area of ~ 80 m2/L and preventing the globules from
coalescence and flocculation (Walstra et al., 1984).

11
Table 1.1. Data for Netherlands milk, but typical of lowland breeds. Table reproduced from Dairy Chemistry and Physics, 1975.
Component Average Content % 2(w/w)
Range % (w/w)
Average % of Dry Matter
Water 87.3 85.5-88.7
Solids-non-fat 8.8 7.9-10.0 69
Fat in dry matter 31 21-38
Lactose 4.6 3.8-5.3 36
Fat 3.9 2.4-5.5 31
Protein 3.25 2.3-4.4 26
Casein 2.6 1.7-3.5 20
Mineral substances 0.65 0.53-0.8 5.1
Organic acids 0.18 0.13-0.22 1.4
Miscellaneous 0.14 1.1
Another important class of milk compounds is protein. Milk proteins consist of amino
acid residues joined “head to tail” by peptide linkages and can be further grouped into two
subdivisions. The protein content of milk averages to 32 g/kg, out of which 80% is categorized
as caseins. Caseins are a group of phosphate-containing milk-specific proteins that precipitate
upon acidification. They tend to self-associate and form micelles of different sizes. Their
stability is dependent on the system’s pH and temperature. An interesting characteristic of
caseins is their different Ca2+ bonding capacities, with a sedimentation constant of 7.5 Svedberg
units (7.5S)3. The remaining proteins that are soluble under acidic conditions are known as
whey or milk serum proteins. Thus, it is expected that proteins, and specifically casein micelles,
can separate to some extent when heated and under acidic conditions which can pose a risk for
clog formation in the sewage system. One should expect that as milk is heated to introduce
acidic compounds such as coffee, caseinate might eventually precipitate out. In addition, as
proteins are surfactive molecules, they tend to form a layer at the air-water (AW) interface to
reduce surface tension, leading to separation of protein species in the system (Walstra, 1984).
2 Sum of the principle constituents (i.e., water, lactose, fat, protein, minerals, organic acids, and other miscellaneous
compounds) gives a value of 100%. 3 Svedberg unit is a measure of time and is defined as 10
-13 sec. It is a non SI unit used in determining the rate of sedimentation
of a macromolecule, notably in centrifugation.
12
Other compounds mixed with beverages, such as chocolate and vanilla may also alter the
situation. Therefore, their effects must also be considered. Another important aspect is the
interaction of phosphate and Ca2+, which tends to be favored at lower pH values (Walstra,
1984).
Considering its high fat content, milk can more or less be described as an oil-in-water
emulsion. Like any other emulsion, milk is not entirely stable, and any fat and plasma
interactions occur separately in each globule. The molar mass of milk is found to be twice that
of water, and thus milk mixes quite easily with water. The structural components of milk are
small, so diffusion into and out of milk occurs within a few seconds, resulting in a very rapid
partition equilibrium between fat globules and plasma or between casein micelles and serum.
Other substances include nonfat solids, fat in dry matter, lactose, and proteins. Another
characteristic of milk is its tendency to uptake apolar substances quite easily because of their
relatively high solubility in the fat globules. This can prove to be an important characteristic as
it signals potential ad/absorption of organic pollutants in wastewater by dairy products,
resulting in a separate phase (Walstra, 1984).
In short, milk is a very complex system consisting of diverse components, which behave
differently under different conditions. When mixed with other surfactive material, such as
detergents, grains such as coffee, or chocolate, and other flavors used in ice creams, their
chemistry and physical properties change. An analysis of the surface tension corresponding to
different components of wastewater may help determine whether separation of different
species occurs. Of concern is mixing with detergents, which may keep the solid particles such as
proteins and fats suspended in the fluid and prevent them from floating.
Effect of pH and Temperature on Dairy Wastewater Properties
When it comes to analyzing the tendency of a dairy wastewater to separate into
different phases, pH is an important factor. A typical wastewater from a coffee shop may

13
contain milk products, as well as coffee and detergents. While at typical milk pH of 6.6-6.8, most
proteins are fully homogenized with the water, most caseins are insoluble at pH of 4.6 (Walstra,
1984). This pH might be approached since coffee is acidic. As pH decreases, calcium phosphate
present in the casein micelles dissolves, and enlargement of these micelles occurs due to a loss
in their surface potential. Such enlargement results in precipitation of the micelles. The zero
point of charge of the caseins occurs at pH = 4.6; at this pH it loses its net charge and forms
internal salt bridges. The high hydrophobicity of the casein then make it insoluble. Although as
already mentioned, milk pH tends to fall anywhere between 6.6 to 6.8, it is important to
understand the influence of acidic conditions in FOG formation in coffee shop drains since
coffee is relatively acidic and lowers the pH of the system, which may result in formation of long
insoluble protein complexes in the sewage system (Walstra, 1984).
Temperature is another variable that affects milk in many different ways. As already
discussed, milk is a very complex system, and changing the temperature results in a wide range
of both reversible and irreversible changes throughout the system. Heating milk is an important
preparatory step in making hot beverages, and here a description of some of the few changes
accomplished by heating that are relevant to the purpose of this study is presented. Some of the
reversible processes include change in conformation of proteins, cold agglutination of fat
globules, state of crystallization of fat globules and state of association of caseins.
One prominent irreversible reaction is the transfer of calcium and phosphate from
solution to the colloidal state. This process has a very long relaxation time and affects casein
micelles properties. Another change caused by heating is an increase in the titratable acidity of
milk and reduction of pH. As indicated above, reduction of pH causes further entanglement of
casein micelles and reduces their solubility. For temperatures above 60⁰C, the solubility of
whey proteins decreases due to heat denaturation, and they become largely associated with
casein micelles. Moreover, immunoglobulins, a species present in milk which causes gelation

14
and cold agglutination of fat globules becomes denatured and inactive during heating, thus
reducing the possibility of formation of clusters of fat. Therefore, although this process can
cause intensive separation of milk fat from plasma, it is not considered in this study as milk
used in industry is homogenized. Deactivation of immunoglobulins is not the only change
occurring in homogenizing, and denaturation of fat globule membranes takes place as well
(Walstra, 1984).
Variations in temperature also affect density. Density is an important property that
helps determine the separation tendencies of milk constituents. If given enough time,
substances of higher and lower densities separate as sediments or flocs. The density of liquid
milk fat at 20⁰C is about 915 kg/m3. For proteins, this value is 1400 and for lactose it is 1780
kg/m3. Therefore, the density of milk is averaged to be about 1030 kg/m3. The diverse densities
of composing substances in the mixture can cause floatation of fat content and sedimentation of
proteins given sufficient retention time. The density of a suspension of several compounds is a
function of many parameters such as temperature, water, and fat content, and the density of
skim milk, milk, and cream can be obtained using equation 1-1. For density of dairy products
concentrated by removing water, equation 1-2 can be used (Walstra, 1984).
woc
F
RR
m
11
9665.0123.0
100020
In equation 1, mF is the fat content, and subscripts o, c, and w denote initial milk,
concentrated milk, and water respectively. R is the concentration factor relating the ratio of dry
matter content in the concentrated milk to that in the dilute milk (Walstra, 1984). In the
Fundamentals of Dairy Chemistry, Webb et al. define density of milk as a function of
temperature for two temperature ranges of 0 to 10⁰C and 10 to 40⁰C. For the first range:
(1.1)
(1.2)
15
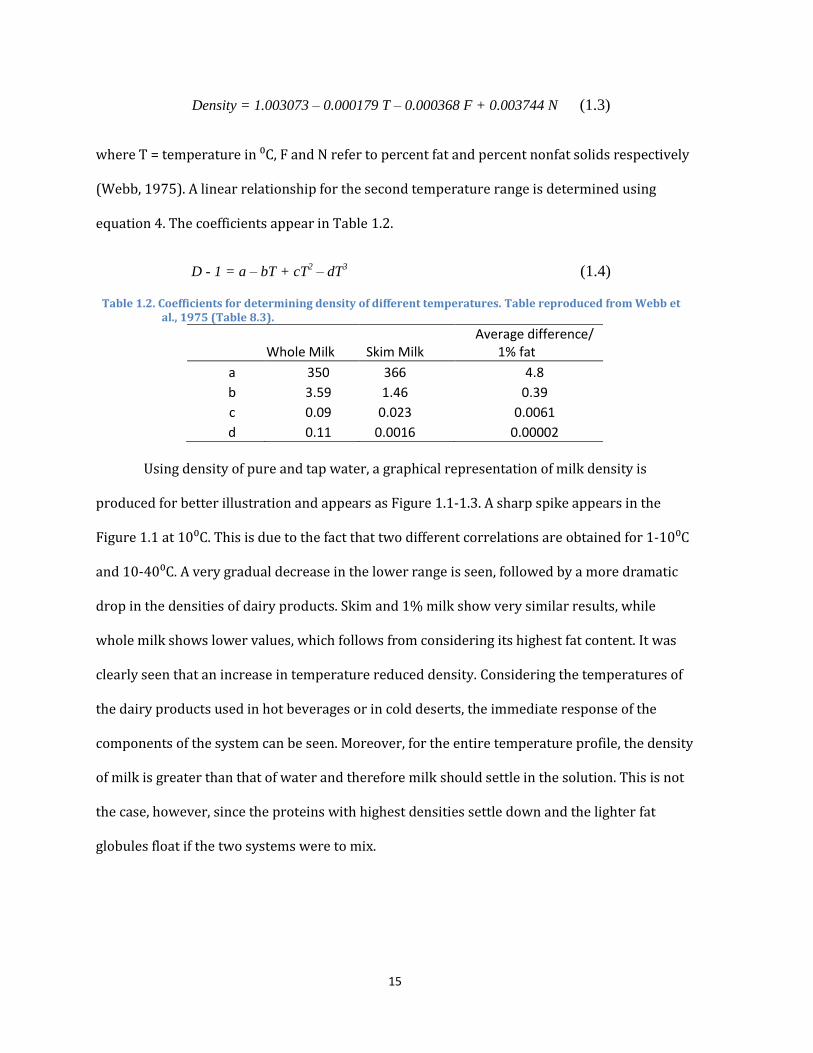
Density = 1.003073 – 0.000179 T – 0.000368 F + 0.003744 N (1.3)
where T = temperature in ⁰C, F and N refer to percent fat and percent nonfat solids respectively
(Webb, 1975). A linear relationship for the second temperature range is determined using
equation 4. The coefficients appear in Table 1.2.
D - 1 = a – bT + cT2 – dT
3 (1.4)
Table 1.2. Coefficients for determining density of different temperatures. Table reproduced from Webb et al., 1975 (Table 8.3).
Whole Milk Skim Milk Average difference/
1% fat
a 350 366 4.8
b 3.59 1.46 0.39
c 0.09 0.023 0.0061
d 0.11 0.0016 0.00002
Using density of pure and tap water, a graphical representation of milk density is
produced for better illustration and appears as Figure 1.1-1.3. A sharp spike appears in the
Figure 1.1 at 10⁰C. This is due to the fact that two different correlations are obtained for 1-10⁰C
and 10-40⁰C. A very gradual decrease in the lower range is seen, followed by a more dramatic
drop in the densities of dairy products. Skim and 1% milk show very similar results, while
whole milk shows lower values, which follows from considering its highest fat content. It was
clearly seen that an increase in temperature reduced density. Considering the temperatures of
the dairy products used in hot beverages or in cold deserts, the immediate response of the
components of the system can be seen. Moreover, for the entire temperature profile, the density
of milk is greater than that of water and therefore milk should settle in the solution. This is not
the case, however, since the proteins with highest densities settle down and the lighter fat
globules float if the two systems were to mix.

16
Figure 1.1. Densities of whole milk, skim milk, 1 and 2% milk compared to water. As can be seen, there is a very small
difference between the densities of 1 and 2% and Skim milk, which tend to intersect at most points.
Figure 1.2. Densities of whole, skim, 1 and 2% milk
compared to water at lower Temperature Range (0-10
0C).
Figure 1.3. Densities of Whole, skim, 1 and 2% milk
compared at higher temperature range (10-40)
0C.
For clarity, a focused graphical representation of each temperature range appears in Figures 1.2
and 1.3. It can be seen that as the fat content of milk increases, its density reduces. Whole milk has the
lowest density, while based on calculations reduced fat milk is the more dense form. As can be seen
from Figure 1.2, density of 2% milk is highest and the same trend continues for most of the higher
temperature range (10-400C). Whole milk seems to have the overall lowest density. Deviations are
higher for lower temperatures and results are counterintuitive as it is expected that skim milk should
have the higher density. Therefore, fat content seems to have a larger effect on the association of
950
1000
1050
1100
1150
1200
1250
1300
1350
1400
0 5 10 15 20 25 30 35 40
De
nsi
ty (
kg/m
3)
Temperature (⁰C)
Profile of Milk and Water Densities
Pure water Tab Water Whole Milk
Skim Milk 1% Milk 2% Milk
995997999
10011003100510071009101110131015
0 2 4 6 8 10
De
nsi
ty (
kg/m
3 )
Temperature (0C)
Deviation in Density of Milk with Varying Fat Content
Pure water Tap Water
Whole Milk Skim Milk
1% Milk 2% Milk

17
different milk constituents. It is also interesting to see that deviations in densities of skim, 1 and 2% milk
are to a lesser extent for higher temperature ranges.
Dairy Partitioning
Because of the diversity found in its building blocks, milk can undergo physical changes
quite frequently. One example is creaming of fat globules and crystallization that occur upon
cooling. Creaming is a rapid phenomenon in which fat globules aggregate to loose, large flocs at low
temperatures and form a new structural element. It occurs as a result of the difference in density
between fat globules (920 kg/m3 at room temperature) and milk plasma (1030 kg/m3). To consider
the creaming of a single globule Stoke’s velocity can be calculated, which appears in equation (5)
where α is the acceleration defining the field (gravity or centrifugation), subscripts p and f denote
density of milk plasma and fat globules, (1030 kg/m3 and 920 kg/m3 respectively), d is the
particle diameter, and finally ηp is the viscosity of milk plasma, which is not necessarily that
of milk (Walstra, 1984).
)5.1(18
)( 2
p
fp
s
da
For equation (5) to hold, several conditions must be fulfilled. For one, the concentration of
fat globules must be very low (<10-3), which is rarely the case in milk, but for a diluted milk solution
as found in sinks, the concentrations can be lowered to these amounts (volume of water and milk in
the sink equals 1 ft3 containing 20% dairy products). Another aspect is the size of the fat globules.
For very small colloidal particles with D <1 μm, Brownian motion disturbs the creaming process.
Finally, the globules must be smooth spheres, which are not the case for most homogenized fat
globules (Walstra, 1984). Having stated these conditions, the Stoke’s equation can be used as a
useful reference, but since the globules exhibit some variability in size, equation (6) can be used to
find the proportion q of the fat reaching the cream layer per unit time where N is the number of

18
particles/ unit area, d is the diameter of fat globules and ν is their individual globule velocity, and D
is the depth of the layer of milk (Walstra, 1984).
)6.1(3
3
ii
iii
dND
vdNq
It is also important to review the colloidal stability of milk in some detail prior to covering
other dairy products. By now, it is clear that milk consists of both hydrophobic and hydrophilic
colloidal particles and the following characteristics apply to them. First, they are subject to Oswald
ripening. To explain this, an example is used. For an air bubble of diameter 0.1 mm in skim milk, the
solubility of air in the bubble is higher than that of the air above the liquid. As a result of the
difference in solubility, large particles tend to grow while smaller particles start to disappear. This
principle is true for other nongaseous components in a particle as well, and overall smaller particles
are more prone to this phenomenon. Dairy colloidal particles tend to settle or cream unless
Brownian motion prevails (i.e., D <1 μm). Moreover, if they are fluid as are fat globules at moderate
temperatures, they coalesce with each other if the thin film of continuous phase between the closely
approaching globules is ruptured somehow. Homogenization of milk enhances this phenomenon as
during the process, the membrane covering fat globules is damaged (Walstra, 1984).
It is also possible for substances dissolved in one or both phases to accumulate or adsorb
onto the interface. If both phases are fluids, the interface has no specific adsorption site and
adsorption to the interface continues until it is packed with a monomolecular layer. In general,
solute is adsorbed if it lowers the interfacial tension. This is expressed in Gibb’s equation, equation
(1.7), where Γ is the surface excess or adsorbed amount and α is the activity of the solute in bulk
fluid, commonly replaced by its concentration. Equation (1.7) states that for a solute that lowers the
surface tension, the surface excess increases, resulting in surface tension going down. If this
principle is applied to milk, milk constituents are likely to absorb at air-water (AW) and oil-water

19
(OW) interfaces in order to reduce surface tension. Therefore, proteins, consisting of hydrophobic
and hydrophilic parts, can readily be adsorbed onto OW and AW interfaces.
(1.7)
Another important parameter is the contact angle, which depends on the adsorption of
surfactants as dictated by interfacial tensions (equation 1.8):
AW
WSAS
cos (1.8)
This principle also determines whether spreading occurs in a sample. For example, triglycerides do
not spread on water, but natural fats spread because small quantities of surfactants in milk
(proteins) lower γOW . Milk fat does not spread on plasma (skim milk) surface because the adsorbing
proteins lower γAW to such a value that (γAO+ γOW)> γAW. Milk fat globules or larger amounts of liquid
fat, on the other hand, form lenses on a milk surface. For dairy fats to form a film, they first need to
reach the surface. Nevertheless, proteins lower the surface tension to a greater extent and take
precedence over fats as a general rule. The protein layer on top would then repel the fat globules,
keeping them suspended in the liquid phase.
Another important process which changes milk chemical structure and physical
characteristics is the introduction of air bubbles to a dairy system. This process takes place
frequently in many specialty coffee and dairy FSEs while preparing hot or frozen drinks, such as
cappuccinos, smoothies, ice creams and whipped cream. If air is beat into a liquid containing
surfactant, such as milk, a foam layer forms. Despite their difference in interfacial tension, this foam
has much in common with an oil-in-water emulsion as they are both dispersions of apolar fluid
phases in a polar liquid. To explain foaming of milk products, it is noted again that milk proteins,
such as caseinates, contain both hydrophobic and hydrophilic parts. Therefore, they adsorb
strongly to the air-water interfaces and stabilize the foam. As air start dissolving, bubbles shrink.
During this time, the micellelacious part stays at the interface and other adsorbed substances

20
presumably desorb. Further shrinkage of air bubbles causes the micelles to touch each other and
form a layer. Finally with the full dissolution of air, an empty folded sac consisting of a membrane of
casein micelles remains. This phenomenon is particularly common in skim milk that has been
foaming at temperatures above 20⁰C, which is the case in most hot beverages containing foamed
milk (Walstra, 1984).
Association of fat globules with air bubbles is somewhat different. It is argued that fat
globules only occasionally make contact with the AW interface and only when they are caught in a
foam lamella. The membrane material spreads over the bubble, which ruptures the film. Liquid fat
de-stabilizes the foam to a smaller extent than solid fat globules. This occurs because the globule
and the adsorption layer of the AW interface repel each other. When the lamella becomes thinner
than the globule diameter, deformation of globules takes place, which is much more easily done in
liquid fat as opposed to solid fats because solids show a higher resistance to flattening (Walstra,
1984). For association of air bubbles in high fat dairy products such as cream, it is believed that as
soon as bubbles are formed and before proteins can adsorb on the surface, fat globules become
attached to the surface and are held there by surface forces. The foam layer on top of the cream is
enriched in fat. In practical situations beating often goes on in such a way that foam is not formed.
In whipped cream, the fat globules need to be fully attached to air bubbles in order to have stable
foam. The entrapped air makes the fluid very light with a much lower density (Walstra, 1984).
Finally another milk product that is used to make hot beverages is powdered milk. Although
powdered milk can be made via several processes, it is most commonly produced by spraying small
droplets of milk (or concentrated milk) into hot air (Walstra, 1984). Dry powder particles are then
made within a second. The water content is found to be 3% or 4% for skim milk. The spray drying
produces roughly spherical particles with a size distribution of 5-100 μm and air bubbles become
embedded in the particles, which tend to expand during drying. Particles aggregates are comprised
of several individual spheres. Milk powder particles consist of continuous mass of amorphous

21
lactose, fat globules, casein micelles, and whey proteins. The fat globules in milk powder are
changed by the evaporation and spraying process and considerable splitting of fat globules occurs.
As far as proteins are concerned, drying is so rapid that denaturing of proteins is negligible, whey
proteins remain soluble, and most enzymes active. A small fraction of powder may remain insoluble
as small proteinaceous lumps may remain after dissolving the powder in water. Moreover,
creaming is also possible in the form of flecks of fat globules held together by gelled proteins.
Another important consideration is the age of milk powder. If dried milk is held for several months
in relatively moist conditions (mole fraction of water = 0.5) or at high temperatures, a substantial
portion of the protein becomes insoluble. Since proteins help stabilize the dairy emulsion, their
insolubility in water can result in higher partitioning tendencies. Therefore proper storage is vital
(Walstra, 1984).
Ice cream is another dairy product that should be considered. Ice cream typically contains
10% milk fat, 11% milk solids-not-fat, and 14% sugar. It is made by beating air into cream while
rapidly cooling the mixture to -4 to -6⁰C. The structural elements here are ice crystals, air cells, fat
globules, fat granules, and often lactose crystals. Although ice creams and creams contain high
concentrations of fat globules, their susceptibility to coalesce are low because of homogenization,
and only partial coalescence of fat globules are observed in ice cream. Additionally, emulsifiers are
added to ice cream to destabilize the fat globules so that they can form granules during beating
(Marshall et al., 2003).
Conclusions and Predicted Behavior
Every year, discharge of FOG to our sewer systems diminishes the capacity of sewer
pipelines and causes SSOs, polluting our water supplies. In order to reduce the number of
overflows, many agencies prescribe ordinances and BMPs. When reducing the FOG discharge, it is
important to investigate the potential contribution of dairy products to the sewer systems. Some
states, such as Texas and Florida, list dairy products, such as sour cream and ice cream (FL) as a

22
source, while others like Connecticut find that the effects of Classes I and II FSEs, in which most
coffee and other dairy shops fall, are negligible. Therefore, with only a few exceptions, such as
Florida, the majority do not view milk, ice creams, and cream as a contributor to FOG clogs. In order
to investigate this, however, it is essential to look at the chemistry and physical characteristics of
dairy products and study their potential separation in wastewaters.
Milk consists of many colloidal particles, such as fats globules and proteins that can
separate. Milk proteins become insoluble at lower pH values (i.e., 4.6). Although the pH of most
wastewaters tends to be higher and fall in the neutral range, it should be taken into account that
coffee acidifies the system, and thus can make the conditions more favorable for casein micelles to
become insoluble in water. Another important aspect is heating milk for the preparation of hot
beverages. Heat coagulation of caseins occurs as well as damage to the fat globule membrane, thus
more rapid coalescence of fat globules may take place. This can be readily observed when heating
milk, excluding skim milk, for consumption at home. Furthermore, heating increases the acidity of
milk, and coupled with pH reduction from coffee, it is likely that caseins become insoluble. Heating
also causes denaturation of whey proteins, which may result in their entanglement with the casein
micelles. Moreover, whipping and cooling dairy products, as seen in whipped cream and ice creams,
also cause crystallization of fat crystals and their stronger association with one another, making
flocculation of fats more likely.
Having discussed the physics and chemistry of dairy products as well as certain wastewater
characteristics, it was hypothesized that partitioning and separation of different phases, namely fat
globules and proteins occurs in wastewater originating from coffee shops, and ice cream shops. Ice
creams have more flavoring and higher fat concentration, so it was expected that wastewater
originating from FSEs serving ice creams would contain rather substantial dairy fat content. Thus
strong partitioning of fat globules, with smaller densities would occur. Moreover, addition of
different flavors, such as strawberries and blueberries, could reduce pH. Nevertheless, since ice

23
creams tend to contain other flavors, such as chocolate or vanilla which counteract the acidity
imposed by other flavors, for the bulk sample, the pH was expected to be similar to milk (Wolf
Clinic). Coffee shops were expected to have more acidic conditions, and separation of protein
phases is expected. Therefore, separation in FSEs serving mostly iced and hot beverages are likely
to be in form of insoluble proteins with partitioning of fat globules in a lesser degree. Nevertheless,
it should also be mentioned that proteins may start to settle at higher temperatures, making the
adsorption of fat globules at the AW interface more likely. Thus a combination of both substances is
likely to be present in the floating phase. Finally, the effects of different surfactive material used for
cleaning should also be considered as they will influence the surface tension and may delay the
separation process.
To conclude, it was theorized that separation of fat with fewer protein should be observed
in case of ice creams. As for coffee drinks, it was expected that fats would float, while proteins
would become relatively insoluble at lower pH values. Nevertheless, to study the feasibility of
different GADs, it is necessary to study the time frame necessary for the separations to occur. When
mixed with different surfactants, it would be interesting to see whether partitioning of proteins and
fats would occur, or if it would be delayed long enough to escape current GADs. In short, however, it
appeared that dairy products may contribute to formation of FOG clogs in sewer systems. After
testing this phenomenon, and determining the retention time, BMPs and strategies to prevent FOG
accumulation in the sewer systems were to be analyzed and determination of whether further
measures should be taken to diminish FOG clogs and minimize the risk of SSOs on our environment.
24
Chapter 2: Characterization Studies and Laboratory Analysis
Introduction
Phase I of this report provided a brief review of dairy chemistry and physics. After
studying the properties of dairy/water systems and the different environmental variables that
affect their homogeneity, a relatively high potential for separation of different dairy solids and
fats was predicted. Having discussed dairy science and making predictions about dairy behavior
inside sewer systems, a series of laboratory tests have been conducted.
Based on previous research, it was expected that separation and partitioning of different
milk constituents would be a function of temperature and pH. Temperature effects included both
cooling and heating. At low temperatures, crystallization of fat globules accompanied by cooling
is expected to occur, which would result in the strong association of fat molecules with one
another, making it more likely for them to partition into a separate phase. At high temperatures,
several characteristic changes were predicted, including heat coagulation of caseins, further
acidification and denaturation of whey proteins, and finally damage to fat globule membranes
can cause coalescence of fat globules, making it more likely for partitioning of different dairy
species to occur (Walstra et al., 1984). Water pH was also expected to influence dairy suspension.
Dairy products tend to have neutral pH (6.6‐6.9). When a dairy system is acidified, however,
dissolution of casein proteins takes place, and a dairy curd appears in the mixture (Walstra et al.,
1984).
To study the behavior of different dairy systems, a series of batch tests were prepared to
mimic dairy/water ratios matching wastewater originating from dairy shops at different pH
values. Finally, once a good understanding of the partitioning behavior of dairy products is
obtained, standard methods will be used for quantifying the FOG content of the mixtures.
Although monitoring the partitioning tendencies of dairies is an important part of this
work, the samples tested would be realistic and represent potential waste samples found in the

25
industry. Thus visits to different food service establishments (FSEs) took place to obtain a realistic
perspective.
From the chemistry it was predicted that separation should take place and would be
influenced by pH and temperature; after visiting FSEs, synthetic wastewater was made for testing
these characteristics.
University of Maryland Dining Services
Prior to starting experimentation, an attempt was made to understand the different
practices of FSEs serving hot and cold beverages and understand the different products used in
these facilities. The campus tour began at approximately at 10 AM on 8/9/2010 with a visit to
South Campus Dining Services accompanied by WSSC inspector Ms. Joyce Cox, and University of
Maryland’s Dining Services manager Mr. Gregg Thompson. This tour included a visit to different
campus facilities, such as the ice cream making facility, grease interceptors, University of
Maryland Facilities Management, and Stamp Student Union Coffee Bar.
The first place of visit was the ice cream making facility, which is located in South Campus
Dining Services. An ice cream maker is used which processes ice cream mixes and different
flavors to produce frozen custard and ice cream. The ice cream mix is a sweetened cream‐like
mixture consisting of 14% dairy fat. Several flavor additives, including many fruits, peanut butter,
chocolate, and vanilla are used in campus. The detergent used in all campus FSEs is “Pantastic”
detergent, which is a product of Ecolab.
The grease interceptors on campus are underground and collect the wastewater originating
from FSEs in the different parts of the campus for treatment and separation of FOG from the
wastewater. Currently all wastewater originating from FSEs on Campus, except the regular coffee
shop located in the Physics building, pass through grease interceptors. The Student Stamp Union
houses the majority of these FSEs. Therefore, this building was chosen as an example. Two 1600
gallon (6050 L) interceptors are installed within close vicinity of this building. None of the

26
interceptors have a specific retention time as the volumetric flow rate changes with season.
Interceptors are cleaned on a monthly basis, or as needed in case of emergency. During summer
months, because of the smaller demand, the water flow rate to the interceptors decreases, and
fewer clean ups are scheduled (approximately every 2 months). The interceptors, seen in this
visit, contained mostly water with a floating film of FOG. The interceptors as a general rule consist
of three sections. The first section contains material, which includes waste food and scraps, and a
very clear film of FOG could be observed in the first compartment. The following compartment
showed smaller FOG content. Finally the third compartment shows the least FOG, and the water in
this part is mostly free of all solid food and grease. Although a thin film of FOG was present, the
improvement in the quality of wastewater could visibly be seen.
Student Stamp Union Coffee Bar
A visit to the Stamp Student Union Coffee Bar was done on Wednesday, Aug 4th, 2010.
This visit was mainly aimed to understand the practices of a typical specialty coffee shop and
to estimate the composition of coffee shop wastewater for future reconstruction of a sample.
Most of the mixing for preparation of hot dairy beverages such as cappuccino, and café mocha
were done inside the consuming cup. The Frappuccino drinks on the other hand were made
inside a blender consisting of a requested number of espresso shots, a shot of the requested
flavor, milk with specific fat content, and ice. This drink with or without ice is the most popular
drink during the academic year and accounts for approximately half of their entire sale during
regular semester hours. A list of the most popular drinks included caramel macchiato, vanilla
latte, regular latte, white mocha, regular mocha, and regular coffee. The coffee shop used
whole and skim milk although 2% milks are also offered, which were made by mixing equal
portions of whole and skim. Table 2.1 reports the average consumption of whole and skim
milk on a per day basis. As can be seen, whole milk has a higher demand than skim.
Approximately 80% of the entire milk was heated for use while only 20% is consumed chilled.

27
Whipped cream sprays were used in the drinks. Thus it seems that none of the whipped cream
would enter the sewerage system.
Table 2.1. Average Daily Consumption of Milk in Student Union Coffee Bar
Milk Summer (L/day) Reg. Semester (L/day)
Skim 28 57
Whole 38 76
Due to health regulations, coffee pots holding regular and decaf coffee were cleaned and
replaced with freshly brewed coffee every two hours. The samovars are cylindrical in shape, with a
diameter of 8.5” (22 cm) and a height of 17” (43 cm). The volume of regular coffee made each day
was about twice that of decaffeinated coffee, which is filled only to half capacity. Therefore
approximately 0.95 and 0.47 L of regular and decaffeinated coffee enter the drain every 2 hours. If
the Coffee Bar only provided coffee in this manner, it would be classified as a regular coffee shop.
However, because of the dairy additives and options available, the Coffee Bar is a “specialty” coffee shop.
Ice cream sale in this location seems to be minimal.
This specialty coffee shop uses four sinks, each with dimensions of 17.5”x10.5”x9” (44.5cm x
26.cm x 23cm). Three of the sinks are used for cleaning practices, as prescribed by the health
department, which means two of the sinks hold water for first dipping and sterilizing. The rinsing
sink, on the other hand is used only as needed. There is an additional rinsing sink; its use was
omitted during sampling to assist in obtaining samples for this facility.
During regular semester hours, the sinks are drained an average of four times per day while
during the summer this number reduces to twice a day. It seems that the only source of milk
entering the drain in this specialty coffee shop is from cleaning the milk pots and blenders. For
future work, it would be useful to obtain the sales for different flavor additives used, and also the
sales of dairy product on a monthly basis. Sample collection from the Coffee Bar helped greatly in
determining the dairy FOG content of the wastewater. It seemed that most of the flavors involved in
the processing of hot beverages were of neutral pH range. The overall dairy: water ratio appeared

28
to be approximately 1:10, containing different heated and chilled dairy substances. This facility
seemed to be an optimum place for sample collection. The list of hot and cold dairy beverages
served reflected other typical specialty coffee shops. Additionally, the Coffee Bar offered a wide
selection of dairy products. It was of great interest to visit other FSEs off campus, with on‐site
grease abatement devices (GADs) as studying the physical status of the GAD is an indicator for
potential partitioning of dairy FOG or other dairy constituents. From this visit, the portions used to
prepare synthetic wastewaters were selected. Furthermore, after observing daily practices of the
Coffee Bar, it is important to conduct tests to determine the effects of sterilizers and detergents. Off
campus locations were also identified. Studying the physical status of the GAD is an indicator for
potential partitioning of dairy FOG or other dairy constituents.
Partitioning Behavior of Dairy
Different batch tests for testing partitioning behavior of dairy products under different
conditions were made, and for each batch pH effects were studied. The following flow diagrams
demonstrate these conditions.
(a)
(b)
Diagram 2.1. Experimentation to Investigate Partitioning Tendencies of Synthesized Dairy Wastewater

29
The Flow diagram 2.1 demonstrates testing for milks, while (2.1b) illustrates the
procedure used for half and half, ice cream, and hot and chilled lattes. The results of these tests
are discussed in the following parts of this section.
Dairy Suspension and pH
As already mentioned, reducing the pH to a value of 4.8 will cause dissolution of calcium
phosphate present in the caseinate micelles and will thus result in separation of proteins from the
suspension. Since the level of the acidity of the additives, mainly in form of flavors in frozen
desserts, and hot/chilled beverages is diverse, it is important to study the partitioning behavior of
mixtures at different acidity levels. To test this study, different Cloverland Farm Milks (whole, 2%,
and skim) and half and half were mixed with tap water to make a 200 mL 1:10 dilution.
Concentrated HCl was then used to generate a pH profile of the samples. Other dairy products
used in this study include vanilla ice cream, and hot and chilled vanilla latte, obtained from Coffee
Bar, located at University of Maryland Stamp Student Union.
Since the purpose of this study was to investigate the potential separation of dairy FOG
from wastewater, it was important to incorporate any additive that can result in suspension of FOG
within the water body. One such additive is detergent. Commonly composed of surfactive
molecules, they can reduce the surface tension and keep different constituents suspended in the
mixture. Furthermore, as part of best management practices, many FSEs use the three sink model
described in the previous section, which in addition to diluted detergent water mixture, also
include sterilizer. A sample from rinse and sterilizing sinks were obtained from UMD Dining
Services. Equal volumes of water, detergent + water dilution from sink 1 and sterilizer solution
from sink 3 were mixed. Similar 1:10 dilutions of dairy: detergent: water were made, incorporating
sink samples. For these tests, the tap water was replaced by a 1:4 sink‐mix: tap water.
Samples were prepared in 200‐250 mL Erlenmeyer Flasks and tested in 50 mL centrifuge
tubes. These samples were allowed to sit for 3 hours and were monitored frequently during this

30
time. To obtain a comparable reading among different batches, the samples were then
centrifuged to refine the separated phases. The results of this study appear in Figure 2.1.
Figure 2.1. Separation of vanilla ice cream, vanilla latte and half and half: water and vanilla ice cream, vanilla latte, and half
and half: (detergent + water) mixtures at different pH values.
0%
10%
20%
30%
40%
50%
60%
70%
80%
90%
100%
7.1 5.0 4.0 2.2
Par
titi
on
ing
Be
hav
ior
pH
a) Vanilla Ice Cream:Water (1:10)
% Floating Clear Soln % Settling
T=250C Centrifuged
0%
10%
20%
30%
40%
50%
60%
70%
80%
90%
100%
7.0 5.3 4.9 3.0
Par
titi
on
ing
Be
hav
ior
pH
b) Vanilla Latte: Water(1:10)
% Floating Clear Soln % Settling
T=250C Centrifuged
0%
10%
20%
30%
40%
50%
60%
70%
80%
90%
100%
7.2 6.1 4.9 4.1
Par
titi
on
ing
Be
hav
ior
pH
c) Half & Half:Water (1:10)
% Floating Clear Soln % Settling
T=250C
Centrifgued
0%10%20%30%40%50%60%70%80%90%
100%
7.0 5.4 4.8 3.4
Par
titi
on
ing
Be
hav
ior
pH
a') Vanilla Ice Cream:(Det+Water) (1:10)
%Floating %Soln %Settling
T=250C Centrifuged
0%
10%
20%
30%
40%
50%
60%
70%
80%
90%
100%
7.1 5.5 4.9 3.6
Par
titi
on
ing
Be
hav
ior
pH
b') Vanilla Latte:(Det+Water) (1:10)
%Floating %Soln %Settling
T=250C Centrifug
0%
10%
20%
30%
40%
50%
60%
70%
80%
90%
100%
7.0 5.4 4.0 3.0
Par
titi
on
ing
Be
hav
ior
pH
c') Half&Half:(Det+Water) (1:10)
%Floating %Soln %Settling

31
Figure 2.1-continued. Separation of Whole, 2%, and skim milk: water and whole, 2%, and skim milk: (detergent + water)
mixtures at different pH values.
0%
10%
20%
30%
40%
50%
60%
70%
80%
90%
100%
7.2 6.0 4.8 4.2 2.9
Par
titi
on
ing
Be
hav
ior
pH
d) Whole Milk:Water (1:10)
% Floating Clear Soln % Settling
0%
10%
20%
30%
40%
50%
60%
70%
80%
90%
100%
7.2 6.0 4.8 4.2 2.9
Par
titi
on
ing
Be
hav
ior
pH
e) 2% Milk:Water (1:10)
% Floating Clear Soln % Settling
0%
10%
20%
30%
40%
50%
60%
70%
80%
90%
100%
7.2 5.9 4.9 4.3 3.2
Par
titi
on
ing
Be
hav
ior
pH
f) Skim Milk:Water (1:10)
% Floating Clear Soln % Settling
0%
10%
20%
30%
40%
50%
60%
70%
80%
90%
100%
7.0 6.0 4.8 4.4 3.5
Par
titi
on
ing
Be
hav
ior
pH
d') Whole Milk:(Det+Water) (1:10)
%Floating %Soln %Settling
0%
10%
20%
30%
40%
50%
60%
70%
80%
90%
100%
7.2 5.3 4.9 3.8 3.1
Par
titi
on
ing
Be
hav
ior
pH
e') 2%Milk:(Det+Water) (1:10)
%Floating %Soln %Settling
0%
10%
20%
30%
40%
50%
60%
70%
80%
90%
100%
7.2 5.3 4.9 3.8
Par
titi
on
ing
Be
hav
ior
pH
f') Skim Milk:(Det+Water) (1:10)
%Floating %Soln %Settling

32
The results illustrated that, based on the fat content of the mixture, the dissociated
aggregate will either rise, or sink. Each sample was categorized into three groups of sinking,
suspended, and floating phases. Each phase was then measured and results reported as
percentage of total solution present. Based on the visible turbidity of the solution/suspended
phase, the number and colors of the lines crossing the columns were altered to reflect
observations. Figure 2.1 demonstrates data for room temperature tap water.
As known, fats have lower density than water and proteins, and it seems that aggregates of
samples containing high fat content, such as half and half and ice cream were more likely to float at
least by some extent. In the case of half and half, almost all the separated phase was positioned in
the floating layer, while for ice cream the floating/sinking tendencies depended on pH. Perhaps
the stronger association of crystallized fat globules in ice creams was responsible for this behavior.
Furthermore, in case of ice cream, a foam layer also appeared. This foam was believed to hold
entrapped air within a fat globule phase.
As a general note, it can be said that introduction of detergents to the system enhances the
separation tendencies of the samples. In almost all dairy products similar or better partitioning
occurred. This separation may be the result of number of factors, such as salting out, cosolvent
effects, and/or surface tension. The only exception here is vanilla latte. In the case of vanilla latte,
some degree of partitioning occurred for all pH values. Nevertheless, upon introduction of the
detergent sample less partitioning could be observed at a pH very close to the zero point of charge
of calcium phosphate in caseinate, at which point significant partitioning was expected. Moreover,
it seems that the addition of the detergent mixture also slightly improves the buffer capacity, and
the samples were more resistant to pH change.

33
Dairy Suspension and Temperature
Methodology
To study the effects of temperature on Cloverland Farm milks (whole, 2%, and skim) and
half and half, samples were obtained and their partitioning behavior at 0, 25, and 800C was studied
for three hours. The samples were tested in static conditions. To heat the mixtures, the samples
were immersed in an 800C water bath for approximately 20 minutes since being in direct contact
with heat will result in deformation of fat globules and their adhesion to the bottom of the storage
vessel, which should not be read as a sediment phase.
From practices observed in the Coffee Bar, milks are rapidly heated to high temperatures
for preparation of hot dairy-based beverages while incorporating air into the mixture to promote
formation of a foam layer. To mimic this exercise, a 1000C water bath was used to rapidly heat milks
with different fat content until the samples reached a temperature of 700C, which was measured to
be the average temperature of sampled hot coffee beverages. The samples were mixed several
times for the duration of the heating process by rotating the sample 900. Once the samples were
heated, 1:10 dilutions were made to study their behavior. It should be noted that despite the high
temperatures of milks, none of the samples had formed a fat film on top of the solution. The
samples were allowed to cool prior to synthetic wastewater preparation. After approximately 20
minutes, the mixtures had reached room temperature.
The effects of temperature can also be reflected in the higher solubility of compounds in hot
water. Traditionally greasy dishes are washed with warm water for optimum removal of oils and
fats. It was, therefore, important to study the behavior of dairy systems diluted in warmer
temperatures. A hot tap water faucet was allowed to run for several minutes until it reached a
steady temperature. The average temperature was measured to be 500C. This water was used for
dilution. Since most washing is done at the same time, it is believed that the warm tap water will be
continuously run in the FSE, which will raise and maintain the temperature of a grease interceptor

34
to 500C for several minutes before the system starts equilibrating with its surrounding. The GAD
was assumed to be relatively isothermal and able to withhold its heat for approximately 50
minutes. Because of the relatively small size of the laboratory samples, their vicinity to the cooler
ambient temperature resulted in rapid heat loss. To prevent this, the samples were placed in a
water bath of the same temperature for 30 minutes after which they were removed. The samples
were exposed to different pH conditions and their partitioning tendencies studied.
In addition to studying creaming or separation of fat at different temperatures, more
experiments were devised to study the effects of water temperature, and heated and chilled milks
on separation tendencies of the system, the outline of which are presented in Diagram 2.1. They
include dilutions of heated (700C) and chilled milks (whole milk, 2% fat milk, and skim milk) with
room temperature (250C), and warm (500C) tap water at pH levels of [5.2-5.4] and [4.8-4.9].
Results and Discussion
As Figure 2.2 demonstrates, no separation was observed at 00C. At room temperature,
however, a 6% separation of fat could be observed for half and half. The partitioning phase forms
approximately in the first hour for a static system. Finally, at an elevated temperature of 800C,
partitioning of fat species could be observed for all systems, which appeared as a thin layer for the
milk mixtures after the first 5 minutes. . For half and half, creaming occurred more slowly, starting
from 1 to 10 minutes after reaching the elevated temperature. The final readings were done on un‐
centrifuged samples, and immediately after they were removed from the water bath.
The results obtained in this exercise agree with expectations. The lack of presence of a fat film
at 0 and 250C is mainly due to the fact that milk supplied in different FSEs and supermarkets is
homogenized milk, which by definition, should not separate at lower temperatures. In the case of
half and half, due to its higher fat content (10‐12%), the formation of a fat layer was observed,
which accounts for 12.5% (ht/ht) of sample. This number matches the predicted fat content of half

35
and half, and it seems that almost complete separation of fats was observed
(http://www.robertsdairy.com/products/cream/-half‐and‐half).
As can be seen from Figure 2.2, the degree of separation increases with fat content of the
mixtures. It should be noted that although little or no separation occurs within the three hour time
frame at lower temperatures, milk mixtures contain microbial and enzymatic species and will spoil
with passing of time. Thus although no separation was observed within 3 hours, the samples
spoiled after 24 hours at room temperature, which was accompanied by separation of dairy curd,
and potentially leading to formation of a product that could solidify in a sewer system.
The phenomenon observed in Figure 2.2 is often called “Creaming”, which occurs during the
heating of dairy products, such as milk (Walstra,
et al., 1984). Heating milk is also one of the
processes involved in making many hot
caffeinated beverages, during which the
membrane of the fat globules is damaged and
coalescence of dairy fat occurs at a relatively fast
rate. Based on observations in the Coffee Bar,
although hot beverages served are heated to temperatures ranging from 60 to 800C, based on
measurements, an average specialty coffee drink temperature of 700C was chosen for analysis. As
already mentioned, milks are heated very rapidly and with insertion of air in the mixtures.
Therefore, it seems that with the relatively vigorous force introducing air bubbles in the system
accompanied by the formation of a foam layer, the milk fat will not, at least immediately, partition
into a separate phase, although some separation can be seen after the coffee is cooled.
Testing on samples modeled from the Coffee Bar practices produced a slightly thinner film layer,
compared to samples heated in the static condition. Creaming in this scenario could be observed for
whole and 2% milk fat samples, resulting in 1.9 and 0.95% separation for each one respectively.
0%2%4%6%8%
10%12%14%
0 25 80% S
ep
ara
tio
n (
v/
v)
0C Skim 2% Whole half&half
t =3 hrs pH =[6.6-7]
Figure 2.2. Temperature Profile of milk and half and half. The extent of creaming/separation reported on a volume basis.

36
None could be seen for skim milk. Thus it appears that mixing the samples during heating retards
and reduces the partitioning of dairy fat. The effects of warm (500C) and room temperature tap
water were also incorporated. The partitioning behavior of heated and chilled milks with different
fat content, and ice cream samples were studied and found to be similar. Thus only the results for
whole milk systems (Figure 2.3 and 2.4), and hot and chilled vanilla latte (Figure 2.5) are presented
and discussed here. Although the samples were studied for 3 hours, the time series were graphed
until the separated phases reached a constant thickness.
The results of test samples for whole milk appear in Figure 2.3. As can be seen, the heated
milk resulted in higher separation. Upon introduction of concentrated HCl to the mixtures to
produce a pH range of [5.4-5.2], the solutions became cloudy and dissolution of (apparently)
proteins occurred. During the next 90 minutes, these proteins sank in the sample until they reached
a steady height. As illustrated in Figure 2.3, all samples appeared to have reached steady state after
90 minutes, except for the heated whole milk: room temperature water sample, which took 120
minutes before settling. The heated whole milk sample appeared to form colloidal particles (most
likely calcium phosphate) at this pH range, which took a relatively long time before settling to a
constant height. Increasing the temperature of the water from 250C to 500C enhanced the dynamics
of the system and resulted in faster settling. Although the pH values of both were similar (5.2 and
5.4 for chilled and heated milk, respectively), the heated sample: warm tap water resulted in higher
precipitant volume after 90 minutes (20% for heated milk: 250C water, 11.1% for heated milk +
500C water, and compared to 10% for chilled milk + 250C water).
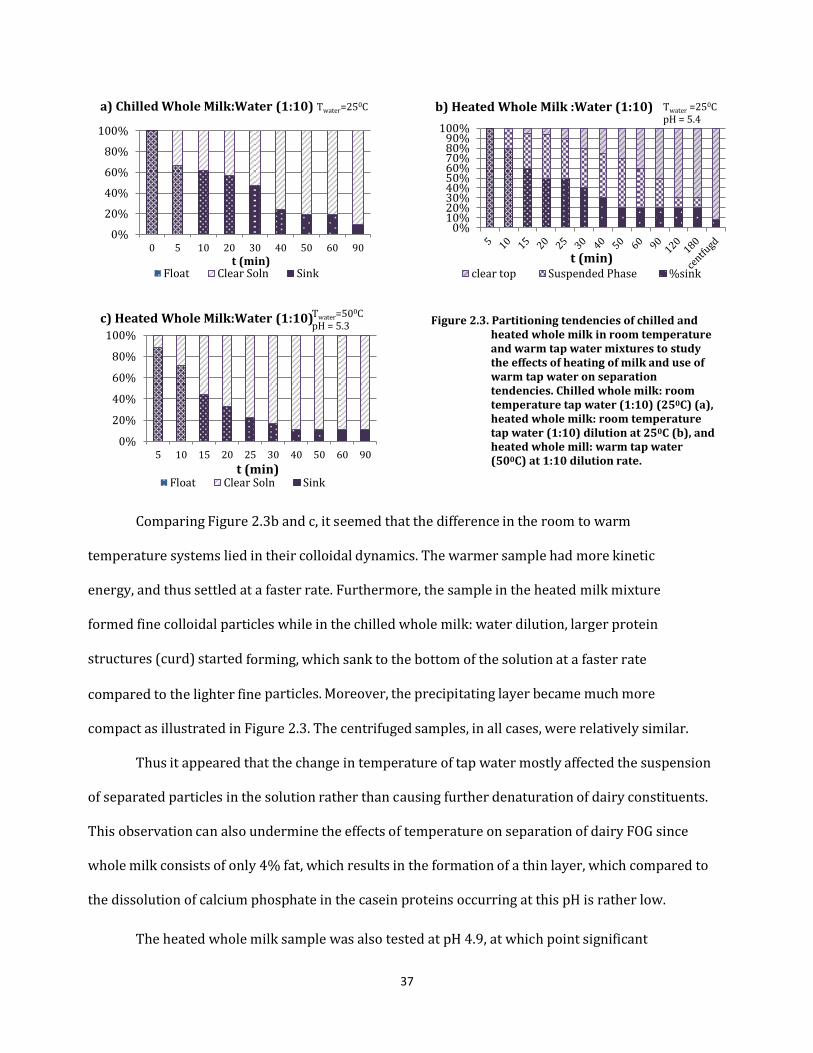
37
Figure 2.3. Partitioning tendencies of chilled and
heated whole milk in room temperature and warm tap water mixtures to study the effects of heating of milk and use of warm tap water on separation tendencies. Chilled whole milk: room temperature tap water (1:10) (250C) (a), heated whole milk: room temperature tap water (1:10) dilution at 250C (b), and heated whole mill: warm tap water (500C) at 1:10 dilution rate.
Comparing Figure 2.3b and c, it seemed that the difference in the room to warm
temperature systems lied in their colloidal dynamics. The warmer sample had more kinetic
energy, and thus settled at a faster rate. Furthermore, the sample in the heated milk mixture
formed fine colloidal particles while in the chilled whole milk: water dilution, larger protein
structures (curd) started forming, which sank to the bottom of the solution at a faster rate
compared to the lighter fine particles. Moreover, the precipitating layer became much more
compact as illustrated in Figure 2.3. The centrifuged samples, in all cases, were relatively similar.
Thus it appeared that the change in temperature of tap water mostly affected the suspension
of separated particles in the solution rather than causing further denaturation of dairy constituents.
This observation can also undermine the effects of temperature on separation of dairy FOG since
whole milk consists of only 4% fat, which results in the formation of a thin layer, which compared to
the dissolution of calcium phosphate in the casein proteins occurring at this pH is rather low.
The heated whole milk sample was also tested at pH 4.9, at which point significant
0%
20%
40%
60%
80%
100%
0 5 10 20 30 40 50 60 90
t (min)
a) Chilled Whole Milk:Water (1:10)
Float Clear Soln Sink
Twater=250C
0%
20%
40%
60%
80%
100%
5 10 15 20 25 30 40 50 60 90
t (min)
c) Heated Whole Milk:Water (1:10)
Float Clear Soln Sink
Twater=500C pH = 5.3
0%10%20%30%40%50%60%70%80%90%
100%
t (min)
b) Heated Whole Milk :Water (1:10)
clear top Suspended Phase %sink
Twater =250C pH = 5.4

38
separation of proteins and fats was expected to occur. The results appear in Figure 2. 4. As
illustrated, it can once again be concluded that the higher water temperature will result in faster
Brownian motion, enhancing the sinking of precipitated dairy constituents. Figure 2.4c
demonstrates the results for heated whole milk: detergent + sterilizer sink mixture (1:10 dairy
dilution). It can be seen that the degree of separation was slightly higher in this case compared to
pH range of 5.2‐5.4 (10% vs., 8.5% and 8% for dairy + detergent + water dilution, dairy/warm
water, and dairy/water at room temperature, respectively). The same test was also completed for
2% milk fat, and the results are in agreement with findings demonstrated above but in lower
portions as 2% milk contains less fat. As expected, the samples at pH ~4.9 also produce a more
clear solution than at pH range of Figure 2.3 (5.2‐5.4).
Figure 2.4 Partitioning tendencies of heated whole milk: 500C tap water(a), heated whole milk: 250C tap water (b), and heated whole milk: Detergent + 500C water (c) at pH 4.8-4.9. Samples centrifuged for comparison with pH studies of chilled whole milk: water and chilled whole milk: detergent+ water synthetic wastewater samples of Figure 2.1, which reported degree of separation after centrifuging of samples.
Similar analyses were conducted for hot and chilled vanilla latte at pH 4.2‐4.4. The
difference between the samples mostly lied in their sugar content, and the use of different
temperature whole milk. This pH range was chosen because of the high probability of separation.
0%10%20%30%40%50%60%70%80%90%
100%
t (min)
a) Heated Whole Milk: water (1:10)
Float Clear Soln Sink
Twater=500C pH = 4.9
0%10%20%30%40%50%60%70%80%90%
100%
t (min)
c) Heated WM:(Det+HW) (1:10)
Float Clear Soln Sink
Twater=500C pH = 4.8
0%10%20%30%40%50%60%70%80%90%
100%
t (min)
b) Heated Whole Milk:Water (1:10)
Float Clear Soln %sink
Twater=250C pH = 4.9

39
The results appear in Figure 2.5.
Figure 2.5. Partitioning tendencies of hot vanilla latte (5a) and chilled vanilla latte (5b) at room temperature, and pH range of 4.4-4.2
Only the first 90 minutes of data appear in this exercise, at which point the samples
appeared to have reached steady state. The hot and chilled coffee mixtures behaved similarly. In
both samples, sinking of the curd occurred only to show proclivity to rising again, particularly in the
chilled vanilla latte: detergent+ water sample. The precipitated phase became somewhat compact in
approximately half an hour in the chilled vanilla latte, but became more dispersed and loosely
packed after this time until a portion of the sample separated from the curd and rose to the surface.
To summarize the tendencies of both mixtures, the centrifuged precipitated phase in both cases was
10%, and both samples show relatively similar behavior. The difference of note was the lightness of
the formed precipitant layer in the chilled beverage dilution while in case of hot vanilla latte the
precipitated layer was observed to be denser and of finer particles.
Further experimentation was done on other dairy systems including vanilla, chocolate, and
raspberry ice creams, and half and half, in which the samples were mixed with warm detergent
solutions and warm tap water at temperatures matching those described above. The overall behavior
of these samples remained similar to observations already explained, and the only difference
between warm and cold samples was the denser precipitant layer in case of 500C water samples
compared to 250C water samples. This can be associated with the increase in kinetic energy of the
0%10%20%30%40%50%60%70%80%90%
100%
t (min)
a) HVL:(Det+Water)(1:10)
Float Clear Soln Sink
Twater=250C pH = 4.4
0%10%20%30%40%50%60%70%80%90%
100%
t (min)
b) CVL:(DET+Water) (1:10)
Float Clear Soln Sink
Twater=250C pH = 4.2

40
system. It was hypothesized that increasing the
temperature and introducing detergent mixtures
in the system would keep the material
suspended in the water phase. The results were,
however, contradictory to this speculation and
matched findings discussed in the previous
section. Introduction of detergents, enhanced
separation of the system, and coupled with
increased temperatures of the system, a more
condensed floating layer, equal to 10% of the mixture volume, was observed. This layer was quite
condensed and closely packed. Figure 2.6 provides photographic evidence of this observation.
Since the system was heated in this experiment, it was interesting to see whether this increase
in temperature caused chemical reactions. As already mentioned, changing the temperature can
promote separation by damaging the membrane structure of fat globules and denaturation of whey
proteins. It was important to see whether temperature of warm tap water can modify dairy
suspension to this extent. As witnessed here, only samples containing significant fat content, such as
vanilla ice cream, resulted in visible partitioning in the neutral pH range. No evidence supporting
denaturing or other chemical processes could be found, and it is thus concluded that the heat
introduced to the system from warm tap water will not alter the chemical structure of the composite.
As illustrated in Figure 2.6, due to the increase in temperature, more rapid partitioning was
observed. It seems that the elevated temperatures contribute more to raising the kinetic energy and
faster Brownian motion of the system rather than modifying the protein structure. For example, in
case of chocolate ice cream, the sedimentation of chocolate particles formed a relatively compact
sediment layer in only 5 minutes compared to 10‐15 minutes as seen in case of 1:10 dilution of cold
tap water and ice cream. However, this phenomenon was observed much more clearly for raspberry
Figure 2.6. Separation of dairy species in raspberry ice cream: water 1:10 dilution at sample temperatures of 500C (left) and 250C (right) in the first 5 minutes. pH of samples without any addition of acid was 3.8.

41
ice cream. Raspberries fall in the acidic part of the pH spectrum, and the pH of a 1:10 raspberry water
dilution was found to be 3.8. Upon introduction of water to the system, immediate partitioning of
dairy species occurs. This can be clearly seen in Figure 2.6, which illustrates the difference in the two
systems. The warm raspberry water (1:10) dilution resulted in a partitioning of a relatively
condensed 12.5% (v/v) floating layer while partitioning of dairy constituents in the room
temperature sample resulted in a relatively dispersed 14% fat layer after 1 hour. Eventually both
systems partitioned to approximately the same extent, but the warm sample did so at a much faster
rate.
The results obtained here are rather contradictory to the initial expectations. It was
hypothesized that introduction of detergents and warm water will keep the separated particles
suspended in the solution. Nevertheless, it seems that the hypothesis is not supported by the
laboratory observations. Because of the globular shape of dairy fats and their lipid membrane
cover, the increased energy of water molecules perhaps has little to do with suspension of fat
colloids in the solution. Increasing the temperature will cause faster partitioning of separated
particles due to the increased kinetic energy of the system. A condensed report of the findings in
this section appears in Table 2.2.
In almost all samples tested, it was seen that addition of detergents and sterilizers slightly
enhances partitioning potential of dairy + water dilutions. Raising the temperature of the batch
systems also positively influences separation by contributing to the kinetic energy and faster settling
of suspended material. Overall, the heated milk samples do separate but are more resistant to curd
formation as observed in both heated milk and hot latte mixtures. Further acidification of all samples,
however, does result in separation of curd.

42
Table 2.2 Summary of Results for Separation of Dairy: Water and Dairy: (Det+Water) dilutions
Sample (1:10) T (0C) pH Effects Det. Effects
Heated Milk: tap water Dilution
25
Separation occurring at pH [5.2-4], with maximum partitioning as pH→4.8.
More resistance to curdle, Formation of colloids for pH ~5.3
slightly enhanced separation for pH{5.3-4]
50 Similar behavior as 25
0C; higher kinetic
energy→faster settling
More compact precipitate phase
slightly enhanced separation for pH{5.3-4]
Chilled Milk: tap water Dilution
25 Separation occurring at pH [5.2-4], with
maximum partitioning as pH→4.8.
slightly enhanced separation for pH{5.3-4]
50 Similar behavior as 25
0C, higher kinetic
energy→faster settling
More compact precipitate phase
slightly enhanced separation for pH{5.3-4]
Hot Vanilla Latte
25
Separation occurring at pH [5.2-4], with maximum partitioning as pH→4.8.
Portion of precipitant rises after 30 min and density of settling layer ↓
slightly reduced separation tendencies at pH [5.3-4]
50 Similar behavior as 25
0C, higher kinetic
energy→faster settling
More compact precipitate phase
slightly reduced separation tendencies at pH [5.3-4]
Chilled Vanilla Latte
25
Similar behavior as hot vanilla latte; more curdling, less dense,
Centrifuging produces similar results for both hot and chilled
slightly reduced separation tendencies at pH [5.3-4]
50 Similar behavior as 25
0C, higher kinetic
energy→faster settling
More compact precipitate phase
slightly reduced separation tendencies at pH [5.3-4]
Creams (half & half, and ice
creams)
25
Formation of both settling and floating layer, based on fat content. Half and half(floating), ice cream(floating of foam and fat, settling of curd + additives), maximum separation at pH [5.4-4.8]
slightly enhanced separation for pH{5.3-4]
50 Similar behavior as 25
0C, higher kinetic energy
→ faster settling
More compact precipitate phase
slightly enhanced separation for pH{5.3-4]
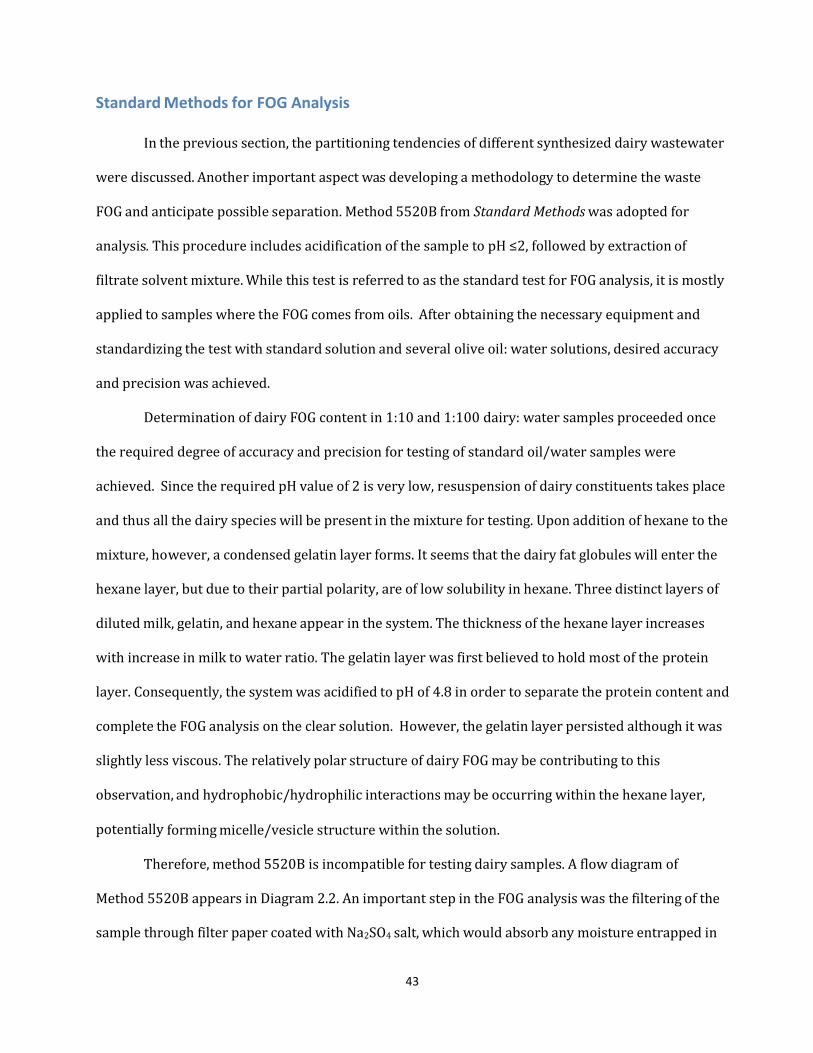
43
Standard Methods for FOG Analysis
In the previous section, the partitioning tendencies of different synthesized dairy wastewater
were discussed. Another important aspect was developing a methodology to determine the waste
FOG and anticipate possible separation. Method 5520B from Standard Methods was adopted for
analysis. This procedure includes acidification of the sample to pH ≤2, followed by extraction of
filtrate solvent mixture. While this test is referred to as the standard test for FOG analysis, it is mostly
applied to samples where the FOG comes from oils. After obtaining the necessary equipment and
standardizing the test with standard solution and several olive oil: water solutions, desired accuracy
and precision was achieved.
Determination of dairy FOG content in 1:10 and 1:100 dairy: water samples proceeded once
the required degree of accuracy and precision for testing of standard oil/water samples were
achieved. Since the required pH value of 2 is very low, resuspension of dairy constituents takes place
and thus all the dairy species will be present in the mixture for testing. Upon addition of hexane to the
mixture, however, a condensed gelatin layer forms. It seems that the dairy fat globules will enter the
hexane layer, but due to their partial polarity, are of low solubility in hexane. Three distinct layers of
diluted milk, gelatin, and hexane appear in the system. The thickness of the hexane layer increases
with increase in milk to water ratio. The gelatin layer was first believed to hold most of the protein
layer. Consequently, the system was acidified to pH of 4.8 in order to separate the protein content and
complete the FOG analysis on the clear solution. However, the gelatin layer persisted although it was
slightly less viscous. The relatively polar structure of dairy FOG may be contributing to this
observation, and hydrophobic/hydrophilic interactions may be occurring within the hexane layer,
potentially forming micelle/vesicle structure within the solution.
Therefore, method 5520B is incompatible for testing dairy samples. A flow diagram of
Method 5520B appears in Diagram 2.2. An important step in the FOG analysis was the filtering of the
sample through filter paper coated with Na2SO4 salt, which would absorb any moisture entrapped in

44
the sample. Because of the structure of the gelatin layer, it was speculated that water would be
trapped within the system. Furthermore, extraction without the filtration process was completed,
and separate phases were formed, and the result remained unsuccessful. Thus a new methodology
should be applied.
(a) (b)
Figure 2.7. Standard Method 5520B FOG analysis on an olive oil: water (1:10) dilution (left) and whole milk:water
(1:10) dilution (right). As can be seen, a viscous gelatin layer upon addition of hexane to 1:10 whole milk water dilution. pH = 2 in both funnels.
Methodology for Fat Determination of Dairy Wastewater
Due to the problems with the standard method mentioned above, in‐depth literature
search was conducted. Standard Methods for the Examination of Dairy Products, 17th ed., replaced
the main source for standard analysis of dairy systems. Method 15.085 (Gerber Fat Method) was
applied for fat determination. An outline of the procedure for the Gerber fat method appears in
Diagram 2.3. This method used isoamyl alcohol to free the fat content and employs the use of
Gerber butyrometers to measure the fat content of dairy product on a percentage fat by mass. Since
most dairy fats analysis methods tended to use an alcohol to release the fat, the definition of
separable FOG needed to be addressed, in particular whether manipulating the chemistry of the

45
system to release the fat globules would represent the potential separation of FOG in the system,
or if it would quantify the maximum possible separation of dairy fat from wastewater.
Diagram 2.2. Standard Methods for Examination of Water and Wastewater Fog Analysis 5520B
Diagram2.3. Standard Methods for Examination of Dairy Product, Gerber Fat Method
Since the wastewater is diluted, milk butyrometers were substituted for cream/ice cream.
Gerber milk/skim milk butyrometers for milk dilutions,
graduated from 0-8% and 0 to 0.5% should suffice.
Figure 2.8 shows a Gerber butyrometer used for milk fat
determination. In short, because of the relatively simple
approach, use of less hazardous practices and reagents,
and fast and yet accurate results produced, the Gerber
Fat Method appeared to be the most feasible method for
this work. The disadvantages included the use of small
sample volume, which made it challenging to obtain a
1. Acidification
•Add enough (1:1 v/v) HCl until pH≤2
•Start extraction
2. Extraction (x3)
•Add 30mL Hexane, mix for 2 min, and extract solvent layer
•Pass through #40 filter +10g Na2SO4
3. Collection of FOG
•Evaporate hexane using 600C water bath
•Cool in a desicator until constant weight is reached
•Record weight once weight is constant
1. Disintegration of Dairy Emulsion
•Add 11.7 mL Dairy Product to
10 mL Concentrated
H2SO4
•ΔH<0, Heat Release
2. Release of Fat
•Add 1 mL isoamyl alcohol
•isoamyl alcohol + heat → Release of
Dairy Fat
3. Fat Collection
•The fat will be collected on top of butyrometer
•Read % fat from the graduated
portion of butyrometer neck
Figure 2.8. Standard Gerber
Butyrometer Used for Milk Fat Determination (www.coleparmer.com)

46
representative sample. As a result, multiple measurements were needed for accurate and
representative results. Furthermore, the butyrometers were not graduated in small enough
increments for diluted milk samples, and adjustments explained in the next chapter were made to
obtain more accurate results.
Conclusion
To conclude, it could clearly be seen that dairy wastewater partitioned under different
wastewater separation conditions. Separation occurred in two forms of settling and floating
phases. Whether the dissociated phase(s) would float or settle depended on the fat content of the
mixture. It was seen that at higher temperatures, a fat layer separates in milks at neutral pH.
Nevertheless, the formation of this layer was retarded by mixing. Furthermore, it was observed
that for heated whole milk samples, at pH 5.2‐5.5, fine particles form, and there was more
resistance to curd separation.
The standard method for FOG analysis (5520B) is not applicable for dairy wastewater, and
a new methodology was needed for testing. The Gerber Fat Method was believed to be the most
feasible approach. Upon completion of this test, the methodology for testing dairy fats was adopted
and employed to quantify separate phases. In the following chapters, appropriate and feasible
methodology was developed, and more visits to relevant FSEs with GADs on site were made for
testing and monitoring.

47
Chapter 3: Field Studies and Separation Analysis
Introduction
As noted in the previous reports, the most prominent separation of dairy dilutions occurs
upon acidification of sample to the zero point of charge (ZPC) pH (4.6-4.9). Acidification can be
accomplished with increased bacterial growth over time, and upon mixing of dairy suspensions
with other acidic chemicals, such as coffee or fruit flavors. In this report, separated phases were
analyzed using the Gerber Fat Method and the fates of fat were determined at ZPC pH, using
concentrated acid (HCl).
Although pH separation has helped our understanding of the fates of fats and partitioning
tendencies of dairy dilutions, it was also seen that addition of hexane and other organic chemicals
can result in formation of different phases. Thus, it was instructive to compare the two separation
phenomena in order to obtain a more comprehensive understanding of dairy wastewater. To do
this, a series of experiments were designed. Moreover, updating the best treatment practices for
FOG required thorough investigation of available GADs. Weekly monitoring of interceptors as well
as sampling was conducted to determine their feasibility. Such analyses were used to correct for
variations in practices, which broadened the dataset for this project.
Fate of Fat
While it is clear that separation occurs at lower pH values, it was important to analyze the
samples and determine the portion of total fat residing in each phase. A mass balance can be
completed to determine the portion of fat residing in each separated layer
Methodology for Quantification of Fractioned Fat
One of the key steps in determining the fate of fat upon partitioning was to quantify the
mass fraction of fat present in each layer. To do this 1:10 dilution of ice cream, whole, 2%, and skim
milk were prepared, and 100 mL of each batch was drawn and weighed prior to pH reduction to 4.8

48
using concentrated HCl. The samples were then allowed to rest until aggregates had separated into
distinguishable phases (~ 3 hours). At this point, no additional dissolution of caseinate should
occur. To obtain distinct phases and rid the curd layer of any retained serum, the samples were
centrifuged. The weight of the clean and dry tubes was first measured after which the samples were
transferred to the tubes and centrifuged at 3600 rpm for 5 minutes. This step was added to avoid
interference of fractions of serum retained within the curd with measurements for the mass
fraction of separated phases as well as their fat content. The partitioned layers were then
separated. In testing of milk dilutions, the supernatant serum was first separated and weighed. The
mass of the tube plus the settled curd layer was then obtained and subtracted from the empty dry
centrifuge tube to obtain an accurate measurement of the settled curd. The curd was then
transferred to a clean and weighed 80 mL beaker using a spatula. Portions of the curd tended to
adhere to the tube/spatula; to separate them for analysis, known volumes of distilled water were
added to wash the tube of all the curd flocs with a pipette (v -13-16 mL), which were transferred to
the beaker. After a final weight measurement, the curd was thoroughly dispersed in the water using
a magnetic stirring bar, and the beaker sealed. After mixing for 10-15 minutes until all the curd was
completely suspended in the water, the seal was removed and 11 mL of sample using a milk pipette
was drawn for testing.
In ice cream or half and half, the curd formed a more compact floating phase. The floating
phase was separated using a spatula, and almost all the flocs from the tube were retrieved into a
weighed beaker, and the weights of the curd and serum were obtained. The curd was then
dispersed in a known volume of water (V [13-16 mL]) and the same procedure indicated for milk
dilutions was followed.
Finally, the Gerber Fat Method was employed to determine the mass percentage of fat
trapped in the different Layers. Since the butyrometer used in this method is not compatible with
the centrifuge available at the University of Maryland’s environmental engineering laboratory, it

49
was replaced with Pyrex centrifuge tubes in the initial steps, including transfer of 10 mL of
concentrated Sulfuric acid prescribed for digestion of the emulsion, and addition of 11 mL of
sample. The samples were mixed by inverting the tube rapidly for at least 30 seconds, and
immediately after the digestion of the emulsion, centrifuged as directed by the Gerber Fat Method.
A pipette was used to ensure complete transfer of samples to and from these tubes to the
butyrometer. Once the sample was transferred to the butyrometer, The Gerber Fat Method was
carried out as prescribed in the Standard Methods for testing of Dairy Product. The fat fraction of all
the milks and ice creams were also determined, using the described modified version of the Gerber
method.
Partitioning of Dairy Fat
To quantify the fractioned fat in each layer, a mass balance equation was written (equation
3.1), and knowing the total mass of fat present in the bulk solution, the fraction of total fat residing
in each layer were found using equations 3.2 and 3.3.
ln,ln
,
ln,ln
,
,
,,ln,ln
.
.
.
.
...
BulkSoFatBulkSo
SerumSerumSerumFat
BulkSoFatBulkSo
curdFatcurd
CurdFat
SerumFaatSerumcurdFatcurdBulkSoFatBulkSo
xm
xmy
xm
xmy
xmxmxm
; Where corresponds to mass fraction measured using the Gerber Fat Method and is the mass
of each layer/solution. Results obtained from this experiment appear in Tables 3.1 and 3.2.
Table 3.1. Mass and Mass Fractions of Fat in Milk and Curd; pH =4.8, T = 200C
Mass of Milk (g)
Total Mass: (g) Milk Mass fraction
Fat in Soln (g) Curd (g) x Curd mMilk+mH2O
Vanilla Ice Cream 7.47 74.730 0.10 1.084 5.11 6.84%
Whole Milk 10.01 100.01 0.10 0.280 4.88 4.88%
2% Milk 10.01 100.04 0.10 0.170 2.05 2.05%
Skim Milk 10.02 100.01 0.10 0.020 1.89 1.89%
(3.1)
(3.2)
(3.3)

50
Table 3.2. Mass Fractions and Mass Balance for Milk: Water Dilutions
Bulk Solution Serum Curd Total Fat = Curd Fat + Ser.
Fat Recovery
Gerber xFat g Fat Gerber xFat g Fat Gerber xFat g Fat
Vanilla Ice Cream 1.45% 1.084 0.06% 0.042 20.30% 1.038 1.080 99.62%
Whole Milk 0.28% 0.280 0.01% 0.010 5.30% 0.259 0.268 95.76%
2% Milk 0.17% 0.170 0.00% 0.000 8.30% 0.170 0.170 100.05%
Skim Milk 0.02% 0.020 0.00% 0.000 1.10% 0.021 0.021 103.94%
Table 3.1 provides the mass of dairy used in mixing of the sample and the dilution ratio of
dairy to water. Fat fractions of the bulk samples were determined, and 100 mL of each sample,
initially neutral, was acidified to 4.8. After distinguishable phases were obtained and the sample
centrifuged at 3600 rpm for 5 minutes, mass fractions of the separated layers were determined and
reported in Table 3.2. Table 3.2 indicates that except for the whole milk: water dilution, all the milk
fat will reside in the curd layer. For whole milk, only 3.4% (0.01g Serum Fat/ 0.28 g Total Fat) of the
total fat of the sample remains trapped in the serum, and this number for the ice cream dilution
sample is 3.7%.
In 2% and skim milk, the
recovered mass was slightly higher
than that of the bulk solution. The
percentage of total fat residing in
each phase is clearly demonstrated in
Figure 3.1. Judging by recovery, and
the fate of fat as mapped in this mass
balance, it was concluded that
essentially all the fat in all samples of
low dairy fat (i.e., 2% and skim)
reside in the curd layer, while only a
small fraction remains trapped in the serum. Determination of Fat in samples of lower fat content in
Figure 3.1. Fractionation of Fat upon pH-induced Separation for 1:10 dairy: water dilutions. As can be seen, aside from ice cream and whole milk, almost all the fat will reside in the curd phase. The recovery of fat in the curd is slightly greater than the measured fat content of the bulk solution.
95.77% 92.36%
100.05% 103.94%
3.72% 3.40% 0.00% 0.00% 0.00%
10.00%
20.00%
30.00%
40.00%
50.00%
60.00%
70.00%
80.00%
90.00%
100.00%
Vanilla IceCream
Whole Milk 2% Milk Skim Milk
Fractionation of Fat Upon pH-induced Separation
Total Fat Fat Trapped in Curd Fat Trapped in Serum

51
this study were thus carried out by first concentrating the fat in the curd layer via acidification to
ZPC pH, and using the curdled portion of the sample to estimate the mass of fat available in the bulk
sample. This procedure was adopted in fresh wastewater analysis.
Wastewater Analysis
Wastewater Collection Procedure
This procedure applies to collection of wastewater samples for FOG analysis from the Coffee
Bar, located at University of Maryland, CP Adele H. Stamp Student Union.
Apparatus:
a. 1- glass Jar or container (V=1 gallon)
b. 1 of each 1000 and 200 mL beakers for sample collection
c. Thermometer
d. Gloves
e. Spatula
f. pH Paper
Procedure:
1. Starting collecting sample by placing a 1000
ml beaker underneath the sink drain, shown in
Figure 3.2. Once the beaker is full (~15 min),
make pH and temperature measurements.
2. After collecting enough drainage, mix the
liquid thoroughly with a spatula to make the
mixture homogeneous and pour
approximately 100-200 mL into a 1-gallon
container.
3. Repeat steps 1 and 2 every time the sinks are
used.
4. After all the wastewater is collected in the jar,
measure the temperature, and transfer the
sample to the ENCE Laboratory, Glenn Martin
Hall.
5. Once the sample is inside the lab, mix with a
spatula, separate the sample into two batches,
mix well, and mix equal masses of each batch for
testing. Measure the pH using calibrated pH probes.
Figure 3.2. Set up for Sample Collection, The Coffee Bar, Student Stamp Union, 2/7/11

52
Figure 3.2 demonstrates the set up for sample collection, which was carried out for first and second
shift during Fall 2010 and Spring 2011 semesters from the Coffee Bar. To maintain consistent
conditions, the sampling took place from 11AM – 3PM for the first shift, and 4-9 PM during the
second shift. Sample appeared to be a cloudy pale coffee colored solution, and the pH was measured
to fall in the neutral range of [6.5-7.1]. The temperature range varies between cold tap and hot tap
water: [15-50]0C.
Procedure for Testing Wastewater Samples
Wastewater samples collected in this study appeared to be much diluted, and fat
measurements of the bulk sample fell very close to the detection limit, with a high degree of
uncertainty. Nevertheless, as demonstrated in the previous section, almost the entire fat content of
an acidified sample, particularly in samples of low fat, was trapped within the curd layer.
Therefore, the measurement of a low fat solution were carried out by concentrating the fat in the
settling phase via acidification with concentrated HCl, centrifuging the sample at 3600 rpm for 5
minutes, followed by Gerber analysis of the settled curd layer.
Figure 3.3a shows the curdling of wastewater samples of 2/7/11. The difference in the
transparency of samples in Figure 3.3a
reflects the settling of the curd clusters
with time, where wastewater samples 5
and 30 minutes after pH reduction to 4.8
are represented. Once distinct phases
formed, and the samples were centrifuged,
displayed in Figure 3.3b, the solid portion
was weighed and the curd was thoroughly
dispersed with a known mass of water to obtain the required volume for testing. Finally the Gerber
(a) (b)
Figure 3.3 Acidified Wastewater for the first (right) and 2nd (left) shifts from the Coffee Bar before (a) and after (b) centrifuging [3600 rpm for 5 minutes], 2/7/11

53
analysis was carried out and the mass fraction of the sample was determined using equations 3.1,
3.2, and 3.3.
Wastewater Fat Content
This technique (curdling) was employed in the wastewater samples collected from the
Coffee Bar, each reflecting performance of different shift operations. The results are presented in
Table 3.3. The dilution rate of milk products in the samples could be estimated based on a
volumetric comparison of the curd layer of wastewater samples with previously tested synthetic
milk wastewaters of 1:10 and 1:100 dilution, and the rate was estimated to be approximately 2:25.
Table 3.3 Bulk Sample Fat Measurements vis-à-vis Determination of Fat from Curd
Curd Fat Determination Bulk Measurement
Shift 1 (11AM-3PM) 0.02% ± 0.004% 0.03% ± 0.01%
Shift 2 (4PM – 9PM) 0.03% ± 0.003% 0.02% ± 0.02%
Table 3.3 summarizes the average fat content of samples obtained during first and second
shifts. Assuming that the majority of fat was released from dairy sources, it was speculated that
cleaning practices, particularly discharge of unused dairy products affect the fat content of samples.
For comparison, Gerber analyses of bulk un-acidified samples were also done, and the results
appear in the second column of Table 3.3. Although the fat content as determined in both bulk and
curdled samples appeared to be close, analysis of curdled samples improved the accuracy of the
measurements (average uncertainty of ± 0.015 for Bulk measurements vs. 0.0035% for Curdled
samples).
Determination of FOG in Wastewater
Since the sample appears to be more diluted than FOG tests carried out in previous reports,
it was speculated that 5520B from Standard methods could potentially be successful in determining
FOG available in the wastewater.

54
Methodology for FOG Determination
The Standard Methods for Testing Wastewater Method 5520B was used to analyze the
wastewater (collected 11/4/10) and diluted milk samples. Despite the low dilution rate of the
wastewater, the gelatin layer persisted. The test was modified, and the filtering and drying of
sample using anhydrous Na2SO4 were omitted to make collection of hexane extract possible for
distillation. This test was also performed 1:10 whole milk: water dilution, in which the 11 mL of
dilution was mixed with 30 mL hexane, and extracted *5. This extract was then air dried for
approximately 1 day in the hood and then weighed.
FOG Analysis
During the traditional FOG analysis method (5520B) three phases could be observed after
mixing of the emulsion with hexane, illustrated in Figure 3.4. The extracted material consisted of
water, hexane, and partitioned dairy substances, and as shown in Figure 3.4a, the first phase,
appearing in the bottom of the container, was diluted milk, while a viscous gelatin layer, containing
clear granular particles, fell on top of the diluted milk. Finally, a clear solution, most likely hexane
with potentially minor dairy substances overlay the system. It is thus interesting to observe the
behavior of higher dilutions upon mixing with hexane. Figure 3.4b shows the viscous layer obtained
from whole milk: water dilution. As the gelatin layer was segregated from the other two layers,
hexane formed a supernatant solution, which was carefully drawn using a pipette. Figure 3.4c
demonstrates the unfiltered wastewater sample prior to heating. Large clusters of proteins and fats
could clearly be seen, illustrated in this Figure, whereas heating the sample, caused deformation of
dairy constituents, as the large clusters will assemble into a thin sheet (Figure 3.4d). The mass that
was obtained after 3 extractions of hexane of 11/4/10 wastewater and 5 extractions of diluted
whole milk: water sample appears in Table 3.4.

55
(c)
(d)
Figure 3.4. Effects of mixing hexane with 1:10 whole milk : water dilutions. (a) Formation of 3 layers of diluted
suspension, viscous gelatin layer, and clear hexane solution from bottom. (b) Extraction of gelatin layer in whole milk sample, (c) extraction of gelatin layer of wastewater; the clusters of proteins and globules of fat can be clearly observed. (d) Heating wastewater sample in 800C water bath and deformation of dairy constituents.
Table 3.4 Fog Measurement (5520B) and Gerber of 1:10 of Whole Milk: Water Measurement
Wastewater 1:10 Whole Milk: Water
Mass Used (g) 100 11
Mass Recovered(g) 0.418 0.038
% Fat + Lipids separated 0.42% 0.36%
Gerber Fat Measurement 0.02% 0.31%
It can be seen that the mass recovered in wastewater analysis did not equal that found with
pH separation, nor did it compare to the fat content measurements from the Gerber analyses.
Hence, it seemed that dairy species other than fats were trapped in hexane. Moreover, triglycerides,
which constitute the major form of dairy fat, are slightly polar, and showed low solubility in apolar
hexane. Additionally, since the dairy dilution remaining after extraction still maintained its white
(b)
(a)

56
and coffee color for both whole milk water dilution and wastewater sample, it appeared that not all
the separable constituents were mixed in hexane. In fact, after 5 extractions, the gelatin layer could
still be obtained. Numerous hexane extractions were required for FOG analysis, which reduced the
efficiency of the technique, and further studies on this test, including volume reduction and
substituting a more polar reagent might facilitate the separation process. It could, however, be seen
that mixing of organic products will result in affiliation of like-substances, and their potential
separation into a separate phase. Therefore, results obtained here suggest that while the fat content
of wastewaters was low, it is possible that wastewaters could potentially partition with other
organic compounds found in bulk wastewater and potentially contribute to dairy-related FOG
blockages.
While the analyses discussed in the previous sections were performed in laboratory, they
can be used to predict the general behavior of wastewater originating from small dairy shops. Two
forms of separation were observed in this study. Curdling of dairy species in reduced pH systems
(pH = 4.8) was quantified, and the fraction of fat residing in the curd and serum sections were
determined, which were found to be concentrated in the curdled layer. It seemed that potential
separation of dairy wastewater, whether en route or at the treatment facility could be quantified
using pH studies of previous reports. Moreover, partitioning of dairy constituents in hexane was
also witnessed during the FOG study. These observations are used as a guideline for predicting the
behavior of wastewater originating from small dairy shops. The lessons drawn from pH reduction
studies can shed light on the behavior of dairy wastewater upon spoiling of milks, an inevitable
phenomenon, which is speculated to take place more rapidly with increasing BOD conditions
expected in wastewater conditions. Moreover, the low solubility of milk products in organic
solvents although making the test incompatible for this analysis, it clearly demonstrated
partitioning of dairy components in organic substances. Consequently, mixing of milk products with
other organic compounds found in bulk wastewater can result in the formation of a separate phase.

57
In conclusion, it is clear that separation of dairy products/wastewater occurs under acidic
conditions (pH range of 5.4-4). Separation can also take place when dairy constituents are mixed
with organic chemicals, such as hexane. In the case of wastewater originating from small dairy
shops, proteins and fats are expected to have the highest tendency for separation. In fact, at ZPC pH,
only whey proteins are assumed to be retained within the aqueous phase. As discussed, the dilution
ratio of dairy to water in the wastewater originating from the Coffee Bar appears to be close to 2:25.
The fat mass fraction was approximately 0.03%, which can be determined accurately by acidifying
the sample, and analyzing the curd layer using the Gerber Fat Method.
The fates of fat were determined in milk dilutions, and it was seen that in samples of low fat
milk (i.e., 2% and skim), all the fat resided in the curd, and the recovery amounted to greater than
100% (103.94% for skim milk and 100.05% for 2% milk water dilutions). This error may be
attributed to the low sensitivity and detection limit of Gerber Fat analysis, in which low
concentration of dairy fat in 1:10 dilution are not accurately measured. Concentrating the fat in a
smaller portion is likely to produce better detection accuracy. Therefore, this technique was
adapted as the methodology for fat determination of samples with lower fat content. Partitioning of
dairy species into other organic chemicals is another potential source for separation and potential
contribution of dairy constituents to FOG-related blockages. More in depth analysis will help with
modification of the FOG test for analysis of dairy wastewaters.
Based on data available and observations made, wastewater originating from ice cream
shops and smoothie shops was estimated to have the highest potential separation due to the higher
fat content of the samples, acidity of fruit flavors, colloidal particles found in neutral to alkaline
flavors, such as chocolate, and addition of protein powders. In these cases, installation of GADs was
expected to facilitate separation of dairy fats and proteins and positively affect the quality of
wastewater discharged. On the other hand, the low dilution rate of dairy to water found typically in
specialty coffee shop wastewater, results in a relatively low fat content in the sample, and a higher

58
pH range. Thus separation was speculated to occur only well beyond the FSE unless biological
activity of dairy constituents was enhanced in the sewerage. In both cases, frequent monitoring
and sampling of grease interceptors, can provide a more thorough basis for judgment.
Field Studies
In the previous chapters, the effects of environmental factors, such as pH and temperature,
the mass fraction of fat available in wastewater samples, and the potential affinity of organic
substances with one another were discussed. While these analyses help understand the partitioning
tendencies of dairy wastewater, the study of GADs was an essential part, which will both expand the
data set of this problem, and help assess the feasibility of GAD s as a solution to preventing FOG
blockages. Prior to starting analyses of GADs it was interesting to use the principles discussed in the
previous chapter, to predict the behavior of dairy wastewaters and compare this conclusion with
conditions found in GADs treating wastewater originating from small dairy shops.
Predicting Wastewater Behavior
Despite the many variations of practices in FSEs and the uncertain chemical composition of
dairy wastewater, certain guidelines can help assess the risk of separation of dairy constituents in
the sewer system. Based on the principles discussed, it is seen that substances with high fat content,
such as creams and ice creams, partition to a greater extent compared to dairy products of lower
fat. Separation studies performed in the laboratory showed a separation of 20% (Curd v/Bulk v) in
the un-centrifuged 1:10 ice cream: (detergent water) dilution, while whole milk and even half and
half resulted in only 10-12%. Ice creams are made by rapid cooling accompanied by simultaneous
stirring of air into the sample. Therefore, crystallization of fats and proteins in ice creams, as well as
many other dairy desserts such as frappés, sorbets, and frozen yogurts, occurs, which makes the
association of fats and proteins with one another, and hence their likelihood to partition into a
separate phase even stronger. Moreover, the introduction of air in the sample reduces the density

59
of the dairy mixture, and simultaneously results in the stronger presence of hydrophobes, further
enhancing separation. Finally, most ice creams contain stabilizers to avoid shrinkage, and improve
dairy emulsions. Sorbets are expected to more easily separate because of the addition of egg whites
(Marshall et al., 2003).
While the crystalline structures found in frozen desserts cause a stronger affinity of fats and
proteins with one another, and ultimately are expected to increase the partitioning tendencies of
dairy products, different flavor additives are also incorporated within the emulsion. Table 3.5
provides pH ranges for many such additives, and as can be seen, most fruit flavors, such as all
berries and citrus fruits are acidic, which lower the pH of these products. In fact, addition of tap
water to raspberry ice cream, obtained from
University of Maryland Dairy Shop (pH = 4.8),
as indicated in the second report of this
study, resulted in instantaneous separation of
syrup and dairy products, while adding water
to neutral ice creams caused a floating foam-
like film to appear, which is likely to contain
hydrophobic dairy particles and is expected
to associate with other molecules with low
polarity, such as fats, oil, and grease in bulk
wastewater. It is concluded that ice cream
like mixtures have a high potential for
partitioning in wastewater prior to reaching
treatment facilities. Further studies and
monitoring of GADs are essential and were
carried out to better understand of behavior
Table 3.5. Approximate pH Range for Many Fruits Used for Flavoring Dairy Desserts and Beverages;
(energytoolbox.com)
Product Approximate pH
Apples 3.3 – 3.9
Apricots 3.3-4.8
Apricots, nectar 3.8
Mango 4.6 – 5.5
Nectarines 3.9 – 4.2
Peaches 3.4 – 4.1
Pears 3.6 – 4.0
Plums 2.8 – 3.0
Blackberries 3.2 – 4.5
Blueberries 3.1 – 3.4
Cherries 3.2 – 4.5
Raspberries 3.2 – 3.6
Rhubarb 3.1 – 3.2
Strawberries 3.0 – 3.9
Grapes 6.0 – 6.7
Coconut 5.5 – 7.8
Coconut milk 6.1 – 7.0
Grapefruit 3.0 – 3.7
Lemons 2.2 – 2.4
Limes 1.8 – 2.0
Oranges 3.0 – 4.0
Lemon juice 5.8 – 6.0 Melons 6.0 – 6.7
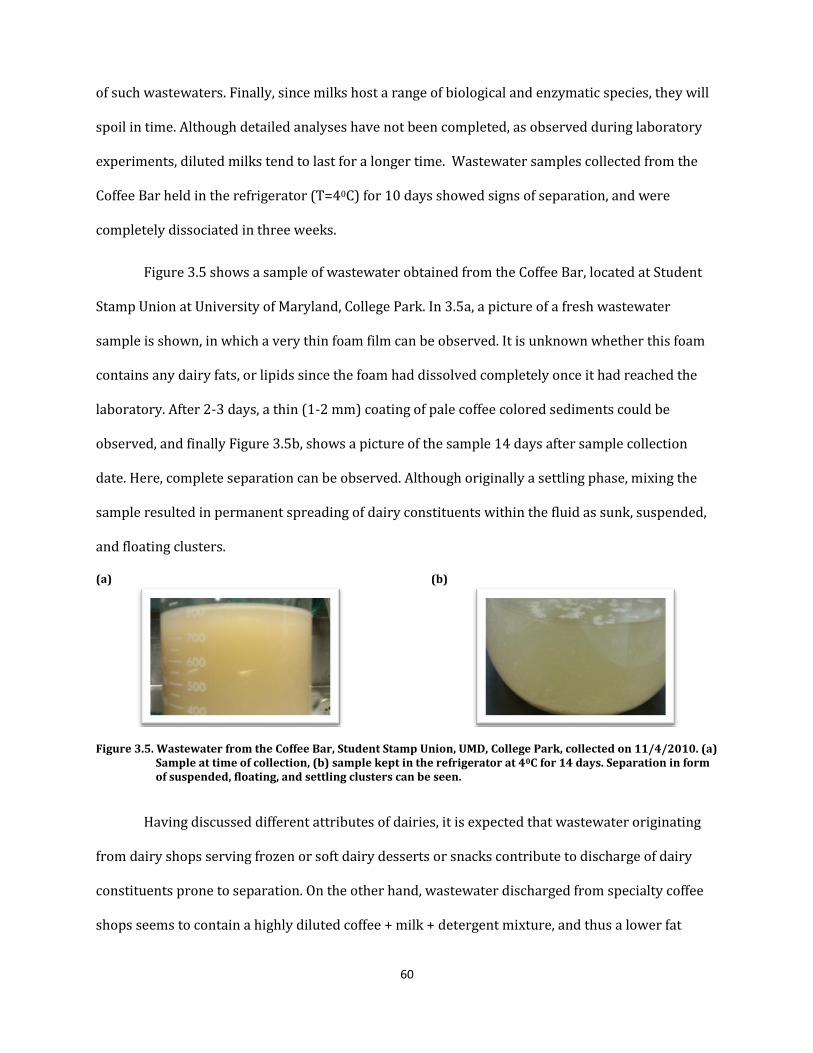
60
of such wastewaters. Finally, since milks host a range of biological and enzymatic species, they will
spoil in time. Although detailed analyses have not been completed, as observed during laboratory
experiments, diluted milks tend to last for a longer time. Wastewater samples collected from the
Coffee Bar held in the refrigerator (T=40C) for 10 days showed signs of separation, and were
completely dissociated in three weeks.
Figure 3.5 shows a sample of wastewater obtained from the Coffee Bar, located at Student
Stamp Union at University of Maryland, College Park. In 3.5a, a picture of a fresh wastewater
sample is shown, in which a very thin foam film can be observed. It is unknown whether this foam
contains any dairy fats, or lipids since the foam had dissolved completely once it had reached the
laboratory. After 2-3 days, a thin (1-2 mm) coating of pale coffee colored sediments could be
observed, and finally Figure 3.5b, shows a picture of the sample 14 days after sample collection
date. Here, complete separation can be observed. Although originally a settling phase, mixing the
sample resulted in permanent spreading of dairy constituents within the fluid as sunk, suspended,
and floating clusters.
(a)
(b)
Figure 3.5. Wastewater from the Coffee Bar, Student Stamp Union, UMD, College Park, collected on 11/4/2010. (a)
Sample at time of collection, (b) sample kept in the refrigerator at 40C for 14 days. Separation in form of suspended, floating, and settling clusters can be seen.
Having discussed different attributes of dairies, it is expected that wastewater originating
from dairy shops serving frozen or soft dairy desserts or snacks contribute to discharge of dairy
constituents prone to separation. On the other hand, wastewater discharged from specialty coffee
shops seems to contain a highly diluted coffee + milk + detergent mixture, and thus a lower fat

61
content. Nevertheless, as seen, such wastewaters do lead to separation upon spoiling of milks.
Another factor that should be considered is the presence of microorganisms in the sewer system,
which may enhance separation as a result of spoiling of dairies. Visits to interceptors treating such
wastewater help better assess the potential risk specialty coffee shops pose to sewer blockages.
Grease Abatement Devices
To evaluate the partitioning tendency of wastewater originating from small dairy shops,
GADs treating wastewater of a specialty coffee shop and an ice creamery were chosen for testing.
The details of each visit are presented in Table 3.6.
Table 3.6. Sampling Dates of Grease Interceptors
Date and Time Tair (0C) Visited Interceptors
Monday 12/20/2010 2-3 PM -3 Ice Creamery
Thursday 1/6/2011 10-12 PM 4 Ice Creamery and Specialty Coffee Shop
Friday 1/14/2011 10-12 PM 0 Ice Creamery and Specialty Coffee Shop
Thursday 1/20/2011 10-12 PM 6 Ice Creamery and Specialty Coffee Shop
The two initial visits to the ice cream shop interceptor took place 6 months after the last
cleaning date of June 2010. Nonetheless, this interceptor was purged again on Monday 1/9/11, and
the consecutive visits represent conditions found in a newly cleansed GAD. Three visits were
conducted to a specialty coffee shop interceptor. This interceptor appeared to be well maintained.
The 2 interceptors were equivalent in volume (1600 gal) and the general design of GADs of this
volume is illustrated in Figure 3.6. Figure 3.6a demonstrates the overall design of the interceptor,
while in b, the location of man holes for each interceptor chamber is focused.

62
(a)
(b)
Sampling of Grease Interceptors
To measure the extent of separation in each interceptor, a long sampling column (d=5.5 cm,
L> 2m) (Figure 3.7) was used, and using a ruler/meter the height of different phases found within
the column was then measured. Once the column was inserted in the GAD compartment, a cable
connecting the bottom to its cover was pulled and then secured. This covers the bottom of the tube,
and the device was then removed from the chamber for measurements of floating phases. Since
flow affects the distribution of sediment and/or floating phase/s, height measurements of each
fraction were made using a ruler, which was repeated for 3 points within each chamber to
represent the spreading of the separated material. The average measurements were reported as the
Figure 3.6. (a) General Design of a 1600 gal
Grease Interceptor, WSSC Grease and
Sand/Oil Interceptor Detail 1998, (b)
Design of Manholes for Grease and
Oil/Sand Interceptor, Inlet (left) to Outlet
(right), WSSC Grease Interceptor Design,
‘98

63
extent of separation for each phase. For further testing, each draw
was discharged by releasing the cable and collecting the sample into
a separate container. Representative samples were brought to the
laboratory. To maximize consistency in analysis, the sampling
positions of all compartments closely matched. The total height of
wastewater in the column rose from 100 – 110 cm. Once on-site
measurements were completed, the samples were brought to the
laboratory for further testing, including pH determination, height
measurements of bulk, and segregated phases to determine the
degree of separation in the collected samples. Finally, the Gerber Fat
analysis was carried out to determine the dairy fat content of each
segment.
Ice Creamery Grease Interceptor
The grease interceptor treating wastewater from an ice
cream shop was visited 4 times. Although restaurants are
encouraged to clean their interceptor every 2 months or as needed,
due to restaurant renovations and frequent shut down dates, June 2010 appeared to be the last
purge date in December 2010. A dye test was performed to determine the inlet of drain to the
interceptor, which appeared in the inlet approximately 40 minutes from discharge in the drain. The
interceptor has a volume capacity of 1600 gallons, and appeared to be in almost static conditions.
The total water consumption of this facility was provided from WSSC, and the calculated residence
times appear in Table 3.7, which assumes water usage for purposes other than cleaning/preparing
goods in this restaurant was negligible.
(a)
(b)
Figure 3.7. Sampling with
Column of 2nd(a) and 3rd(b) Chambers of ice creamery GAD – 1/6/11

64
Table 3.7. Water Consumption of an Ice Creamery - WSSC
Start Date End Date Δt [d] Vwater consumption[gal] Q [gal/d] tR=1600/Q [d]
12/9/2009 3/10/2010 91 71,000 780.22 2.05
3/10/2010 6/10/2010 92 78,000 847.83 1.89
6/10/2010 9/10/2010 92 78,000 847.83 1.89
9/10/2010 12/10/2010 91 40,000 439.56 3.64
Referring to Table 3.7, it can be seen that the residence time for the first 3 intervals fall
within close range of one another, averaged to be 1.94 days = 46.8 hours. The tR calculated for the
last interval, however, is larger, partly due to numerous shut down days. It should be noted that the
residence time calculated in this table corresponds to the average time wastewater spent within
interceptor walls prior to discharge to sewer, and it is likely that this number would vary for
holidays, and different times in the day and week. This becomes particularly important for the last
interval, where closing of the restaurants most likely resulted in almost idle conditions and longer
than normal retention times, consequently enhancing separation, by providing enough time for
particles to separate, and allowing the sample to remain in the interceptor, which is likely to host
large various microorganisms, reducing the normal time span for spoiling of milk products.
Figure 3.8a – c pictures the three compartments 6 months from the last purge4, while Fig 3.8
d-e displays findings on 1/14/11, 4 days after the most recent cleanup. As can be seen from Figure
3.7a-c, no significant difference can be observed in the quality of wastewater among the different
chambers, and significant separation, specifically in form of a floating phase was observed although
a settling layer, most likely consisting of food solids, could be seen in the inlet and intermediate
chambers. The floating layer in each compartment consisted of large dark and cream colored
clusters spread throughout the interface, containing small foam-like white spots. From
measurements made on-site, the column inserted in the inlet showed equal sediment and floating
layers of 3±0.3% (3 cm/100 cm) for 12/20, and a settling and floating layer of 1.33±2.31% (1.33
4 Because of renovations, this FSE was shut down for a long period of time during the six months. The current
WSSC regulations requires a minimum of quarterly pump downs.

65
cm/100 cm) and 4.17 ±1.26% (4.17cm/100cm), respectively for 1/6. The remaining solution held a
considerable amount of suspended crystalline-like cream colored clusters, which were moving in
the upward direction while dark clusters suspended in the solution were likely to settle.
Figure 3.8. Inlet (a) and(d), Middle (b) and (e), and Outlet (c) and (f) Chamber of Ice Cream Shop’s GAD sampled
on 12/19/10 [30C], and 1/14/11 [00C] respectively.
Wastewater from the middle compartment also appeared to be very similar, except that no
settled phase could first be observed. Nonetheless, dark aggregates sank in the column once they
were disturbed by insertion of the sampling tube, and sank to the bottom of the column within a
few minutes. During on-site analyses, the depths of the floating and settling phases were measured
to be equal on 12/20 and for 1/6, a floating phase of 6.17±1.26% (6.17/100) was measured while
no settling phase could be observed for the intermediate chamber on this date. Finally, the outlet
appeared to be the most puzzling. Unlike the other compartments, the measured floating heights
varied considerably, particularly for the initial visit of 12/19 (56cm/100cm, 10cm/100cm, and
5cm/100cm). The on-site and laboratory measurements appear in Tables 3.8 and 3.9, and are
clearly demonstrated in Figure 3.9.

66
Table 3.8. Extent of Separation in the Ice Cream Shop’s GAD - On Site Measurements
Date Compartment HFloating Layer/Hww HSettling Layer/Hww HSuspended Layer/Hww
Monday Inlet Comp. 3.00% ± 0.30% 3.00% ± 0.30% 94.00% ± 0.30%
12/20/2010 Middle Comp. 5.90% ± 0.50% 0.00% ± 0.00% 94.06% ± 0.50%
2:00 PM Outlet Comp. 23.20% ± 28.10% 0.00% ± 0.00% 76.80% ± 28.10%
Thursday Inlet Comp. 4.17% ± 2.57% 1.33% ± 2.31% 94.50% ± 1.80%
1/6/2011 Middle Comp. 6.17% ± 1.26% 0.00% ± 0.00% 93.83% ± 1.26%
1:00 PM Outlet Comp. 11.00% ± 6.56% 0.00% ± 0.00% 89.00% ± 0.00%
Friday Inlet 0.00% ± 0.00% 0.00% ± 0.00% 100.00% ± 0.00%
1/14/2011 Mid Comp. 0.00% ± 0.00% 0.12% ± 0.10% 99.88% ± 0.10%
1:00 PM Outlet 0.00% ± 0.18% 0.00% ± 0.00% 99.82% ± 0.00%
Thursday Inlet 0.00% ± 0.00% 0.00% ± 0.00% 100.00% ± 0.00%
1/20/2011 Mid Comp. 0.00% ± 0.00% 0.00% ± 0.00% 100.00% ± 0.10%
1:00 PM Outlet 0.00% ± 0.00% 0.00% ± 0.00% 100.00% ± 0.00%
Table 3.9. Extent of Separation in the Ice Cream Shop’s GAD – Laboratory Measurements
Date Compartment pH HFloating Layer/Hww HSettling Layer/Hww HSuspended Layer/Hww
Monday Inlet Comp. 4.97 9.60% ± 0.60% 12.80% ± 1.90% 77.60% ± 2.00%
12/20/2010 Middle Comp. 4.64 0.00% ± 0.00% 13.00% ± 0.50% 87.00% ± 0.50%
5:00 PM Outlet Comp. 4.39 0.00% ± 0.00% 40.00% ± 0.00% 60.00% ± 0.00%
Thursday Inlet Comp. 4.81 1.40% ± 0.00% 13.80% ± 0.00% 84.80% ± 0.00%
1/6/2011 Middle Comp. 4.5 0.06% ± 0.00% 11.60% ± 0.00% 88.30% ± 0.00%
4:00 PM Outlet Comp. 4.53 0.12% ± 0.00% 17.40% ± 0.00% 82.50% ± 0.00%
Friday Inlet 4.64 0.00% ± 0.00% 0.00% ± 0.00% 100.00% ± 0.00%
1/14/2011 Mid Comp. 4.52 0.00% ± 0.00% 0.10% ± 0.00% 100.00% ± 0.00%
4:00 PM Outlet 4.89 0.00% ± 0.00% 0.15% ± 0.00% 100.00% ± 0.00%
Thursday Inlet 5.03 0.00% ± 0.00% 0.00% ± 0.00% 100.00% ± 0.00%
1/20/2011 Mid Comp. 4.52 0.00% ± 0.00% 0.00% ± 0.00% 100.00% ± 0.00%
4:00 PM Outlet 4.55 0.00% ± 0.00% 0.00% ± 0.00% 100.00% ± 0.00%
The suspended layer defined in this study refers to the fluid part of the samples within
which suspended particles could be found. While partitioning was clearly observed in the two visits
of 12/19 and 1/6, no measurable fractionalization, particularly for the first two tanks, could be
witnessed on 1/14 and 1/20/2011, which took place after the latest cleaning 1/10. The last
compartment showed more signs of separation as foam and discontinuous aggregates coated the
interface. The pH levels of all the samples, however, fell close to the ZPC pH, reported in Table 3.9
[4.52 – 5.03], which as tested in laboratory experiments causes dissolution of caseinate.

67
(a)
(c)
(b)
(d)
(e)
(f)
Figure 3.9. Degree of Separation in the ice cream shop’s GAD,–Purge Date 06/2010 (a-d), and 01/10/2011 (e and
f)
0%
10%
20%
30%
40%
50%
60%
70%
80%
90%
100%
Inlet Comp. Middle Comp. Outlet Comp.
Hi /
HW
ast
ewa
ter
Ice Creamery Interceptor Site Measurements - 1/6/11
Floating Phase Suspend. Phase Settling Phase
0%
10%
20%
30%
40%
50%
60%
70%
80%
90%
100%
Inlet Comp. Middle Comp. Outlet Comp.
Hi /
HW
ast
ewa
ter
Laboratory Measurements of GAD Samples - 12/19/10
Floating Phase Suspend. Phase Settling Phase
0%
10%
20%
30%
40%
50%
60%
70%
80%
90%
100%
Inlet Comp.Middle Comp.Outlet Comp.
Hi /
HW
ast
ewa
ter
Laboratory Measurements of GAD Samples - 1/6/11
Floating Phase Suspend. Phase Settling Phase
0%
10%
20%
30%
40%
50%
60%
70%
80%
90%
100%
Inlet Comp. Middle Comp. Outlet Comp.
Hi /
HW
ast
ewa
ter
Ice Creamery Interceptor Site Measurements 1/14&20/11
Floating Phase Suspend Soln Settling Layer
0%
10%
20%
30%
40%
50%
60%
70%
80%
90%
100%
Inlet Comp. Middle Comp. Outlet Comp.
Hi /
HW
ast
ewa
ter
Laboratory Measurements of GAD Samples - 1/14&20/11
Floating Phase Suspend. Phase Settling Phase
0%
10%
20%
30%
40%
50%
60%
70%
80%
90%
100%
Inlet Comp. Middle Comp. Outlet Comp.
Hi /
HW
ast
ewa
ter
Ice Creamery Interceptor Site Measurements - 12/20/10
Floating Phase Suspended Soln

68
It appeared that disturbing the partitioned dairy wastewater with the column resulted in
the sinking of a portion of the floating layer. This phenomenon was demonstrated in laboratory
measurements of wastewater samples, reported in Table 3.9. As can be seen, a greater settling
phase was observed as a 9.6% and 12.8% floating and settling segments were measured in the
laboratory for the inlet compartment on 12/20, which when compared with on-site measurements
of 3% partitioning in the settling and floating phases demonstrate the change in spreading of
clusters within the sample. Similar results were observed for the middle compartments on 1/6
(1.33% sediment vs. 13.8%, and floating phase variation between 4.17% vs. 1.4% for on-site and
laboratory measurements, respectively). These observations are particularly evident in case of the
outlet sample of 12/20, where a 40% settling phase was measured in the lab, whereas only a 23%
floating segment was observed during on-site measurements.
As demonstrated in Figure 3.9, the first compartment consists of both a floating and a
settling phase, while on-site measurements of middle and outlet compartments comprised of only
floating and suspended portions. The extent of separation as seen during on site measurements
increased from inlet to outlet compartments, with the outlet holding a maximum floating phase for
measurements. Looking at the temporal variation of the interceptor wastewater, it can be seen,
from Table 3.8 and Figure 3.9a and c that the outlet floating phase of 1/6/11 was approximately
half of that of 12/20/10, which indicates the potential discharge of separated phases to the sewer.
In fact, the degree of separation of the sewer outlet5 was measured to be 50% on 1/6/2011. Overall,
the fractionalization of sample obtained on 12/19 was smaller than that of 1/6/2011. More
measurements are needed for a more realistic conclusion.
5 This measurement refers to the outlet box of the outlet chamber of this interceptor, and since it was separated
from the rest of the outlet compartment, this measurement was not included in the extent of separation in the outlet chamber.

69
Furthermore, once the samples are in static condition, it was expected that the suspended
particles will join the floating/settling phases, and in fact laboratory measurements agree with this
assumption as greater partitioning were measured in the lab as discussed in the previous
paragraph. It should also be noted that the suspended fluid phase of the wastewater appears to be
relatively clear during laboratory measurements, when compared to on-site samples. It is believed
that interfacial tension could be playing a role in determining the extent of settling and floating
phases. For example, the cross sectional area and depth of a container will affect whether the
separated particles will float, sink, or remain suspended in the mixture. Since the containers do not
hold the geometry of the sampling containers and the GAD interceptors varies to some extent,
which can account for the differences in separation tendencies of the wastewater samples.
Temporal Variation in the Ice Creamery Grease Interceptor
While separation tendencies of interceptor samples were easily quantified on 12/19 and
1/6, no measurable partitioning could be observed for the last two visits of 1/14 and 1/20. It is
possible that because of the recent clean up, the extent of
accumulation of dairy components was not enough to cover the
entire interface, or form a considerable floating/settling phase. In
fact, since the interceptor is enclosed, access could only be granted
through the manholes, through which only an obstructed view of
the interceptor compartments was obtained. A closer look,
however, illustrated in Figure 3.10, signaled the presence of more
dense clusters towards the sides of the manhole. While it was not
known whether such aggregates are newly formed, because of the
dark color of the sample it was speculated that they correspond to
the material retained in the tank from the last cleanup.
Figure 3.10. Ice Cream Shop’s GAD, 2nd Chamber, showing greater accumulation towards interceptor walls – 1/14/11

70
Nonetheless, it is possible that the separated constituents show adhesive tendencies towards the
tank walls and sides of the interceptor chamber, not accessible through the entry.
The frequency of cleaning is of significant importance in maintaining the efficiency of
treatment. Increasing the retention time will maximize partitioning, and although this FSE was not
operating for the entire duration of the last 3 months, wastewater was retained in the GAD for a
longer period, potentially resulting in enhanced separation. Finally, although consistency in
sampling was attempted, it should be noted that the manhole provides the only access to each
chamber, and hence, collected samples do not necessarily represent the conditions found
throughout each chamber, and it is possible that distribution of separated material varies for
different areas of each compartment. As illustrated earlier in Figure 3.6, the manhole only covers a
portion of each chamber’s area, and limits our ability to gain a full perspective of distribution and
extent of partitioning. In fact, the manhole of inlet and outlet compartments focuses on the influent
and effluent section of the two chambers respectively, while covering the central part of the middle
compartment. An angled picture of the 2nd chamber of this interceptor was taken on 1/14 (Figure
3.10), which showed greater accumulation of the separated phase towards the interceptor walls.
Unfortunately, access to the walls was not possible, and the degree of potential adhesion of
separated phases to the edges could not be determined.
Several attempts were made to quantify the fat content of the samples obtained on 12/20
and 1/6, but unfortunately the mass fraction of fat in these samples could not be determined as the
fat portion could not be observed in the butyrometer. Although the tests were done rapidly to avoid
any loss of heat, most of the floating phase became extremely dense and almost solidified in the
centrifuge. Furthermore, it was believed that the fat content of sample, although diluted, was
greater than the detection limit of the butyrometer. Moreover, the sample contained large
quantities of fiber-like consistency, which would not be digested by the acid. In fact, although
concentrated sulfuric acid was used as prescribed by the Standard Methods for Testing Dairy

71
Product, the acid was not strong enough to digest the emulsion of the settling phases. The last two
samples obtained on 1/14 and 1/20, were measured to hold no fat. This could be taking place
because as discussed with the manager, the sale of ice cream and dairies was negligible during this
season.
Specialty Coffee Shop Grease Interceptor
The interceptor of a specialty coffee shop was chosen for the second investigation of this
study. The interceptor is identical to the previous GAD, and sampling of each chamber was carried
out as previously described. A film of milky colored aggregates could be observed on the interface
of the inlet and middle compartments, whereas the outlet chamber showed significantly smaller
partitioning. Figure 3.11 shows the 3 compartments of this interceptor.
(a)
(b) (c)
Figure 3.11. Inlet (a), Middle (b), and Outlet (c) Chambers of Specialty Coffee Shop. GAD, 1/14/2011
As can be seen in Figure 3.11, a milky colored floating phase covered the inlet and
intermediate compartments, and little separation could be observed for the initial visits of 1/6 and
1/14/2011. In contrast to the ice cream shop interceptor, partitioning of dairy constituents
appeared to diminish from the inlet to outlet chambers. Looking at Figure 3.11 a and b, it could be
seen that the separated phases are denser towards the interceptor walls. To better demonstrate
this, Figure 3.12 provides an angled photo of the 2nd compartment of this GAD. Comparing Figure
3.10 b and 3.11, the floating phase was more substantial close to the corners of the chamber.
The on-site measurements of this interceptor indicated a more settling-dominated
separation than the ice cream shop’s interceptor. Figure 3.13, and Tables 3.10 and 3.11 summarize
the degree of separation in different compartments.

72
Table 3.10. Extent of Separation in the Specialty Coffee Shop GAD – On-Site Measurements
Date Compartment HFloating Layer/Hww HSettling Layer/Hww HSuspended Layer/Hww
Thursday Inlet Comp. 4.67% ± 2.89% 16.33% ± 5.51% 79.00% ± 7.21%
1/6/2011 Middle Comp. 3.33% ± 1.53% 13.00% ± 11.27% 83.67% ± 11.72%
11:00 AM Outlet Comp. 0.33% ± 0.00% 0.00% ± 0.00% 99.67% ± 0.00%
Friday Inlet 10.61% ± 1.89% 23.33% ± 3.67% 99.88% ± 0.00%
1/14/2011 Mid Comp. 6.97% ± 1.39% 14.24% ± 3.67% 99.88% ± 0.10%
11:00 AM Outlet 0.21% ± 0.00% 0.00% ± 0.00% 99.82% ± 0.00%
Thursday Inlet 10.45% ± 5.53% 17.73% ± 1.20% 71.82% ± 6.44%
1/20/2011 Mid Comp. 7.88% ± 0.26% 11.88% ± 1.62% 80.24% ± 1.43%
11:00 AM Outlet 0.91% ± 0.79% 2.58% ± 2.74% 96.52% ± 0.00%
Table 3.11. Extent of Separation in the Specialty Coffee Shop GAD – Laboratory Measurements
Date Compartment pH HFloating Layer/Hww HSettling Layer/Hww HSuspended Layer/Hww
Thursday Inlet Comp. 4.27 4.79% ± 0.00% 23.35% ± 0.00% 71.86% ± 0.00%
1/6/2011 Middle Comp. 4.36 1.22% ± 0.00% 36.59% ± 0.00% 62.20% ± 0.00%
4:30 PM Outlet Comp. 4.42 0.62% ± 0.00% 9.26% ± 0.00% 90.12% ± 0.00%
Friday Inlet 4.2 9.46% ± 0.00% 58.38% ± 0.00% 32.16% ± 0.00%
1/14/2011 Mid Comp. 4.6 5.26% ± 0.00% 44.74% ± 0.00% 50.00% ± 0.00%
4:30 PM Outlet 4.5 0.53% ± 0.00% 8.95% ± 0.00% 90.53% ± 0.00%
Thursday Inlet 4.2 19.51% ± 0.00% 58.38% ± 0.00% 32.16% ± 0.00%
1/20/2011 Mid Comp. 4.4 2.50% ± 0.00% 44.74% ± 0.00% 50.00% ± 0.00%
4:30 PM Outlet 4.2 0.45% ± 0.00% 8.95% ± 0.00% 90.53% ± 0.00%

73
(a)
(c)
(e)
(b)
(d)
(f)
Figure 3.13. The Extent of Separation in Specialty Coffee Shop Grease Interceptor, Sampled and Measured on Site
and in Laboratory – Measurements made the same day as collection at approximately 4:30 PM
0%
10%
20%
30%
40%
50%
60%
70%
80%
90%
100%
Inlet Comp. Middle Comp. Outlet Comp.
Hi /
HW
ast
ewa
ter
Specialty Coffee Shop GAD Site Measurements - 1/6/11
Floating Phase Suspend. Phase Settling Phase
0%
20%
40%
60%
80%
100%
Inlet Comp. Middle Comp. Outlet Comp.
Hi /
HW
ast
ewa
ter
Specialty Coffee Shop Site Measurements- 1/14/2011
Floating Phase Suspend. Phase Settling Phase
0%
10%
20%
30%
40%
50%
60%
70%
80%
90%
100%
Inlet Comp. Middle Comp. Outlet Comp.
Hi /
HW
ast
ewa
ter
Specialty Coffee Shop Site Measurements - 1/20/2011
Floating Phase Suspend. Phase Settling Phase
0%
10%
20%
30%
40%
50%
60%
70%
80%
90%
100%
Inlet Comp. Middle Comp. Outlet Comp.
Hi /
HW
ast
ewa
ter
Laboratory Measurements of Starbucks GAD Samples - 1/6/11
Floating Phase Suspend. Phase Settling Phase
0%
10%
20%
30%
40%
50%
60%
70%
80%
90%
100%
Inlet Comp. Middle Comp. Outlet Comp.
Hi /
HW
ast
ewa
ter
Laboratory Measurements of Starbucks GAD - 1/14/2011
Floating Phase Suspend. Phase Settling Phase
0%
10%
20%
30%
40%
50%
60%
70%
80%
90%
100%
Inlet Comp. Middle Comp. Outlet Comp.
Hi /
HW
ast
ewa
ter
Laboratory Measurements, Starbucks 1/20/2011
Floating Phase Suspend. Phase Settling Phase

74
The quality of wastewater based on
measurements and visual inspection, as
demonstrated in Figures 3.11 and 3.13,
improved significantly moving from inlet to
outlet compartments. The outlet
compartment showed to hold the smallest
separation tendencies, as demonstrated in
Figures 3.13 and 3.14 in which quality of
water from the initial visit of 1/6 (a) to the
3rd visit of 1/20 (b) can be seen. From Table
3.11, it can be seen that the pH range fell
close to ZPC [4.2-4.6], but was nonetheless
lower than the pH of the ice creamery
wastewater [4.4 - 5.0]. Furthermore, the
phases were slimy while wastewater
obtained from the ice cream shop wastewater
appeared to hold dense clusters. Considerable
separation was observed in this GAD. The measurements indicated a larger settling phase, which
was expected considering the lower fat content and air entrapment. Moreover, ice creams are
prepared by cooling the dairy while incorporating air bubbles in the sample. Therefore, as observed
in the previous pH studies, the major form of separation was anticipated to be the sinking of
clusters in the solution. Overall, based on observations made studying the two interceptors, it is
concluded that installation of GADs will improve the quality of wastewater.
Looking at Tables 3.10 and 3.11, and Figures 3.13 and 14, the separated fractions increased
with time, and a higher fractioning of the samples, particularly for the settling phases, were
(a)
(b)
Figure 3.14. Specialty Coffee Shop Interceptor Samples Collected from Inlet (right), Middle (Center), and Outlet Compartments (Left) on 1/6 (a), and on 1/20 (b) Inlet (Left), Intermediate (Center), and Outlet (right)

75
observed during laboratory measurements. As shown in Figure 3.13 a-e, there was a greater
accumulation of floating and settling phases for the first two weeks of study, which was more
dramatic in samples taken from the inlet compartments. Although the extent of separation of
floating phases did not differ substantially from 1/14 to 1/20, the sample appeared to become
more dense and compact. This could be the result of temperature and also higher concentrations
and passing of time on separated fats and proteins. To more thoroughly investigate the efficiency of
interceptors and the extent of separation which occurs within these devices, weekly monitoring and
sampling of this location as well as an appropriate ice cream shop would be beneficial to this study.
Finally, the degree of separation in the GAD also depends on the retention time. The water
consumption of this FSE could not be obtained in time for this study, and hence no tR could be
calculated for this specialty coffee shop.
Fractioning of Dairy Fats in the Specialty Coffee Shop Grease Interceptor
Since fats tend to contribute heavily to sewer blockages, it was important to determine how
fat is fractioned in GADs treating wastewater originating from small dairy shops. The Gerber fat
method was used to determine the fat content of the different phases for each compartment. Tables
3.12-13 and Figure 3.15 summarize these findings.
Table 3.12. Percentage of Fat Trapped in Each Phase of the Specialty Coffee Shop GAD Interceptor
Sample Date Chamber
Measured Floating Fat % (1:11 Dilution) % Xfat, Floating Phase
Measured % XFat, Suspended Phase
Measured % XFat, Settled Phase
1/6/2011
Inlet 14.25% 156.75 0.10% 4.30%
Intermediate NA NA 0.05% 1.60%
Outlet NA NA 0.10% 0.35%
1/14/2011
Inlet 16.70% 183.70 0.10% 5.49%
Intermediate 9.00% 99.00 0.05% 3.00%
Outlet NA NA 0.10% 0.49%
1/20/2011
Inlet 15% 165.00 0.15% 8.25%
Intermediate NA NA 0.05% 4.00%
Outlet NA NA 0.10% 0.70%

76
Table 3.13. Determination of Fat Content of Partitioned Phases in the Specialty Coffee Shop GAD, Laurel, MD
Sample Date
Chamber Mfloating
(g) Mfat in Floating
Phase (g) Msuspended Phase
(g) Mfat in Suspended
Phase (g) MSediment
(g) Mfat in Sediment
(g)
1/6/11
Inlet 34.44 53.98 596.22 2.98 296.33 12.74
Intermediate 0.00 0.00 650.83 0.33 289.17 4.63
Outlet 0.00 0.00 826.47 0.00 73.53 0.26
1/14/11
Inlet 76.76 141.00 896.76 0.90 758.94 41.74
Intermediate 10.65 10.54 1396.64 0.70 1139.02 34.17
Outlet 0.00 0.00 1891.02 1.89 120.60 0.60
1/20/11
Inlet 94.15 155.35 547.58 0.82 256.51 21.16
Intermediate 0.00 0.00 748.43 0.37 219.54 8.78
Outlet 0.00 0.00 807.04 0.81 112.93 0.79 (a)
(b)
(c)
Figure 3.15. Fractioning of Fat in Partitioned Phases
of Specialty coffee shop GAD Interceptor. The floating phase was speculated to consist primarily of fats. The accumulation of sediment and floating phase can be observed from 1/6 to 1/20/11.
0%
10%
20%
30%
40%
50%
60%
70%
80%
90%
100%
Inlet Mid Outlet
Mas
s Fr
acti
on
*1
00
Chamber
Fat & Partitioned Phases - Specialty Coffee Shop GAD 1/6/11
Floating Phase Fat in Suspend. Phase
SUSPENDED PHASE Fat in Settling Phase
Settling Phase
0%
10%
20%
30%
40%
50%
60%
70%
80%
90%
100%
Inlet Mid Outlet
Mas
s Fr
acti
on
*1
00
Chamber
Fat & Partitioned Phases - Specialty Coffee Shop GAD 1/14/11
Floating Phase Fat in Suspend. PhaseSUSPENDED PHASE Fat in Settled PhaseSettling Phase
0%
10%
20%
30%
40%
50%
60%
70%
80%
90%
100%
Inlet Mid Outlet
Mas
s Fr
acti
on
*1
00
Chamber
Fat & Partitioned Phases - Specialty Coffee Shop GAD 1/20/11
Floating Phase Fat in Suspend. Phase
SUSPENDED PHASE Fat in Settling Phase
Settling Phase

77
Figure 3.15 shows the mass fraction of all the present phases in
each compartment of the specialty coffee shop grease interceptor. It
also indicates the mass fraction of fat available in each phase. It should
first be noted that the floating phase proved to be the most puzzling
materials during analyses, which can be inferred from Tables 3.12 and
13. 1:11 dilutions of floating compounds with distilled water were
made for testing, where the measurements for the floating phase of the
inlet compartments proved to be greater than 9.1% (1/11*100),
resulting in higher than 100% fat content. The measurements for the
diluted floating phase of intermediate compartment for 1/14, however, was measured to be 9.0%, and
the fat content of the pure floating phase was calculated to be 99.0%. It is possible that the presence
and mixing of other soluble fats and/or organic compounds with isoamyl alcohol resulted in higher
than normal readings. This phase, illustrated in Figure 3.15, appeared to be greasy and resembled fatty
material, and for practical purposes, was regarded as pure fat, and is demonstrated as such in Figure
3.15.
Similar to the synthetic wastewater analysis described in report 2, the suspended phase held
minimal fat, while the mass fraction of fat doubled from 0.35% to 0.7% from 1/6 to 1/20. In all
analyses, the first compartment possessed the highest portion of fat, with this fraction decreasing from
inlet to outlet compartments. Furthermore, accumulation of separated constituents and their fat
content also increased during the 3 week GAD sampling and laboratory study, and the separated
phases appeared to have formed denser aggregates by the 3rd week. The second week of sampling
produced the highest degree of separation (mass fraction), and based on measurements it also
comprised of the highest mass fraction of fat in the separated layers.
Figure 3.15. Floating Phase from the Specialty Coffee Shop Inlet GAD Chamber, 1/6/11

78
Conclusion
It is clear that separation of dairy products/wastewater occurs under acidic conditions. In the
case of wastewater originating from small dairy shops, proteins and fats are expected to have the
highest tendency for separation. In fact, at ZPC pH [4.66-4.8], only whey proteins are assumed to be
retained within the aqueous phase. Based on data available and observations made, wastewater
originating from ice cream shops and smoothie shops is estimated to have the highest potential
separation due to the higher fat content of the samples, acidity of fruit flavors, colloidal particles found
in neutral to alkaline flavors, such as chocolate. In these cases, installation of GADs is expected to
facilitate separation of dairy fats and proteins and positively affect the quality of wastewater
discharged.
This hypothesis was supported by the initial visits grease interceptors of the specialty coffee
shop and ice creamery interceptors, where significant separation in both could be observed. In the
case of specialty coffee shop, the interceptor was visited within 2 weeks from the last purge date, and
gradual accumulation of dairy constituents was observed in this study. The samples collected from the
ice cream shop, on the other hand, showed substantial fractioning during the first two visits when the
GAD was excessively full. Nonetheless, no measurable separation could be observed after the most
recent cleaning, which is most likely attributed to minimal sale of ice creams, and the lack of discharge
of dairy constituents in the drains. Moreover, although substantial separation, in form of food
solids/settling and floating (fatty) material was observed in the GAD chambers, it is not known
whether introduction of dairy wastewater to low pH systems and the abundance of biological
microorganisms in the interceptors cause separation to occur. This point becomes important because
in contrast to the GAD samples discharged from the specialty coffee shop, the fresh wastewater
samples collected from The Coffee Bar showed small signs of separation within the first week from the
collection, and curdling of the sample (i.e., full separation of dairy constituents) took place

79
approximately after 2-3 weeks, where separable floating and/or settling phases could be observed.. It
is possible that because of the elevated biological activity in sewer systems, the spoiling and
separation of milk occur at a much faster rate. Differentiating between fresh and sewer wastewater
samples could help obtain a more realistic perspective on this issue. In addition, further monitoring
and sampling of grease interceptors of different categories of dairy FSEs can provide a more thorough
basis for judgment. Sampling should take place over long periods of time to account for seasonal
differences affecting sales and temperature. Demand for dairy product varies with season, and higher
sales of frozen dairy products, such as ice creams, Frappuccinos, and frappes are expected to occur
during warmer months. Higher sales will ultimately affect the residence time of the grease traps,
which may influence the degree of separation in the GAD chambers. Additionally, Temperature plays a
significant role in partitioning of dairies. Higher temperatures can cause denaturing of proteins and
cause aggregation of fats, and up to 400C will spike the biological activity of microorganisms present in
wastewater and dairy. Furthermore, cooler temperatures can cause crystallization of proteins and fats
into condensed layers.

80
Chapter 4: Concluding Research and Field Studies:
While FOG blockages have been recognized as one of the major contributors to SSOs (epa.gov),
it was seen that in their attempt to address this challenge, many states’ definition of FOG may be
inconsistent with one another, and coffee and ice cream shops are not always included in their FOG
control programs. Several cities and states, including Florida, City of Milwaukee, Oregon, the town of
Louisburg, and city of Salisbury in North Carolina, have included such facilities in their FOG ordinance
programs, while others leave dairy serving FSEs to operate under loose conditions. Other
establishments, however, including dairy shops operate under relatively loose conditions. These
facilities tend to serve prepared foods and hot/cold beverages, and do not involve preparing/making
food. Most states tend not to require these places to install grease traps and consider their FOG input
negligible, if at all. Dairy products can contain high concentrations of fats and proteins, which may
separate in the sewerage. Therefore, a study of composition, structure, and properties of milk and
other dairy products and their possible contribution to FOG input is valid. Furthermore, the efficiency
of grease interceptors in treating wastewaters rich in dairy components needed to be addressed.
In order to investigate the potential contribution of dairy components to FOG blockages,
chemistry and physics of dairy systems were studied. Essentially milk consists of many colloidal
particles, such as fats globules and proteins that can separate. Milk proteins become insoluble at lower
pH values (i.e., 4.6). Although the pH of most wastewaters tends to be higher and fall in the neutral
range, it should be taken into account that coffee and almost all of the fruits used for flavoring many
dairy desserts/beverages acidify the system, and thus can make the conditions more favorable for
casein micelles to become insoluble in water. Another important aspect is heating milk for the
preparation of hot beverages. Heat coagulation of caseins occurs as well as damage to the fat globule
membrane, thus more rapid coalescence of fat globules may take place. This can be readily observed
during heating of milk. Furthermore, heating increases the acidity of milk, and coupled with pH

81
reduction from coffee, it is likely that caseins will become insoluble. Heating also causes denaturation
of whey proteins, and they will become entangled with the casein micelles. Moreover, whipping and
cooling dairy products, as seen in whipped cream and ice creams, also cause crystallization of fat
crystals and their stronger association with one another, making flocculation of fats more likely.
Having studied the physics and chemistry of dairy products and wastewater characteristics, it
was hypothesized that partitioning and separation of different phases, namely fat and proteins occurs
in wastewater originating from coffee shops and ice cream shops. It should also be mentioned that
proteins may start to settle at higher temperatures, making the adsorption of fat globules at the AW
interface more likely. Thus a combination of both substances will be present in the floating phase.
Another inevitable and noteworthy factor is spoiling of milks, which is accompanied by production of
many acids, such as acetic acid and lactic acid. Finally, the effects of different surfactive material used
for cleaning should also be considered as they will influence the surface tension and may delay the
separation process.
The literature review was followed by several characterization studies including dairy: water
and dairy: detergent: water dilutions under different pH and temperature systems. Wastewater
separation was clearly seen under different conditions. Separation took place in two forms of settling
and floating phases. Under acidic conditions, curdling of the dairy systems, dissolution of caseins and
separation of fats and proteins at ZPC pH took place. Whether the dissociated curd layer floats or
settles depends on the fat content of the mixture. The effects of temperature on milks were also
studied, and creaming (formation of a fat film at the air/water interface) was observed. Creaming,
however, was retarded by mixing, a practice commonly employed in coffee shops. Furthermore, it was
observed that for heated whole milk samples, at pH 5.2-5.5, fine particles formed, and a higher
resistance to curd separation was witnessed. Raising the temperature of the mixture to 500C increased
the dynamics of the system, and a more rapid settling/floating took place. The maximum separation
occurred as pH approached the zero point of charge (4.66) in all samples. Finally, introduction of

82
detergents and sterilizers slightly enhanced separation of dairy constituents at lower pH values [4-
5.3].
To quantify the FOG available in both real and synthetic wastewater samples, the Standard
Method for FOG analysis (5520B) was employed and found to be incompatible with dairy systems
since mixing of non-polar hexane with dairy constituents, exhibiting different degrees of molecular
polarity, created a viscous gelatin layer. The Gerber Fat Method, adopted from the Standard Methods
for the Examination of Dairy Products, was used for determination of fat content of samples. The fat
content of synthetic and fresh wastewater samples, collected from the University of Maryland’s
Coffee Bar, was successfully determined by this method although the fat content of the wastewater
samples were determined to be very low (averaged mass percentage at 0.02±0.004% and 0.03
±0.003% for 1st and 2nd shifts). Because of the small mass fraction of fat in the fresh wastewater
sample, method 5520B was revisited, and the mass percentage of separated FOG was found to be
0.42%, which does not compare with 0.02% mass fraction of fat obtained from the Gerber Fat
Method. Therefore, partitioning of other dairy components, other than fats, is taking place. Hence, it
is likely that when exposed and mixed with other organic media, some of the dairy components,
other than fats, could separate into another phase.
Once preliminary experiments were done and the extent of separation under acidic conditions
was understood on a volumetric basis, the fractionation of fat at ZPC pH was studied. It was found that
almost all the dairy fat will reside in the separated curd layer, with only a small fraction remaining in
the suspended solution/serum for samples of higher fat content, such as ice cream and whole milk
dilution (3.7% to 3.4% for ice cream and whole milk 1:10 dilutions). It was seen that in samples of low
fat milk (i.e., 2% and skim), all the fat resided in the curd, and the recovery amounted to greater than
100% (103.94% for skim milk and 100.05% for 2% milk water dilutions). This error may be attributed
to the low sensitivity and detection limit of Gerber Fat analysis, in which low concentration of dairy fat

83
in 1:10 dilution are not accurately measured. Concentrating the fat in a smaller portion is likely to
produce better detection accuracy. Therefore, this technique was adapted as the methodology for fat
determination of samples with lower fat content. Partitioning of dairy species into other organic
chemicals is another potential source for separation and potential contribution of dairy constituents to
blockages. More in depth analysis will help with modification of the FOG test for analysis of dairy
wastewaters.
Based on data available and observations made, wastewater originating from ice cream shops
and smoothie shops is estimated to have the highest potential separation due to the higher fat content
of the samples, acidity of fruit flavors, colloidal particles found in neutral to alkaline flavors, such as
chocolate, and addition of protein powders. Specialty coffee shops, which use also use significant
amounts of dairy products, should also demonstrate high separations. In these cases, installation of
GADs is expected to facilitate separation of dairy fats and proteins and positively affect the quality of
wastewater discharged, especially when conditions of low pH exist.
With this in mind, sampling of grease interceptors treating wastewater originating from two
dairy-using FSEs, (the specialty coffee shop, and the ice creamery) took place. Four visits to the greater
interceptor of the ice cream shop were made, starting 12/20/10 to 1/20/11. During the initial 2 visits,
the interceptor was excessively full, with the latest purge date of 06/10. Substantial separation was
witnessed for the two visits. The samples appeared to have fractioned predominantly in form of a
floating phase, however, disrupting the samples resulted in sinking of a portion of the separated
material, and separation as both floating and settling layers could be observed. The last two visits took
place after the most recent cleaning of 1/10/11, after which no significant and quantifiable separation
could be observed in the samples, which may have been caused by the minimal sale of dairies expected
during the cold season. The pH levels of all the collected samples were found to fall close to the ZPC pH
[4.5-5]. The extent of separation in this interceptor grew from inlet to outlet compartments, and hence
separation of ice cream products may be slow paced. Furthermore, during the first two weeks of study,

84
prior to the purge of 1/10/11, the degree of separation seemed to have reduced, particularly in the
outlet compartment, signaling the flow of material out of the interceptor and into the sewer lines.
The grease interceptor of the specialty coffee shop was also studied, and separation in form of
both floating and settling phases could be observed. The initial visit to this interceptor took place
within 1-2 weeks from the last purge date, and retention of dairy constituents prone to separation,
including fats could be observed. The mass fraction of fat in the three phases of floating, suspended,
and settling phases increased during the first two weeks, and little change was observed from the
second to third week of study. This fraction of separated material reduced moving from inlet to outlet
compartment, and the portion of separated phases reduced moving from inlet to outlet compartments.
Mass fractions of fat in all phases for the 3 samples were determined. The floating phase was puzzling,
as the sample was diluted in water (1:11), and the fat content was measured to be greater than 100%.
This might be due to the presence of other organic compounds and their association with isoamyl
alcohol could result in overestimation of fat. The floating phase did, however, resemble other fatty
material. The settling phase followed the floating phase in highest fat content. the mass of fat available
in the settling phase reduced from inlet to outlet chambers. Finally and similar to observations made
in synthetic samples, the suspended phase showed to have the smallest fraction of fat. The pH of all the
samples also fell close to ZPC [4.5-5], and as already studied at this pH range, separation of casein
proteins and fats is expected.
The retention time of the ice cream shop interceptor was calculated to be approximately 2
days. It should be noted that once the samples were transferred to the lab for further testing and
allowed to remain in a static condition, higher degrees of separation in almost all samples could be
witnessed. Overall, the specialty coffee shop interceptor appeared to successfully treat the wastewater
and separate dairy constituents prone to separation from bulk wastewater. Concluding from the
initial two visits to the ice cream shop interceptor separation of dairy material did appear to take
place. Nevertheless, this interceptor was not well maintained for the beginning phase of sampling, and

85
the visits following the latest purge date do not represent common conditions found in warmer
seasons when the sale of dairy desserts/produce is higher.

86
Chapter 5: Recommendations and Further Research
Survey Checklist for Dairy Product Regulation
As part of this project, recommendations are offered to supplement existing guidance
documents to evaluate the need of an FSE to install a separation device. Table 5.1 summarizes key
points that can be supplemented to the existing questionnaire. These questions were designed to
identify and quantify dairy constituents prone to separation in wastewater samples, and address
specialty coffee shops or dairy shops serving frozen or soft dairy desserts or snacks, such as ice creams
and smoothies. To this end, it is believed that partitioning in wastewater originating from such FSEs
will occur.
As can be seen, Table 5.1 is devised such that practices contributing to higher discharge rate of
dairy products in the sewer system will have demonstrated higher partitioning tendencies and can
contribute to build-ups and blockages in the sewer lines. Another noteworthy aspect is the level of
acidity introduced to wastewater by flavor additives. Since pH plays a dominant role in separation
processes, knowing the level of acidity introduced by flavor additives will help determine the pH range
of the wastewater, and whether curdling will occur within the system. Confectionary flavors, such as
chocolate and vanilla have neutral pH while most fruits tend to be acidic. Therefore, if fruit drinks are
the major contributors to sale in a dairy FSE, the pH of wastewater will tend to be acidic, whereas in
FSEs where neutral flavors are more popular, pH of wastewater should fall within the neutral range.
Table 5.1 provides the recommended checklist for distinguishing and categorizing FSEs in
order to assess the feasibility of GAD installation. The answers were arranged in two columns based on
their potential for separation. Naturally, the greater the contribution of an FSE to the dairy content of
wastewater, the more pivotal the role of the GAD becomes, and if an FSE serves prepackaged dairy
desserts/beverages in disposable utensils, it is likely that the dairy constituents responsible for
separation will not be discharged in the sewer, and the wastewater has a low potential for separation.

87
Moreover, since many FSEs only choose to dispose of old and “expired” milk, the likelihood that the
milk products will separate in the sewer system will be much higher. Lastly, addition of stabilizers
used in ice creams and proteins in smoothies is another noteworthy parameter that can affect the pace
of separation. It was observed during analysis on the ice cream shop grease interceptor that
separation was rather slow and a greater accumulation of the separated phases could be observed in
the outlet chamber, the reverse of which was seen in the specialty coffee shop GAD. At this time, the
exact reason for this phenomenon is unknown; however, the addition of stabilizers and proteins could
change partitioning tendencies and affect the efficiency of the treatment process. It is beneficial to
distinguish and categorize the different practices and products served to provide a more effective
solution.
Overall, it is expected that dairy products in wastewaters from dairy shops and specialty coffee
shops will separate, and installation of GADs can be considered as a viable option. Categorizing
additives used during processing of goods can help determine the pH range of the resulting
wastewater, and consequently the degree of pH-enhanced separation in wastewaters.

88
Table 5.1. Recommended Questionnaire for WSSC Regulations
Questions Wastewaters with Higher tendencies for separation
Wastewaters with lower tendencies for separation
1
Do you serve frozen or soft dairy desserts, including ice creams, sorbets, parfaits, frappes, and/or shakes?
Yes ☐ No ☐
2
a. Are your dairy beverages/desserts:
Prepared on Site ☐ Prepackaged ☐
b. Do you wash the kitchenware containing dairy products, used for storing, preparing, and serving dairy desserts/drinks?
Yes ☐ No (prepackaged and served in disposable
utensils) ☐
3 Please rank the estimated portion of your sale coming from dairy desserts/beverages
High - moderate ☐ Minimal - None ☐
4 Which flavors have the highest sale: Pomme fruits, citrus fruits, berries ☐
Confectionary Flavors (Vanilla, chocolate,… ) ☐
5
Do you dispose of left-over/unused or perishable dairy products, such as milk, prepared beverages/desserts containing milk, cream, half and half, and yogurt in the drain?
Frequently (at least once a
week) ☐
Rarely (at most once every 2
weeks) ☐
6
If proteins powder/stabilizers are used in preparing shakes/smoothies, in what approximate quantities are they added?
Small - None ☐ Large - Moderate ☐
Since the practices and types of dairy products served at these FSEs are diverse, simplification
and generalization of these FSEs is required in order to make the decision making and treatment
process efficient. In consultation with WSSC personnel, the following revised checklist, appearing in
Table 5.2, was devised to assess the feasibility of grease interceptors for different FSEs. This checklist
has a direct focus on practical implementation.

89
Table 5.2 WSSC Review Form FOG Program
STEP 1: INITIAL BMP REVIEW
Are ice cream products manufactured at this facility?
Yes □ No □
If yes: FULL permit; if no: continue with Step 2
STEP 2: EVALUATION OF BMP OPTION
The reasoning here is to determine if qualifying food preparation occurs and/or whether potential measurable
FOG material is disposed of in the trash, rather than into the sewer.
PART A GENERAL
1. Do you serve frozen or soft dairy desserts, dairy drinks, specialty dairy-containing drinks, ice creams,
sorbets, parfaits, frappes, lattes, smoothies and/or shakes?
Yes □ No □ N/A □
If no or N/A, check for other food preparation characteristics on separate form.
PART B DAIRY/SPECIALTY
Applicable items include frozen or soft dairy desserts, dairy drinks, specialty dairy-containing drinks, ice creams,
sorbets, parfaits, frappes, lattes, smoothies and/or shakes
1. Do you only directly* serve the applicable item(s) that has been pre-packaged/prepared elsewhere?
Yes □ No □ N/A □
2. Are the applicable items consumed on a disposable plate, cup or container (or napkin) and/or taken to go and are
the potential utensils issued to the consumer disposable?
Yes □ No □ N/A □
3. Do you prepare any of the applicable items above using mechanical or mixing devices (such as blenders, soft ice
cream makers, milk shake makers, cappuccino machines, etc.) that require cleaning and sanitizing?
Yes □ No □ N/A □
4. Do you hand wash any pans, dishes containers and/or utensils from the applicable items on a daily basis?
Yes □ No □ N/A □
If yes- please describe: Include the number of dishes/utensils/containers hand washed per day and what they
contain:
5. Where are leftover, expired, defective, mistakenly-made or otherwise extra unsaleable applicable items disposed of,
specifically (list all methods):
*”directly” means ice cream physically scooped from a pre-packaged container to the cone or container or an applicable item completely
pre-packaged for direct sale (no handling).

90
Future Work
Since one of the key aspects of this study is to diminish FOG blockages, it is important to study
the grease interceptors treating wastewaters rich in dairy components more thoroughly. The sampling
for this study took place during colder months, when the sale of frozen desserts and dairy beverages
high in fat and proteins, are low if not minimal. Therefore, it would be constructive to continue this
study in warmer months and study how the introduction of different dairy products in the wastewater
influences the overall partitioning behavior of the wastewater and monitor the efficiency of
interceptors in removing the separable material. Furthermore, as already discussed temperature
affects the stability of dairy suspensions. In cooler temperatures, crystallization/ partial crystallization
of fats and proteins takes place, which makes them more partial to coagulation. The
crystallized/partially crystallized fat globules will no longer consist of liquid fat, but rather needle-like
crystals, which when agitated can pierce the membrane, and enhance coalescence of fats (Goff, et al.
2003). Higher temperatures can cause denaturation of membrane proteins and whey proteins,
causing creaming of milk products (Walstra et al., 1984). It would be thus important to study the
interceptor during longer periods of time and investigate the effects of composition and temperature
on the behavior of dairy wastewater.
Another important parameter examined was the level of acidity of the system. It was discussed
that as the pH of the system is reduced, the calcium phosphate present in milk starts dissolving, and at
pH of 4.7, separation of casein into another phase occurs. While pH can be reduced by introduction of
acidic additives, it can also result from spoiling of dairy products. During fermentation, one of the
processes occurring during spoilage, lactose molecules are converted to lactic acid. The principle effect
here is the dissolution of calcium phosphate and the decrease in association of cations with proteins
since at this time the negative charge of the proteins diminishes. The ionic strength, and the Ca2+
activity increases, and several lactic acid bacteria can break down citrate, which may also increase the

91
Ca2+ activity. Therefore, the changes caused by lactic fermentation are not quite similar to those caused
by addition of other acids, such as HCl (Walstra et al., 1984). It is speculated that due to the diverse
changes caused during enzymatic and fermentation reactions, the nature of the system will differ
significantly from original conditions found in milk.
Another focus of future study is thorough analysis of the effects of detergent-grade surfactants
on dairy emulsion stability. During characterization studies, it was seen that addition of detergents
and sterilizers slightly enhanced pH
induced separation in synthetic samples.
As already explained and demonstrated
in Figure 6.1, the proteinaceous
membrane covering the fat globules and
the casein micelles surrounding the
globules lower the interfacial tension
between fat and water, and in doing so
stabilize the emulsion. Addition of
surfactive material such as detergents,
however, can cause displacement of casein proteins and other emulsifying agents found in dairy
systems by surfactants. Although surfactants are energetically favorable, they provide a thinner
shelter for the fat globule, and hence make the system more susceptible to subsequent separations.
Furthermore, some surfactants can potentially cause deformation of proteins in fat globule
membranes, leaving a larger area of the fat exposed (Goff, et al. 2003). Surfactants can be categorized
based on their charge (cationic, anionic, zwitterionic, and neutral) .
Finally, the effects of ionic strength found in wastewater conditions should also be examined.
Salt composition affects Ca2+ activity (Ca2+) of the mixture and hence the calcium phosphate content of
the micelles. For example, addition of calcium complexes will raise (Ca2+) and the calcium phosphate of
Figure 6.1. Dairy composition and Structure, picture reproduced from Walstra et al., Figure 1.1. The casein micelles as well as protenacious membrane covering the fat globules reduces surface tension, making the emulsion stable.

92
the micelles, and can affect the pH of the system. The surplus of calcium used will find its way to the
drain, and when exposed to untreated wastewater rich in dairy constituents can cause coagulation.

93
Work Cited
vii. Fats, Oils, and Grease (FOG) Control Program, City of Los Angeles, CA, http://www.lasewers.org/ssmp/pdfs/FOGContol.pdf , July 2010
Butyrometer for Gerber Method for Fat Analysis, http://www.coleparmer.com/catalog/product _view.asp?sku=1742510&pfx=, November 2010
Eaton, A., and Franson, M.H., (2005), Standard Methods for the Examination of Water and
Wastewater, American Public Health Association
Fat Free Drains, Hampton’s Roads Communities, http://www.fatfreedrains.com/HRFOGrackCard
_web%20version.pdf, July 2010
Fats, Oil, Grease and Wax Control Program, Appendix E Salisbury, NC, http://www.salisburync.gov/ pdf/fogdraft.pdf, July 2010
Fats, Oils, and Grease Control Program, State of Florida, http://www.dep.state.fl.us/waste/quick _topics/publications/shw/solid_waste/Guidance_FOG_Biofuel_01-14-09.pdf , July 2010
Fats, Oils, and Grease Ordinance No, 06-05, State of Tennessee, http://www.springhilltn.org/PDF/GreaseOrdinance.pdf , July 2010
Fats, Oils, and Grease Program, City of Milwaukie, OR, http://www.cityofmilwaukie.org/ departments/pubworks/sewer/FOG.html#management , July 2010
General Design of a 1600 gal Grease Interceptor, WSSC Grease and Sand/Oil Interceptor Detail 1998
Goff,H.D. (1997). Instability and Partial Coalescence in Whippable Dairy Emulsions, Journal of Dairy Science 80.10, 2620-2630, Print.
Gross, M. (2004), Wastewater Characterization, University Curriculum Development for Decentralized Wastewater Management, University of Arkansas
Guidance Document for the Discharge of Wastewater Associated with Food Preparation Establishments, City of San Francisco, CA, July 2010
Half and Half, Robert’s Dairy, http://www.robertsdairy.com/products/cream/half‐and‐half, November 2010
Help Reduce FOG in the Sewer System, City of Louisburg, NC, http://www.townoflouisburg.com/city-services/utilities_sewer_fog-reduction.aspx, March 2011

94
Information for Food Service Establishments, City of Fullerton, WI, Maintenance, http://www.ci.fullerton.ca.us/depts/maintenance/environmental_programs/FOG_control_program/information_for_food_service_establishments.asp, July 2010
Keeping Fats, Oils, and Grease out of the Sewers, State of Texas, http://www.tceq.state.tx.us/assistance/P2Recycle/FOG/about_FOG.html , July 2010
Pollution Prevention for Fats, Oil and Grease from Food Services, HWEC, Solid and Hazardous Waste Education, http://www4.uwm.edu/Dept/shwec/publications/cabinet/p2/Pollution-%20PreventionFats,%20Oil%20and%20Grease%20from%20Food%20Services.pdf, July 2010
PROTECTING YOUR SEWER SYSTEM FROM FATS, OIL, AND GREASE, Los Angeles County, CA http://dpw.lacounty.gov/smd/SMD/Protectingyoursewersystemfromfats.pdf, March 2011
Marshall,R.T., Goff, H.D., and Hartel, R.W., (2003), Ice Cream Sixth Edition, Kluwer Academic/Plenum Publishers, New York, NY, 1-179
Rossel, J.B., and Pritchard, J.L.R. (1991), Analysis of Oilseeds, Fats, and Fatty Foods, Elsevier Science, Publications Ltd., 227- 253
Scheffius, B, and Miles, E. (2007), FOG and Our Nation’s Sewer Systems, Water & Wastes Digest, Volume 47, 3
Schowell, Michael S., (1997), Powdered Detergents, Surfactant Science Series Volume 71, Marcel Dekker, Inc., New York, NY, 1-93
The 10 Greenest Cities in the U.S., Sustainablog, http://blog.sustainablog.org/the-10-greenest-cities-in-the-us/, July 2010
The Science of Fats, Oils, and Grease, FOGscience.com, May 2010Tupper, G, (2010), Pretreatment Programs: EPA Updates and FOG Control, U.S. EPA, http://www.cwea.org/nc/Pretreatment_fog.pdf
Walstra, P, and Jenness, R. (1984) Dairy Chemistry and Physics, John Wiley & Sons, 1-335
Webb, B., Johnson, A.H., and Alford, J.A. (1975) Fundamentals of Dairy Chemistry, Avi Publishing Company, 1-500
Wehr, F.M., and Frank, J.F.,. (2004), Standard Methods for the Examination of Dairy Products, 17th edition, American Public Health Association, 408-433
Wright-Pierce (2006), Guidance Document for the Discharge of Wastewater Associated with
Food Preparation Establishments, Middletown, Connecticut http://www.ct.gov/dep-/cwp/view.asp?A=2721&Q=325696

95
Appendix
Slide 1
U N I V E R S I T Y O F M A R Y L A N D , C O L L E G E P A R K
D E P A R T M E N T O F C I V I L A N D E N V I R O N M E N T A L E N G I N E E R I N G
G O L N A Z K H O R S H A
A D V I S O R S :
D R . A L L E N D A V I S D R . A L B A T O R R E N T S
C O N T R I B U T O R :
D R . J O E L D U C O S T E
4 / 4 / 2 0 1 1
The Production and Fate of Fats, Oils and Grease (FOG) from Small Dairy-based Food
Service Establishments (FSE’s)
Slide 2
Outline
Background
Understanding Dairy Science – Literature Review
Laboratory Analysis
Field Studies
Conclusion
Recommendations
Future Work

96
Slide 3
Background
occurrence of Sanitary Sewer Overflows (SSOs) pose environmental risks : spillage of raw sewage into to communities
retention of fats, oils and grease in the sewer lines: FOG blockages account for 40% of all SSOs
75% of U.S. sewer lines operate half capacity
Slide 4
Background
Solution: Prevent/diminish FOG Discharge/BMPs & physical treatment of ww rich in FOG
Potential Sources
1. FSEs preparing/serving food:
• obvious FOG production – addressed w/ FOG Ordinance
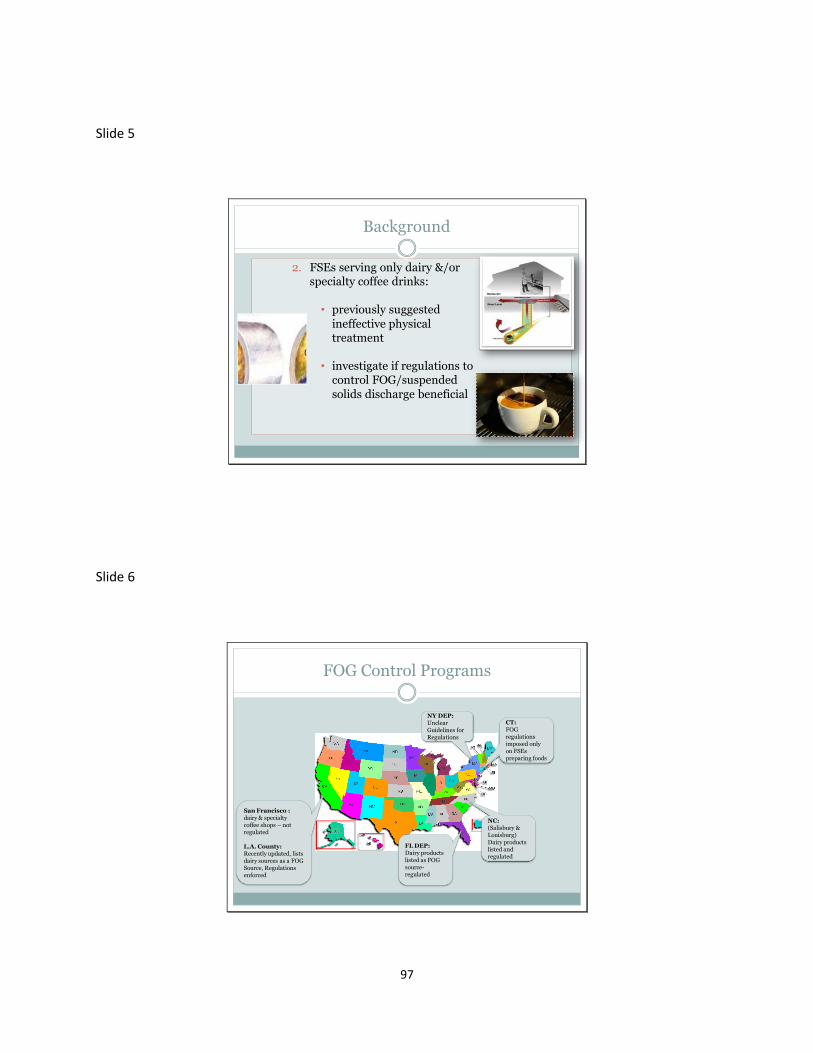
97
Slide 5
Background
2. FSEs serving only dairy &/or specialty coffee drinks:
• previously suggested
ineffective physical treatment
• investigate if regulations to control FOG/suspended
solids discharge beneficial
Slide 6
FOG Control Programs
San Francisco : dairy & specialty coffee shops – not regulated
L.A. County: Recently updated, lists dairy sources as a FOG Source, Regulations enforced
FL DEP: Dairy products listed as FOG source-regulated
NC: (Salisbury &Louisburg)Dairy products listed and regulated
CT: FOG regulations imposed only on FSEs preparing foods
NY DEP:Unclear Guidelines for Regulations

98
Slide 7
Background
No previous research
to investigate the potential contribution of dairy/specialty coffee shops’ wastewater
Understand dairy systems & separation tendencies
Slide 8
Phase 1: Dairy Emulsion
Understanding Basics of Dairy systems

99
Slide 9
Dairy Emulsion
Slide 10
Dairy Emulsion
Complex emulsions > 100,000 molecular species, pH approximately 7
Major Components:
1. Water
2. lactose
3. Fats in globules
4. Proteins
5. salts
Proteins
• Caseins: 80%, have to aggregate to remain in solution, charge bearing
• Whey: Soluble• Membrane Proteins, cover the fat

100
Slide 11
Dairy Emulsion
Component
Average
Content % (w/w)
Range % (w/w)Average % of Dry Matter
Water 87.3 85.5-88.7
Solids-non-fat 8.8 7.9-10.0 69
Fat in dry matter 31 21-38
Lactose 4.6 3.8-5.3 36
Fat 3.9 2.4-5.5 31
Protein 3.25 2.3-4.4 26
Casein 2.6 1.7-3.5 20
Mineral substances 0.65 0.53-0.8 5.1
Organic acids 0.18 0.13-0.22 1.4
Miscellaneous 0.14 1.1
Table reproduced from Dairy Chemistry and Physics, 1975
Slide 12
Dairy Emulsion
Different compounds (unlike) in dispersed state → not energetically favorable, will separate
Emulsion stabilized:
1. Proteins (caseins) lower interfacial tension
2. Fat globule membranes lower surface area between fats and water → fats not exposed to water
Further stability achieved during homogenization

101
Slide 13
Dairy Emulsion
Dairy composition and Structure, picture reproduced from Walstra et al., Figure 1.1. The casein micelles as well as proteinaceous membrane covering the fat globules reduces surface tension, making the emulsion stable.
Slide 14
Destabilizing Dairy Emulsion: pH
↓pH CaP dissolution
pH=5.2:
1. most of Calcium phosphate lost
2. Casein lost most of its charge
pH [4.6-4.8]:
1. All CaP dissolved
2. Casein charge =0 separation Casein Micelles, Walstra, 1984

102
Slide 15
Destabilizing Dairy Emulsion: Temperature
Heat:
1. Heat Coagulation of Caseins
2. Further Acidification
3. Denaturation of Whey Proteins
4. Damage to Fat Globule Membranes →
exposing fat
Creaming of Milk after heating in lab
Slide 16
Destabilizing Dairy Emulsion: Temperature
Cooling:
1. Crystallization of Fats
2. Crystallization of Proteins
Air Entrapment Foaming
& Adsorption of Fats &
proteins in Foam

103
Slide 17
Destabilizing Dairy Emulsions
pH: • Dissolution of CaP in casein proteins
at pH→4.6
Heat:
• Heat coagulation of caseins+• Further acidification and
denaturation of whey proteins• damage to the fat globule membrane
= coalescence of fat globules
Cooling & Air
Entrapment
• Crystallization of fat globules →Strong association
Slide 18
Predicted Behavior of Dairy Products
Hypothesis:
High potential for Separation of dairy
species in wastewater:
1. Ice Cream Shops: primarily in form of fat
2. Specialty Coffee Shops: Proteins

104
Slide 19
Phase 2: Testing Theory
Laboratory Analysis
Slide 20
Predicting Behavior of Dairy Products
pH Effects:
1. Dairy : water Dilution
2. Dairy: Detergent: Water Dilution
Visit to FSEs on campus, employing their practices to construct a realistic sample for testing
Temperature Effects: Measuring separation at different temperatures

105
Slide 21
Effects of Heat on Partitioning Behavior of Dairies
0&250C: Samples studied every 5 min for 3 hrs
800C: Samples heated in water bath-Maintained temperature for 15 min- observed for 3 hrs
Slide 22
Effects of pH on Dairy Suspension
Serum or remaining suspended phase
Curd Layer, settled in whole milk
Curd Layer, Floating in ½ & ½
Serum or remaining suspended phase
pH of samples = 4.8

106
Slide 23
Effects of pH on Partitioning Behavior of Dairy Products
Slide 24
Effects of pH on Partitioning Behavior of Dairy Products

107
Slide 25
Effects of pH on Partitioning Behavior of Dairy Products
0.0%
10.0%
20.0%
30.0%
40.0%
50.0%
60.0%
70.0%
80.0%
90.0%
100.0%
7.2 6.0 4.8 4.2 2.9
Pa
rti
tio
nin
g B
eh
av
ior
pH
Whole Milk:Water (1:10) pH Profile
% Floating Clear Soln % Settling
0.0%
10.0%
20.0%
30.0%
40.0%
50.0%
60.0%
70.0%
80.0%
90.0%
100.0%
7.0 6.0 4.8 4.4 3.5
Pa
rti
tio
nin
g B
eh
av
ior
pH
Whole Milk:Det:Water (1:10) pH Profile
%Floating %Soln %Settling
Slide 26
Dairy Suspension: f(pH, T, t)
Higher T: higher solubility of compounds (washing of grease & fats w/ hot water):
Behavior of Dairy systems Diluted in warm water – Experiment:
1. T of warm tap water ~500C (1200F)
2. most washing done @ one time → warm water
continuously run → TGAD ~500C for several
3. Partitioning tendencies @ different pH
studied

108
Slide 27
Dairy Suspension: f(pH, T, t), pH = 5.2
Higher T→ more KE &faster settling
Formation of fine colloidal particles in heated milk (Slow rate of pcp)
vs. large protein structures (curd) observed (faster and more compact)
0%
10%
20%
30%
40%
50%
60%
70%
80%
90%
100%
0 5 10 20 30 40 50 60 90t (min)
a) Chilled WM:Water (1:10)
Float Clear Soln Sink
T=250CpH = 5.2
0%
10%
20%
30%
40%
50%
60%
70%
80%
90%
100%
5 10 15 20 25 30 40 50 60 90t (min)
c) Heated WM:Water (1:10)
Float Clear Soln Sink
Tstart=500C
pH = 5.3
0%
10%
20%
30%
40%
50%
60%
70%
80%
90%
100%
t (min)
b) Heated WM:CW (1:10)
clear top Suspended Phase %sink
T=250CpH = 5.4
Slide 28
Dairy Suspension: f(pH, T, t), pH = 4.8
Higher T→ more KE & faster settling
Det → enhanced separation 10% dairy:det+water
8.5% dairy:warm water
8% for dairy:room T water

109
Slide 29
Conclusion
Sample (1:10) T (0C) pH Effects Det. Effects
Heated Milk:
tap water
Dilution
25
Separation occurring at pH [5.2-4], with
maximum partitioning as pH→4.8.
More resistance to curdle, Formation of
colloids for pH ~5.3
slightly enhanced
separation for pH{5.3-4]
50
Similar behavior as 250C; higher kinetic
energy→faster settling
More compact precipitate phase
slightly enhanced
separation for pH{5.3-4]
Chilled Milk:
tap water
Dilution
25 Separation occurring at pH [5.2-4], with
maximum partitioning as pH→4.8.
slightly enhanced
separation for pH{5.3-4]
50
Similar behavior as 250C, higher kinetic
energy→faster settling
More compact precipitate phase
slightly enhanced
separation for pH{5.3-4]
Creams
(half & half,
and ice
creams)
25
Formation of both settling and floating
layer, based on fat content. Half and
half(floating), ice cream(floating of foam
and fat, settling of curd + additives),
maximum separation at pH [5.4-4.8]
slightly enhanced
separation for pH{5.3-4]
50
Similar behavior as 250C, higher kinetic
energy → faster settling
More compact precipitate phase
slightly enhanced
separation for pH{5.3-4]
Slide 30
Phase 3: Quantification of Fat
Fat Content & Fractionation Upon Separation

110
Slide 31
Fat Content
Standard Methods 5520B incompatible w/ dairy samples: Formation of viscous gelatin layer
Standardized Methods for Testing Dairy Samples : The Gerber Fat Method
1. Disintegration of Dairy Emulsion
• Add 11.7 mL Dairy Product to
10 mL Concentrated
H2SO4
• ΔH<0, Heat Release
2. Release of Fat
• Add 1 mL isoamyl alcohol
• isoamyl alcohol + heat →
Release of Dairy Fat
3. Fat Collection
• The fat will be collected on top of butyrometer
• Read % fat from the graduated
portion of butyrometer
neck
Slide 32
Fat Content
Determine Fate of fat after pH-induced separation (pH = 4.8) on 1:10 dairy: water dilutions
Measurements made w/ Gerber
Eqns used for calculations
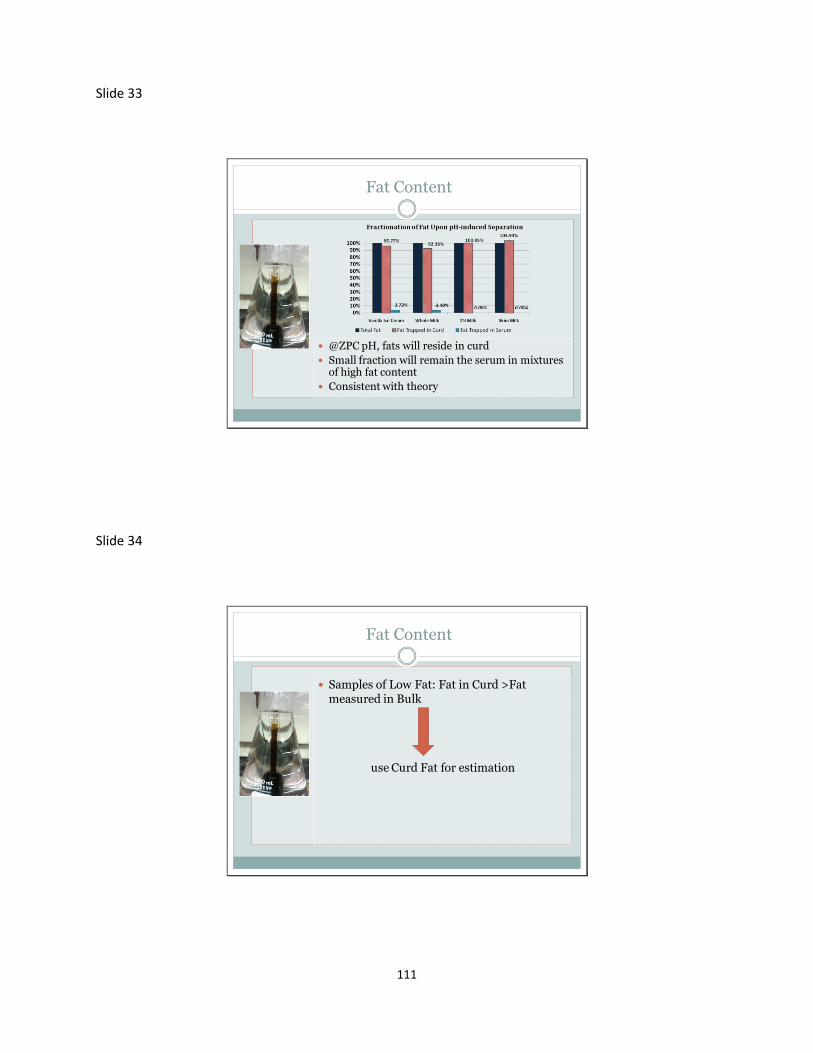
111
Slide 33
Fat Content
@ZPC pH, fats will reside in curd
Small fraction will remain the serum in mixtures of high fat content
Consistent with theory
Slide 34
Fat Content
Samples of Low Fat: Fat in Curd >Fat measured in Bulk
use Curd Fat for estimation

112
Slide 35
Wastewater
Wastewater collected from the Coffee Bar, UMD
Neutral pH
Dilution : 2:25
Curd Fat
DeterminationBulk Measurement
Shift 1
(11AM-3PM)0.02% ± 0.004% 0.03% ± 0.01%
Shift 2
(4PM – 9PM)0.03% ± 0.003% 0.02% ± 0.02%
2 wks @40C
Slide 36
Grease Abatement Devices
Removal of suspended material in grease interceptor
2 grease interceptors treating wastewater from an ice creamery and a specialty coffee shop:
1. Volume based interceptor
2. V = 1600 gal
http://prima-restaurant-equipment.com/content/grease-trap-
101-types

113
Slide 37
Grease Abatement Devices
Sampling and testing for
1. Extent of separation
2. pH
3. Fat fractionation in each phase
Slide 38
Grease Abatement Devices: Sampling
long sampling column (d=5.5 cm, L~ 2m) used
Ht of different phases within column measured
variations caused by flow, measurements repeated for 3 pts
average measurements = extent of separation in each phase
each draw discharged by releasing the cable & collected for further testing
To maximize consistency in analysis, the sampling positions of all compartments closely matched
The total height of wastewater in the column [100 –110] cm
samples were brought to lab for further testing

114
Slide 39
Grease Abatement Devices: Ice Cream Shop
Substantial Separation for initial visits – purge date: 06/10
No further separation for the last 2 visits – purge date 01/10/11
Inlet (a) &(d), Middle (b) & (E), and Outlet (c) & (e) Chamber of theIce Cream Shop GAD, used in this
study sampled on 12/20/10 [30C], and 1/14/11 [00C] respectively;
Slide 40
Grease Abatement Devices: Ice Cream Shop
0%
10%
20%
30%
40%
50%
60%
70%
80%
90%
100%
Inlet Comp. Middle Comp. Outlet Comp.
Hi /
HW
aste
wat
er
Degree of Separation in GAD Site Measurements - 12/20/10
Floating Phase Suspended Soln Settling Phase
0%
10%
20%
30%
40%
50%
60%
70%
80%
90%
100%
Inlet Comp. Middle Comp.
Outlet Comp.
Hi /
HW
ast
ewa
ter
Laboratory Measurements of GAD Samples - 12/20/10
Floating Phase Suspend. Phase Settling Phase
pH = 5 pH = 4.6 pH = 4.4

115
Slide 41
Grease Abatement Devices: Ice Cream Shop
0%
10%
20%
30%
40%
50%
60%
70%
80%
90%
100%
Inlet Comp. Middle Comp. Outlet Comp.
Hi /
HW
as
tew
ate
r
Degree of Separation in GAD, 1/6/11
Floating Layer Height (cm) Suspend Soln Settling Layer
0%
10%
20%
30%
40%
50%
60%
70%
80%
90%
100%
Inlet Comp. Middle Comp. Outlet Comp.
Hi /
HW
aste
wa
ter
Laboratory Measurements of GAD Samples - 1/6/11
Floating Phase Suspend. Phase Settling Phase
pH = 4.8 pH=4.5 pH = 4.5
Slide 42
Grease Abatement Devices: Ice Cream Shop
0%
10%
20%
30%
40%
50%
60%
70%
80%
90%
100%
Inlet Comp. Middle Comp. Outlet Comp.
Hi /
HW
as
tew
ate
r
Degree of Separation in GAD, 1/14&20/11
Floating Phase Suspend Soln Settling Layer
0%
10%
20%
30%
40%
50%
60%
70%
80%
90%
100%
Inlet Comp. Middle Comp. Outlet Comp.
Hi /
HW
as
tew
ate
r
Laboratory Measurements of GAD Samples - 1/14&20/11
Floating Phase Suspend. Phase Settling Phase
pH= 4.6 pH = 4.5 pH = 4.9
pH = 5.0 pH = 4.5 pH = 4.6
pH levels for 1/14/2011pH levels for 1/20/2011

116
Slide 43
Grease Abatement Devices: Ice Cream Shop
pH range of all samples : [4.4-5]
Slow paced separation, higher degree of separation in the outlet chamber (stabilizers)
Dense clusters
No separation after 01/10, (low sale of ice creams/dairy samples, pH →ZPC)
Fat content for 12/20 and 1/6 could not be quantified > h limit of testing equipment
Fat content of all samples after 1/10 =0%
Slide 44
Grease Abatement Devices: Specialty Coffee Shop
3 visits
Purge Date ~ 12/25
Separation witnessed in all chambers, less dense
Inlet (1), Middle (2), and Outlet (3) Chambers of the Specialty Coffee Shop GAD

117
Slide 45
Specialty Coffee Shop
0%
10%
20%
30%
40%
50%
60%
70%
80%
90%
100%
Inlet Comp. Middle Comp. Outlet Comp.
Hi /
HW
as
tew
ate
r
Degree of Separation in GAD, 1/6/11
Floating Phase Suspend. Phase Settling Phase
0%
10%
20%
30%
40%
50%
60%
70%
80%
90%
100%
Inlet Comp. Middle Comp. Outlet Comp.
Hi
/ H
Wa
ste
wa
ter
Laboratory Measurements, 1/6/11
Floating Phase Suspend. Phase Settling Phase
pH =4.3 pH = 4.4 pH = 4.4
Slide 46
Specialty Coffee Shop
0%
10%
20%
30%
40%
50%
60%
70%
80%
90%
100%
Inlet Comp. Middle Comp. Outlet Comp.
Hi
/ H
Wa
ste
wa
ter
Degree of Separation -1/14/2011
Floating Phase Suspend. Phase Settling Phase
0%
10%
20%
30%
40%
50%
60%
70%
80%
90%
100%
Inlet Comp. Middle Comp. Outlet Comp.
Hi
/ H
Wa
ste
wa
ter
Laboratory Measurements, 1/14/2011
Floating Phase Suspend. Phase Settling Phase
pH =4.2 pH = 4.6 pH = 4.5

118
Slide 47
Specialty Coffee Shop
0%
10%
20%
30%
40%
50%
60%
70%
80%
90%
100%
Inlet Comp. Middle Comp.
Outlet Comp.
Hi /
HW
ast
ewa
ter
Degree of Separation - 1/20/2011
Floating Phase Suspend. Phase Settling Phase
pH =4.2 pH = 4.4 pH = 4.2
0%
10%
20%
30%
40%
50%
60%
70%
80%
90%
100%
Inlet Comp. Middle Comp. Outlet Comp.
Hi /
HW
ast
ewa
ter
Laboratory Measurements -1/20/2011
Floating Phase Suspend. Phase Settling Phase
Slide 48
Specialty Coffee Shop
Sample Date Chamber% Xfat, Floating
Phase
Measured %
XFat, Suspended Phase
Measured %
XFat, Settled Phase
1/6/2011
Inlet 156.8 0.10% 4.30%
Intermediate 0.0 0.05% 1.60%
Outlet 0.0 0.10% 0.35%
1/14/2011
Inlet 183.7 0.10% 5.5%
Intermediate 99.0 0.05% 3.0%
Outlet 0 0.10% 0.50%
1/20/2011
Inlet 165.0 0.15% 8.25%
Intermediate 0.0 0.05% 4.00%
Outlet 0.0 0.10% 0.70%
Table 4. Percentage of Fat Trapped in Each Phase of the Interceptor

119
Slide 49
Specialty Coffee Shop
Sample
DateChamber Mfloating (g)
Mfat in
Floating Phase
(g)
Msuspended
Phase (g)
Mfat in
Suspended Phase
(g)MSediment (g)
Mfat in Sediment
(g)
1/6/11
Inlet 34.44 53.98 596.22 2.98 296.33 12.74
Intermediate 0.00 0.00 650.83 0.33 289.17 4.63
Outlet 0.00 0.00 826.47 0.00 73.53 0.26
1/14/11
Inlet 76.76 141.00 896.76 0.90 758.94 41.74
Intermediate 10.65 10.54 1396.64 0.70 1139.02 34.17
Outlet 0.00 0.00 1891.02 1.89 120.60 0.60
1/20/11
Inlet 94.15 155.35 547.58 0.82 256.51 21.16
Intermediate 0.00 0.00 748.43 0.37 219.54 8.78
Outlet 0.00 0.00 807.04 0.81 112.93 0.79
Table5. Determination of Fat Content of Partitioned Phases in the Specialty Coffee Shop GAD
Slide 50
Specialty Coffee Shop
0%
10%
20%
30%
40%
50%
60%
70%
80%
90%
100%
Inlet Mid Outlet
Ma
ss F
ract
ion
*1
00
Chamber
Fat & Partitioned Phases – Specialty Coffee Shop 1/6/11
Floating Phase Fat in Suspend. Phase SUSPENDED PHASE Fat in Settling Phase Settling Phase
XFaT = 0.10% XFaT = 0.05% XFaT = 0.10%
XFaT = 0.4%
XFaT =4.3%XFaT =1.6%

120
Slide 51
Specialty Coffee Shop
0%
10%
20%
30%
40%
50%
60%
70%
80%
90%
100%
Inlet Mid Outlet
Ma
ss F
ract
ion
*1
00
Chamber
Fat & Partitioned Phases – Specialty Coffee Shop 1/14/11
Floating Phase Fat in Suspend. Phase SUSPENDED PHASE
Fat in Settled Phase Settling Phase
XFaT = 0.10% XFaT = 0.05% XFaT = 0.10%
XFaT =5.5% XFaT =3.0%
XFaT =0.5%
Slide 52
Specialty Coffee Shop
0%
10%
20%
30%
40%
50%
60%
70%
80%
90%
100%
Inlet Mid Outlet
Ma
ss F
ract
ion
*1
00
Chamber
Fat & Partitioned Phases - Specialty Coffee Shop 1/20/11
Floating Phase Fat in Suspend. Phase SUSPENDED PHASE
Fat in Settling Phase Settling Phase
XFaT =4.0%XFaT =8.3%
XFaT =0.7 %
XFaT = 0.15% XFaT = 0.05% XFaT = 0.10%

121
Slide 53
Grease Abatement Devices: Specialty Coffee Shop
Accumulation of build up during study
pH range of Samples [4.2-4.6]
Partitioning ↓ from inlet to outlet
Fraction of Fat increasing each consecutive week
% Mass Fat in floating phase > 100%: impurity, detection limit
Slide 54
Conclusion
Separation in GADs/ Lab (acidic conditions)
1. Floating (fat) / settling
2. Accumulation of separated material
3. ↑in fat content of floating/settling layers each week (coffee shop)
Slower pace of separation for ice cream (stabilizers)
Faster pace for specialty coffee shop
Detergents seemed to slightly enhance separation in lab, did not prevent partitioning

122
Slide 55
Checklist
QuestionsWastewaters with
Higher tendencies
for separation
Wastewaters with
lower tendencies
for separation
1
Do you serve frozen or soft dairy desserts,
including ice creams, sorbets, parfaits,
frappes, and/or shakes?
Yes ☐ No ☐
2
a. Are your dairy beverages/desserts:Prepared on Site
☐Prepackaged ☐
a. Do you wash the kitchenware
containing dairy products, used for
storing, preparing, and serving dairy
desserts/drinks?
Yes ☐
No (prepackaged
and served in
disposable
utensils) ☐
3Please rank the estimated portion of your
sale coming from dairy desserts/beverages
High - moderate
☐
Minimal - None
☐
Slide 56
Checklist
QuestionsWastewaters with
Higher tendencies for
separation
Wastewaters with
lower tendencies for
separation
4 Which flavors have the highest sale:
Pomme fruits,
citrus fruits,
berries ☐
Confectionary
Flavors (Vanilla,
chocolate,… )
☐
5
Do you dispose of left-over/unused or
perishable dairy products, such as milk,
prepared beverages/desserts containing
milk, cream, half and half, and yogurt in the
drain?
Frequently (at
least once a week)
☐
Rarely (at most
once every 2
weeks) ☐
6
If proteins powder/stabilizers are used in
preparing shakes/smoothies, in what
approximate quantities are they added?
Small - None ☐Large - Moderate
☐

123
Slide 57
Current and Future Steps
More thorough investigation on effects of surfactants/detergents on stability of dairy wastewater
1. Displacement of proteins
2. Higher susceptibility to subsequent separation
Change in salinity and concentrations of minerals on suspension
Slide 58
Questions/Comments?