the role of carbonyl sulphide as a source of stratospheric ... · the role of carbonyl sulphide as...
TRANSCRIPT

Atmos. Chem. Phys., 12, 1239–1253, 2012www.atmos-chem-phys.net/12/1239/2012/doi:10.5194/acp-12-1239-2012© Author(s) 2012. CC Attribution 3.0 License.
AtmosphericChemistry
and Physics
The role of carbonyl sulphide as a source of stratospheric sulphateaerosol and its impact on climate
C. Bruhl1, J. Lelieveld1,3, P. J. Crutzen1, and H. Tost2
1Atmospheric Chemistry Department, Max-Planck-Institute for Chemistry, Mainz, Germany2Institute for Physics of the Atmosphere, Johannes Gutenberg University, Mainz, Germany3The Cyprus Institute, Nicosia, Cyprus, and King Saud University, Riyadh, Saudi Arabia
Correspondence to:C. Bruhl ([email protected])
Received: 9 June 2011 – Published in Atmos. Chem. Phys. Discuss.: 22 July 2011Revised: 19 January 2012 – Accepted: 23 January 2012 – Published: 1 February 2012
Abstract. Globally, carbonyl sulphide (COS) is the mostabundant sulphur gas in the atmosphere. Our chemistry-climate model (CCM) of the lower and middle atmospherewith aerosol module realistically simulates the backgroundstratospheric sulphur cycle, as observed by satellites in vol-canically quiescent periods. The model results indicate thatupward transport of COS from the troposphere largely con-trols the sulphur budget and the aerosol loading of the back-ground stratosphere. This differs from most previous studieswhich indicated that short-lived sulphur gases are also im-portant. The model realistically simulates the modulation ofthe particulate and gaseous sulphur abundance in the strato-sphere by the quasi-biennial oscillation (QBO). In the low-ermost stratosphere organic carbon aerosol contributes sig-nificantly to extinction. Further, using a chemical radiativeconvective model and recent spectra, we compute that the di-rect radiative forcing efficiency by 1 kg of COS is 724 timesthat of 1 kg CO2. Considering an anthropogenic fraction of30 % (derived from ice core data), this translates into an over-all direct radiative forcing by COS of 0.003 W m−2. The di-rect global warming potentials of COS over time horizons of20 and 100 yr are GWP(20 yr) = 97 and GWP(100 yr) = 27,respectively (by mass). Furthermore, stratospheric aerosolparticles produced by the photolysis of COS (chemical feed-back) contribute to a negative direct solar radiative forcing,which in the CCM amounts to−0.007 W m−2 at the top ofthe atmosphere for the anthropogenic fraction, more than twotimes the direct warming forcing of COS. Considering thatthe lifetime of COS is twice that of stratospheric aerosols thewarming and cooling tendencies approximately cancel.
1 Introduction
The anthropogenic increase of greenhouse gases causes aradiative forcing of climate of more than 3 W m−2 (IPCC,2007). Conversely, aerosol particles backscatter solar radia-tion and their anthropogenic emissions exert a global meannegative radiative forcing of about−0.5 W m−2, being en-hanced by a factor of two or more by indirect effects of theparticles on clouds (IPCC, 2007). The anthropogenic aerosolfraction is made up of sulphates, nitrates, organics and blackcarbon that are continually produced by the use of fossil fu-els, biomass burning and agricultural practices. On shortertimescales volcanoes can be an important contributor to tro-pospheric and stratospheric aerosol loadings. Occasionallystrong explosive volcano eruptions can release large quanti-ties of sulphur dioxide (SO2) into the atmosphere. Especiallyif the volcanic SO2 is lofted to high altitudes in the tropicsa substantial fraction can reach the stratosphere where it isconverted into sulphate particles that also exert a negative ra-diative forcing. The strongest volcano eruption in the pastcentury was of Mt. Pinatubo in June 1991. Satellite datahave shown that about 10 million tonnes of sulphur (Mt S)reached the stratosphere, giving rise to a sulphate loading of30 Mt, about two orders of magnitude more than during vol-canically quiescent periods (McCormick et al., 1995). Theparticles were dispersed globally during a year or more afterwhich they were transported back into the troposphere wherethey are deposited to the surface on a timescale of about aweek. Studies of the Mt. Pinatubo eruption have providedmuch insight into the climate cooling influence of strato-spheric sulphur (see e.g.Robock, 2000) and also about the
Published by Copernicus Publications on behalf of the European Geosciences Union.

1240 C. Bruhl et al.: COS and stratospheric aerosol
performance of our model (see Sect. 3 and poster presentedat the EGU Assembly 2011,http://presentations.copernicus.org/EGU2011-6463presentation.ppt). Although strong vol-canic eruptions can dominate stratospheric particles for sev-eral years, in volcanically quiescent periods a much thinneraerosol layer persists, as discovered byJunge et al.(1961).Crutzen(1976) proposed that the conversion of COS into sul-phuric acid may contribute significantly to the non-volcanicstratospheric aerosol. On a global scale COS is the mostabundant sulphur gas in the atmosphere (Bandy et al., 1992;Mihalopoulos et al., 1991; Montzka et al., 2007; Barkley etal., 2008). Because COS is relatively inert in the troposphereit can be transported into the stratosphere where it is bro-ken down by photodissociation through the absorption of ul-traviolet sunlight (Turco et al., 1980; Crutzen, 1976). As arather long-lived trace gas its distribution is modulated bythe QBO in the tropical upwelling region. Theatmospherecontains many reduced and partly oxidised sulphur gases,the most important being SO2, hydrogen sulphide (H2S),dimethyl sulphide (DMS), COS and CS2. Most have sig-nificant anthropogenic sources, in particular SO2, which isreleased in large quantities from the combustion of coal. Theultimate reaction product of all sulphur species is sulphuricacid, which has a low volatility and largely condenses intosulphate particles, except for the upper stratosphere and themesosphere, where the most abundant sulphur species is SO2(e.g.Rinsland et al., 1995).
In the next section we present a brief overview of availableinformation about atmospheric COS, including sources, thechemical behaviour and atmospheric lifetime, while we referto the more comprehensive review bySPARC(2006) for de-tails. In the subsequent sections we present calculations withour chemistry-climate model EMAC of stratospheric aerosoland its forcings, and compute the global warming potentialof COS. We conclude by assessing the role of COS in thestratospheric sulphur budget and the overall climate effectsfrom anthropogenic emissions, including the chemically in-duced indirect effects through stratospheric aerosol.
2 Atmospheric budgets
Sulphur is an essential trace element for life on Earth, andits availability in the natural environment is usually not rate-limiting for the growth of organisms. One reason is thatsulphur is plentiful in seawater. Sulphate is the third mostabundant compound in sea salt with a dry mass fraction ofabout 7.7 %. Moreover, seawater is usually supersaturatedwith sulphur containing gases such as DMS. Also in naturalterrestrial ecosystems, for example tropical rainforests, sul-phur is usually not growth limiting owing to the atmospherictransport from the marine environment. It seems likely thatCOS may actually play a key role in “nourishing” the natu-ral terrestrial biosphere with sulphur, considering that there
is a strong correlation between COS uptake by the vegetationand CO2 assimilation (Sandoval-Soto et al., 2005).
Biological processes produce a range of reduced-sulphurgases (Andreae, 1990). The six most important are H2S,CS2, COS, CH3SH (methyl mercaptan), CH3SCH3 (DMS)and DMDS (dimethyl disulphide). Saline ecosystems suchas salt marshes and estuaries are particularly strong sources.The supersaturation of sulphur gases in the aqueous phaserelative to the overlying air is largely caused by the micro-bial degradation of organic matter.
Carbon disulphide is not very soluble and seawater is gen-erally supersaturated, so that the oceans are a CS2 source tothe atmosphere. Unfortunately, in situ observations both inthe atmosphere and the upper ocean are scarce (e.g.Blakeet al., 2004). Since ocean-atmosphere fluxes are calculatedwith models that use the measured concentrations in sea-water, the source estimates are rather uncertain. Althoughoceans and coastal regions represent the major source of CS2,anoxic soils and wetlands can also release significant quanti-ties. According toWatts(2000) andChin and Davis(1993)the largest anthropogenic contribution comes from the chem-ical industry, notably fiber production.
The data availability for COS is somewhat better, but alsofor this gas the source estimates are associated with substan-tial uncertainty. The emission categories of COS much re-semble those of CS2 although several additional sources needto be accounted for. For example, it has been observed thatrainwater is supersaturated with COS so that outgassing maybe significant. The analysis of rain and snow samples hasshown that COS is produced photochemically in precipita-tion (Mu et al., 2004). Further, the burning of biomass re-leases COS, as observed in the exhaust plumes from borealand savannah fires (Crutzen et al., 1979). Note that biomassburning is mostly anthropogenic and only a small fractionof the fires is ignited naturally by lightning (J. Goldammer,personal communication, 2011).
The oceans near the surface are generally COS supersatu-rated and thus release the gas to the atmosphere, mostly as afunction of the temperature-dependent hydrolysis in seawa-ter (Kettle et al., 2002). The flux of COS is therefore highestin high latitudes during summer, whereas in low latitudes theupper ocean can be undersaturated and act as a small sink.The atmospheric oxidation of reduced sulphur gases, in par-ticular DMS and CS2, also produces COS. Since oceans arean important source of DMS, they are also an indirect sourceof COS.
By considering the total sulphur source to the atmosphereit becomes evident that in the era of fossil fuel use and in-dustrialization the anthropogenic emission of SO2 has be-come a dominant factor in the atmospheric sulphur cycle(Lelieveld et al., 1997). The analysis of an Antarctic ice corehas provided evidence that COS has also increased due toanthropogenic activity (Montzka et al., 2004). Although at-mospheric COS has been rather constant at 450–500 pptv inthe past century, its mixing ratio has substantially increased
Atmos. Chem. Phys., 12, 1239–1253, 2012 www.atmos-chem-phys.net/12/1239/2012/

C. Bruhl et al.: COS and stratospheric aerosol 1241
Table 1. Global atmospheric budget of COS afterWatts(2000).
Annual fluxSources (Mt yr−1)
Open ocean 0.10± 0.15Coastal ocean (incl. salt marshes, estuaries) 0.20± 0.10Anoxic soils 0.02± 0.01Wetlands 0.03± 0.03Volcanism 0.05± 0.04Precipitation 0.13± 0.08DMS oxidation 0.17± 0.04CS2 oxidation (50 % anthropogenic) 0.42± 0.12Biomass burning 0.07± 0.05Anthropogenic (direct) 0.12± 0.06Total source 1.31± 0.25
Sinks
Oxic soils 0.92± 0.78Vegetation 0.56± 0.10Reaction with OH 0.13± 0.10(this work) 0.245± 0.035Reaction with O 0.02± 0.01(this work) 0.016± 0.001Photodissociation 0.03± 0.01(this work) 0.047± 0.006Total sink 1.66± 0.79(this work) 1.79± 0.79
Total imbalance 0.35± 0.83(this work) 0.48± 0.83
by about 35–40 % from approximately 350 pptv or less sincepre-industrial times (Sturges et al., 2001; Montzka et al.,2004; Aydin et al., 2008).
The global atmospheric COS budget has been estimatedin Table1, after Watts (2000). The budget is not balancedthough well within the uncertainty ranges, as also concludedby Kettle et al.(2002). Notholt et al.(2003) suggested thattropical biomass burning is a larger COS source than as-sumed previously, but even if it would be a factor of threelarger than in Table1 the budget implications would be mi-nor. However, a substantially larger source from the atmo-spheric oxidation of CS2, for example from coal-fired fur-naces in China and elsewhere, would have important conse-quences.
COS has a chemical lifetime of about 35 yr, and is gov-erned by reactions with OH, O and photodissociation. Oxi-dation by OH contributes to the seasonal cycle of COS in thetroposphere with a peak in spring and a minimum in fall.Furthermore, the removal of COS from the atmosphere isstrongly augmented through the consumption by the terres-trial biosphere. Plants can take up COS through the stomataand assimilate it even more efficiently than CO2 (Sandoval-Soto et al., 2005). In addition, it has been observed that es-pecially during the night, when the plant stomata are closed,
oxic soils can be an important sink for atmospheric COS(Kuhn et al., 1999; Steinbacher et al., 2004). The biologi-cal processes involved are dependent on temperature and hu-midity, which gives rise to strong diurnal and seasonal cycles,especially in middle and high latitudes (Kettle et al., 2002).Since the number of measurements is limited, it is difficult toestimate the sink strengths, especially of soils (Van Diest andKesselmeier, 2008).
Sandoval-Soto et al.(2005) have re-assessed the globalCOS uptake by terrestrial vegetation. They find that the rateof COS removal from the atmosphere is significantly largerthan of CO2. By scaling with net primary productivity datathey estimate a global COS sink of 0.69–1.40 Mt yr−1. Fur-thermore, since a COS molecule is irreversibly split withinthe plant tissue, in contrast to CO2 which can be releasedagain by respiration, the gross rather than the net primaryproductivity must be accounted for. The thus corrected sinkterm is much larger, 1.4–2.8 Mt yr−1. A recent model analy-sis of aircraft measurements of COS over the United Statedhas provided further evidence of a strong photosynthetic sink(Campbell et al., 2008). By invoking the latter estimate intoTable 1 the budget deficit increases by more than a factorof five, much beyond the uncertainty range given byWatts(2000). However, the budget could be brought into better bal-ance again by assuming a much larger COS source from CS2oxidation as associated with coal-fired furnaces. Althoughthese considerations will remain speculative until improveddatasets become available, there are indications that both thesource and sink terms of COS are substantially underesti-mated.
Due to its relatively long total effective lifetime of morethan two years (i.e. much longer than other S-compounds),some COS survives the slow transport from the tropical tro-posphere into the stratosphere where it is converted by pho-todissociation and reaction with O-atoms into SO2. The lat-ter is oxidised by OH via SO3 (Sander et al., 2006) intogaseous sulphuric acid, which binds water vapour and formsacidic aerosol particles, dependent on temperature and hu-midity. In the upper stratosphere sulphuric acid is present inthe gas phase since sulphate aerosols evaporate at the rela-tively high temperature and the low pressure. Its photolysisby visible and UV radiation (Vaida et al., 2003; Hintze et al.,2003; Mills , 2005) causes the mixing ratio of SO2 to increasewith altitude (Rinsland et al., 1995).
3 Chemistry-climate model results
To calculate the global transport fluxes and atmosphericchemistry-climate interactions we make use of computersimulations with the ECHAM5 general circulation model(Roeckner et al., 2006), coupled to the Modular Earth Sub-model System (MESSy,Jockel et al., 2006) AtmosphericChemistry (EMAC) model. The coupled EMAC model to-gether with the aerosol module GMXe (Pringle et al., 2010)
www.atmos-chem-phys.net/12/1239/2012/ Atmos. Chem. Phys., 12, 1239–1253, 2012

1242 C. Bruhl et al.: COS and stratospheric aerosol
Table 2. Parameters of the aerosol size distribution in GMXe.Nucleation mode only for soluble particles.
Mode Nucleation Aitken Accumulation Coarse
rmin,µm 0.0005 0.006 0.07 1σ 1.59 1.59 1.49 1.7
and the chemistry module MECCA (Sander et al., 2005) in-cludes a comprehensive account of tropospheric and strato-spheric dynamical, cloud, radiation, multiphase chemistry,emission and deposition processes. The aerosol moduleGMXe has 4 size modes for soluble and 3 for unsolubleaerosols with lognormal size distributions. Compared toPringle et al.(2010) the mode boundaries were adjustedto larger sizes and the sigma values were reduced to acco-modate both stratospheric and tropospheric aerosol, see Ta-ble 2. In the module we allow for nucleation, coagulationand evaporation using the sulphuric acid vapor pressure ap-proximation byVehkamaki et al. (2002). It includes alsoshrinking of particles, i.e. transfer to smaller modes due toevaporation. Accumulation and coarse mode particles areslowly transported to the troposphere by sedimentation usinga modified Walcek scheme (Benduhn, in preparation) withnegligible numerical diffusion. The model also considersdownward transport of sulphate by sedimentating solid po-lar stratospheric cloud particles. Lower boundary conditionsfor the different aerosol types are as described inPringle etal. (2010). Aerosol extinction is calculated from Mie theoryusing pre-calculated look-up tables for the 6 aerosol com-ponents water, water soluble species, organic carbon, blackcarbon, dust and sea salt. The radiation module can performadditional diagnostic calculations of radiative forcing for dif-ferent aerosol options. In this study the GMXe-calculatedaerosol does not feed back to the model dynamics whichwould affect the climate. Scavenging of soluble gases andaerosol particles by droplets and ice is included. The icephase scavenging rates by impaction and nucleation are de-pendent on temperature, precipitation flux and cloud cover.
We apply the model at T42 resolution, i.e. about 2.8◦ inlatitude and longitude. The vertical grid structure resolvesthe lower and middle atmosphere with 90 layers from thesurface to a top layer centred at 0.01 hPa (Giorgetta et al.,2006). This model configuration was selected because it ex-plicitly represents stratosphere-troposphere interactions andhas been extensively tested and documented (Lelieveld et al.,2007; Jockel et al., 2006). The configuration is also ableto generate a self-consistent quasi-biennial oscillation in thetropical stratosphere.
The period January 1999 to September 2002 was selectedto allow for comparison with SAGE satellite observationsduring a period when volcanic eruptions had only minor in-fluence, i.e. close to “background” stratospheric conditions.The model was initialized in January 1996 using observed
Fig. 1. Time series of COS mixing ratios (in pptv) simulatedby EMAC. Upper panel: tropics, colors and altitude range as inBarkley et al.(2008). Lower panel: boundary layer.
meteorology and distributions of long-lived chemical speciesincluding COS from the Mainz chemical 2D-model (Grooßet al., 1998; Andersen et al., 2006). The first 3 yr are consid-ered as spinup. As inJockel et al.(2006), the phases of theQBO stay close to observations for at least the first 7 yearsso that direct comparisons of chemical species distributionswith satellite data are possible.
Considering that the source and sink terms of COS arerather uncertain, we apply measurements from a global net-work as surface boundary conditions in the model. Since theyear 2000 the National Oceanic and Atmospheric Adminis-tration (NOAA) has monitored COS in a global flask sam-pling programme based on 12 measurement stations, mostlylocated in background locations on islands and remote conti-nental sites (Montzka et al., 2007). The flasks are filled whenthe wind is from a pre-defined clean air sector to prevent in-fluences by local pollution sources.
The measurements and consequently our model results(Fig. 1, lower panel) show that the mean mixing ratio in theNorthern Hemisphere, 470–480 pptv, is slightly lower thanin the Southern Hemisphere, 490 pptv, with little interan-nual variability. Note that some analyses indicated a slowdecrease of atmospheric COS since the 1980s (Sturges etal., 2001; Rinsland et al., 2002), whereas recent data showa slight upward trend (Montzka et al.(2007), and more re-cent data on the corresponding website). The slight decreasefollowed by an increase is also seen in Space Shuttle andsatellite data of the subtropical lower stratosphere (Rinslandet al., 2008). The annual mean COS mixing ratios in back-ground locations typically vary within 0.48±0.04 ppbv. Thehighest mean values occur in low latitudes. At middle andlow latitudes in the Southern Hemisphere the mixing ratios
Atmos. Chem. Phys., 12, 1239–1253, 2012 www.atmos-chem-phys.net/12/1239/2012/

C. Bruhl et al.: COS and stratospheric aerosol 1243
Fig. 2. Simulated zonal mean COS mixing ratios (in pptv) for September to November 1999 and March to May 2001 (left). ACE observationsfor SON 2006 and MAM 2005 (taken fromBarkley et al.(2008), data of their Fig. 3, right).
are slightly lower, whereas the lowest mean levels occur inthe Northern Hemisphere in fall.
Our model calculates an air mass flux across the tropicaltropopause (at 100 hPa, 20◦ S to 20◦ N) of 2.78×10⁸ Mt yr−1.Based on a mean COS mixing ratio of 0.48 ppbv at this al-titude (Fig. 1, upper panel and Fig.2) this translates intoa mass flux into the stratosphere of about 0.15 Mt S yr−1,comparable to previous estimates of the total sulphur flux(SPARC, 2006). The model results demonstrate that dur-ing boreal winter the upward transport predominantly occurssouth of the equator, to a large extent over the western Pa-cific. In summer upward fluxes are also rather strong overthe western Pacific north of the equator and over the Asianmonsoon. If Southeast Asia would be a significant sourceof CS2 and COS, as indicated by the measurements ofBlakeet al. (2004), this could directly impact the COS flux intothe stratosphere through rapid upward transport in the mon-soon season.Notholt et al.(2003) measured enhanced COSconcentrations in the tropical upper troposphere, which theyattributed to tropical biomass burning. Direct and seasonalCOS measurements over the South Asian monsoon, wherethe upward fluxes reach a maximum, and at the tropicaltropopause in other locations would provide the information
needed to establish if enhanced COS affects the stratosphereand thus help test our model results. COS is most abundantin the tropics and has a significant seasonal variability, beingmost pronounced in the Horthern Hemisphere.
Consistent with observations, the model results show rel-atively high COS mixing ratios in the tropics at the surfacewhich extend up to about 16 km altitude near the tropopause.Notholt et al.(2003) observed COS mixing ratios in excessof 0.5 ppbv between 8 and 16 km altitude, though their mea-surements were limited to the Atlantic Ocean and to rela-tively short periods during and after the biomass burning sea-son. If the measurements ofNotholt et al.(2003) would berepresentative for the entire year and globe, we would un-derestimate COS at the tropical tropopause and its transportinto the stratosphere by about 20–25 %. However, the ev-idence for an upper tropospheric COS maximum is mixed,only partly corroborated by Space Shuttle measurements inthe 1990s (SPARC, 2006). Moreover, measurements overthe Pacific Ocean at 10–12 km altitude give no evidence ofenhanced COS (Blake et al., 2004).
Recent satellite observations by ACE-FTS show up toabout 0.45 ppbv COS near the tropopause (Barkley etal., 2008), slightly lower than indicated by our model
www.atmos-chem-phys.net/12/1239/2012/ Atmos. Chem. Phys., 12, 1239–1253, 2012

1244 C. Bruhl et al.: COS and stratospheric aerosol
Fig. 3. SOx production from COS, pptv day−1, September 1999 (SOx = SO2+SO3+SO+SH+S). Upper left: photolysis, upper right: reactionwith O(3P), lower left: reaction with OH, lower right: total.
simulations (Fig.2) based on the observed surface concen-trations. The model reproduces the modulation by the QBOleading to interannual variability of the the stratospheric sul-phur source as shown in the two examples for the differentQBO phases and seasons discussed later. Unfortunately, forthe selected years no satellite observations are available butfor the long-lived COS with only small longterm trends itshould be appropriate to compare with the later years shownin Barkley et al.(2008) for similar QBO-phases and seasons.The simulated COS mixing ratios appear to be 5 to 10 % highcompared to the ACE-observations ofBarkley et al.(2008),though comparisons with balloon observations indicate thata low bias of the satellite data in the same range cannot beexcluded.
Figure3 shows the production rates of inorganic sulphurfrom COS, indicating that photolysis is dominating. Theintegrated photochemical sink as calculated by EMAC is0.3 Mt yr−1 which corresponds to the upper limit ofWatts(2000) in Table 1. Their value, however, is based on a rathersimple model estimate. In the stratosphere (above 100hPa)about 0.065 Mt yr−1 of COS is converted to aerosol. In theabsense of sinks it would take about 1 to 2 yr to reach the
observed sulphate concentrations. In our simulations wherestratospheric mixing ratios of SO2, gaseous H2SO4 and sul-phate aerosol were initialized from zero and the ones of COSwith about the observed distributions (January 1996), most ofthe stratospheric aerosol layer forms in the first year. It takesabout 3 simulated years to reproduce also the gaseous inor-ganic sulphur species in the middle and upper stratosphereclose to observations due to the long transport times.
In Fig. 4 it is illustrated that the sharp vertical gradientof COS in the stratosphere coincides with a sharp increaseof particulate sulphuric acid with altitude (cf. Fig.2). Theright panel, for another season and QBO phase, shows largedifferences in the distribution of sulphate compared to theleft panel in the tropics but again good agreement of the pat-terns with observations. Sulphate from COS appears to ac-count for about 65 to 75 % of the observed aerosol as derivedfrom SAGE observations (e.g.Thomason et al., 1997). Inthe lower stratosphere organic carbon aerosol from biomassburning (emission seePringle et al., 2010) appears to con-tribute significantly to aerosol surface area density and mix-ing ratios. Figure5 shows the temporal evolution of simu-lated sulphate aerosol in the tropics after 3 years of spinup,
Atmos. Chem. Phys., 12, 1239–1253, 2012 www.atmos-chem-phys.net/12/1239/2012/

C. Bruhl et al.: COS and stratospheric aerosol 1245
Fig. 4. Simulated (upper panels) and observed (lower panels, derived from SAGE) sulphate aerosol in September 1999 (left) and March2001 (right), ppbv. The middle panels includes simulated organic carbon aerosol (mostly from biomass burning, mass weighted). Note thatthe color scale of the model covers only 67 % of the range of the one for the observations to account for the model’s low bias and to allowfor more convenient comparisons of patterns.
modulated by the QBO (black contours show zonal wind) to-gether with aerosol mixing ratios derived from SAGE data(without extrapolations for data gaps) using the empiricalformula byGrainger et al.(1995) to convert aerosol surfacearea density into sulphate mixing ratios. Our model results,which yield a maximum sulphate mixing ratio of 0.35 ppbin the tropics, are consistent with the satellite measurements(SAGE), including the modulation by the QBO. Simulatedsulphate aerosol from COS explains on average 70 % of theobserved stratospheric aerosol burden of 45 kt S above 20 km(see Supplement).
The model results indicate that dust and especially organiccarbon aerosol also contribute to the aerosol in the lower-most stratosphere as also mentioned in the SAGE evaluationby Thomason et al.(2008) and in the compilation of in situobservations byMurphy et al.(2007). Including organic car-bon reproduces most of the seasonal patterns observed bySAGE in the lower stratosphere (Fig.5). This holds also forthe aerosol burden above 16 km (or 100 hPa) where simu-lated sulphate is 40 to 50 kt S and organics about 10 to 15 kt,compared to about 80 kt (total as S) derived from SAGE(see Supplement). Note that aerosol water, which contributes
www.atmos-chem-phys.net/12/1239/2012/ Atmos. Chem. Phys., 12, 1239–1253, 2012

1246 C. Bruhl et al.: COS and stratospheric aerosol
Fig. 5. Simulated (upper panel) and SAGE satellite derived (lowerpanel) sulphate aerosol in the tropics, ppbv. Black contours give thezonal wind (QBO), in steps of 20 m s−1, beginning with−30 m s−1
(dotted contours negative or easterlies). The middle panel includessimulated organic carbon aerosol. Range of color scales as in Fig.4
about 15 to 30 % to the observed mass (G. Yue, NASA Lan-gley, personal communication at AGU meeting 2011) intro-duces uncertainties in the conversion formula from extinctionto sulphate volume mixing ratio. EMAC-results for a widerlatitude range and for mode radii and number concentrationsare given in the Supplement.
As shown in Fig.6, above about 10 hPa (about 30 km) or atemperature of 233 K most of the simulated sulphur is in thegas phase. In the middle stratosphere H2SO4 vapor is mostabundant. Near the stratopause (and higher up) SO2 is thedominating species with about 0.1 ppbv as observed by AT-MOS (Rinsland et al., 1995). Near the tropical tropopauseSO2 is close to absent due to oxidation and scavenging bysedimenting ice particles. At about 30 km SO2 shows a smallsecondary maximum related to its production from COS pho-tolysis (see Fig.3).
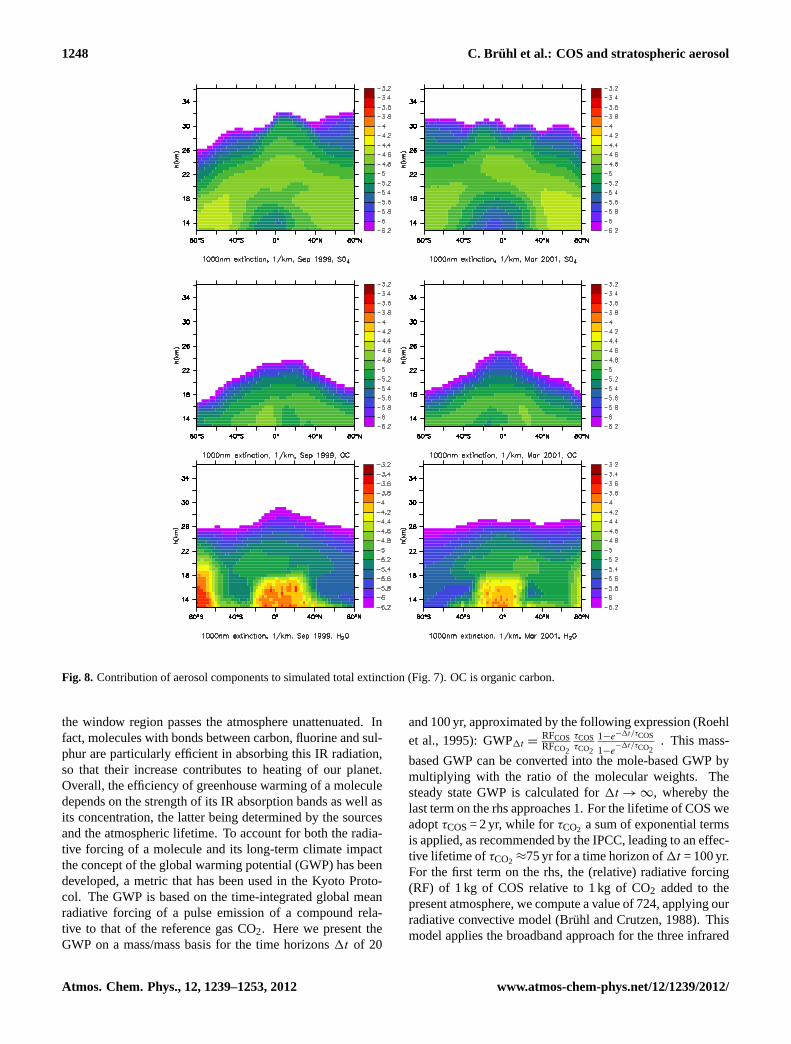
The calculated total aerosol extinction at 1000 nm in Fig.7also agrees well and is consistent (i.e. low by about 30–40 %)with observations of SAGE (SPARC, 2006). This holdsalso for extinction at 530 nm (not shown). The largest un-derestimates of about 50 % occur around 23 km altitude inthe tropics. The dominating contributions to total extinction
Fig. 6. Simulated gaseous H2SO4 and SOx (mostly SO2) in thetropics, ppbv. The contours in the upper panel show mean temper-atures of 230 and 240 K, the region where sulphate aerosol evapo-rates.
are sulphate, aerosol water and organic carbon as shown inFig. 8. Dust contributes in the upper northern tropical tro-posphere. The calculated extinction at 2450 nm is also con-sistently about 35 % low compared to HALOE in the Jungelayer if the refractive indices of sulphuric acid as inHerviget al. (1996) are used in the Mie lookup tables (using am-monium sulphate for water soluble aerosol here leads to anunderestimate of more than 60 %). Figure7 furthermore sug-gests that our model underestimates aerosol extinction in theupper stratosphere. It is conceivable that an assumed fluxof meteoric dust of about 0.01–0.02 Mt yr−1 (SPARC, 2006)would compensate this “missing” aerosol source in the up-per stratosphere and by about half in the lower and middlestratosphere.
Atmos. Chem. Phys., 12, 1239–1253, 2012 www.atmos-chem-phys.net/12/1239/2012/

C. Bruhl et al.: COS and stratospheric aerosol 1247
Fig. 7. Simulated (upper panels) and observed (lower panels) aerosol extinctions at 1000 nm (decadal logarithm) for September 1999 (left)and March 2001 (right). Color scale for model shifted by one step to account for low bias (65 %, Fig.4).
In the model ofWeisenstein et al.(1997), which was alsoused bySPARC(2006), SO2 mixing ratios of 40–50 ppt wereprescribed in air transported into the stratosphere. Further-more additional small fluxes of other short-lived gases suchas CS2 and H2S were included. This seems at odds withmeasured SO2 mixing ratios in the background upper tro-posphere, which are generally below 10–20 ppt (Thorntonet al., 1999). In fact, upward transport through the tropicaltropopause layer (12–18 km altitude) is very slow and the airmass residence time is several months. The chemical lifetimeof SO2 through reaction with OH in the tropical tropopauselayer is about two weeks and that of CS2, H2S and DMS onlya few days. Therefore it seems unlikely that short-lived sul-phur gases could survive oxidation into H2SO4 and be trans-ported into the stratosphere. Furthermore, H2SO4 has a lowvolatility and quickly deposits onto the surfaces of ice crys-tals, ubiquitously present in the tropical tropopause layer.Since less than 1 % of the water that enters the tropopauselayer at 12 km actually reaches the stratosphere at 18 km,associated with the “freeze-drying” of the cold tropopause,most water is removed by the sedimentation of ice particles,which also prevents sulphuric acid to reach the stratosphere(due to scavenging). Our results are thus consistent with thehypothesis ofCrutzen(1976) andTurco et al.(1980) that atleast about 70 % of the stratospheric sulphate layer in vol-
canically quiescent periods is controlled by the oxidation ofCOS.
For evaluation we also performed a simulation with a su-perimposed injection of SO2 at altitudes and latitudes corre-sponding to the distribution of observed Pinatubo aerosol inSeptember 1991. The model correctly simulates the transfor-mation to sulphate aerosol, including its optical properties.The removal of the volcanic aerosol in the first 6 months ap-pears to be somewhat too fast as in earlier studies (e.g.Timm-reck et al., 1999) due to sedimentation of coarse particles,showing the limitations of applying the 7 mode aerosol mod-ule GMXe in both the troposphere and stratosphere. A paperon these results and on the effects of recent tropical eruptions(Vernier et al., 2011) on the Junge layer is in preparation.
4 Climate effects
4.1 Global warming potential
Some trace constituents in the atmosphere, in particular halo-carbons and COS, have infrared (IR) absorption bands in the8–14 µm wavelength region, the atmospheric window, and asa consequence they can efficiently enhance the greenhouseeffect. Gases such as CO2 and water vapour absorb at longerIR wavelengths, so that 60–80 % of the radiation emitted in
www.atmos-chem-phys.net/12/1239/2012/ Atmos. Chem. Phys., 12, 1239–1253, 2012
1248 C. Bruhl et al.: COS and stratospheric aerosol
Fig. 8. Contribution of aerosol components to simulated total extinction (Fig.7). OC is organic carbon.
the window region passes the atmosphere unattenuated. Infact, molecules with bonds between carbon, fluorine and sul-phur are particularly efficient in absorbing this IR radiation,so that their increase contributes to heating of our planet.Overall, the efficiency of greenhouse warming of a moleculedepends on the strength of its IR absorption bands as well asits concentration, the latter being determined by the sourcesand the atmospheric lifetime. To account for both the radia-tive forcing of a molecule and its long-term climate impactthe concept of the global warming potential (GWP) has beendeveloped, a metric that has been used in the Kyoto Proto-col. The GWP is based on the time-integrated global meanradiative forcing of a pulse emission of a compound rela-tive to that of the reference gas CO2. Here we present theGWP on a mass/mass basis for the time horizons1t of 20
and 100 yr, approximated by the following expression (Roehl
et al., 1995): GWP1t =RFCOSRFCO2
τCOSτCO2
1−e−1t/τCOS
1−e−1t/τCO2
. This mass-
based GWP can be converted into the mole-based GWP bymultiplying with the ratio of the molecular weights. Thesteady state GWP is calculated for1t → ∞, whereby thelast term on the rhs approaches 1. For the lifetime of COS weadoptτCOS= 2 yr, while forτCO2 a sum of exponential termsis applied, as recommended by the IPCC, leading to an effec-tive lifetime ofτCO2 ≈75 yr for a time horizon of1t = 100 yr.For the first term on the rhs, the (relative) radiative forcing(RF) of 1 kg of COS relative to 1 kg of CO2 added to thepresent atmosphere, we compute a value of 724, applying ourradiative convective model (Bruhl and Crutzen, 1988). Thismodel applies the broadband approach for the three infrared
Atmos. Chem. Phys., 12, 1239–1253, 2012 www.atmos-chem-phys.net/12/1239/2012/

C. Bruhl et al.: COS and stratospheric aerosol 1249
bands of COS at 522, 859 and 1047 cm−1 with bandstrengths24.9, 72.3 and 24.4 cm−2 atm−1 using spectra from our labo-ratory (J. Crowley, personal communication, 2008). Overlapwith other gases and the decrease of mixing ratio with alti-tude due to chemistry are taken into account. For the CFCsthe calculated radiative forcing of this model is rather simi-lar to ECHAM5. By inserting the above mentioned lifetimeswe obtain a GWP of COS of 97 for1t = 20 yr, and of 27 for1t = 100 yr (note that this translates into molar GWPs of 132and 36 for time horizons of1t = 20 and 100 yr, respectively).
By using the model calculated forcing of 0.5ppbv COSof 0.008 W m−2 and the information from ice cores aboutthe natural atmospheric mixing ratio of COS, being 70 %of the present level, we calculate that the human-inducedenhancement of COS exerts a radiative forcing of about0.003 W m−2. As discussed above, the uptake by the bio-sphere limits the lifetime of COS in the atmosphere. Basedon the chemical lifetime alone (35 yr) the GWP would benearly 17 times higher for a time horizon of1t = 100. Ofcourse, the biosphere-controlled lifetime also limits transportto the stratosphere where COS also exerts a radiative forcing.
The stratospheric breakdown of COS into SO2 and sul-phuric acid is followed by the formation of aerosol particlesthat grow by the continued deposition of H2SO4 and coag-ulation. The latter process levels off at a steady state effec-tive particle radius (i.e. surface area weighted) of approxi-mately 0.3 µm (SPARC, 2006), also because of sedimenta-tion. Particles of this size effectively interact with solar radi-ation, because the solar spectrum has an energy maximum ata wavelength of about 0.5 µm. Hence the solar radiation scat-tering by sulphuric acid particles can substantially reduce theamount of energy that reaches the surface and exerts a nega-tive radiative forcing. Note that even though the mean effec-tive radius of the particles is 0.1 to 0.2 µm, some can be larger(>0.6 µm) and also absorb solar near-infrared (IR) radiation,which locally warms the stratosphere and adds to the neg-ative forcing in the troposphere. However, the latter effectis moderated by the presence of clouds and water vapour inthe troposphere (which effectively absorb near-IR radiation).If the particles were even larger, notably>2 µm, they wouldabsorb terrestrial IR radiation and enhance the greenhouseeffect. These radiative effects have been investigated in de-tail based on the measured and modelled impact of the Mt.Pinatubo eruption on the stratosphere (Minnis et al., 1993;Stenchikov et al., 1998). The observed global mean opticaldepth of the stratospheric aerosol was about 0.1 in the yearfollowing the eruption, and the associated net visible and IRradiative forcing was largely negative, about−0.7 W m−2,except over the winter poles where the absence of solar radi-ation allowed the small longwave forcing effect to dominate.The Pinatubo aerosol caused a temporary global temperaturedecrease of about 0.5◦C (McCormick et al., 1995). Thesedata can be used here because the aerosol radiative forcingscales approximately with the optical depth, so that the cli-mate effects by stratospheric COS can be derived.
The stratospheric sulphur loading by the Mt. Pinatuboeruption was≈10 Mt S, while the sulphur mass in the back-ground stratospheric sulphate aerosol is about 0.15 Mt S.The latter corresponds to a mean background aerosol opti-cal depth of 0.003. Since COS controls the abundance ofthe non-volcanic aerosol layer, we derive a negative radiativeforcing of −0.02 W m−2. This back of the envelope num-ber agrees with the global average of the forcing simulatedby EMAC at the top of the atmosphere in Fig.9. In EMACthis quantity was calculated diagnostically from additionalcalls of the radiation module with stratospheric aerosol above100 hPa only and without any aerosol. It should be empha-sized that this is not really a “forcing” of the COS-derivedaerosol because it reflects the long-term background condi-tion of the atmosphere, which is to a large degree natural.Again we can use the information from ice cores about pre-industrial COS levels (Montzka et al., 2004), assuming thatthe difference with present-day levels is anthropogenic, be-ing about 30 % (Table1). It follows that the human-inducedenhancement of the background stratospheric aerosol exertsa negative radiative forcing of about−0.007 W m−2, whichactually exceeds the positive forcing of COS by more thana factor of two. Since the e-folding lifetime of stratosphericaerosol is about one year (thus half ofτCOS) the global “cool-ing” potential of COS through stratospheric aerosol forma-tion is equivalent to the above derived GWP. Therefore, if weaccount for indirect chemical effects in GWP calculations,also customary for gases such as methane (IPCC, 2007), itfollows that COS has almost no net climate impact. Thisalso applies to the precursor gas CS2, which has a very shortlifetime and an insignificant GWP.
The average forcing by stratospheric background aerosolat 185hPa (approximately the tropopause) is−0.09 W m−2.A large fraction of that is due to organic carbon aerosol (in-cluding black carbon) near the tropical tropopause. Figure9shows that this forcing is strongly influenced by the large lo-cal variability due to clouds and surface albedo. The largestnegative forcing is in subtropical regions with clear skiesand a low surface albedo, i.e. over the oceans. Figure9demonstrates also that the shortwave forcing of stratosphericaerosol at the top of the atmosphere differs considerably fromthat at the tropopause.
4.2 Uncertainties
It appears that the EMAC model tends to overestimate thetransport of particulate sulphate and SO2 from the tropicsto midlatitudes in the lowermost stratosphere especially inthe summer hemisphere. This leads to too fast removal ofstratospheric aerosol. Assuming that this model deficiencyis responsible for about half of the difference to aerosolobservations, the negative forcing of aerosol related to an-thropogenic COS would be about−0.0085 W m−2 with theconsequence that the cooling would slightly dominate thegreenhouse warming. According to T. Johnson of PNNL the
www.atmos-chem-phys.net/12/1239/2012/ Atmos. Chem. Phys., 12, 1239–1253, 2012

1250 C. Bruhl et al.: COS and stratospheric aerosol
Fig. 9. Solar radiative forcing of stratospheric aerosol (above 110 hPa) at the top of the atmosphere (upper panels) and at 185 hPa (middlepanels). The lower panels show the average total effective cloud cover in the troposphere.
bandstrengths of COS in the infrared window used for thisstudy might be about 40 % high. Taking this into account,the infrared forcing of anthropogenic COS would be reducedto 0.002 W m−2, leading to a dominance of the cooling fromthe induced aerosol. This would also reduce the direct GWPof COS to 58 and 16 for the time horizons of 20 and 100 yr.However, there are only very few measurements of IR COS-spectra available.
Another source of uncertainty is the wide range of refrac-tive indices for water soluble aerosol available in the litera-ture. For radiative forcing there are often compensating ef-fects from different spectral regions so that the net effect israther small (of the order of 10 %), however, for compari-son with satellite extinction data, it is important to use spec-
tra of refractive indices consistent with the retrieval. Hereit should be distinguished between stratospheric and tropo-spheric aerosol, but using the refractive indices of ammo-nium sulphate can be a good compromise (if the focus is noton details in the near infrared). Nevertheless, there is a needfor a new compilation of aerosol refractive indices to reduceuncertainties.
5 Conclusions
Carbonyl sulphide, an efficient greenhouse gas, is the mostabundant sulphur gas in the atmosphere. Its anthropogenicemissions and that of CS2, the latter being converted intoCOS, contribute approximately 30 % to the global COS
Atmos. Chem. Phys., 12, 1239–1253, 2012 www.atmos-chem-phys.net/12/1239/2012/
C. Bruhl et al.: COS and stratospheric aerosol 1251
mixing ratio of about 0.5 ppbv. By applying surface mea-surements of COS from a global network of 12 stationsas boundary conditions, our chemistry-climate model repro-duces the atmospheric COS cycle well. The observationaldatabase for COS, CS2 and SO2, especially for the tropi-cal tropopause layer (12–18 km altitude), is presently insuffi-cient for a conclusive evaluation of the sulphur cycle and as-sociated aerosol production in the background stratosphere,i.e. during volcanically quiescent periods. Nevertheless, wepresent compelling evidence that COS plays a controllingrole, as stated byCrutzen(1976) andTurco et al.(1980). OurEMAC model results indicate that the COS controlled sul-phur flux into the stratosphere is about 0.15 Mt S yr−1 withabout 0.035 Mt S yr−1 converted to aerosol, whereas in pre-vious evaluations the same flux of S was obtained assum-ing direct transport of SO2, CS2 and H2S across the tropi-cal tropopause. We consider the latter assumption to be un-likely and not needed to explain observations of the back-ground stratospheric aerosol. Our chemistry climate modelEMAC with aerosol module is able to reproduce most ofthe features observed by SAGE, including the modulation ofstratospheric aerosol by the QBO and the seasonal effects,and non-sulphate compounds. It also reproduces SO2 in theupper stratosphere observed by ATMOS on the Space Shut-tle. We compute the climate effects and the global warmingpotential (GWP) of COS, which accounts for the radiativeforcing as well as the atmospheric lifetime. The direct IR ra-diative forcing by 1 kg of COS, i.e. the enhancement of thegreenhouse effect, is 724 times that of 1 kg CO2, using ourchemical radiative convective model. Based on a 30 % con-tribution of human-induced emissions to COS in the presentatmosphere, the IR radiative forcing of anthropogenic COSis 0.003 W m−2. The GWP of COS over time horizons of20 and 100 yr is GWP(20 yr) = 97 and GWP(100 yr) = 27, re-spectively. However, through its contribution to stratosphericaerosols COS also exerts a radiative cooling forcing, whichamounts to about−0.007 W m−2 in EMAC, more than twicethe warming forcing. Since the atmospheric lifetime of COSis about 2 yr and the COS-derived aerosol lifetime time only1 yr, the opposing climate effects tend to cancel and the netGWP of COS is insignificant. This also applies to CS2 inview of its very short atmospheric lifetime of a few days andits partial conversion to COS. Taking into account that theCOS IR spectra used in this study are at the high end, thecooling effect of COS-derived aerosol might dominate.
Supplement related to this article is available online at:http://www.atmos-chem-phys.net/12/1239/2012/acp-12-1239-2012-supplement.pdf.
Acknowledgements.We thank Kirsty Pringle of the University ofLeeds, UK, who contributed to the development of the aerosolmodule. Also we thank our colleagues of MPI for Chemistry,Francois Benduhn for providing his yet unpublished sedimentationscheme and Swen Metzger for the aerosol thermodynamics scheme
EQSAM. We thank M. Barkley of University of Leicester, UK, andP. Bernath of University of York, UK, for providing the ASCII-dataof their Fig. 3 on ACE-FTS-COS observations. We further thankLamont Poole and Larry Thomason of NASA Langley ResearchCenter, Hampton, USA, for their advice on SAGE data. Theresearch leading to these results has received funding from theEuropean Research Council under the European Union’s SeventhFramework Programme (FP7/2007-2013)/ERC grant agreementno. 226144.
The service charges for this open access publicationhave been covered by the Max Planck Society.
Edited by: P. Stier
References
Andersen, S.B., Weatherhead, E. C., Stevermer, A., Austin, J.,Bruhl, C., Fleming, E. L., de Grandpre, J., Grewe, V., Isaksen,I., Pitari, G., Portmann, R. W., Rognerud, B., Rosenfield, J. E.,Smyshlayev, S., Nagashima, T., Velders, G. J. M., Weisenstein,D. K., and Xia, J.: Comparison of recent modeled and observedtrends in total column ozone, J. Geophys. Res., 111, D02303,doi:10.1029/2005JD006091, 2006.
Andreae, M. O.: Ocean-atmosphere interactions in the global bio-geochemical sulphur cycle, Marine Chem., 30, 1–29, 1990.
Aydin, M., Williams, M. B., Tatum, C., and Saltzman, E. S.:Carbonyl sulfide in air extracted from a South Pole ice core:a 2000 year record, Atmos. Chem. Phys., 8, 7533–7542,doi:10.5194/acp-8-7533-2008, 2008.
Bandy, A. R., Thornton, D. C., Scott, D. L., Lalevic, M., Lewis, E.E., and Driedger III, A. R.: A time series for carbonyl sulfide inthe Northern Hemisphere, J. Atmos. Chem., 14, 527–534, 1992.
Barkley, M. P., Palmer, P. I., Boone, C. D., Bernath, P. F., andSuntharalingam, P.: Global distributions of carbonyl sulfide inthe upper troposphere and stratosphere, Geoph. Res. Lett., 35,L14810,doi:10.1029/2008GL034270, 2008.
Blake, N.J., Streets, D. G., Woo, J.-H., Simpson, I. J., Green, J.,Meinardi, S., Kita, K., Atlas, E., Fuelberg, H. E., Sachse, G., Av-ery, M. A., Vay, S. A., Talbot, R. W., Dibb, J. E., Bandy, A. R.,Thornton, D. C., Rowland, F. S., and Blake, D. R.: Carbonyl sul-fide and carbon disulfide: Large-scale distributions over the west-ern Pacific and emissions from Asia during TRACE-P, J. Geo-phys. Res., 109, D15S05,doi:10.1029/2003JD004259, 2004.
Bruhl, C., and Crutzen, P. J.: Scenarios of possible changes in at-mospheric temperatures and ozone concentrations due to man’sactivities, estimated with a one-dimensional coupled photochem-ical climate model, Clim. Dynam., 2, 173–203, 1988.
Campbell, J. E., Carmichael, G. R., Chai, T., Mena-Carrasco, M.,Tang, Y., Blake, D. R., Blake, N. J., Vay, S. A., Collatz, G. J.,Baker, I., Berry, J. A., Montzka, S. A., Sweeney, C., Schnoor,J. L., and Stanier, C. O.: Photosynthetic control of atmosphericcarbonyl sulfide during the growing season, Science, 322, 1085–1088, 2008.
Chin, M. and Davis, D. D.: Global sources and sinks of OCS andCS2 and their distributions, Global Biogeochem. Cy., 7, 321–337, 1993.
Crutzen, P. J.: The possible importance of CSO for the sulphatelayer of the stratosphere, Geophys. Res. Lett., 3, 73–76, 1976.
www.atmos-chem-phys.net/12/1239/2012/ Atmos. Chem. Phys., 12, 1239–1253, 2012

1252 C. Bruhl et al.: COS and stratospheric aerosol
Crutzen, P. J., Heidt, L. E., Krasnec, J. P., Pollock, W. H., and Seiler,W.: Biomass burning as a source of atmospheric gases: CO, H2,N2O, NO, CH3Cl, and COS, Nature, 282, 253–256, 1979.
Giorgetta, M. A., Manzini, E., Roeckner, E., Esch, M., and Bengts-son, L.: Climatology and forcing of the quasi-biennial oscillationin the MAECHAM5 model, J. Climate, 19, 3882–3901, 2006.
Grainger, R. G., Lambert, A., Rodgers, C. D., Taylor, F. W., andDeshler, T.: Stratospheric aerosol effective radius, surface areaand volume estimated from infrared measurements, J. Geophys.Res., 100, 16507–16518, 1995.
Grooß, J. U., Bruhl, C., and Peter, T.: Impact of aircraft emissionson tropospheric and stratospheric ozone Part I: Chemistry and2-D model results, Atmos. Environ., 32, 3173–3184, 1998.
Hervig, M. E., Russell III, J. M., Gordley, L. L., Park, J. H.,Drayson, S. R., and Deshler, T.: Validation of aerosol measure-ments from the Halogen Occultation Experiment, J. Geophys.Res., 101, 10267–10275, 1996.
Hintze, P. E., Kjaergaard, H. G., Vaida, V., and Burkholder, J. B.:Vibrational and electronic spectroscopy of sulfuric acid vapor, J.Phys. Chem. A, 107, 1112–1118, 2003.
Intergovernmental Panel on Climate Change (IPCC), ClimateChange 2007: The Physical Science Basis, edited by: Solomon,S., Qin, D., Manning, M., Marquis, M., Averyt, K. B., Tignor,M., Miller, H. L., and Chen, Z., Cambridge University Press,Cambridge, UK, and New York, NY, USA, 1–234, 2007.
Jockel, P., Tost, H., Pozzer, A., Bruhl, C., Buchholz, J., Ganzeveld,L., Hoor, P., Kerkweg, A., Lawrence, M. G., Sander, R., Steil,B., Stiller, G., Tanarhte, M., Taraborelli, D., van Aardenne, J.,and Lelieveld, J.: The atmospheric chemistry general circulationmodel ECHAM5/MESSy: Consistent simulation of ozone fromthe surface to the mesosphere, Atmos. Chem. Phys., 6, 5067–5104,doi:10.5194/acp-6-5067-2006, 2006.
Junge, C. E., Chagnon, C. W., and Manson, J. E.: Stratosphericaerosols, J. Meteorol., 18, 81–108, 1961.
Kettle, A. J., Kuhn, U., von Hobe, M., Kesselmeier, J., and Andreae,M. O.: Global budget of atmospheric carbonyl sulphide: Tempo-ral and spatial variations of the dominant sources and sinks, J.Geophys. Res., 107, 4658,doi:10.1029/2002JD002187, 2002.
Kuhn, U., Ammann, C., Wolf, A., Meixner, F. X., Andreae, M. O.,and Kesselmeier, J.: Carbonyl sulphide exchange on an ecosys-tem scale: soil represents a dominant sink for atmospheric COS,Atmos. Environ., 33, 995–1008, 1999.
Lelieveld, J., Roelofs, G. J., Ganzeveld, L., Feichter, J., and Rodhe,H.: Terrestrial sources and distribution of atmospheric sulphur,Phil. Trans. R. Sic. London, B, 352, 149–158, 1997.
Lelieveld, J., Bruhl, C., Jockel, P., Steil, B., Crutzen, P. J., Fis-cher, H., Giorgetta, M. A., Hoor, P., Lawrence, M. G., Sausen,R., and Tost, H.: Stratospheric dryness: model simulationsand satellite observations, Atmos. Chem. Phys., 7, 1313–1332,doi:10.5194/acp-7-1313-2007, 2007.
McCormick, M. P., Thomason, L. W., and Trepte, C. R.: Atmo-spheric effects of the Mt. Pinatubo eruption, Nature, 373, 399–404, 1995.
Minnis, P., Harrison, E. F., Stowe, L. L., Gibson, G. G., Denn, F. M.,Doelling, D. R., and Smith, Jr., W. L.: Radiative climate forcingby the Mount Pinatubo eruption, Science, 259, 1411–1415, 1993.
Mihalopoulos, N., Putaud, J. P., Nguyen, B. C., and Belviso, S.:Annual variation of atmospheric carbonyl sulfide in the marineatmosphere in the southern Indian Ocean, J. Atmos. Chem., 13,
73–82, 1991.Mills, M. J., Toon, O. B., and Thomas, G. E.: Meso-
spheric sulfate aerosol layer, J. Geophys. Res., 110, D24208,doi:10.1029/2005JD006242, 2005.
Montzka, S. A., Aydin, M., Battle, M., Butler, J. H., Saltzman, E.S., Hall, B. D., Clarke, A. D., Mondeel, D., and Elkins, J. W.: A350-year atmospheric history for carbonyl sulfide inferred fromAntarctic firn air and air trapped in ice, J. Geophys. Res., 109,D22302,doi:10.1029/2004JD004686, 2004.
Montzka, S. A., Calvert, P., Hall, B. D., Elkins, J. W., Conway,T. J., Tans, P. P., and Sweeney, C.: On the global distribu-tion, seasonality, and budget of atmospheric carbonyl sulfide andsome similarities with CO2, J. Geophys. Res., 112, D09302,doi:10.1029/2006JD007665, 2007.
Mu, Y., Geng, C., Wang, M., Wu, H., Zhang, X., and Jiang, G.: Pho-tochemical production of carbonyl sulphide in precipitation, J.Geophys. Res., 109, D13301,doi:10.1029/2003JD004206, 2004.
Murphy, D. M., Cziczo, D. J., Hudson, P. K., and Thomson, D. S.:Carbonaceous material in aerosol particles in the lower strato-sphere and tropopause region, J. Geophys. Res., 112, D04203,doi:10.1029/2006JD007297, 2007.
Notholt, J., Kuang, Z., Rinsland, C. P., Toon, G. C., Rex, M., Jones,N., Albrecht, T., Deckelmann, H., Krieg, J., Weinzierl, C., Binge-mer, H., Weller, R., and Schrems, O.: Enhanced upper tropicaltropospheric COS: Impact on the stratospheric aerosol layer, Sci-ence, 300, 307–310, 2003.
Pringle, K. J., Tost, H., Message, S., Steil, B., Giannadaki, D.,Nenes, A., Fountoukis, C., Stier, P., Vignati, E., and Lelieveld,J.: Description and evaluation of GMXe: a new aerosol sub-model for global simulations (v1), Geosci. Model Dev., 3, 391–412,doi:10.5194/gmd-3-391-2010, 2010.
Rinsland, C. P., Gunson, M. R., Ko, M. K. W., Weisenstein, D. W.,Zander, R., Abrams, M. C., Goldman, A., Sze, N. D., and Yue,G. K.: H2SO4 photolysis: A source of sulfur dioxide in the upperstratosphere, Geophys. Res. Lett., 22, 1109–1112, 1995.
Rinsland, C. P., Goldman, A., Mahieu, E., Zander, R., Notholt, J.,Jones, N. B., Griffith, D. W. T., Stephen, T. M., and Chiou, L.S.: Ground-based infrared spectroscopic measurements of car-bonyl sulfide: Free tropospheric trends from a 24-year time seriesof solar absorption measurements, J. Geophys. Res., 107, 4657,doi:10.1029/2002JD002522, 2002.
Rinsland, C. P., Chiou, L., Mahieu, E., Zander, R., Boone, C. D.,Bernath, P. F.: Measurements of long-term changes in atmo-spheric OCS (carbonyl sulfide) from infrared solar observations,J. Quant. Spectrosc. Ra., 109, 2679–2686, 2008.
Robock, A.: Volcanic eruptions and climate, Rev. Geophys., 38,191–219, 2000.
Roeckner, E., Brokopf, R., Esch, M., Giorgetta, M., Hagemann, S.,Kornblueh, L., Manzini, E., Schlese, U., and Schulzweida, U.,Sensitivity of simulated climate to horizontal and vertical reso-lution in the ECHAM5 atmosphere model, J. Climate, 19, 3771–3791, 2006.
Roehl, C. M., Boglu, D., Bruhl, C., and Moortgat, G. K.: Infraredband intensities and global warming potentials of CF4, C2F6,C3F8, C4F10, C5F12, and C6F14, Geophys. Res. Lett., 22, 815–818, 1995.
Sander, R., Kerkweg, A., Jockel, P., and Lelieveld, J.: Technicalnote: The new comprehensive atmospheric chemistry moduleMECCA, Atmos. Chem. Phys., 5, 445–450,doi:10.5194/acp-5-
Atmos. Chem. Phys., 12, 1239–1253, 2012 www.atmos-chem-phys.net/12/1239/2012/

C. Bruhl et al.: COS and stratospheric aerosol 1253
445-2005, 2005.Sander, S. P., Friedl, R. R., Golden, D. M., Kurylo, M. J., Moort-
gat, G. K., Keller-Rudek, H., Wine, P. H., Ravishankara, A. R.,Kolb, C. E., Molina, M. J., Finlayson-Pitts, B. J., Huie, R. E., andOrkin, V. L.: Chemical Kinetics and Photochemical Data for Usein Atmospheric Studies, Evaluation Number 15, JPL Publication06-2, Jet Propulsion Laboratory, Pasadena, USA, 2006.
Sandoval-Soto, L., Stanimirov, M., von Hobe, M., Schmitt,V., Valdes, J., Wild, A., and Kesselmeier, J.: Global up-take of carbonyl sulfide (COS) by terrestrial vegetation: Esti-mates corrected by deposition velocities normalized to the up-take of carbon dioxide (CO2), Biogeosciences, 2, 125–132,doi:10.5194/bg-2-125-2005, 2005.
Stratospheric Processes and their Role in Climate (SPARC), Assess-ment of Stratospheric Aerosol Particles, edited by: Thomason, L.and Peter, T., SPARC Report No. 4, WMO/WCRP, 2006.
Steinbacher, M., Bingemer, H. G., and Schmidt, U.: Measurementsof the exchange of carbonyl sulfide (OCS) and carbon disulfide(CS2) between soil and atmosphere in a spruce forest in centralGermany, Atmos. Environ., 38, 6043–6052, 2004.
Stenchikov, G. L., Kirchner, I., Robock, A., Graf, H.-F., Antuna,J. C., Grainger, R. G., Lambert, A., and Thomason, L.: Radia-tive forcing from the 1991 Mount Pinatubo volcanic eruption, J.Geophys. Res., 103, 13837–13857, 1998.
Sturges, W. T., Penkett, S. A., Barnola, J.-M., Chappellaz, J., Atlas,E., and Stroud, V.: A long-term record of carbonyl sulfide (COS)in two hemispheres from firn air measurements, Geophys. Res.Lett., 28, 4095–4098, 2001.
Thomason, L. W., Poole, L. R., and Deshler, T.: A global cli-matology of stratospheric aerosol surface area density deducedfrom Stratospheric Aerosol and Gas Experiment II measure-ments: 1984–1994, J. Geophys. Res., 102, 8967–8976, 1997.
Thomason, L. W., Burton, S. P., Luo, B.-P., and Peter, T.: SAGE IImeasurements of stratospheric aerosol properties at non-volcaniclevels, Atmos. Chem. Phys., 8, 983–995,doi:10.5194/acp-8-983-2008, 2008.
Thornton, D. C., Bandy, A., Blomquist, B., Driedger, A., and Wade,T.: Sulfur dioxide distributed over the Pacific Ocean 1991–1996,J. Geophys. Res., 104, 5845–5854,doi:10.1029/1998JD100048,1999.
Timmreck, C., Graf, H.-F., and Feichter, J.: Simulation of Mt.Pinatubo volcanic aerosol with the Hamburg climate modelECHAM4, Theor. Appl. Climatol., 62, 85–108, 1999.
Turco, R. P., Whitten, R. C., Toon, O. B., Pollack, J. B., and Hamill,P.: OCS, stratospheric aerosols and climate, Nature, 283, 283–285, 1980.
Vaida, V., Kjaergaard, H. G., Hintze, P. E., Donaldson, D. J.: Pho-tolysis of sulfuric acid vapor by visible solar radiation, Science,299, 1566–1568, 2003.
Van Diest, H. and Kesselmeier, J.: Soil atmosphere exchange of car-bonyl sulfide (COS) regulated by diffusivity depending on water-filled pore space, Biogeosciences, 5, 475–483,doi:10.5194/bg-5-475-2008, 2008.
Vehkamaki, H., Kulmala, M., Napari, I., Lehtinen, K. E. J., Timm-reck, C., Noppel, M., and Laaksonen, A.: An improved pa-rameterization for sulfuric acid-water nucleation rates for tro-pospheric and stratospheric conditions, J. Geophys. Res., 107,4622,doi:10.1029/2002JD002184, 2002.
Vernier, J.-P., Thomason, L. W., Pommereau, J. P., Bourassa,A., Pelon, J., Garnier, A., Hauchecorne, A., Blanot, L.,Trepte, C., Degenstein, D., and Vargas, F.: Major influ-ence of tropical volcanic eruptions on the stratospheric aerosollayer during the last decade, Geophys. Res. Lett., 38, L12807,doi:10.1029/2011GL047563, 2011.
Watts, S. F.: The mass budgets of carbonyl sulfide, dimethyl sulfide,carbon disulfide and hydrogen sulfide, Atmos. Environ., 34, 761–779, 2000.
Weisenstein, D. K., Yue, G., Ko, M., Sze, N.-D., Rodriguez,J., and Scott, C.: A two-dimensional model of sulfurspecies and aerosols, J. Geophys. Res., 102, 13019–13035,doi:10.1029/97JD00901, 1997.
www.atmos-chem-phys.net/12/1239/2012/ Atmos. Chem. Phys., 12, 1239–1253, 2012