the skipjack fishery in eastern indonesia: …archimer.ifremer.fr/doc/00042/15320/12658.pdf · ptum...
TRANSCRIPT

Effect of FADs 011 fisheries resources
The sk ip jack fishery in Eastern Indonesia: distinguishing the effects of increasing effort and deploying rumpon FADs on the stock
Daniel R. Monin t j a ' l ) , Christopher P. Mathews<2)
(1) Fakultas Perikanan, Institut Pertanian Bogor, Indonesia
(2) Marine Science and Fisheries Centre, PO BOX 467, Post Code 113, Muscat, Sultanate of Oman
Abstract
Rampons , (FADs) were widely deployed in Indonesia in the eighties. In the Halmahera area, rumpon increased CPUE by 4 1 % , landings of f i sh per ton of live bait increased by 24%, the consumpt ion of diesel oil for tuna catches reduced by 4 6 % , ancl profits increased from R p 10 to 60 million by boat per year1. Tuna aggregation around rumpon increased catchability by more than 4 0 % compared to free swimming tuna. The Halmahera skipjack fishery was assessed by combining catch and effort data from rumpon ancl pre-rumpon areas of the fishery, ancl showed that controlled effort coulcl increase landings of approximately 15,000 t per year. Tagging data show that the Halmahera skipjack fishery is pro-bably supported by a local uni t stock. Phi l ippine rumpons (payaos) were fished wi th small mesh purse seine and ring nets fishing small sized tunas 12-35 cm FL (40-50% of landings) and caused recruitment overfishing. Indonesian rumpons were fished with pole-and-line causing neither recrui tment nor growth overfishing.
Introduction
Many kinds of rumpon , or Fish Aggrega t ing Devices (FADs), have been used tradit ionally in eastern Indonesian waters (Reuter, 1938; Nasu t ion et al., 1986) ancl in the Phi l ippines (Aprieto, 1988a, b, c, d, 1990, 1991, 1994). Rumpons currently take large and small pelagic fish in the Phi l ippines (Aprieto, 1990, 1991, 1994) ancl in Indonesia (Monint ja , 1993). Rumpons were traditionally constructed wi th palm fronds ancl locally harvested wood ancl fibres, ancl were placed in fairly shallow, inshore coastal waters (<50 m deep). Since the mid 1980s, they have also been constructed with polypropylene ancl polyethylene mooring lines, cement ancl other types of anchors ancl wi th other industrial materials of Indo-nesia. Monin t j a (1993) described ten different types of rumpon from Indonesia and more than 20 types from around the world.
1. US$1.00 = Rp 1,000-2,000 in the 1980s.
4 3 5

Impact cle l'exploitation cles DCP sur les ressources
New and larger rumpons were installed in Ternate, Ticlore, Bacan and Sorong in waters around Halmahera and in the Halmahera Sea, in December 1984 (fig 1).
Figure 1 (a) Map of Indonesia; the box shows the area covered in figure l b . (b) Maluku Islands showing the study area, the main study area and the surrounding seas.
1 3 1 " E
3 ° N
2°N
1° N
0 ° N
P S
Rumpons cause overfishing th rough increasing vulnerabil i ty and accessibility off ish to various types of gear (cle Jesus, 1982; Aprieto & Ganaden, 1985). They act analogously to artificial reefs, which are now
4 3 6

Effect of FADs 011 f isheries r e s o u r c e s
regarded as FADs placed more permanently on the bottom, increasing che proportion of a stock taken by fishermen without increasing recruitment. Where stocks are fished around maximum sustainable yield (MSY), installation of FADs or artificial reefs will lead to economic ancl biolo-gical overfishing (Monro, 1996). Rapid deployment of rumpon in the Halmahera area raised questions about: - effects on landings caused by fish aggregating around rumpon; - increasing effort on stocks caused independently of rumpon. This paper a t tempts to dissect these effects ancl to identify rumpon deployment on effort, so as to facilitate assessments. Large-scale rumpon-based fishing was introduced into Indonesia by the government owned but commercially operated PT Usaha Mina company (PTUM), together with Nucleus Estate Small Holde r (NES) which employ local f ishermen, encourage cooperatives ancl combine to st imulate growth of artisanal fisheries in unexploitecl areas (Niki -juluw, 1994).
Material and methods
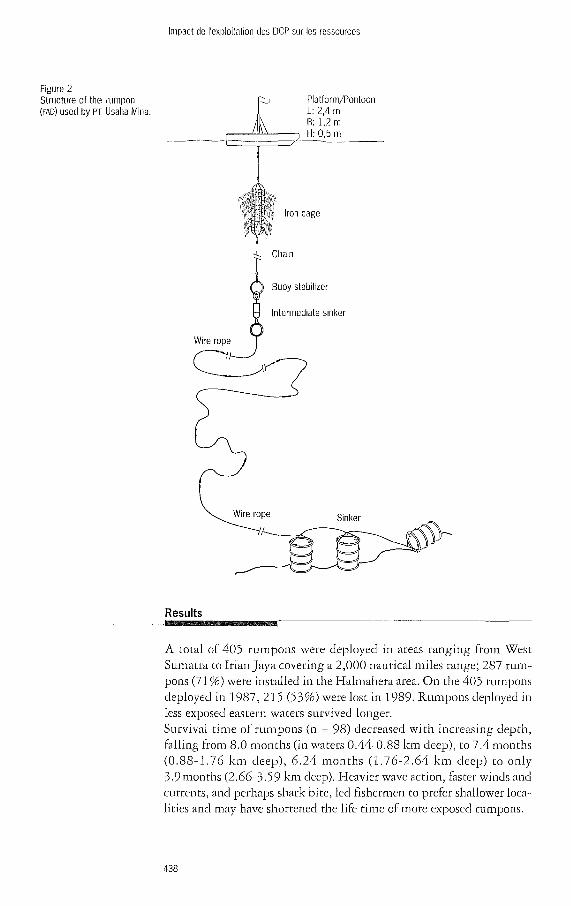
The standard PT Usaha Mina rumpon was the main kind used in this study (fig. 2; Monint ja , 1993). Catch ancl effort elata were supplied by PTUM which used a standard 35 GT pole-and-liner effort expended by PTUM are unbiased by changes in fishing power or technology over the study period. Live bait, mainly Stolephorus spp., was used. N o purse seining occurred. Data were obtained on the s tructure ancl operations of 108 rumpons located near Bacan, Ticlore, ancl Ternate off Western Halmahera (Maluku) ancl off Sorong, Waigeo and Gag ( I r ian jaya ; fig. la). Date, position, date of installation ancl est imated loss were recorded. Catch data were provided for each type of gear used around each rumpon by PTUM. Effort ancl catch data were also obtained from PTUM ancl local fishery service officials for a total of 405 rumpons deployed in Indonesia. Catch per unit effort (CPUE) was calculated for Elalmahera standard PTUM boats in the pre- rumpon area (1980-1984) ancl the rumpon area (1985-19S9).
Skipjack CPUE, size frequencies ancl distance of each set f rom rumpon were obtained in 1989 dur ing commercial fishing around 108 rumpons at Bacan, Ticlore and Ternate Islands located west of Halmahera Island. Economic data were obtained in 1987 by interviewing 44 out of 189 skippers. Resul t ing elata were used in a mul t ip le regression study of the factors that influence net profitabili ty, which was es t imated for each boat using a tai lor-made program available f rom the Faculty of Marine Fisheries, Tokai University, Japan.
4 3 7
Impact cle l'exploitation cles DCP sur les ressources
Figure 2
Results
A total of 405 rumpons were deployed in areas ranging from West Sumatra to I r ian jaya covering a 2,000 nautical miles range; 287 rum-pons (71%) were installed in the Halmahera area. On the 405 rumpons deployed in 1987, 215 (53%) were lost in 1989. Rumpons deployed in less exposed eastern waters survived longer. Survival time of rumpons (n = 98) decreased with increasing depth, falling from 8.0 months (in waters 0.44-0.88 km deep), to 7.4 months (0 .88-1 .76 km deep), 6 .24 months (1 .76-2 .64 km deep) to only 3-9months (2.66-3.59 km deep). Heavier wave action, faster winds and currents, and perhaps shark bite, led fishermen to prefer shallower loca-lities and may have shortened the lile time of more exposed rumpons.
4 3 8

Effect of FADs 011 fisheries r e sources
Figure 3 Length frequency distributions of skipjack tuna taken at different distances from rumpon located on the Bacan fishing grounds. A: 0-500 m. B: 501-1,000 m. C: 1,001-5,000 m. D: > 5 , 0 0 0 m. Arrows indicate size at first maturity.
Survival time (n = 108) was also influenced by the kind of mooring line: 24 m m polyethylene line lasted a mean of 7.3 months (n = 52) com-pared to 16 m m polyethylene (6.0 months, n = 20), and 18 m m and 16 m m polypropylene lines (6.9 months, n = 17; 6.5 months, n = 19). The t ime needed for fish to occupy a newly deployed rumpon ranged from 5 to 64 clays. Mean survival time varied from 24.5 clays (95% confi-dence intervals - 95% CI = 1.5-34; n = 1.7) in Sorong, to a mean of 1.0.3 (95% CI = 7.6-13.0, n = 14) in Bacan. The t ime required for tuna, to appear around rumpon was short compared to the t ime needed for fish to grow to the observed large sizes (at least one year for small tuna). The corollary is that rumpons are unlikely to increase recruitment, and may affect tuna distr ibution and abundance in neighbouring areas. Skipjack mature at sizes more than 40 cm FL in the Philippines (Aprie-to, 1994) and Indonesia (Suhenclrata & Wahyno, 1987) and from 40-45.4 cm FL in Papua New Guinea, USA, Philippines and Indonesia (Tan-clog-Ednalin et al., 1990). Figure 3 includes the Indonesian m i n i m u m size at maturi ty: only mature skipjack aggregated around rumpons. Yellowfin m a t u r e at s imilar or s l ight ly larger sizes than sk ip jack (> 50 cmFL; Collette & Nauen , 1983). Most yellowfin taken around rumpons were approximately more than 40 cm FL. Skipjack CPUE fell markedly with increasing distance of the set f rom the rumpon (tab. 1).
200
I 100
Mean = 52.12 cm
30 4 0 50 60 70 80 Fork length (cm)
200
100
0
Mean = 52.12 cm
30 40 50 60 70 Fork length (cm)
200
1 0 0 -
30
Mean = 53.52 cm
4 0 50 60 70 Fork length (cm)
80
200
100
Mean = 54.18 cm
5 0 60 70 Fork length (cm)
4 3 9

Impact cle l'exploitation cles DCP sur les ressources
Table 1 - Ef fec ts of increas ing d is tance (m) f r o m the r u m p o n on ca tch ra tes
of sk ip jack. Catch ra tes are in t / h of ac tua l f ish ing t ime , i.e. f r o m d ropp ing
the net to comp le t ion of the set . Mos t se ts lasted less than one hour, many
less than half an hour.
D i s t a n c e f r o m r u m p o n M e a n c a t c h r a t e ( t / h ) 95% CI S a m p l e s i z e
< 5 0 0 1 2 . 1 3 2 4 2 . 0 4 2 7
> 5 0 0 - 1 , 0 0 0 9 . 0 4 8 2 2 . 7 3 27
> 1 , 0 0 0 - 5 , 0 0 0 6 . 0 0 7 2 7 . 9 0 27
> 5 , 0 0 0 2 . 5 5 2 1 7 . 3 5 2 7
Capture time ancl distance from rumpon affect C P U E (fig. 4). Higher rates (1-12 t/h) occurred from 6 am to 10 am (n = 56 out of 76 obser-vations) mostly <1,000 m from rumpon. Lower catch rates (1-4 t/h) occurred from 11 am to 5 pm (n = 19 out of 76), a/1,000 to over 5,000 m from rumpon. Effort is targeted towards the morning hours when skip-jack are more active. Figure 4 also suggests that there may be a much weaker afternoon peak (cao.0-4.0 t/h) from 3 pm to 5 pm. Table 2 summarises landings ancl effort from different fleets in Sorong, Halmahera and Bacan waters. Total effort (days/year) in company boat expended on the skipjack stock each year was estimated by dividing company CPUE into total skipjack landings from all fleets (tab. 2, column j). The Wilcoxon rank sum test showed that C P U E ranks for pre-rumpon and rumpon areas were 16 and 39 respectively, with T ( ) 0 5 = 19,35: C P U E s during the two areas were also significantly different. Mean landings were also significantly higher (T() 05). The ratio of the mean C P U E X = 1.0074 (x denotes the rumpon area C P U E ) to CPUEy = 0.7170 (y denotes the pre-rumpon area C P U E ) was: 1.0074/0.7170 = 1.41 = C P U E X / C P U E
Rumpon area catches were higher than pre-rumpon catches (tab. 2, column i): rumpon increased landings at the comparable effort levels.
Figure 4 Relation between catch rates (t/h), distance from the rumpon, and time of day, for skipjack caught around rumpons on the Bacan fishing grounds. Most sets lasted less than 1 h, and many sets were unsuccessful. Only successful sets were included in the analysis. The different histogrammes indicate the distance of capture from the rumpon.
14
12
10
4 -
M 0 - 5 0 0 m • 501-1 0 0 0 m m 1 001-5 0 0 0 m • > 5 0 0 0 m
LU , I J I J , [ I IJ 06 07 08 09 10 11 12 13 14 15 16 17
Day time (h)
440

Table 2 - Data on skipjack landings, ef for t and catch per unit ef for t for boats operating in the Halmahera Sea rumpon fishery. Standard boat: 35 G i pole-and-liner;
ef fort : boat.day/year; catch in t /year , whole fresh fish; CPUE/catch per unit ef fort : t /boat .day /year
Standard un i t effort : boae.day/year; to ta l effor t lor all fleets combined , in s tandard ized unie effort .
19S0-19S4 : P r e - r u m p o n area. 1 9 8 5 - 1 9 8 9 : R u m p o n area.
Year a b c d e f a h i j k
Land ings Ef for t Land ings Total ef for t C o m p a n y N E S Sub to ta l Effor t Efforc C P U E Ar t i sana l O t h e r Tota l ( unad ju s t ed ) A d j u s t e d
t /yr c/yr t /yr a + b
(C + N E S ) boat .days/yr
(non r u m p o n )
(C + N E S ) boat .days/yr
( r u m p o n )
t /bc.day/yr
(a/effort)
t /yr t /yr Land ings t /yr
c + g + h
b t .day /yr i/f
b t .day /y r
1 9 8 0 3 6 9 6 3 6 9 6 5 7 4 6 0 . 6 4 3 2 7 0 9 2 6 3 7 7 0 4 2 1 0 9 4 8 7 7 6 4
1981 3 5 7 4 3 5 7 4 4 6 8 0 0 . 7 6 3 7 275 2 1 2 5 5 9 7 4 7 8 2 3 5 5 4 8
19S2 2 4 6 2 2 4 6 2 4 1 9 2 0 . 5 8 7 3 1 2 1 9 2 8 4 2 6 523 1 1 1 0 7 7 S 7 7
19S3 3 8 4 4 3 8 4 4 4 1 6 1 0 . 9 2 3 8 9 8 6 2 3 7 5 7 2 0 5 7 7 9 9 5 5 3 1
1 9 8 4 2 3 6 8 2 3 6 8 3 551 0 . 6 6 6 9 1 2 0 7 1 4 0 0 4 9 7 5 7 4 6 0 5 2 9 1
1985 4 1 0 5 4 1 0 5 3 7 3 2 1 . 0 9 9 9 2 3 6 6 857 7 3 2 8 6 6 6 2 6 6 6 2
19S6 3 4 0 4 2 1 0 2 5 5 0 6 3 4 6 4 0 . 9 S 2 7 3 227 1 1 4 3 9 8 7 6 1 0 0 5 0 1 0 0 5 0
1987 2 S 5 9 6 S 5 S 9 7 1 7 3 3 6 2 0 . 8 5 0 4 3 3 5 0 1 3 5 0 1 4 4 1 7 1 6 9 5 3 1 6 9 5 3
19SS 2 5 0 1 6 4 7 1 8 9 7 2 2 2 7 3 1 . 1 0 0 3 2 3 9 3 1 2 6 2 1 2 6 2 7 1 1 4 7 6 1 1 4 7 6
19S9 2 297 6 7 5 5 9 0 5 2 2 2 8 8 1 . 0 0 3 9 2 4 9 0 1 4 7 0 1 3 0 1 2 1 2 9 6 1 1 2 9 6 1
NB: Mean CPUE from 1980-1984: 0.7169 t/boat.day; mean CPUE from 1985-1989: 1.0074 f/boat.day. Ratio: 1.0074/0.7169 = 1.405. Total adjusted effort was calculated for non-rumpon years: k = j/1.41. For rumpon no adjusment was needed (see text).

Impact cle l'exploitation cles DCP sur les r e s s o u r c e s
The number of boat per clay in the pre-rumpon and rumpon areas were not significantly different (p = 0 .285) while the regressions of total catch on total effort for the two areas were significantly different from zero (p<0.05) but not from each other (p>0.05). However, rumpon affected skipjack behaviour: aggregat ion around rumpon increased skipjack accessibility ancl vulnerability, ancl presu-mably increased catchability, by increasing the fraction of the stock removed per unit effort. A standard boat captured 1.00 t/day in the pre-rumpon area ancl 1.41 t/clay in the rumpon area. Total pre-rumpon effort (tab. 2, column j) was therefore converted to rumpon area effort (tab. 2, column k) as follows: Pre-rumpon effort (boat per clay)/1.4L = effort in rumpon area boat per clay. This procedure converts pre- rumpon effort data (tab. 2, column j) into rumpon area effort units, producing homogeneous effort units over the whole t ime series (column k). These adjusted data were therefore used in the assessment. Changes in CPUE caused by introduction of rumpon have other effects: - mean fuel consumpt ion fell f rom 0 .869 t of diesel oil/1 of skipjack landed dur ing the pre- rumpon area to 0 .467 t/t of skipjack during the rumpon area (tab. 3) giving a reduction in fuel consumption of0.402 toil/t of skipjack (53 .8% of the p re - rumpon area). This provided a mean cost reduction of US$ 65/ t compared to ex-vessel skipjack prices of US$ 130-420/ t (Niki juluw, 1994); - rumpon also reduced live bait consumption from 26.9 t of skipjack/1 of bait (pre-rumpon) to 33.0 t of skipjack/t of bait ( rumpon area, tab. 4). The Halmahera skipjack stock was assessed by f i t t ing catch ancl effort data (tab. 2, column k) using Genprod, Prodfi t (Hall, 1988) ancl Clim-prod (Fréon etal,, 1992), who provide slightly different f i t t ing routines. The best fit gave an MSY of ca 32 ,500 t/year at 61 ,000 boat.days/year wi th catchabili ty = 0 .000353 . Estimates of MSY ancl opt imal effort varied by 9 ,500 t/year and 20 ,000 boat.days/year because of the dif-ferent f i t t ing routines ancl the narrow effort range. Modell ing showed that the stock can provide greater landings than those observed in 1989, bu t assumed that Halmahera skipjack belong to a uni t stock (see below). Mult ip le regression analysis was applied to data from interviews with skippers (n = 44) in three different areas: - Ticlore where boats were owned ancl operated by independent fisher-men, f ishing without rumpon; - Ternate where fishermen owned boats ancl market their catch, but fished around rumpons provided by the government ; - Bacan where PTUM (a government owned, private sector company) operated boats wi th company managed rumpons , ancl marketed the catch.
4 4 2

Effect of FADs 011 fisheries r e s o u r c e s
Table 3 - Comparison of the catch (c) and fuel consumed (fc) before and during rumpon period.
Catches and fuel consumed are given in t /year ; f c / c ; t of skipjack/t of fuel/year.
N o n - r u m p o n p e r i o d R u m p o n p e r i o d Y e a r c fc fc /c Y e a r c fc fc /c
1 9 8 0 3 , 6 9 6 3 , 1 4 9 0 . 8 5 2 0 1985 4 , 1 0 5 2 , 3 6 3 0 . 5 7 5 6
1981 .3,574 3 ,005 0 . 8 4 0 8 1986 5 , 5 0 6 2 ,592 0 . 4 7 0 8
1982 2 , 4 6 2 2 ,577 0 .0467 1987 6 ,717 2 ,865 0 . 4 2 6 5
1983 UJ CO
ox
2 , 7 0 8 0 .7045 1988 8 , 9 7 2 3 ,724 0 . 4 1 5 1
1984 2 , 3 6 8 2 ,204 0 .9307 1989 9 , 0 5 3 4 , 0 7 9 0 . 4 5 0 6
Mean fc/c = 0 . 8 6 8 9 Mean fc/c = 0 . 4 6 7 7 S D = 0 . 1 2 7 9 SD = 0 . 0 6 4 0
Wilcoxon's rank sum test. R, = 40, R2 = 15, T0 05 = 19.36
Table 4 - Comparison of the catch (c) per live bait consumption (b) before and during rumpon period.
Catch: t /year ; bait consumption: t /year; c / b : ft of skipjack/year)/( t of baitf ish/year)
N o n - r u m p o n p e r i o d R u m p o n p e r i o d Y e a r c b c / b Y e a r c b c / b
1980 3 , 6 9 6 128 .6 28 .7 1985 4 , 1 0 5 114.2 36 .0
1981 3 , 5 7 4 121 .7 29 .4 1.986 5 ,506 159.4 34 .5
1982 2 , 4 6 2 92 .7 2 6 . 6 1987 6 ,717 2 2 5 . 6 29 .8
1983 UJ
bo
1.52.7 25 .2 1988 8 ,972 2 4 5 . 9 36 .5
19S4 2 , 3 6 8 9 5 . 9 24.7 1 9 8 9 9 , 0 5 3 3 0 7 . 4 29 .5
M e a n fc/c SD = 2.1
= 26 .9 Mean fc/c SD = 0 .3
= 33 .3
Wilcoxon's rank sum test. Rj = 15, R2 = 40, T0 0 5 = 19.36
Data on the following factors were analysed. Factors used in the final analysis are shown in bold: Y : Ne t profi tabi l i ty (Rp/boat/year) X I : Overall vessel size (m) X 2 : Engine p o w e r (HP) X 3 : Fuel consumpt ion (t/boat/year) X 4 : Live bait used (kg/boat/year) X5 : Fishing clays/boat/year X 6 : Fishermen/boat /year X7 : Operating costs (Rp/boat/year) XS : Total power (estimated by convert ing manpower to HP, using
1.0 m a n p o w e r = 0.18 HP; Dalzell etal., 1987) X 9 : Arbitrary (dummy) variable, assigned arbitrary values of 0.0,
0.5 and 1.0 def ined as fol lows: - X 9 = 0.0: Ticlore fleet (n = 14), skipjack fished without rumpon; - X9 = 0.5: Ternate Island (n = I O), skipjack fished with privately owned boats and rumpons provided by government. - X 9 = 1.0: Bacan (n = 20), skipjack fished by boats and rumpons o w n e d b y P T U M .
4 4 3

Impact cle l'exploitation cles DCP sur les r e s s o u r c e s
Vessel size (varying by to less than 5 m) and operating costs (highly influenced by fuel consumption, r = -0.4714) were eventually excluded from the analysis. Results of the stepwise multiple regression leei to selection of only four factors, of which the last three were forced into the regression (which normally excludes all factors with F<4.0):
V a r i a b l e C o e f f i c i e n t S t a n d a r d e r r o r T P Y - 2 9 . 3 7 8 4 18 .1645 - 1 . 6 1 7 4 0 . 1 1 4 1 X 9 3 5 . 8 3 8 5 9 . 3 1 1 5 3 . 8 4 8 8 0 . 0 0 0 4 X 4 4 . 8 1 1 3 1 . 7 5 5 7 2 . 7 4 0 4 0 . 0 0 9 3 X S 0 . 4 6 5 4 0 . 3 8 6 2 1 .2048 0 . 2 3 5 7 X. 3 0 . 3 8 9 1 0 . 3 5 9 1 1 .0835 0 . 2 8 5 4
Therefore: Y = -29.3784 + 35.8385 x X9 + 4.8113 x X4 + 0.4654 x X8 + 0.3891 x X3 Y is expressed in million of Rp/year, negative values of Y showing losses. The model is significant (F4 38 = 5.1387, p = 0.0021; r2 = 0.3510). However, only the first two variables (X9, the dummy variable for fishing grounds; ancl X4 , baitfish consumed) have a strong effect on values of Y (net profitability). Using constant X4 = 5, X8 = 10 ancl X3 = 20 ancl with X9 varying from 0.00 to 1.00, Y (net profitability) varied as follows: X9 = 0.0, Y = 7.107 X9 = 0.5, Y = 25.027 X9 = 1.0, Y = 42.949
Fishing without rumpon (X9 = 0.00) is less profitable than fishing with rumpon (X9 = 0.5 -1.0). Fishing with company managed rumpons (X9 = 1.0) is substantially more profitable than fishing with government organized rumpons (X = 0.5), ancl very much more profitable than fishing without rumpon (X9 = 0). The amount of bait used was positively correlated with profitability on all fishing grounds but varied counter-intuitively between fishing grounds. Data on steaming time, access to bait ancl other factors not studied may affect bait consumption, complicating this part of the analysis. The presence/absence of rumpon is only one of many characteristics affecting fleet profitability. Nevertheless, deployment of rumpons in a skipjack fishery clearly has a very significant positive effect on net profitability.
Discussion
Skipjack and yellowfin attracted to rumpon were substantially older and larger than those attracted to payaos in the Philippines. Aprieto (op. cit.) ancl Barut & Arce (1990) showed that small-mesh seine ancl ring nets take more than 90% of tuna caught around payaos (rumpons) by "municipal"
4 4 4

Effect of FADs 011 fisheries resources
boats (<3 GT). Municipal boats take predominantly immature 12-35 cm FL tuna, ancl land more than 50% of all Philippine skipjack ancl yellowfin tuna; therefore ca 40 to 50% of these species by volume are landed at c v / 1 2 - 3 5 cm FL, causing recruitment overfishing (Aprieto, 1994). Indonesian boats used pole-ancl-line ancl took negligible amounts of tuna of less than 40 FL (fig. 3). Rumpons did not cause recruitment overfishing in Indonesia because they were not fished with seine ancl ring nets. Surplus production modelling showed that catches coulcl be increased, i.e. that growth overfishing had not yet occurred. Depoutot (1987) fitted regressions to mean monthly CPUFX (for tuna caught around FADs) and CPUFy (for free-swimming tuna, i.e. without FADs) over several years. The regressions were significant (p<0.05), while the slopes were not significantly different from each other:
Species r s l o p e 9 5 % C I of s l o p e
S k i p j a c k 0 . 6 1 1 . 5 8 0 . 7 4 - 2 . 3 4
Y e l l o w f i n 0 . 6 8 1 . 5 4 0 . 6 0 - 2 . 5 6
For skipjack, the overall mean CPUE X was 37.0 fish per clay, while C P U E
was 25.3 fish per clay, so that C P U E x / C P U E y was 1.46. This is very close to the value of C P U E x / C P U E y = 1.41 observed in the Halmahera skip-jack fishery. This is gratifying because our study implicitly assumed that all differences between rumpon ancl pre-rumpon era CPUEs were due to increased catchability. Depoutot's estimates of C P U E X and C P U E y
are synoptic ancl make no such assumption. The ratio of C P U E x / C P U E y (ca 1.4) for skipjack is probably a function of biological interactions between skipjack ancl rumpon, depending on presently unknown details of skipjack behaviour ancl rumpon structure. Depoutot (1987) also noted that fishing around FADs reduced fuel consumption by about 25%: less than but comparable to the reduction in fuel consumption in Halmahera (46.3%). Fuel costs will be affected by steaming t ime ancl weather around Halmahera and Papeete, not described in either study. Bait fish consumption varied between the Solomon Islands, Kiribati and Fiji, from 4.5 to 16.5 t/t/year compared to 26.9 t/t/yeat in the pre-rumpon area 33 t/t/year in the rumpon area. The Halmahera fishery used much less bait at all times, but was even more efficient when rumpons were deployed. Bait fish from the Pacific Islands included many species (e.g. Erichrasicolina spp., Herklotsichthys spp., Apogon spp.) not used in Eastern Indonesia, where preferred species appear to be easier to catch, perhaps because they are more abundant or accessible (Blabere/v//., 1992). The assessment succeeded in dissecting the effects on the stock of rumpon which: - attract fish, increasing C P U E ancl catchability, and - increase effort on the stock independently of the number of boats ancl the type of gear used.
445

Impact cle l'exploitation cles DCP sur les r e s s o u r c e s
The assessment assumed that lTalmahera skipjack pertain to a unit stock. Tagging studies in Eastern Indonesia support this idea: - Gafa & Subani (1987) tagged 2,664 skipjack in North Sulawesi waters and recaptured 66 fish, of which 50 were recaptured after a mean of 25.2clays at liberty and had moved less than 1.0 nautical miles. The remaining 16 skipjack moved from 12 to 223 nautical miles (mean 71.7 nautical miles) and were at liberty for a mean 184.9clays; - Gafa & Subani (1987) tagged 4,850 skipjack and 2,702 yellowfin (total 7,532), out of which 1,294 were recaptured near their point of release. A few skipjack released near Waigeo Island and Ceram travelled up to 1,300 nautical miles into the West Pacific, but most travelled less than 500 nautical miles. Out of 1,215 recaptures in Indonesian waters 1,138 (93.4%) were taken in the general area of their release (tab. 5);
Table 5 - Numbers of tagged tuna recaptured in different areas in Indonesia (from Gafa & Subani, 1987).
R e l e a s e a r e a N u m b e r r e l e a s e d W a i g e o G a g C e r a m S e a B a c a n T o m i n i B a y
Waigeo and G a g Islands 4 , 7 1 6 9 6 6 6 5 0
Ceram Sea 1 ,854 32 3 6 23 4
Bacan 554 4 1 108 2
Tomin i Bay 4 0 8 0 0 0 28
T o t a l 7 , 5 3 2 1 ,002 4 3 136 3 4
- only 59 out of 7,532 (0.78%) of skipjack tagged in eastern Indone-sian waters were recaptured outside of Indonesian waters. Out of 162 returns of fish tagged outside of, and recaptured in, Indonesian waters dur ing the same period, 119 (73%) were recovered neighbouring Philippine and Papua New Guinea waters; - Aprieto (1994) reported a large number of tag returns from the Philippine and Celebes Seas suggesting that skipjack populations in these areas show very little exchange offish with each other or with the Halmahera stock. The assessment presented here may provisionally be regarded as applicable to a stock that is largely confined to the Halmahera and Maluku Seas, perhaps because highly indented island coastlines located in several interdigitating localities discourage migration and provide abundant habitats.
Acknowledgements T h e Di rec to ra te Genera l of Fisheries and P T Usaha M i n a provided necessary data . W e are g r a t e f u l to Fuad Cholilc, N u r z a l i N a a m i n , M o h a m a d B a d r u d i n , N i c k W i l l o u g h b y and J u r g e n Saeger for he lp fu l cr i t ic isms.
4 4 6

Effect of FADs 011 f isheries r e sou rces
Bibliographic references
Aprieto V.L., 1988a. An interview of the Philippine tuna fisheries. In: Proceedings of the seminar workshop on Philippine tuna ancl small pelagic fisheries: status ancl prospects for development. Zamboanga State College of Marine Science ancl Technology, 27-29 July 1988, Zamboanga City. Phi l ippine Council for Aquat ic ancl Marine Research.
Aprieto V.L., 1988b. Aspects of management of artificial reefs for fisheries: status ancl prospects for development and management. September 1988, Penang, Malaysia. ASEAN/SP/88/GEN/S.
Aprieto V.L., 1988c. The pelagic fisheries of the Lingayen Gulf. Fish. Res. Philippines, 13(1-2), 43-51.
Aprieto V.L., 1988d. Expansion and modernization of the commercial tuna purse seine fleet: the Phil ippine situation. In: The fourth southeast Asian tuna consultative workshop, 22-24 August 1989, Bali, Indonesia. Indo-Pac. Tuna Program., FAO.
Aprieto V.L., 1990. Tuna Fish Aggregating Device (FAD) in the Phi-lippines. In: Symposium on artificial reefs ancl Fish Aggregating Devices as resource enhancement ancl fisheries management tools, 14-17 May 1990, Colombo, Sri Lanka, FAO.
Aprieto V.L., 1991- The impact of Fish Aggregating Devices (FADs) in the Philippine tuna fishery. Fish. J . Philippines, 16(1-2), 43-62.
Aprieto V.L., 1994- Philippine tuna fisheries: skipjack ancl yellowfin. University of the Philippines and Unesco, 75 p.
Aprieto V.L., Ganaden R., 1985. A review of the Phil ippine tuna fishery. University of the Philippines, Visayas College. Fish. J . , 1(2), 39-59.
Barut N. , Arce F., 1990. The Philippine tuna fisheries: industry ancl research. In: Collective volume of working documents. Fourth southeast Asian tuna conference, 27-30 November 1990, Bangkok, Thailand.
Blaber D., Milton A., Rawlinson N.J.F., 1992. Tuna baitfish in Fiji and Solomon Islands. Austr. Cent. Int. Agric. Res. Proc., 52, 1-131.
Collette B.B., Nauen C., 1983. FAO Species catalogue. II: Scombrids of the world. An annotated ancl illustrated catalogue of tunas, mackerels, bonitos ancl related species known to date. FAO Fish. Synop., 125, 137 p.
Dalzell P., Corpuz P., Ganadan R., Partly D., 1987. Estimation of maximum sustainable yield and maximum economic yield from the Phi l ippine small pelagic fisheries. Bureau of Fisheries ancl Aquatic Resources, Manila, Philippines, X(3), 23 p.
4 4 7

Impact cle l'exploitation cles DCP sur les r e s s o u r c e s
Depoutot C., 1987. Contr ibut ion à l 'étude des dispositifs cle concen-
tration cle poisson à partir cle l'expérience polynésienne. Notes Doc.
Océanogr. Cent. Tahiti Ors tom, 33, 170 p.
Fréon P., Kwiecinslci B., Lopez D., 1.992. Ut i l i té clu système expert
pour la connaissance clu déterminisme clu recrutement. Ann. Inst.
Océanogr., Paris, 68(1), 1-18.
Gafa B., Subani W., 1987. Study on live bait f ishing area for small-
scale fisheries development in Halmahera and Morotai (in Bahasa
Indonesia). J . Mar. Fish. Res., 42, 97-104,
Flail N.G. , 1988. Fish population dynamics routines for use in fisheries
analysis, updated for use with IBM compatible PC. Kuwait Inst i tute
for Scientific Research, Kuwai t .
Jesus (de) A.S., 1982. Tuna fishing gear of the Phil ippines. Uni ted
Nations Development Programme and South China Sea Fisheries
Development Coordination Programme, SCS/B7/WP/222, 1-49.
Monint ja D.R. , 1993. Study on development of rumpon as Fish Aggre-
gat ing Devices. Mar. Technol. Bull. ITK, 3(3), 1-1.37.
Munro J . , 1996. Proceedings of the symposium on artificial reefs,
August 1994, International Centre for Living and Aquatic Resources
Management , Manila, the Philippines.
Nasution C.H., Merta G.S., Arifudclin R., 1986. Study on rumpons and
their aspects in Mamaju waters to develop tuna fishery in South
Celebes (in Bahasa Indonesia). J . Mar. Fish. Res., 37, 31-58.
N i k u j u l u w V.P.H., 1994. The evolution of NES system in tuna and
skipjack fisheries in Indonesia: concept, inst i tut ional and financial
aspects. In: Socio-economic issues in coastal fisheries management .
Proceedings of the IPFC Symposium, November 1993, Bangkok,
Thailand, FAO, 405-415 .
Reuter J . , 1938. Voorlopig modedel ing omtren t het roempon oncler-
zoek. Modedel ing, 2B, Ins t i tu t vor Zeefischerij, Batavia, 4 p.
Suhendrata T., Wahyno M. , 1987. The size at first matur i ty of the
skipjack (Katsuwonuspelamis) in Pelabuhan Ratu and adjacent waters.
J . Mar. Fish. Res., 44 , 9-16 .
Tandog-Eclnalin D.D. , Cortez Zarogoza E.C., Dalzell P., Pauly D. ,
I99O. Some aspects of the biology and popula t ion dynamics of
skipjack (Katsuwonus pelamis) in Philippine waters. Asian Mar. Biol.,
7, 15-29.
4 4 8