the south african solar water heater industry...south african solar water heater industry survey...
TRANSCRIPT

South African solar water heater industry survey report 1
The South African Solar Water Heater Industry
August 2009
A report based on a survey commissioned and funded by Eskom Distribution

South African solar water heater industry survey report 2
Contents
Table of figures ........................................................................................................................... 3
Disclaimer of liability .................................................................................................................. 3
Background ................................................................................................................................ 4
The results .................................................................................................................................. 5
1 Current size of the solar water heating industry .............................................................. 5
2 Market share of various types of solar water heaters ................................................... 6
2.1 Installation of integral, flat plate and evacuated tube glazed collectors in the South African market ................................................................................................................... 7
2.2 Size of glazed collector systems on the South African domestic market .................. 7
3 Impact of overseas manufacturers on the South African SWH market .......................... 11
4 Relationship between glazed and unglazed collectors ............................................... 12
5 Employment within the solar water heating industry .................................................... 13
6 Capacity in the industry ................................................................................................. 14
7 Financial performance ................................................................................................... 15
7.1 Turnover ................................................................................................................ 15
7.2 Operational gearing............................................................................................... 16
7.3 Profitability............................................................................................................ 17
8 Use of industrial incentive schemes ............................................................................... 17
9 Import duties................................................................................................................. 18
10 Finance, warranties and maintenance ....................................................................... 18
10.1 Finance .................................................................................................................. 18
10.2 Warranties ............................................................................................................. 18
10.3 Maintenance contracts .......................................................................................... 19
11 Training ..................................................................................................................... 19
12 Increasing supply in the market ................................................................................. 19
12.1 Eskom subsidy scheme ...................................................................................... 19
12.2 Blockages in the supply chain ............................................................................ 20
Conclusion ................................................................................................................................ 21
Works cited ............................................................................................................................... 23
Appendix A: List of respondents ............................................................................................... 24
South African solar water heater industry survey report 3
Table of figures
Figure 1: Total area of glazed SWHs supplied (m2) ...................................................................... 5 Figure 2: Typical commercial installation (source: Solar Beam) .................................................... 6 Figure 3: Total area of SWHs supplied (m2) ................................................................................. 7 Figure 4: SWH market share by tank size .................................................................................... 8 Figure 5: Typical low-cost close-coupled SWHs .......................................................................... 8 Figure 6: Typical integral SWH installations ................................................................................ 9 Figure 7: Relative market share of direct and indirect close-coupled SWHs ................................ 9 Figure 8: Split between evacuated tube and flat plate collectors .............................................. 10 Figure 9: Typical Flat plate collectors installed on stands to provide for correct tilt angle and orientation to maximize solar radiation. These SWH are installed in mass housing at Llwandle in the Western Cape ..................................................................................................................... 11 Figure 10: Imported units as a % of total market ....................................................................... 11 Figure 11: Three year trend, SA manufactured vs imports; exports (m2).................................... 12 Figure 12: Breakdown of glazed vs unglazed SWHs (m2) ........................................................... 13 Figure 13: Employment (number of people employed) ............................................................. 14 Figure 14: Calculation of estimated total industry sales for 2009 .............................................. 16
Disclaimer of liability
This report represents the factual findings of a survey conducted with the South African solar water industry. Neither the researchers, nor Eskom Holdings Limited, its agencies nor subsidiaries, assume any responsibility for anyone’s use of the information contained herein.

South African solar water heater industry survey report 4
Background
A study of the supply side of the existing industry in South Africa was commissioned by Eskom Distribution as an input to a feasibility study of potential large-scale Solar Water Heater (SWHs) promotion schemes. This ensures that any large-scale programme that might be developed is sensitive to the dynamics on the supply side and ensures that the benefits from any large SWH programmes have a substantial beneficial impact on the supply chain in South Africa.
The study involved a questionnaire process that was conducted with the industry between February and July 2009. The intention of the questionnaire was to gather technical, financial and operational information about the SWH industry, from active members of that industry. The survey was conducted with the support and endorsement of the Sustainable Energy Society of Southern Africa (SESSA) and the SWH division of SESSA which represents a large percentage of the SWH industry in SA. The survey was designed to gather the following information:
• The size of the current SW H industry in South Africa (both glazed and un-glazed collectors)
• The market share split between the va rious types of SWHs • The impact of imports into South Africa • Size of the export market for South African manufacturers • The number of people currently employed in the SWH industry • The impact of the SA Bureau of Standards on the SWH industry • The current capacity of the industry • The financial performance of the South African SWH industry • The industry’s ability to train installers • The impact of the subsidy scheme developed by Eskom • What the SWH Industry perceive as barriers to growth of the SWH industry • What the SWH industry members believe would be appropriate stimuli.
A total of 39 suppliers gave some input to the process (see Appendix A). While there are over 100 suppliers that are members of SESSA, many of these are not active suppliers yet. These represent the vast majority of active suppliers in the market by volume. Not all suppliers answered all questions in the survey, and some gave only peripheral comments.

South African solar water heater industry survey report 5
The results
1 Current size of the solar water heating industry
The survey determined that the industry reached an all time high in 2008 following the load-shedding experience in the first few months of the year. This follows a 20 year period of stagnation in the industry. However, most survey respondents indicated that they expect a decline in supply during 2009.
The results of this survey have been added to previous figures collected to determine the long-term supply trends in the industry.
Figure 1: Total area of glazed SWHs supplied (m2)
Significant growth took place in the SWH industry during the periods 1979 to 1983, and 2005 to 2008, averaging 42%/year and 72%/year respectively. The industry’s growth spurts coincided with marketing efforts by the CSIR during the late 70’s early 80’s and by Eskom and the CEF during the period 2005/8
For the first time in SA history, total collector sales have topped the 100 000 m2 mark. (Sum of glazed and unglazed collectors).
According to some survey respondents, sales expanded by up to 400% during the first four months of 2008 during the load shedding period.
0
5000
10000
15000
20000
25000
30000
35000
40000
1975 1980 1990 2000 2008Total domestic SWH Total commercial SWH Total glazed SWHs

South African solar water heater industry survey report 6
This growth was accommodated by the industry with very little, if any, additional capital equipment apart from additional warehousing space for companies importing SWHs.
Projections for 2009, while slightly lower than those achieved in 2008, are not as bad as would have been expected in the current recessionary economic environment. This is due to the number of companies entering the SWH market. Only 21 companies were recorded in the previous survey of 2007. The current survey targeted over 100 companies which claimed to be active suppliers in the industry. Another growth factor has been the entry of several large overseas manufacturers into the SA market.
It is interesting to note the trend in commercial installations. These increased rapidly and in 1977 more glazed collectors were installed in the commercial sector than the domestic sector. This trend appears to be emerging again and commercial sales projections for 2009 amount to 15 % of total glazed collector sales.
Figure 2: Typical commercial installation (source: Solar Beam)
2 Market share of various types of solar water heaters

South African solar water heater industry survey report 7
2.1 Installation of integral, flat plate and evacuated tube glazed collectors in the South African market
The graph below shows the split between “integral” or batch SWHs, flat plate collectors, and evacuated tube collectors. The latter started to come on to the South African market in 2005. It is early days and evacuated tube systems only account for slightly over 5% of glazed collectors sales in South Africa.
Supply of integral SWHs seems to have fallen in the market, despite their apparent suitability for the low income market.
Figure 3: Total area of SWHs supplied (m2)
2.2 Size of glazed collector systems on the South African domestic market
Survey results are clear that 200-litre systems dominated the domestic glazed collector market in South Africa in 2008. A large number of close coupled SWH are imported into SA, but a significant percentage are subsequently re-exported to neighbouring southern African countries. It is possible that the 100-litre category will expand significantly, if current trends persist and provided that appropriate financing mechanisms are developed which will facilitate the purchase and installation of SWHs in low income homes.
0
5000
10000
15000
20000
25000
30000
35000
1990 1991 1992 1993 1994 2000 2001 2005 2006 2007 2008 2009 PrIntegral Domestic flat plate Domestic evacuated tube Total domestic

South African solar water heater industry survey report 8
Figure 4: SWH market share by tank size
Figure 5: Typical low-cost close-coupled SWHs
5%
10%
68%
17%
100 L
150 L
200 L
300 L
Source: Xstream Hot Water Cylinders

South African solar water heater industry survey report 9
INSTALLATONS
Figure 6: Typical integral SWH installations
Figure 7: Relative market share of direct and indirect close-coupled SWHs
From the pie chart it is clear that close-coupled indirect SWHs dominate the domestic SWH market. Market penetration of vacuum tube systems is growing, only about 6 % of SWH
28%
44%
15%
7%
Close coupled direct Close coupled indirect
Split system direct Split system indirect
Source: Solar Engineering Services
South African solar water heater industry survey report 10
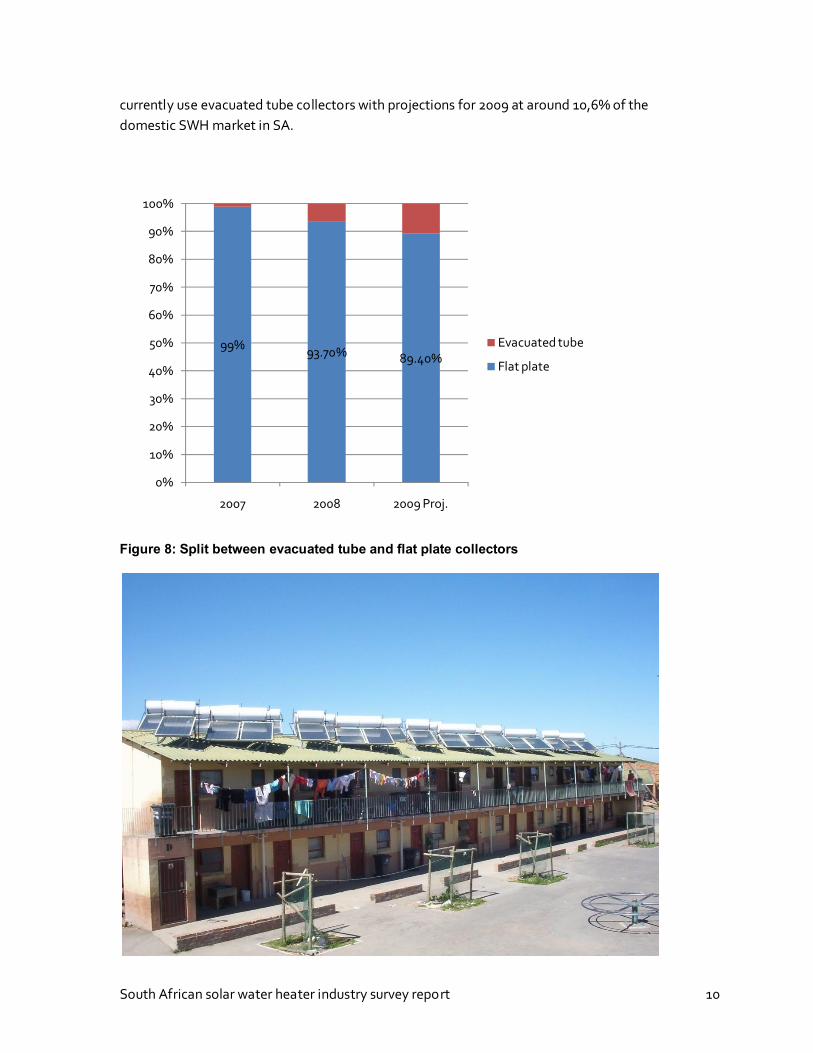
currently use evacuated tube collectors with projections for 2009 at around 10,6% of the domestic SWH market in SA.
Figure 8: Split between evacuated tube and flat plate collectors
99% 93.70% 89.40%
0%
10%
20%
30%
40%
50%
60%
70%
80%
90%
100%
2007 2008 2009 Proj.
Evacuated tube
Flat plate

South African solar water heater industry survey report 11
Figure 9: Typical Flat plate collectors installed on stands to provide for correct tilt angle and orientation to maximize solar radiation. These SWH are installed in mass housing at Llwandle in the Western Cape
3 Impact of overseas manufacturers on the South African SWH market
The bar chart below shows the rapid growth of imported SWHs in the South African market. The market is now approximately equally split between locally made SWHs and imported units. However, a significant percentage of imported SWH are re-exported to neighbouring African countries, which means that local manufacturers still meet about 60% of the local market. The growth is clearly shown in figure 9 below. Several of the larger importers are considering local manufacture , starting with collectors which could be combined with imported tanks, or use locally manufactured tanks. The main countries supplying into the SA market (in alphabetical order) are China, Germany, Greece and Israel. Most imports in terms of collector area are of European origin. Evacuated tubes are imported from China and Germany. Export of SWH manufactured in SA has decreased, and none of the local manufacturers reported significant exports of complete SWHs, though some export components in reasonable quantities.
Figure 10: Imported units as a % of total market
0
5
10
15
20
25
30
35
40
45
2007 2008 2009 Proj.
Imported units as a % of total market
Source: Solar Engineering Services

South African solar water heater industry survey report 12
Figure 11: Three year trend, SA manufactured vs imports; exports (m2)
4 Relationship between glazed and unglazed collectors
Shipment of unglazed collectors still dominates the market in South Africa, with glazed collector sales typically between 20% and 30% of unglazed collector sales. For the first time in SA history, total collector sales have topped the 100 000 m2 mark. It would appear that the economic recession is expected to have a greater impact on sales of unglazed collectors than on glazed collectors during 2009. Presumably because unglazed collectors are used mainly for pool heating, which is more of a luxury purchase than potable hot water – especially when electricity power cuts are on the cards.
0
5000
10000
15000
20000
25000
SA Manufactured Imports Exports
2007
2008
2009

South African solar water heater industry survey report 13
Figure 12: Breakdown of glazed vs unglazed SWHs (m2)
5 Employment within the solar water heating industry
The survey established that over 700 people are employed in the industry at the moment, although this significantly undercounts the employment contribution of the industry. In addition to the almost 400 installers permanently employed by the industry, according to suppliers who completed the questionnaires, a wide number of independent installers also operate, as do plumbers who install SWH units for clients.
The survey indicated that each SWH installation typically takes one day using a team of three to four people. Therefore, with approximately 18 500 units installed during 2008, installation capacity exists to install about 120 units per day, employing 480
0
20000
40000
60000
80000
100000
120000
1990 1991 1992 1993 1994 2000 2001 2005 2006 2007 2008 2009 ProjGlazed Unglazed Total

South African solar water heater industry survey report 14
Figure 13: Employment (number of people employed)
The above graph makes clear that most employment is at that installation phase, followed by manufacturing, then sales and administration functions. The results suggest that employment creation is driven by increased supply whether it is locally manufactured or imported.
Previous research has established that SWH is a significantly more employment-intensive method of energy genera tion compared to traditional energy forms (Austin, 2003).
6 Capacity in the industry
The survey questioned suppliers about their maximum existing capacity (i.e., without investing further in fixed infrastructure). The responses indicate that manufacturers and importers are able to supply approximately 200 000 m2 per year. This is about 11 times the number supplied during 2008 and largely represents the capacity of imports to increase supplies from abroad, rather than local manufacturers, which would have to invest in additional capacity beyond a certain level.
It is clear that some suppliers did expand capacity after the demand shock at the beginning of 2008, particularly importers who increased storage capacity, although many of these were comparatively recent entra nts to the industry. Manufacturers tended instead to hire temporary
0
100
200
300
400
500
600
700
800
2007 2008 2009 Pr.
Installation
Sales/Adm.
Manufacturing

South African solar water heater industry survey report 15
additional labour rather than invest in new machinery. Some respondents disclosed that they had formulated plans to build major new plants but the plans had not yet been given the green light. Another manufacturer also indicated the intention to invest in manufacturing capacity if Eskom hiked prices more than 20% (this was before Eskom’s 31% price hike in June 2009).
The ability to expand capacity was most straightforward for importers, where capacity is mainly a function of the capacity of their overseas supplier. One importer did indicate that their suppliers are fully committed and cannot increase volumes for 2009. Those importing from China, particularly evacuated tube units, were most enthusiastic about their ability to increase supply into the market. A handful of importers also disclosed that they have plans to invest in local manufacturing or assembly as a way to expand capacity.
In the medium term, suppliers should be able to access the full additional capacity of their offshore suppliers and increase local manufacturing. The researchers estimate that about 250 000 m2 of glazed collectors could be supplied to the South African market in the three yea r medium term. Longer term, with significant investment in capacity, greater supply could be achieved.
7 Financial performance
The financial section of the survey attempted to assess revenue and profitability, operational gearing (fixed vs variable costs), and planned investment in capacity by the industry.
Most of the respondents chose not to disclose financial information, particularly information on profitability. Neverthel ess, from those which did disclose information, some general features of the financial performance of the industry were determined.
7.1 Turnover
The data indicate that the industry consists of three quite different types of companies. At the smaller end are companies with annual sales of about R2,5m to R3m. There is a mid-tier of companies with sales of between R12m and R20m per year, and then one or two larger companies with sales of over R30m per year. Most companies cluster in those bands. Sales tend to correlate almost directly with length of time in the industry – older companies have larger sales. This suggests that while barriers to entry for newcomers to the industry are low, it is difficult to build critical mass over time.
Because less than half of the respondents provided financial information, the industry’s total sales were derived by multiplying the number of units sold by the average price. Doing so

South African solar water heater industry survey report 16
suggests an industry turnover of approximately R220m/year. However, this probably undercounts the number by excluding some commercial installations, unglazed collectors and some suppliers who did not respond to the survey.
Tank size: Units sold: Average price: Total sales:
100l 925 3500 R 3 237 500.00
150l 1850 7500 R 13 875 000.00
200l 12580 10000 R 125 800 000.00
300l 3145 25000 R 78 625 000.00
Total: R 221 537 500.00
Figure 14: Calculation of estimated total industry sales for 2009
Respondents indicated they had experienced a significant boost of up to 400% in sales in the first few months of 2008, immediately following the period of load shedding from the national grid. This extra demand tapered off, however, and by the second half of 2008, demand was back at levels before the black outs. This appears to have caught a number of importers in a position of excess stock, as they had ordered units from abroad in anticipation of higher levels of demand. As a result, many importers have experienced cash flow difficulties in the latter part of the year which may lead some to exit the industry unless demand surges soon.
7.2 Operational gearing
Most companies that responded to the questions on operational gearing indicated that the vast majority of their costs were in the form of variable costs rather than fixed costs. No more than 10% to 20% of total costs were fixed. This applied to companies that were both manufacturing and importing units. Anecdotal feedback is that most companies in the industry are relatively risk-averse, avoiding large capital investments in fixed infrastructure. Companies attempt to minimise overheads such as rent and salaries and operate on very lean basis, only spending in response to confirmed orders. This suggests an industry characterised by uncertainty over future demand, which is consequently risk averse and unwilling to take on fixed costs. This characteristic of the industry means it is likely to favour small scale manufacturing and importing of units, rather than make large upfront investments in manufacturing capacity, unless certainty is created about large-scale future demand. This is one reason that imports have been growing in the industry relative to domestic manufacturing, as imports require relatively less upfront investment.
As well as risk aversion, the responses indicate that the industry’s supply chain is largely based on the supply, installation and maintenance of units rather than the manufacture or importing

South African solar water heater industry survey report 17
of units. Hence, costs are driven primarily by the volumes of sales of units. Relatively little cost is based at the manufacturing or importing/storage level where most fixed costs are found.
A number of respondents indicated that they had invested in additional infrastructure, and therefore taken on further fixed costs, after the demand shock in early 2008. This was particularly the case among importers, who rented additional space to store extra stock. A few manufacturers also took some steps to increase capacity by investing modestly in additional machinery. However, additional demand was met by manufacturers mainly by increased working hours and work force. Following the fall in demand in the second half of 2008, most suppliers have cut back on further investment plans.
7.3 Profitability
Too few responses were received to make meaningful conclusions about the profitability of the industry as a whole. The figures provided, combined with conversations with industry participants, suggests the industry operates at an after-tax profit margin of 5% to 10%, although considering the size and risks in the industry, one would expect operating margins of about 25%. This profitability, however, may be harmed in those companies which have acquired significant stock which they cannot now move. This applies to both small and large operators, suggesting that the industry as it stands does not show significant returns to scale. This is supported by earlier comments that the industry is characterised by low operational gearing – operators have not invested in significant capacity. It seems reasonable to conclude that the industry is not particularly profitable, suggesting most entrants to the industry do so in anticipation of future markets rather than the current ma rket.
8 Use of industrial incentive schemes
Respondents were asked if they had every used, or tried to use, any of the industrial incentive schemes operated by the Department of Trade and Industry, or the tax incentives for research and development offered by the Department of Science and Technology.
Three respondents indicated that they had attempted to access DTI support but had not succeeded. They were negative on the experience, saying that they went to effort and incurred expenses in an effort to comply with DTI requirements but gave up in the end. None has used the DST scheme.
It is therefore reasonable to conclude that there are no suppliers currently in the industry which have used any government incentive scheme.

South African solar water heater industry survey report 18
9 Import duties
Respondents that import units indicate that they pay 15% duties on imported units, although one indicated he paid 7,5% on units sourced from the European Union. This applies collector plates as well. Components varied, with some saying they pay 20% on imported tanks, and 0% on imported pumps.
None of the respondents indicated that it pays the 5,7% tariff on units imported from the European Union (where some major manufacturers operate) despite the fact that in terms of the South African/European Free Trade agreement a tariff of 5,7% currently applies. The lack of utilisation of this opportunity requires attention.
10 Finance, warranties and maintenance
The survey included questions about warranties, finance and maintenance contracts.
10.1 Finance
About 15% of suppliers had attempted to offer finance to retail customers. These were usually in form of agreements with banks to either:
a) Provide unsecured loans backed by a bank
b) Provide for refinancing of existing homeloans (together with a bank or mortgage originator) in which equity is accessed to cover the cost of the unit.
Those suppliers which had offered finance to customers reported a low take-up and did not believe the finance facilities made much difference to demand. Most said the administration of the finance offerings was too complex to be viable.
10.2 Warranties
Most suppliers offered a five year warranty on their units, with some offering 10 years specifically for the flat plate collector or if a maintenance contract is included.
South African solar water heater industry survey report 19
10.3 Maintenance contracts
About 10% of suppliers offer maintenance contracts to customers, priced at between R200 and R500 per year for 10 years. More suppliers offered maintenance contracts to commercial customers but not to retail customers. However, most suppliers did not offer any maintenance agreements. Most of those which offer maintenance contracts are importers.
11 Training
The questionnaire asked suppliers about the training of installers. The lack of qualified installers was initially identified as a major constraint in the supply chain of the industry. However. discussions with manufacturers/importers have allayed these fears to some extent. Qualified plumbers can be relied on to install SWH professionally, provided that they have received detailed training for specific types of SWH by the supplier.
Respondents generally provide training directly to experienced plumbers themselves, although a handful used outside training providers. Respondents indicated that it took unskilled workers at least 6 months of on-the-job training with trained plumbers, before they would be able to install their specific SWHs satisfactorily. Those that trained dealers/agents, indicated that it takes around a week of classroom and on-the-job training.
The results show that certain suppliers with well-developed training facilities find it quite straightforward in increase capacity. This indicates that training is less of a barrier to increased supply than thought by many. Crucially, however, this depends on the skills expectations of qualified installers.
12 Increasing supply in the market
12.1 Eskom subsidy scheme
The questionnaire asked respondents for their views on Eskom subsidy scheme and what can be done to improve it. Respondents were asked for their overall view on the Eskom scheme. The average response was 2,7 with a mode of 3. (The questionnaire gave guidance that 1 was not satisfied at all, and 5 totally satisfied).

South African solar water heater industry survey report 20
Respondents were asked to give their views on what could be done to improve the programme. The following is a selection of the comments received:
• At least double the incentive value • Constantly advertise on radio, TV and other media • Eskom must advertise the concept of SWH more broadly on a national level and
possibly increase the rebate • Scrap the subsidy and put money in promotion. Eskom call for unconditional five year
guarantee but el iminate components-only guarantee • Subsidy scheme not helping sales, does provide promotion • SABS accreditation to be speed up. Inappropriate to repeat overseas accreditation with
expensive overseas holidays • Eskom subsidy not meaningful • Conflict of interest [for Eskom] • Greater advertising of solar as a concept • Rebates should be calculated on the thermal performance of a collector as tested by
SABS with a control (standard) tank.
Clearly the issue of greater promotion of SWHs as a product and the incentive scheme itself is widely believed by the industry as a way to improve the impact of the programme.
12.2 Blockages in the supply chain
Respondents were asked for their views on the biggest blockages to increased supply by companies in the industry. The following is a selection of their responses:
• High initial capital cost, public not aware • Incentives and ongoing customer funds are needed • Consumer education • Standards for installation • Consumer perception that it is not necessary • Poor quality products on the market that are under cutting high quality products • The market is giving solar a poor name • Low electricity cost • Cost of SABS approval excessive, SABS should accept overseas factory approval. • Promotion, lack of funding.
Again, promotional activity features prominently. SABS approval is also highlighted as a supply-side constraint in that it takes many months for new entrants to the market to get approval for their units. It is also expensive, particularly to obtain the SABS Mark.

South African solar water heater industry survey report 21
The number of qualified installers and standards is also a constraint, although as discussed above, not as significant a constraint as thought by some.
Conclusion
The industry has seen a major boost in scale during 2008. This demand was not sustained, though, and many participants report a decline in sales to levels of before the 2008 load shedding period.
The primary purpose of the survey was not only to assess the current state of the industry, but also to assess what factors and programmes would boost supply in the industry.
From the comments made by respondents, any large-scale SWH initiatives would need to satisfy the following concerns:
a) Provides sufficient lead time. Without lead times of at least one year, large orders will simply lead to price increases and a diversion of supply from existing commercial and residential consumers, defeating the objecting of increasing overall supply numbers. The estimate of 250 000 units could probably only be achieved after year three.
b) Is reliable. The industry is sceptical about officially mandated mass purchases due to difficulties with tender processes run by some cities and agencies. Any large roll-out programme will have to overcome such scepticism to ensure industry cooperation. Central government order guarantees are one way to do this..
c) Is backed by credible demand. The industry would rather see a wide, distributed demand mechanism, such as compulsory installation legislation or substantial subsidies, combined with massive consumer marketing campaigns, in order to reliably “bank” on the future market.
d) Is long term. Without an expectation of sustainable demand, suppliers will not make the appropriate investment in expanded capacity. Local manufacturing capacity, particularly, requires an expectation of a long-term viable market, rather than a three to five year supply window.
e) Sufficient subsidies. If a subsidy scheme is to be used it should be sufficient to make SWH clearly cost competitive with electric alternatives. It should incentivise both commercial and domestic users and reach all sections of the population including low income homeowners.
f) Relieves SABS bottleneck. To ensure ease of entry into the market by new operators, the speed and cost involved in obtaining SABS approval should be improved.
South African solar water heater industry survey report 22
A programme that delivered on the above points would be almost guaranteed to succeed from a supply point of view. Note that it is not necessary for a single roll-out programme for large supply to enter the ma rket. In fact, the critical success factor is that the industry perceives substantial, long-term demand for SWHs, rather than one-off large orders.
Eskom Distribution would like to thank all of the respondents for their feedback and contributions. Is the intention that this information will inform decision making in transforming the SWH industry in South Africa.

South African solar water heater industry survey report 23
Works cited
Austin, e. a. (2003). Employment Potential of Renewable Energy in South Africa. Agama Energy (Pty) Ltd, Sustainable Solutions and Earthlife Africa .
International Energy Agency. (2009). Solar Heating and Cooling Programme 2009 report.
South African solar water heater industry survey report 24
Appendix A: List of respondents
The researchers thank the following companies who provided input in the survey process. Some provided only general comments while others answered only certain questions.
1. ALTE Techn. 2. Associated Solar Industry 3. Atlantic Solar 4. Bitol Technology 5. Double D Solar 6. Renvest t/a Ecozone 7. Enervision via Solar 2000 8. E3 Env.Energy Enterprises 9. Franke Water Heating Systems 10. Greenpower 11. Green Power Solar Investment 12. Kwikot/Plumblink 13. Maxlite/Waterlite 14. Rentech 15. Restor 16. Richard Street Investments 17. Sol2 18. Solar Attraction t/a Solarise 19. Solar Beam 20. Solar 2000 21. Solar Dome 22. Solar for Africa 23. Solarhart 24. Solar Heat Exchangers 25. Solar Primag 26. Solarpro 27. Solar Zone 28. SolarQuip 29. Solco Solar 30. Suncol 31. Sun Command 32. Sun Power 33. Suntank 34. TASOL
South African solar water heater industry survey report 25
35. Teljoy 36. Totally Solar 37. Willi’s Energy 38. Xstream Hot Water Cylinders 39. Zingaro
This research process was undertaken by Stuart Theobald of Intellidex and Will Cawood of Solar Engineering Services on behalf of Eskom Distribution.
For further information, contact Eskom Distribution on 011 800 4090