the state of east africa 2012 - society for international development
TRANSCRIPT
The State of
Deepening Integration, Intensifying ChallengesEast Africa 2012

Cover Photo: Flickr/teachandlearn
The State of
East Africa 2012

Published by:
Society for International DevelopmentRegional Office for Eastern AfricaP O Box 2404 – 00100Nairobi KenyaTel: (+254 020) 2737991, 2737992Fax: (+254 020) 2737992Email: [email protected]: www.sidint.netTwitter: @SIDEastAfrica
ISBN: 978 9966 029 10 2
©Society for International Development (SID) 2012
Permission should be sought from SID before any part of this book is reproduced, stored in a retrieval system or transmitted in any form or by any means. Agreement will normally be given, provided that the source is acknowledged. Images in this document from Flickr are used under the Creative Commons Licence and belong to their respective authors.
This report has been produced by the Society for International Development, with the support of TradeMark East Africa.
The publication, however, remains the sole responsibility of the Society for International Development.
Design and layout by:Vivek BahukhandiCradle CommunicationTel: (+256 078) 2514141, (+256 075) 2585000Email: [email protected], [email protected]
Printed in East Africa by:Colour Print Tanzania LimitedTel: (+255 022) 2450331Email: [email protected]
The Society for International DevelopmentThe Society for International Development (SID) is an international non-governmental network of individuals and organizations founded in 1957 to promote social justice and foster democratic participation. Through locally driven international programmes and activities, SID strengthens collective empowerment and facilitates dialogue and knowledge-sharing worldwide. In addressing issues from a multi-disciplinary perspective the Society emphasises systemic and long-term approaches with a central focus on institutional and social transformation. SID has 39 chapters and 3,000 members in 50 countries. Its secretariat is located in Rome, Italy and it operates a Regional Office for Eastern Africa based in Nairobi, Kenya.
TradeMark East AfricaTradeMark East Africa (TMEA) is a not for profit organisation which promotes regional trade and economic integration in East Africa, by working closely with East African Community (EAC) Institutions, National Governments, Private Sector and Civil Society. TMEA has its headquarters in Nairobi with branches in Arusha, Bujumbura, Dar es Salaam, Kampala, Kigali and Juba.
TMEA is a transparent, flexible, responsive and partner driven organisa-tion. We enable synergies by having both a regional and national focus while working with existing East African mechanisms and structures.
The State of
Deepening Integration, Intensifying ChallengesEast Africa 2012

12 Population Profile13 Children and Youth14 Population Density16 Urbanization18 Migration19 Migrant Remittances
3 Purpose of this Report4 Key Insights8 Deepening Integration, Intensifying Challenges11 Three Options for Citizens’ Engagement
1 Acknowledgments2 Data Sources and Methodology87 Notes88 References
21 Land Use21 Total Land Area21 Land Use22 Forest Area23 Food and Agriculture23 Irrigation23 Fertilization24 Daily Calorie Intake25 Agricultural Trade25 Livestock Population26 Water Resources and Fisheries 26 Water Withdrawals26 Fisheries27 Fish Exports
29 Human Development and Poverty29 Human Development Index29 Poverty30 Rise of the Middle Class?31 Healthcare31 Healthcare Spending Per Capita31 Physicians Per 10,000 People32 Maternal Health32 Delivery by Skilled Birth Attendant 32 Maternal Mortality Rate33 Contraceptive Prevalence33 Unplanned and Mistimed Births34 Child Health34 Under-Five Mortality Rate34 Immunization35 Malnutrition36 Access to Improved Sanitation37 Access to Improved Water Source38 HIV Prevalence39 Life Expectancy40 Non-Communicable Diseases41 Education41 Primary and Secondary School
Enrollment42 Pupil-Teacher Ratio in Primary
Schools43 Adult Literacy
The People of East Africa
State of East Africa 2012 – The Big Picture
Natural Resource Base Human Development
Chapter 2
Chapter 1
Chapter 3 Chapter 412
3
20 28
The State of
Deepening Integration, Intensifying ChallengesEast Africa 2012

46 Road Network46 Total Road Network46 Quality of Paved Road Network47 Quality of Unpaved Road Network47 The Northern and Central Transport
Corridors49 Non-Tariff Barriers51 Railways51 Total Rail Network52 Pipelines 52 Pipeline Network 53 Airports53 Airports53 Connecting East Africa by Air55 The Major Ports in the Region55 The Port of Dar es Salaam56 The Port of Mombasa58 Energy Sources and Use58 Electricity Capacity and Consump-
tion 59 Regional Oil Consumption59 Renewable Electricity60 CO2 Emissions61 Rise of Mobile Communications61 Mobile Subscribers61 ‘Calling Tanzania?’ 62 Internet Users
64 Size, Structure and Performance of the Economy
64 Size of Real GDP64 Country Share of East Africa’s
Economy65 Economic Growth Trends65 Inflation Trends67 Trends in Foreign Financing67 Net Disbursements of Aid68 Foreign Direct Investment 70 Volume and Direction of Trade70 Trade Performance70 Top Exports and Imports71 Intra-Regional Trade73 Public Finance Profile73 Tax Revenue 74 Government Debt75 Labour and Employment75 Labour Force75 Employment and Unemployment
Estimates
78 Political and Institutional Structure
79 Corruption and Political Freedom79 Corruption Perception Index79 Corrupt Institutions80 Press Freedom81 Mo Ibrahim Index EAC Spotlight82 Military and Conflict82 Overall Expenditure83 Military Expenditure as Percentage
of GDP83 Refugees Hosted in East Africa84 Internally Displaced People in
East Africa85 Counterterrorism85 US Counterterrorism Assistance85 Regional Integration and Counter-
terrorism
Infrastructure Economic Profile Politics and Government
Chapter 5 Chapter 6 Chapter 745 63 77
Photo: Flickr/whl.travel

FiguresFigure 2.1 East African Population (2005–2030) ................................................................................................12Figure 2.2 Regional Fertility Rate (2005–2010) ..................................................................................................13Figure 2.3 Population Under Age 15 in East Africa (2000–2030) ...........................................................................13Figure 2.4 Population Density (2000–2030) .......................................................................................................14Figure 2.5 Urbanization in East Africa (1990–2030) ............................................................................................16Figure 2.6 Total Inflows of EAC Population to OECD Countries (2000–2009) ...........................................................18Figure 2.7 Total EAC Population Obtaining Legal Permanent Residency in the United States (2001–2010) .................18Figure 2.8 Net Remittances in East Africa (2000–2010).......................................................................................19Figure 3.1 Individual Country Share of East Africa’s Total Land Area (2008) ...........................................................21Figure 3.2 Land Use in East Africa (2008) .........................................................................................................21Figure 3.3 Forest Area in East Africa (1990–2010) ..............................................................................................22Figure 3.4 Irrigated Cropland in East Africa (2008) ............................................................................................23Figure 3.5 Intensity of Fertilizer Use in East Africa (kg/ha of Arable and Permanent Cropland; 2000 and 2008) .........23Figure 3.6 Daily Calorie Intake in East Africa (1999–2007) ..................................................................................24Figure 3.7 Agricultural Trade in East Africa (2002–2008) .....................................................................................25Figure 3.8 Water Withdrawals by Sector (1998–2007) .........................................................................................26Figure 3.9 Inland and Marine Fish Capture (2000-2009) ......................................................................................26Figure 3.10 Fish and Fisheries Export in East Africa (2008) ...................................................................................27Figure 4.1 Human Development Index in East Africa...........................................................................................29Figure 4.2 Size of the East African Middle and Poor Classes (2008) .......................................................................30Figure 4.3 Healthcare Spending Per Capita in East Africa (2000–2009) .................................................................31Figure 4.4 Number of Physicians Per 10,000 People (2003–2007) .........................................................................31Figure 4.5 Deliveries by Skilled Birth Attendants in East Africa ...........................................................................32Figure 4.6 Maternal Mortality Rates in East Africa..............................................................................................32Figure 4.7 Contraceptive Prevalence Rate in East Africa ......................................................................................33Figure 4.8 Estimated Under-Five Mortality Rate .................................................................................................34Figure 4.9 Child Immunization in East Africa (2004–2009) ..................................................................................34Figure 4.10 Trends in Under-Five Underweight Prevalence .....................................................................................35Figure 4.11 Trends in Under-Five Stunting Prevalence ..........................................................................................35Figure 4.12 Access to Improved Sanitation Coverage in East Africa (2000–2008) .....................................................36Figure 4.13 Access to Improved Water Sources in East Africa (2000–2008) ..............................................................37Figure 4.14 HIV Prevalence in East Africa ...........................................................................................................38Figure 4.15 Life Expectancy at Birth in East Africa (2005-2009) ............................................................................39Figure 4.16 Gender-Related Life Expectancy and Birth in East Africa (2010–2015) ...................................................39Figure 4.17 Non-Communicable Diseases in the EAC (2008) ...................................................................................40Figure 4.18 Comparative Analysis of Primary and Secondary School Enrollment (2002-2009) .....................................41Figure 4.19 Primary School Pupil-Teacher Ratios (2001-2010) ................................................................................42Figure 4.20 Male Adult Literacy Rates in East Africa (2000–2008) ..........................................................................43Figure 4.21 Female Adult Literacy Rates in East Africa (2000–2008) ......................................................................43Figure 5.1 East African Road Network (2008) .....................................................................................................46Figure 5.2 Quality of East Africa’s Paved Road Network (2008) .............................................................................46Figure 5.3 Quality of East Africa’s Unpaved Road Network (2008) .........................................................................47Figure 5.4 East Africa’s Rail Network (2010) ......................................................................................................51Figure 5.5 Pipeline Network in East Africa (2004-2010) ......................................................................................52Figure 5.6 Airports in East Africa (2010) ...........................................................................................................53Figure 5.7 Categories of Cargo in Dar es Salaam Port (2006–2009) .......................................................................55Figure 5.8 Categories of Cargo in Mombasa Port (2006–2009) ..............................................................................56Figure 5.9 Mombasa-Kampala Transit Time by Port and Road ...............................................................................57Figure 5.10 Mombasa-Kigali Transit Time by Port and Road ...................................................................................57Figure 5.11 Electricity Capacity and Consumption in East Africa (2003–2009) .........................................................58Figure 5.12 Regional Oil Consumption (2003) ......................................................................................................59Figure 5.13 Regional Oil Consumption (2010) ......................................................................................................59
List of Figures, Tables and Boxes

Figure 5.14 Total Renewable Electricity Net Generation (2005–2008) .....................................................................59Figure 5.15 Total CO2 Emissions from Energy Consumption (2005–2009) ..................................................................60Figure 5.16 Mobile Subscribers in East Africa (2002–2010) ....................................................................................61Figure 5.17 Tanzania’s Minutes to and from East Africa (2007–2010) ......................................................................61Figure 5.18 Internet Users in East Africa (2006–2010) .........................................................................................62Figure 6.1 Trends in Size of Real GDP in East Africa (2000-2010) ..........................................................................64Figure 6.2 Trends in Country Share of East African Economy (2000-2010) ..............................................................64Figure 6.3 Economic Performance in East Africa (2005–2011) ..............................................................................65Figure 6.4 Inflation Trends in East Africa (2005–2011) .......................................................................................65Figure 6.5 Net Disbursements of Aid to East Africa (2006–2010) ..........................................................................67Figure 6.6 Net Aid Disbursements Per Person (US$) ............................................................................................67Figure 6.7 American Aid to East Africa (2008–2012) ...........................................................................................68Figure 6.8 Trends in Foreign Direct Investment in East Africa (2000-2010) ............................................................68Figure 6.9 Trends in East Africa’s Trade Performance (2000–2010) ........................................................................70Figure 6.10 Intra-Regional Trade as Share of East Africa’s Total Trade (1990-2010) ...................................................71Figure 6.11 Tax Revenue as Share of Total Revenue (2003-2010) ............................................................................73Figure 6.12 Government Debt in East Africa (2002-2010) ......................................................................................74Figure 6.13 Labour Force Participation Rate (2000–2010) .....................................................................................75Figure 7.1 Perceptions of Corruption in East Africa (2005-2010) ..........................................................................79Figure 7.2 Military Spending in East Africa (2004–2010) .....................................................................................82Figure 7.3 Military Expenditure as Percentage of GDP (2003-2009) .......................................................................83Figure 7.4 Refugees Hosted in East Africa (2004–2010) ......................................................................................83Figure 7.5 Internally Displaced People in East Africa (2005–2010) .......................................................................84Figure 7.6 Aggregate US Counterterrorism and Related Assistance in East Africa (2005–2010) .................................85
TablesTable 2.1 Top 20 Fastest-Growing Cities in the World (2010–2025) ......................................................................16Table 2.2 Net Remittances Per Capita (2010) ....................................................................................................19Table 3.1 Livestock Population in East Africa (2005–2010) ................................................................................25Table 4.1 Share of East Africa’s Population Living Below the (National) Poverty Line ............................................29Table 4.2 Ranking of East Africa’s Universities Regionally and Globally ................................................................44Table 5.1 Effects of Non-Tariff Barriers ...........................................................................................................49Table 5.2 Regional Air Flights (from one week in November 2007 for East Africa)..................................................53Table 5.3 Regional CO2 Emissions Per Capita .....................................................................................................60Table 6.1 East Africa’s Top Three Export Products (2010) ...................................................................................70Table 6.2 East Africa’s Top Three Imports (2010)...............................................................................................71Table 6.3 Informal Trade in East Africa (2010) ..................................................................................................72Table 6.4 Trends in East Africa’s Economically Active Population in Thousands .....................................................75Table 7.1 Political and Institutional Structures in East Africa ............................................................................78Table 7.2 Top Ten Corrupt Institutions in the EAC (2011) ...................................................................................79Table 7.3 Press Freedom Rankings (2005-2011) .................................................................................................80Table 7.4 Mo Ibrahim Index Rankings (2011) ....................................................................................................81Table 7.5 Per Capita Military Spending (2009) ..................................................................................................82
BoxesBox 2.1 “Tanzania stays away from signing EAC report”...................................................................................14Box 2.2 “EAC integration can only succeed through compromise” .....................................................................15Box 2.3 Satellite Cities: A response to rapid urbanization in Eastern Africa? ......................................................17Box 3.1 “Low fruit and vegetable intake killing East Africans” .........................................................................24Box 4.1 A Regional Water and Sanitation Project ............................................................................................37Box 4.2 “Why did abolishing fees not increase public school enrollment in Kenya?” ............................................41

Box 4.3 What are our children learning? ........................................................................................................42Box 4.4 “Jobs galore for Kenyan teachers as Rwanda seeks tutors” ...................................................................43Box 4.5 Global Students: Where in the world are East Africa’s university-bound students studying? ......................44Box 5.1 A comment on East Africa’s Transport Corridors ..................................................................................48Box 5.2 Regional Infrastructure Projects .......................................................................................................48Box 5.3 “Road blocks on main truck transit routes: Are all checkpoints in Tanzania necessary?” ...........................50Box 5.4 No contest between Jomo Kenyatta and Julius Nyerere International Airports .......................................53Box 5.5 “Give Dar, Mombasa Ports to EAC before we all sink” ...........................................................................57Box 5.6 Connecting electricity across national borders ...................................................................................58Box 5.7 Most East Africans go online through their mobile phones ...................................................................62Box 6.1 What is hidden behind the ‘average’ inflation number? ........................................................................66Box 6.2 Some of East Africa’s regional business champions ..............................................................................69Box 6.3 Evidence of East Africa’s booming informal cross border trade? ............................................................72Box 6.4 Governments ban cereal and sugar exports, and try (unsuccessfully) to enforce it ...................................72Box 6.5 “Head of State Congratulates OBR for Good Revenue Collection Performance” ........................................73Box 6.6 East Africa’s 27 Million Jobs Challenge ..............................................................................................76Box 7.1 “Kagame Urges More Joint Military Exercises” ....................................................................................86
AFRICOM US Africa CommandAMISOM African Union Mission in Somaliabpd barrels per dayCPI Corruption Perception IndexDHS demographic and health surveyDRC Democratic Republic of the CongoEAC East African CommunityFDI foreign direct investmentGDP gross domestic productGER gross enrollment rateHDI Human Development IndexIDP internally displaced personIMF International Monetary FundkWh kilowatt hourMMR maternal mortality rateMW megawattNCD non-communicable diseaseNTB non-tariff barrierOECD Organisation for Economic Co-operation and DevelopmentPTR pupil-teacher ratioRVR Rift Valley RailwaysSID Society for International DevelopmentSSA sub-Saharan AfricaTAZARA Tanzania–Zambia RailwayTEU 20-foot equivalent unit
List of Abbreviations

The State of East Africa 2012 1
Acknowledgments
The Society for International Development (SID) would like to acknowledge the valuable input of the research review team who contributed to shaping the structure, themes and content of this report in the course of two workshops held in Nairobi (September 2011) and Arusha (December 2011). Participants at these workshops were Abdu Simba, Alex Awiti, Ali Hersi, Alphonse Rugambarara, Andrew Luzze, Andrew Othieno, Arthur Muliro, Charles Onyango-Obbo, Deus Kayitakirua, Donald Deya, Duncan Okello, Eriya Kategaya (Hon.), Gladys Kirungi, Gloria Atuheirwe, Hulda Ouma, Ibrahim Farah, Jacob Akech, Janah Ncube, Joel Okao, Joshua Maviya, Juma Mwapachu (Ambassador), June Warioba, Karenga Ramadhani (Hon.), Kwame Owino, Lyandro Komakech, Martha Mathenge, Michael Baingana, Mrisho Gamba, Myra Deya, Penny Simba, Petro Ahham, Salma Maoulidi, Stefano Prato and Yasmin Chali.
Prior to publication, this report went through two peer review sessions and several online exchanges with various experts drawn from a variety of professional fields and academic disciplines. The first review session was conducted internally by SID’s regional director, Ali Hersi, and deputy managing director, Arthur Muliro. The second review was done externally by Kwame Owino of the Institute of Economic Affairs in Nairobi, and Ezra Mbogori of the Akiba Uhaki Foundation. Excellent copy-editing services for this report were provided by Cherry Ekins.
SID would like to thank TradeMark East Africa for its financial support of the State of East Africa Report 2012.
Aidan EyakuzePrincipal Author, State of East Africa 2012Programme Director, SID East Africa Regional OfficeDar es Salaam, Tanzania
Ahmed SalimPrincipal Author, State of East Africa 2012Programme Officer, SID East Africa Regional OfficeDar es Salaam, Tanzania
Ali HersiDirector, SID East Africa Regional OfficeNairobi, Kenya

The State of East Africa 20122
Data Sources and Methodology
CONSISTENCy across sources and time
This State of East Africa 2012 updates and im-proves on the pioneering State of East Africa Report 2006. It seeks to examine the trends that have taken place in the region since 2006 across six main themes. This report therefore makes a special effort to use the same data sources as those used in the 2006 edition. Only data that could be obtained from the same source across time were used. However, there were some obstacles to over-come. The World Resources Institute, which was an important source of the data used for the 2006 report, has stopped updating its information. This report found it necessary to replace it with other sources for both the baseline (2006) and latest data.
COMPARABILITy across countries
As much as possible, data were obtained from the same source across countries. This was to ensure that the indicator was being defined, captured and measured in the same way for all countries so that comparisons could be made with a high degree of confidence. However, on the relatively few occasions where national definitions were provided (for poverty lines or unemployment), this report uses those to do cross-country comparisons.
The FOCUS on the ‘big-picture’ trends
Many data and information sources were used in this report. In some cases different sources reported different figures for the same indica-tor in the same period for the same country. This report focuses on the broader message that these data represent by comparing countries against each other, or analysing the trends across time that the data reveal.
The research and data collection process took place between September 2011 and January 2012. The latest available data have been used, but limitations in data sources mean that the information is not always up to date. The data are presented in graph and chart format for ease in visualization, comparison and interpretation. It is worth noting that statistics cannot capture the full richness of any community, country or region. In recogni-tion of this limitation, the report provides additional colour, perspective and nuance on the region by including analysis and commen-tary from academics, columnists and forward-looking researchers.
The data used in this report come from a variety of sources, including publications by the bureau of statistics of each country, multilateral institutions, international non-governmental organizations, research organizations and foundations. They are all secondary data, available in the public domain, and most were obtained via the Internet. The reference section contains full details of the sources used in this report.
THE FOLLOWINg CONSIDERATIONS gUIDEDTHE CHOICE OF THE SOURCES USED FOR THE DATA

The State of East Africa 2012 3
State of East Africa 2012 – The
Big Picture
First, it aims to inform. What are the facts about different social, economic, politi-cal, cultural and technological transitions currently taking place in East Africa? The report answers these questions by compiling, packaging and presenting a wide range of facts and figures on Tanzania, Kenya, Uganda, Rwanda and Burundi. The objective is to present a wide range of information that is easily accessible to the region’s decision-makers and its ordinary citizens. All of the data contained in this report are available in the public domain. However, they are often packaged in a variety of different formats and require significant effort to collect and summarize into a useful form for reference purposes. This report will be valuable for anyone looking for specific data on a variety of indicators in the region.
Second, it seeks to provide insight. What are we learning from what we are seeing? What hidden trends and narratives can be extrapo-lated from the data? What are the data not showing? The data essentially summarize important social, economic and political challenges as well as opportunities that the region faces. The report uses national-level data to provide insight and analysis on what
implications they have for regional integra-tion. It also attempts to enliven the data in order to interrogate and understand the forces that generate them. It asks, ‘Why are we seeing this particular set of facts and figures and not another? What are the missing trends that the data do not highlight?’ The report hopes to provoke valuable discussions among those interested in understanding the evolving structural foundations of East Africa.
Third, it aims to spark the imagination by encouraging different thinking about how we interact with the forces shaping our futures. The report seeks to inform and encourage a collective process of critical and creative thinking about the different ways in which emerging trends might shape the future of the East African region. Notwithstanding the warning frequently found in financial docu-ments that ‘past performance is not necessarily a guide to future performance’, the past often does contain important clues about the future. It is hoped that this report will encourage such forward-looking questions as ‘What will hap-pen if this trend continues for the next three decades?’ or, perhaps more interestingly, ‘What are the implications for the future of an abrupt discontinuity in a critical trend?’ While the
Purpose of this Report
The State of East Africa 2012 has four main objectives.
Chapter 1
Purpose of this Report
Key Insights
Three Options for Citizens’ Engagement
Deepening Integration, Intensifying Challenges
Uganda
Rwanda
Burundi
Kenya
Tanzania

The State of East Africa 20124
The People of East Africa
East Africa’s population is growing and ur-banizing at a rapid pace. The region’s popula-tion has grown by 24 million since 2005 and was estimated to be 139 million in 2010. The most important population characteristic of East Africa is its children and youth, who ac-counted for an overwhelming majority, 80 per cent, of the region’s total population in 2010.
By 2030 the region will have 178 million children and youth out of a total population of 237 million with 31 per cent (73 million) of them living in urban areas, putting pressure on the capacity of East Africa’s major cities to host these new urbanites.
Natural Resource Base
With increased population and higher popula-tion density expected in the future, the pressures on the region’s natural resources will intensify further. One clear indicator is the high rate of deforestation. Between 1990 and 2010 East Africa’s forested area shrank by 22 million hectares, and deforestation will continue to increase as more and more people inhabit the region.
The region’s agricultural trade increased from $2 billion in 2002 to $7.5 billion in 2008, with the entire region, with the exception of Kenya, exporting more agricultural products than importing. This raises concerns when juxtaposed with the region’s average per capita calorie intake, which has remained quite low in the same time period. Ugandans consumed the most calories, while the rest of the region consumed a little less than 2,060 calories per day. These countries include Tanzania and Kenya, which are the largest exporters of agricultural products. If both countries seem to have an abundance of agricultural goods, enough to export them,
report presents national statistics, it tries as much as possible to paint a regional picture by aggregating national data, analysing regional trends and comparing countries with each other to reveal the range of experiences and outcomes across East Africa. Fourth, this report will be a tool for engagement. The debate about the purpose, pace and outcomes of East Africa’s regional integration is intensifying. This report con-tributes to that debate by providing some evidence, analysis and a common fact base on which to base the discourse. Business, civil society groups and ordinary citizens can use it to engage with national and regional authorities and support specific advocacy initiatives on the basis of well-presented data
and articulated analysis.
The State of East Africa 2012 will open, encourage and inform conversations about the way in which regional integration is proceeding and what it means for ordinary people’s lives. In so doing, and mindful of the diversity of perspectives, experience and policy options within East Africa, it does not presume to prescribe specific actions to deal with the challenges or take advantage of the opportunities that are highlighted. However, if it enhances the quality of the discussion about regional integration and helps to widen the partici-pation in that conversation, the report will be contributing to making the East African Community (EAC) truly people-centred.
Key Insights
The State of East Africa 2012 encompasses six main chapters with specific over-arching themes. Within each chapter, the report analyses specific trends that have occurred in the region over the past six or seven years. Many key insights and trends were uncovered, which consequently paint the context in which the East African Community is now living.
With increased population and higher population density expected in the future, the pressures on the region’s natural resources will intensify further

The State of East Africa 2012 5
why can’t the region feed its people?
These calorie intake numbers are even more striking when juxtaposed with fertilizer consumption. In 2008 Kenya used the largest amount of fertilizer in the region but had a lower calorie intake than Uganda, which had one of the lowest fertilizer consump-tion levels but the highest calorie intake. For Uganda this is a clear indication of the greater land fertility that it enjoys rela-tive to the other countries in the region. It also invites some reflection on the efficacy, in domestic food security terms, of large fertilizer consumption.
Human Development
Human development in the region has improved over the past five years, as demon-strated by the improved human development indexes in each country. East Africans are also living longer, with an average increase of two years in their life expectancy. This is partly due to higher investments in health-care spending by national governments. Per capita spending on healthcare has increased in all countries, with Rwanda having the highest level at $48 in 2009, followed by Uganda at $43. As a result, and with invest-ments in maternal and child health, fewer mothers are dying in childbirth and more children are surviving infancy. However, the fact that there has been little change in the rate of stunted children suggests there has been little improvement in the quality of nutrition.
Despite some positive steps made in maternal and child mortality as well as a concerted effort by both national government and non-governmental organizations, poverty remains a major challenge in the region. Tanzania, Uganda and Rwanda have been able to reduce the proportion of the population living below their nationally defined poverty lines. However, high rates of population growth in the region have created strong headwinds against the poverty-reduction efforts. In absolute terms, 53 million East Africans (38 per cent of the regional population) lived below the poverty line in 2010. Tanzania saw an increase of 4.9 million people living below the poverty line over a 17-year period. During roughly the same period, 8.2 million Kenyans fell below that country’s poverty line and Burundi had an additional 1.5 million poor people. However, Uganda’s lifting of 2.3 million of its citizens above the poverty line
over an 18-year period stands in sharp and positive contrast to its neighbours. Rwanda’s remarkable reduction of the poverty incidence by 12 per cent between 2000 and 2011 lifted 100,000 of its citizens out of poverty.
East Africa has done well in increasing enrollment rates in primary school, with all countries passing the 100 per cent gross en-rollment rate threshold and therefore achiev-ing the Millennium Development Goal target of universal primary education. Burundi saw the largest increase in enrollment rates, from 71 per cent in 2002 to 135 per cent in 2009. Although most students in the region are at-tending primary school, a majority of them do not make the jump to secondary school. Kenya
had the highest secondary school enrollment rate at 45 per cent; the rest of the region had much lower enrollment rates. A lot of the challenges stem from the quality of primary school education. Many children are not learning effectively and not performing at the level they should, with alarmingly low results in reading English and Kiswahili effectively and doing simple arithmetic. One could point towards the high malnutrition rates, specifi-cally stunting, as an important reason for poor child performances in primary school.
Infrastructure
East Africa’s infrastructure deficit is a well-documented challenge. The region’s total road network in 2008 was 183,178 km, of which 91 per cent was unpaved. However, with 70 per cent of its paved roads classified as being in good condition, a part of Tanzania’s invest-ment is paying off.
The region has a seriously underperforming rail sector, but there have been efforts to revive it. In 2011 alone a series of projects were initi-ated in efforts to improve the rail sector. The Tanzania-Zambia Railway received a loan from China worth $40 million and the Rift Valley Railways received $40 million in funding from the African Development Bank. The passenger
Uganda’s lifting of 2.3 million of its citizens above the poverty line over an 18-year period stands in sharp and positive contrast to its neighbours

The State of East Africa 20126
volume on these trains is meagre, however, as most East Africans travel by bus or airplane. Weekly flights to and from EAC countries have increased, with Kenya receiving the larg-est amount of weekly airline traffic. Flights between Tanzania and Kenya account for the majority of intra-regional flights.
The ports of Dar es Salaam and Mombasa have continued to function at close to full capac-ity. Mombasa is the largest port in East Africa
and the second largest in sub-Saharan Africa in terms of tonnage and containers handled. At the end of 2011 and the beginning of 2012 the port was facing a crisis due to significant inefficiencies and container traffic slowing down the flow of goods. The port of Dar es Salaam has an intrinsic capacity of 11 million tonnes per year and handles 94 per cent of Tanzania’s total maritime trade activity. The telecoms revolution has been a notable
feature in the region during the last decade. Mobile phone subscriptions grew from 3 mil-lion in 2002 to 64 million in 2010, catalysing innovations such as M-Pesa that have helped deepen financial inclusion. The majority of East Africans are accessing the Internet through their phones; by September 2011 99 per cent of Kenya’s Internet users accessed it via a mobile phone.
Economy
Between 2000 and 2010 the size of East Africa’s economy grew in real terms from $32 billion to $79 billion. Kenya’s share of the regional economy was the largest at 40 per cent, while Tanzania had 29 per cent in 2010. East Africa’s economy grew at a rate of 6 per cent in 2010, with Rwanda having the fastest growth rate of 7.5 per cent. Kenya had a significant decrease in its growth rate in 2008 and 2009 (2 per cent and 3 per cent) due to the consequences of the post-election violence that occurred in December 2007 and spilled over to the first few months of 2008.
With consistent growth in its economy, East Africa has attracted significant investments both from the continent and globally. Total foreign direct investment inflows in the region were an estimated $1.7 billion in 2010, with the majority share (49 per cent)
Mobile phone subscriptions grew from 3 million in 2002 to 64 million in 2010, catalyzing innovations such as M-Pesa that have helped deepen financial inclusion
Photo: A. Muliro

The State of East Africa 2012 7
Trade between the EAC countries expanded from $2.2 billion in 2005 to $4.1 billion in 2010. However, the region’s trade with the rest of the world expanded faster, driven by its import-consuming economic growth performance
going to Uganda.
East Africa is globalizing. In 2010 the value of the EAC’s total trade with the world was $37 billion, which was double the $17.5 billion achieved in 2005. The region’s trade with the world as a share of its economy expanded from 28 per cent in 2005 to 47 per cent in 2010. Intra-EAC trade also expanded from $2.2 billion to $4.1 billion between 2005 and 2010. However, as a share of East Africa’s total trade, intra-regional trade declined slightly from 13 per cent in 2005 to 11 per cent in 2010.
Politics and government
The political and institutional apparatuses are quite similar across the five countries and have remained relatively stable over the past five years. All of the five governments are constitutional republics with legislatures cho-sen through periodic multi-party elections.
By 2010, four of the five EAC countries were considered ‘partly free’ with respect to politi-cal freedoms. Rwanda was considered ‘not free’, and has been the only country with that ranking since 2005. However, Rwanda had the highest share of women in parliament in 2010, 56 per cent, while Kenya had the lowest with 10 per cent. Corruption remains a challenge in the region. The prevalence of bribery was perceived to be highest in Burundi and the lowest in Rwanda. The police, revenue au-thorities and judiciary were cited as the most corrupt institutions in the region.
Conflict intensity seems to have diminished in recent years. The region hosted an estimated 733,080 refugees in 2010, down from 1.2 million in 2004. In 2004 the majority of these
refugees were hosted in Tanzania, but by 2010 the majority were hosted in Kenya, demon-strating a northward shift in conflict towards Somalia, Sudan and South Sudan.
Even with a lack of overt conflicts in the region, East Africa still spent $1.2 billion on its military in 2009, with Kenya and Uganda accounting for 73 per cent of total spend-ing. Prior to Operation Linda Nchi, Kenya was the only country in the EAC that had not engaged in a military operation in a neigh-boring country. Somalia has been the theatre for joint military operations, as three of the five EAC countries are now engaged there through the African Union Mission in Somalia (AMISOM). The US Africa Command (AFRI-COM) has engaged with the region through support of joint military exercises. In 2009 AFRICOM invited all EAC members for military exercises in Uganda to improve interoper-ability and capacity building to respond to complex humanitarian emergencies, and in 2011 two AFRICOM exercises were planned involving soldiers from Tanzania and Uganda. Military exercises among the EAC partner states have also increased over the years, demonstrating an acknowledgement that the region is becoming an important geostrate-gic location.

The State of East Africa 20128
Deepening Integration, Intensifying Challenges
Deepening Integration
If there is an overarching message emerging from this State of East Africa 2012, it is that more than a decade since it was rekindled, East Africa’s regional integration process is deepening.
It is certainly deepening in terms of the ex-panding scope of the laws, policies and regu-lations that are giving effect to the decisions about and ongoing commitment to closer economic social and political cooperation. The signing and ratification of the Treaty and the subsequent protocols to establish both the Customs Union in 2005 and the Common Market in 2010 according to the envisaged timetable attest to the fact that the process of deepening integration is on track. While there are those who will point, legitimately, to the less than ideal pace and degree of implementation of the Treaty and protocols, they will be hard-pressed to deny the bold ambition embodied in these agreements.
An even more important event was the acces-sion to the Treaty by Rwanda and Burundi in 2006 and their becoming full members of the East African Community on 1 July 2007. In
2011 Sudan formally applied to join the EAC, a few months ahead of the region’s most con-tiguous and newest neighbour, the Republic of South Sudan. In February 2012, Somalia also formally applied to join the EAC. If their reasons for wanting to join might be inscruta-ble, it is clear that they all see membership in the EAC as a crucial component of their future as nations.
Deepening integration is also signalled by the apparent and real coordination of national economic and social policies. While economic coordination is arguably required by the two protocols, particularly with respect to the tax code and trade regula-tions, it is instructive to observe the extent to which health and education policies and resource allocation decisions in the EAC countries point in the same direction. Each country increased healthcare spending on a per capita basis between 2000 and 2009, and primary school enrollment ratios have in-creased in all but one country (the exception is Uganda, according to trend data for 2001 and 2008). Driven by a combination of com-petition and cooperation, national domestic decision-makers are paying more attention to the signals from their neighbours.
Photo: A. Muliro

The State of East Africa 2012 9
Integration is deepening in the economic and commercial domain. The region’s economy returned a respectable average annual growth rate of over 6 per cent, with every country performing within a band of between 4 per cent and 11 per cent. Trade between the EAC countries expanded from $2.2 billion in 2005 to $4.1 billion in 2010. However, the region’s trade with the rest of the world expanded faster, driven by its import-consuming economic growth performance. The result has been that in relative terms the share of total trade that is conducted between EAC countries has stayed within a narrow 11–13 per cent range since 2005. Foreign direct investment has expanded across East Africa. Some of this has come from within the region as firms invest across borders in such areas as cement production, financial services, tourism and manufacturing. Economic infrastructure – roads, rail and ports – is also being jointly planned and developed and is attracting funding because of its regional nature and intent.
Integration has been deepening in the security field, most notably as countries par-ticipate in peacekeeping and anti-insurgency missions in Somalia and the Horn. Burundi and Uganda contributed troops to AMISOM. Kenya first entered Somalia in a declared act of self-defence and then agreed to join the AMISOM command structure. The number of joint military exercises in which all five EAC countries participate is also increasing.
Intensifying Challenges
As the process of regional integration deepens, the challenges facing the integrat-ing units and people are intensifying. These challenges relate to the fundamental purpose of the entire regional integration endeavour, namely the ambition to transform, in a posi-tive way, the quality of life and welfare of EAC citizens. Article 7a of the Treaty puts people at the centre of the integration efforts, as both the drivers and the beneficiaries of the process. Four major challenges to the ambi-tion of improving the lives of ordinary East Africans emerge from this report’s statistical tour of the East African region.
The first is the fact that poverty persists at high levels. The data suggest that the number of East Africans living below the poverty line increased from 44 million to 53 million, even though all countries, with the exception of Burundi and Kenya, reduced the share of their
population who lived below the respective national poverty line. However, the region’s growing population – 24 million East Africans were born between 2005 and 2010 – is provid-ing a strong counter-current to national efforts at reducing the poverty rate. This tension will persist going forward.
The second intensifying challenge is that of consistently achieving food security across the region through production and trade. The Horn of Africa experienced a severe drought and famine in 2010/2011 in which millions faced hunger and hundreds of thousands were
displaced. The major drivers of food security, including growing populations and their evolving tastes, the climate and the global trade dynamics that shape food prices, escape the direct control of national authorities. When pushed to respond to food insecurity, some actions, such as the ban on the export of grains from Tanzania in 2011 and Kenya’s retaliatory move to ban the export of seed, have undermined the spirit of regional integration.
At the intersection between poverty and food security is found the less visible but crucial element of the nutritional quality of the food that is consumed, particularly by East Africa’s children. The data show that while infant mortality rates have fallen across the region, the prevalence of malnutrition, as evidenced by high rates of stunting among children, has not diminished. The implication is that the re-gion is succeeding in keeping its babies alive, but is losing the fight to provide the quality of nutrition in their early years that will equip them for a productive life. Poor nutrition in early childhood has negative long-term effects on a person’s learning ability, health and future income-earning potential.The permanent disadvantage that is vis-ited upon malnourished children highlights the third intensifying challenge, namely the inequality that is both persisting and deepening within and between countries and across time. Every economy in the East
When pushed to respond to food insecurity, some actions, such as the ban on the export of grains from Tanzania in 2011 and Kenya’s retaliatory move to ban the export of seed, have undermined the spirit of regional integration

The State of East Africa 201210
African Community grew at a faster pace than the rate of its population growth in the last decade, implying rising per capita income at the aggregate level. However, the distribu-tion of the expanding wealth has not been equitable. Within countries the widening gap has generated strong social tension that has sometimes exploded into violent conflict. Kenya’s post-election violence in 2007–2008 was in part a manifestation of deep anger at
the shrinking opportunity space for personal and community advancement. At the regional level there is an argument afoot that the in-tegration process itself is generating unequal opportunities and inequitable outcomes, as those who are better endowed by either financial capital or marketable skills, or both, benefit more than the average citizen. Such sentiment is said to inform the instinct by some countries – Tanzania is often cited – to reduce the pace and limit the scope of the integration effort.
The fourth intensifying challenge emerges from the expanding interest in the region from the rest of the world. The world is paying close attention to East Africa and engaging with it with increasing intensity and broadening scope. The clearest evidence
of this is contained in the rising foreign direct investment to the region, attracted by its natural resource endowment, grow-ing economies and integrating markets. The African Development Bank’s projections to 2060 expect the wider East African regional economy to grow faster than that of any other part of the continent. Anecdote also suggests that the battle is on for East Africans’ hearts and minds, and it is being waged in part through intensifying interest and engagement with the region by inter-national media organizations from North America (Voice of America), Europe (BBC and Radio France International), the Middle East (Al Jazeera) and Asia (CCTV Africa). Seen from an external perspective, East Africa is burgeoning with commercial opportunity and is arguably Africa’s most dynamic region.
East Africa is also increasingly important from a global geopolitical standpoint. While violent conflict in the Great Lakes region has almost completely stopped, it has flared up in the Horn of Africa. Piracy in the Indian Ocean as far south as Tanzania and bombings in Kampala and Nairobi have directly affected the region. The deployment of Ugandan and Burundian troops to Somalia, first to keep the peace and then, joined by the Kenyan Defence Forces in 2011, to engage the Al-Shabaab; the fourfold increase from $15 million to $60 million in counterterrorism funding to the EAC; the arrival of 100 US military advisers in Uganda to assist in the hunt for the leader of the Lord’s Resistance Army; and AFRICOM’s multinational military exercises involving troops from the EAC countries in 2011 are all clear indications of the region’s growing importance in the global security context.
The world is paying close attention to East Africa and engaging with it with increasing intensity and broadening scope

The State of East Africa 2012 11
Given this intensifying attention, the chal-lenge for East Africans lies in the nature of their response to it. Three options are available. The first is to take charge. In this option, East Africans take advantage of these unprecedented opportunities to reshape their relationship with the world’s old and emerg-ing economic powers. They invest in the East African Community and use it as the primary vehicle with which to engage the world economically, politically and socially.
The second is to take a gamble. In this option, East Africans deliberately choose self-interest over the common good. A small business and political elite are aware of the shifting balance of power between the old and emerging economic powers and of their need to secure access to the region’s resources and markets. This is an opportunity to play the powers off against each other with the region’s elite acting as brokers between the money and the re-sources. They rely on their ability to play the game long enough to profit handsomely at a personal level. The East African Community is promoted only to the extent that it can facilitate such activity, failing which it is actively undermined in order to maintain decision-making discretion at the national level.
The third is to take a back seat. In this option, East Africans abdicate their responsi-bility and let matters take their own course. They display either a conscious lack of atten-tion to the forces shaping the region’s future and their implications, or an attitude of utter resignation to these factors – ‘that is how it always is’ – or both. They are distracted, take no deliberate actions and push the region in no particular direction. The East African Com-munity languishes untendered and neglected except in lofty speeches.
Ultimately, these three responses are
particularly relevant to how the people of East Africa engage with the regional integra-tion process. They can choose to take charge of the process and influence its evolution by redefining their relationship with their governments through the business and civil society organizations that represent their interests. They can make it a truly people-centred process with people-centred out-comes.
They can also choose a parochial approach, emphasize narrow national sovereignty, take a zero-sum, ‘I win, you lose’ approach to the East African regional integration process and shape a future littered with missed oppor-tunities and mutual mistrust between and within countries.
Alternatively, they can choose a path of wil-ful ignorance about the common challenges faced by the region and the opportunity presented to deal with them through collec-tive action. By starving it of attention and engagement, East Africans could emaciate the East African regional integration process and evaporate the possibility to transform their welfare positively.
The final responsibility for shaping East Africa’s future lies with its citizens. It is hoped that this State of East Africa Report 2012 will inspire in them an informed, robust and deep engagement with the promise and the challenges embodied in the East African Community regional integration agenda.
Three Options for Citizens’ Engagement
The final responsibility for shaping East Africa’s future lies with its citizens

The State of East Africa 201212
The Peopleof East Africa
Population Profile
The EAC had a combined population of 139 million in 2010 – an increase of 24 million people from 115 million in 2005. Tanzania had the largest population in the region at 45 million, fol-lowed by Kenya (41 million), Uganda (34 million), Rwanda (10 million) and Burundi (9 million). Sub-Saharan Africa’s total population in 2010 was estimated to be 821 million, with the EAC accounting for 17 per cent of the continent’s total. The population of the region is expected to be 237 million by 2030. Should the EAC expand its membership during the next decade or so, to include South Sudan, Sudan, Ethiopia and the Democratic Republic of Congo, the regional bloc could account for 40 per cent of the continent’s total population.
Source: United Nations Development Programme, Human Development Report (2006 and 2011)
Figure 2.1: East African Population (2005–2030)
East Africa’s population is growing and urbanizing at a rapid pace. The re-gion’s population has grown by 24 million since 2005 and was estimated to be 139 million in 2010. The most important population characteristic of East Af-rica is its children and youth, who accounted for an overwhelming majority, 80 per cent, of the region’s total population in 2010. By 2030 the region will have 178 million children and youth out of a total population of 237 million with 31 per cent (73 million) of them living in urban areas, putting pressure on the capacity of East Africa’s major cities to host these new urbanites.
Population Profile
Urbanization
Migration
Chapter 2
Photo: Flickr/MothersFightingForOthers

The State of East Africa 2012 13
In 2010 fertility rates1 in East Africa were highest in Uganda at 5.9 children per woman, down from 7.1 in 2005, and lowest in Burundi with 4.1 childern. Tanzania’s fertility rate increased slightly from 5.1 in 2005 to 5.4 in 2010, as did Kenya’s from 4 to 4.6. Fertility rates in Rwanda and Burundi fell during this period to 4.6 and 4.1 respectively. By comparison, the average fertility rate in sub-Saharan Africa (SSA) was 4.8, demonstrating that East Africa’s fertility rates are on average slightly higher.
Source: United Nations Development Programme, Human Development Report (2006 and 2011)
Figure 2.2: Regional Fertility Rate (2005–2010)
CHILDREN AND yOUTH
The region’s population of children under the age of 15 increased from 53.3 million in 2005 to 61 million in 2010. Children made up 45 per cent of East Africa’s population in 2005 and 44 per cent in 2010. Uganda had the largest share of children in its population with 48 per cent, making it the youngest country in the region. Looking ahead to 2030, the estimated popula-tion of children under the age of 15 will be 96 million, making up 41 per cent of the region’s 237 million people.
East Africa’s youth (people aged 15–34 years) was estimated in 2010 at 48 million or 35 per cent of the total population. By 2030 the 82 million young people will still account for 35 per cent of the total population.
East Africa’s 109 million children and youth accounted for 80 per cent of the total population in 2010. This group will grow to 178 million by 2030, although its share will decline to a still significant 75 per cent of the region’s total population.
Source: United Nations Population Division, World Population Prospects: (2010 Revision)
Figure 2.3: Population Under Age 15 in East Africa (2000–2030)

The State of East Africa 201214
POPULATION DENSITy
The population density in the region was highest in Rwanda, with 403 people per square kilometre in 2010, and lowest in Tanzania at 47 people per square kilometre. Kenya’s population density was 70 people per square kilometre, while Uganda’s was 139. Burundi had the second-highest density with 301.
In 2030 Rwanda is expected to have 667 people per square kilometre, the highest in the region and far exceeding the SSA average of 56 people per square kilometre. Uganda’s population density will have doubled by 2030. Tanzania will remain the only country in the region with less than 100 people per square kilometre.
Population density differences have generated interesting domestic and regional dynamics with respect to people’s access to land, and these are likely to intensify in the future. The position taken by Tanzania at the November 2011 meeting of the EAC Council of Ministers, as reported by a Tanzanian newspaper, The Citizen, and an editorial in Rwanda’s English daily, The New Times, illustrates some of the sensitivity about land and regional integration.
Source: Based on article in The Citizen, 28 November 2011,http://174.132.155.186/news/49-general-elections-news/17464-tanzania-stays-away-from-signing-eac-report.html
Source: United Nations Population Division, World Population Prospects: (2010 Revision)
Figure 2.4: Population Density (2000–2030)
Tanzania stayed away from signing a ministerial report to be presented to a summit of heads of state of the East Af-rican Community on 30 November 2011. The reason for doing so was not officially known, but several officials hinted that Tanzania objected to certain clauses in the report and consultations were ongoing.
Members of the Tanzanian delegation, who spoke on condition of anonymity because they were not official spokesper-sons, said that some partner states had ‘conspired’ to bring back the land issue under the framework of the political federation.
Tanzania stated in no uncertain terms that land would not be included in regional integration matters. It fought successfully for this position to be written in stone during negotiations for the EAC Common Market Protocol in 2008–2009. It did not expect the issue to crop up again.
BOx 2.1 – “TANzANIA STAyS AWAy FROM SIgNINg EAC REPORT”

The State of East Africa 2012 15
For some time now, land has been one of the sticking issues in the EAC integration process, with Tanzania, particu-larly, coming out strongly to resist what it perceives as efforts by other partner states to ‘encroach’ on its relatively vast territory. Indeed, if there’s anything that is set to test the resilience of the EAC integration project, it is land.
Yet nobody should make a fuss out of these open difficulties in the integration process. Delivering any socio-economic and political integration is not something for the faint-hearted. It takes courage, consistent engagement and the highest political will to truly unite sovereign and independent nations, each with strong attachment to their traditions. The integration process is a step at a time; success at one stage takes you to the other. That’s why success of the Customs Union and Common Market protocols are keys to both the Monetary Union and Political Federation. Although the continued debate over some of the fundamental components of the integration process could lead some to think that the EAC still has a long, bumpy way to go, such differences should encourage the proponents for the EAC integration to work even harder to ensure that the integration dream comes to pass.
Most importantly, once the EAC citizens start to enjoy the full benefits of the integration process, they will support the integration cause. This is a process that can only succeed if driven by the people, and therefore, it is important that the citizens see the benefits soon. Only then shall they agree to reach a compromise for the sake of the integration cause.
BOx 2.2 – “EAC INTEgRATION CAN ONLy SUCCEED THROUgH COMPROMISE”
Source: Editorial, The New Times, 29 November 2011 http://allafrica.com/stories/201111290304.html

The State of East Africa 201216
Urbanization
Urbanization is growing in the region, with Tanzania being the most urbanized country in the EAC. In 2010 26 per cent of Tanzanians lived in urban areas compared to 19 per cent in 1990. Rwanda urbanized the fastest between 1990 and 2010, when the share of its population living in urban areas increased from 5 per cent to 19 per cent. Kenya’s urbanization rate increased from 18 per cent to 22 per cent and Uganda’s from 11 per cent to 13 per cent during the same period. Bu-rundi had the region’s lowest rate of urbanization, at 6 per cent in 1990 and 11 per cent in 2010.
However, the region’s urbanization rate is significantly lower than the SSA average of 37 per cent in 2010. Even with 73 million East Africans expected to be living in urban areas in 2030, this will still represent a 30 per cent urbanization rate, below the projected average of just under 50 per cent for SSA.
Source: United Nations Population Division, World Urbanization Prospects (2009 Revision)
Figure 2.5: Urbanization in East Africa (1990–2030)
Table 2.1 – Top 20 Fastest-growing Cities in the World (2010–2025)
City Country Increase in urban population (%)
Ouagadougou Burkina Faso 127.1
Lilongwe Malawi 106.4
Blantyre-Limbe Malawi 106.2
Yamoussoukro Côte d’Ivoire 103.0
Niamey Niger 101.0
Kampala Uganda 99.5
Dar es Salaam Tanzania 85.2
Kathmandu Nepal 84.7
Kabul Afghanistan 84.6
Sana’a Yemen 83.4
Vientiane Laos 80.6
Kananga DRC 80.3
Kigali Rwanda 79.9
Kisangani DRC 79.8
Mombasa Kenya 79.0
Mbuji-Mayi DRC 78.6
Lubumbashi DRC 77.8
Nairobi Kenya 77.3
Conakry Guinea 75.8
Bamako Mali 74.9
Source: United Nations Population Division, World Urbanization Prospects (2009)

The State of East Africa 2012 17
As Table 2.1 shows, 25 per cent of the world’s fastest-growing cities between 2010 and 2025 are expected to be in East Africa: Kampala, which leads the pack, followed by Dar es Salaam, Kigali, Mombasa and Nairobi. As East Africa’s cities grow, new responses to the challenge of urbanization seem to be emerging (see Box 2.3).
How is the region responding to rapid urbanization? With satellite cities. There are five satellite cities proposed in the region: Tatu City and Konza Technology City adjacent to Nairobi, Kigamboni in Dar es Salaam, Kalungulu in Kampala and La Cite du Fleuve (River City) in the DRC [Democratic Republic of the Congo], which will literally rise from the River Congo itself. These ambitious projects may mitigate the challenges that will result from the region’s high urbanization rates, but they may also lead to some surprising outcomes.
Satellite cities as secession by the rich? Could these cities, as envisaged, deepen the social division and exclusion in the region’s urban areas? There is an almost deafening silence on the issue of their implications for ordinary and poor urban residents. While some of the language and marketing sounds inclusive, the pricing is not. The poor and vulnerable populations in the ‘mother’ cities face an increased risk of further marginalization and impoverishment in at least two ways. The first is by encouraging the migration of richer residents to the new cities, taking with them the property taxes, land rent, rates and levies paid to local city authorities. This revenue loss would have to be compensated for either by imposing higher rates or levying new taxes on the less affluent residents who cannot move, or by lowering the quality of existing services, for want of resources. Ultimately, that fragile, intangible and precious quality of vibrant cities, a sense of shared space and experience between rich and poor, could be lost forever.
East Africa’s satellite cities as charter cities. The US economist Paul Romer has developed the concept of charter cities as a ‘radical solution to the problem of poverty’. According to the Chartercities.org website, ‘A charter city is a new type of special reform zone. It extends the concept of a special economic zone by increasing its size and expanding the scope of its reforms. It must be large enough to accommodate a city with millions of workers and residents.’ Com-bining Romer’s concept and the growth of satellite cities in East Africa points to the fascinating possibility that the region could lead the world in the creation of private charter cities which are geographically, socially, fiscally and, ultimately, politically separate from their host nations. Imagine a future in which international bidding processes will select the management teams for satellite cities; residents (firms and families) would apply for residency and be interviewed to gauge their financial fitness and cultural compatibility; and day workers would be issued with special passes to be in the city. A new ‘city-building business’ has arrived through the satellite cities in East Africa. A future of charter cities is on the doorstep. It remains to be seen which of the city-firms will flourish magnificently and which of them will fail.
BOx 2.3 – SATELLITE CITIES: A RESPONSE TO RAPID URBANIzATION IN EASTERN AFRICA?
Source: Society for International Development, GHEA Outlook No. 18, Satellite Cities

The State of East Africa 201218
Migration
More than 26,000 East Africans migrated to OECD (Organisation for Economic Co-operation and Development) countries in 2009. This represents a 180 per cent increase over the year 2000, when 9,300 East Africans migrated to the OECD. The 14,000 Kenyans who left in 2009 accounted for 54 per cent of the region’s total, followed by Tanzania with 4,100 (16 per cent) emigrants. The 3,034 Burundians who left for OECD countries exceeded the numbers from Uganda (2,446) and Rwanda (2,233). It should be noted, though, that inflows of EAC popula-tions to the OECD do not include irregular migrant patterns or those who overstay their visas (e.g. in the United States).
Source: OECD International Migration Database
Source: US Office of Immigration Statistics, Department of Homeland Security
Figure 2.6: Total Inflows of EAC Population to OECD Countries (2000–2009)
Figure 2.7: Total EAC Population Obtaining Legal Permanent Residency in the United States (2001–2010)
Legal permanent residency is an indicator of how many people are seeking to live in the United States for an extended period.2 In 2010 11,686 East Africans obtained US legal permanent residency, more than three times the number of 3,661 in 2000. East Africans made up 10 per cent of the 101,355 Africans who obtained residency in 2010.
The 7,421 Kenyans who obtained US permanent residency represented 64 per cent of East Africans who got this status. The balance consisted of 1,850 Tanzanians (16 per cent), 1,085 Ugandans (9 per cent), 841 Burundians (7 per cent) and 489 Rwandese (4 per cent). In the peak year of 2009 the 16,474 East Africans accounted for 13 per cent of the 127,000 Africans who obtained permanent residency.
In addition to obtaining legal permanent residency, EAC citizens pursue work in the United

The State of East Africa 2012 19
States using the H1-B visa (for highly skilled professionals). In 2010 1,191 H1-Bs were issued to East Africans, with Kenya taking 819 (68 per cent) of them, followed by Tanzania with 197 (16 per cent) and Uganda with 124 (10 per cent). Rwanda and Burundi each had fewer than 30. East Africa accounted for 16 per cent of total H1-Bs issued to Africans, the majority of which went to Nigerians (1,591) and South Africans (1,546), with a combined share of 42 per cent of H1-Bs issued to Africans.
MIgRANT REMITTANCES
InflowsAccording to the World Bank, and based on the IMF (International Monetary Fund) balance of payment statistics, total remittances to East Africa were $2.8 billion in 2010. These remittance inflows are almost three times greater than the $791 million received in 2000. Kenya received $1.77 billion (63 per cent) in 2010, followed by Uganda with $915 million (32 per cent). Rwanda ($97 million), Burundi ($28 million) and Tanzania ($25 million) combined received just 5 per cent of the remittance inflows to East Africa.
OutflowsRemittance outflows from the region in 2010 were $862 million, more than double the $404 million outflow in 2000. In 2010 Uganda and Tanzania led the region in migrant remittance outflows with $602 million and $127 million. Kenya only remitted $61 million. Interestingly, Tanzania is a net source of remittance flows. In the decade 2000–2010, Tanzania had remit-tance inflows of $172 million and outflows of $546 million.
Source: World Bank estimates based on the International Monetary Fund’s Balance of Payments Statistics Yearbook (2011)
Figure 2.8: Net Remittances in East Africa (2000–2010)
Table 2.2 – Net Remittances Per Capita (2010)
Population (million)
Net remittances (US$ million)
Net remittances per capita (US$)
Tanzania 45 (102) (2)
Kenya 41 1,716 42
Uganda 34 313 9
Rwanda 10 91 9
Burundi 9 27 3
EAC 139 2,044 15
Source: World Population Prospects (2010 Revision), World Bank estimates based on the International Monetary Fund’s Balance of Payments Statistics Yearbook (2011)
On a per capita basis, Kenya is a net recipient of remittances to the tune of $42 per capita.

The State of East Africa 201220
Natural Resource Base
With increased population and higher population density expected in the future, the pressures on the region’s natural resources will intensify further. One clear indicator is the high rate of deforestation. Between 1990 and 2010 East Africa’s forested area shrank by 22 million hectares, and deforestation will continue to increase as more and more people inhabit the region.
The region’s agricultural trade increased from $2 billion in 2002 to $7.5 billion in 2008, with the entire region, with the exception of Kenya, ex-porting more agricultural products than importing. This raises concerns when juxtaposed with the region’s average per capita calorie intake, which has remained quite low in the same time period. Ugandans consumed the most calories, while the rest of the region consumed a little less than 2,060 calories per day. These countries include Tanzania and Kenya, which are the largest exporters of agricultural products. If both countries seem to have an abundance of agricultural goods, enough to export them, why can’t the region feed its people?
These calorie intake numbers are even more striking when juxtaposed with fertilizer consumption. In 2008 Kenya used the largest amount of fertilizer in the region but had a lower calorie intake than Uganda, which had one of the lowest fertilizer consumption levels but the highest calorie intake. For Uganda this is a clear indication of the greater land fertility that it enjoys relative to the other countries in the region. It also invites some reflection on the efficacy, in domestic food security terms, of large fertilizer con-sumption.
Land Use
Food and Agriculture
Water Resources and Fisheries
Chapter 3
Photo: Malimbika Photography

The State of East Africa 2012 21
Land Use
TOTAL LAND AREA
LAND USE
East Africa’s total land area is 170.24 million hectares. In 2008 Tanzania made up 52 per cent of the region’s area, followed by Kenya (33 per cent), Uganda (12 per cent), Burundi (2 per cent) and Rwanda (1 per cent). Each country’s share of the East African total land area has remained unchanged.
Total agricultural land in East Africa amounts to 81 million hectares – almost 48 per cent of the region’s land area. Pastures take up 5.7 million hectares (64 per cent), arable land is estimated at 24.2 million hectares (29.8 per cent) and 5.0 million hectares (6.2 per cent) are under permanent crops.3
Given its larger size, Tanzania has the largest share of East Africa’s arable land (41 per cent) and pastures (46 per cent). However, Uganda accounts for 44 per cent of the region’s land under permanent crops, ahead of Tanzania’s 30 per cent share. Within countries, it is interest-ing to note that Tanzania and Kenya have put less than 4 per cent of their total land under permanent crops, in contrast to Uganda, Rwanda and Burundi, which have between 14 per cent and 16 per cent.
Source: UN FAO Statistical Yearbook (2010)
Source: UN FAO Statistical Yearbook (2010)
Figure 3.1: Individual Country Share of East Africa’s Total Land Area (2008)
Figure 3.2: Land Use in East Africa (2008)

The State of East Africa 201222
FOREST AREA
In 1990 East Africa had 106.7 million hectares of forest. This area shrank by more than 9 per cent to 97.7 million hectares in 2000, and a further 13 per cent to 84.9 million hectares in 2010. In total, 21.8 million hectares of forests were cut down.
In 2010 Tanzania had the largest share of forest area (including wooded land) in East Africa, with 45 million hectares (53 per cent). However, Figure 3.3 shows a clear downward trend, which points to significant deforestation in the country during the two decades since 1990. Indeed, Tanzania reduced its forested area by 14.6 million hectares, accounting for 67 per cent of the region’s total deforestation.
Kenya’s share of the forest area in 2010 was 32 million hectares (38 per cent), but this was almost 18 per cent less than in 1990. Kenya accounted for 33 per cent of the region’s forest de-pletion. Burundi also lost some 117,000 hectares of forest. Uganda and Rwanda have expanded their respective forest areas by 43,000 and 3,000 hectares over the last two decades. This is, however, a very small percentage compared to the total deforested area.
Source: FAOSTAT
Figure 3.3: Forest Area in East Africa (1990–2010)

The State of East Africa 2012 23
At 328,000 hectares, the proportion of East Africa’s agricultural land under irrigation in 2008 was just 0.4 per cent. Tanzania had the region’s most irrigated cropland at 184,000 hectares, an increase of 9 per cent from 168,300 hectares in 2002. Kenya’s 103,000 hectares in 2008 represent an 18 per cent expansion from its 2002 level. Burundi had 23,000 hectares under irrigation, followed by Uganda and Rwanda with 9,000 hectares each. According to an analysis published in 2009, individual countries are achieving 5 per cent (Rwanda) and 29 per cent (Kenya) of their potential.4
FERTILIzER USE
Kenya consumed the largest amount of fertilizer per hectare in the region. Despite a slight decline from 31.3 kg/ha in 2000 to 29 kg/ha in 2008, it was over four times greater than Rwan-da’s 6.8 kg/ha and almost six times more than Tanzania’s 5.0kg/ha. Rwanda increased fertilizer use 22-fold, putting it second behind Kenya in 2008 after being placed last in 2000. Tanzania and Uganda increased their fertilizer use by more modest margins, while use in Burundi fell by almost 50 per cent.
Source: Authors’ computation based on FAO Statistical Yearbook (2010)
Figure 3.5: Intensity of Fertilizer Use in East Africa (kg/ha of Arable and Permanent Cropland; 2000 and 2008)
IRRIgATION
Source: UN FAO Statistical Yearbook (2010)
Figure 3.4: Irrigated Cropland in East Africa (2008)
Food and Agriculture
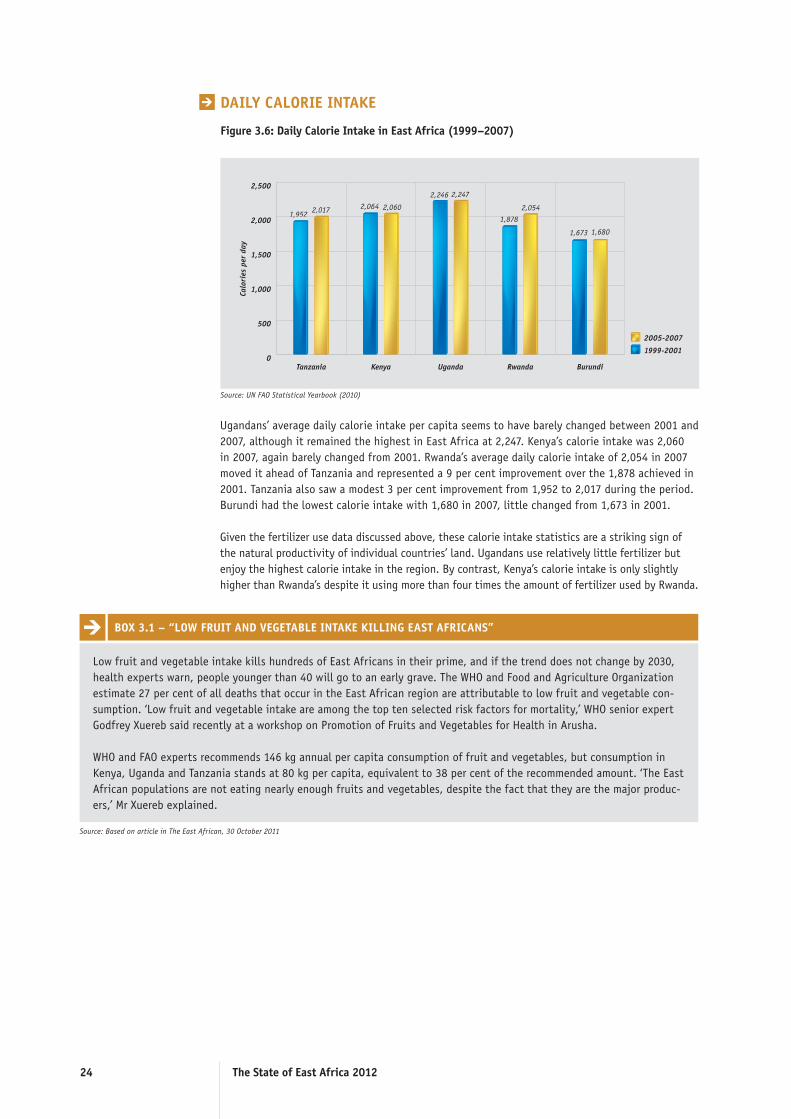
The State of East Africa 201224
DAILy CALORIE INTAKE
Source: UN FAO Statistical Yearbook (2010)
Figure 3.6: Daily Calorie Intake in East Africa (1999–2007)
Ugandans’ average daily calorie intake per capita seems to have barely changed between 2001 and 2007, although it remained the highest in East Africa at 2,247. Kenya’s calorie intake was 2,060 in 2007, again barely changed from 2001. Rwanda’s average daily calorie intake of 2,054 in 2007 moved it ahead of Tanzania and represented a 9 per cent improvement over the 1,878 achieved in 2001. Tanzania also saw a modest 3 per cent improvement from 1,952 to 2,017 during the period. Burundi had the lowest calorie intake with 1,680 in 2007, little changed from 1,673 in 2001.
Given the fertilizer use data discussed above, these calorie intake statistics are a striking sign of the natural productivity of individual countries’ land. Ugandans use relatively little fertilizer but enjoy the highest calorie intake in the region. By contrast, Kenya’s calorie intake is only slightly higher than Rwanda’s despite it using more than four times the amount of fertilizer used by Rwanda.
Source: Based on article in The East African, 30 October 2011
Low fruit and vegetable intake kills hundreds of East Africans in their prime, and if the trend does not change by 2030, health experts warn, people younger than 40 will go to an early grave. The WHO and Food and Agriculture Organization estimate 27 per cent of all deaths that occur in the East African region are attributable to low fruit and vegetable con-sumption. ‘Low fruit and vegetable intake are among the top ten selected risk factors for mortality,’ WHO senior expert Godfrey Xuereb said recently at a workshop on Promotion of Fruits and Vegetables for Health in Arusha.
WHO and FAO experts recommends 146 kg annual per capita consumption of fruit and vegetables, but consumption in Kenya, Uganda and Tanzania stands at 80 kg per capita, equivalent to 38 per cent of the recommended amount. ‘The East African populations are not eating nearly enough fruits and vegetables, despite the fact that they are the major produc-ers,’ Mr Xuereb explained.
BOx 3.1 – “LOW FRUIT AND VEgETABLE INTAKE KILLINg EAST AFRICANS”

The State of East Africa 2012 25
AgRICULTURAL TRADE
East Africa’s total agricultural trade increased by 266 per cent from $2.0 billion in 2002 to $7.5 billion in 2008. However, the region’s net export position changed from a surplus of $322 million to a net deficit of $644 during the same period. Kenya accounted for 46 per cent of this trade in 2002 and increased its share to 53 per cent by 2008. Indeed, it is Kenya’s net deficit of $1.34 billion in 2008 that generated East Africa’s overall agricultural trade deficit position in that year.
East Africa’s main agricultural imports in 2000–2009 consisted of wheat, palm oil, maize, refined sugar, and milled rice. Main exports were tea, coffee, fresh vegetables, tobacco and wheat flour.
Source: UN FAO Statistical Yearbook (2010)
Figure 3.7: Agricultural Trade in East Africa (2002–2008)
LIVESTOCK POPULATION
East Africa’s cattle population increased from almost 39 million in 2005 to 47 million in 2010. Tanzania had the largest herd of cattle, accounting for 46 per cent of the region’s total in 2005. By 2010 Kenya’s cattle herd had grown to an increased market share of 38 per cent. Kenya’s share of the 53 million goats and sheep in 2005 was largest (45 per cent), but this fell to 41 per cent in 2010 as Uganda, Rwanda and Burundi all increased their flocks. Uganda’s 33 per cent share of East Africa’s 100 million chickens in 2005 was lost to Tanzania in 2010.
Table 3.1 – Livestock Population in East Africa (2005–2010)
2005 2010
Cattle goats and sheep
Chickens Cattle goats and sheep
Chickens
Tanzania 17,719 16,650 32,000 19,500 17,100 33,500
Kenya 13,019 23,916 28,657 17,863 23,191 30,398
Uganda 6,770 9,400 32,600 7,650 10,650 30,000
Rwanda 1,004 1,803 2,109 1,218 3,478 2,848
Burundi 396 1,588 4,800 596 2,459 5,050
Total EAC 38,908 53,357 100,166 46,827 56,878 101,796
Source: FAOSTAT (all figures in thousands)

The State of East Africa 201226
The main reason for water withdrawals in the region was agricultural use in the 1998–2007 period. This use accounted for 89 per cent of Tanzania’s withdrawals, 79 per cent of Kenya’s, 77 per cent of Burundi’s and 68 per cent of Rwanda’s. Only in Uganda did the withdrawal of water for domestic use exceed that for agricultural purposes.
WATER WITHDRAWALS
Source: UN FAO Statistical Yearbook (2010)
Figure 3.8: Water Withdrawals by Sector (1998–2007)
Water Resources and Fisheries
In 2009 some 880,000 tonnes of fish were captured in East Africa – a 20 per cent increase from the amount captured in 2000–2002. Uganda took the largest share (45 per cent) of the total catch in 2009, with 400,000 tonnes. Tanzania followed with 314,852 tonnes (35 per cent), and Kenya caught 130,395 tonnes (15 per cent). Rwanda and Burundi’s shares accounted for 3 per cent of the total catch in 2009.
FISHERIES
Source: UN FAO Statistical Yearbook (2010)
Figure 3.9: Inland and Marine Fish Capture (2000-2009)

The State of East Africa 2012 27
The region exported a total of $380.8 million worth of fish in 2008, an increase of 90 per cent from the $200.0 million that was exported in 2002. Tanzania accounted for 48 per cent of these exports with $184.7 million, down from 57 per cent in 2000–2002 due to increasing exports from Uganda and Kenya. Uganda had the second-largest share at 32 per cent with $120.1 mil-lion of exports, followed by Kenya’s 20 per cent ($75.7 million).
FISH ExPORTS
Source: UN FAO Statistical Yearbook (2010)
Figure 3.10: Fish and Fisheries Export in East Africa (2008)

The State of East Africa 201228
Human Development
Human development in the region has improved over the past five years, as demonstrated by the improved human development indexes in each country. East Africans are also living longer, with an average increase of two years in their life expectancy. This is partly due to higher investments in healthcare spending by national governments. Per capita spending on healthcare has increased in all countries, with Rwanda having the high-est level at $48 in 2009, followed by Uganda at $43. As a result, and with investments in maternal and child health, fewer mothers are dying in childbirth and more children are surviving infancy. However, the fact that there has been little change in the rate of stunted children suggests there has been little improvement in the quality of nutrition.
Despite some positive steps made in maternal and child mortality as well as a concerted effort by both national government and non-governmental organizations, poverty remains a major challenge in the region. Tanzania, Uganda and Rwanda have been able to reduce the proportion of the popu-lation living below their nationally defined poverty lines. However, high rates of population growth in the region have created strong headwinds against the poverty-reduction efforts. In absolute terms, 53 million East Africans (38 per cent of the regional population) lived below the poverty line in 2010. Tanzania saw an increase of 4.9 million people living below the poverty line over a 17-year period. During roughly the same period, 8.2 million Kenyans fell below that country’s poverty line and Burundi had an additional 1.5 million poor people. However, Uganda’s lifting of 2.3 mil-lion of its citizens above the poverty line over an 18-year period stands in sharp and positive contrast to its neighbours. Rwanda’s remarkable reduc-tion of the poverty incidence by 12 per cent between 2000 and 2011 lifted 100,000 of its citizens out of poverty.
East Africa has done well in increasing enrollment rates in primary school, with all countries passing the 100 per cent gross enrollment rate threshold and therefore achieving the Millennium Development Goal target of uni-versal primary education. Burundi saw the largest increase in enrollment rates, from 71 per cent in 2002 to 135 per cent in 2009. Although most students in the region are attending primary school, a majority of them do not make the jump to secondary school. Kenya had the highest secondary
Human Development and Poverty
Healthcare
Child Health
Life Expectancy
Education
Maternal Health
HIV Prevalence
Non-Communicable Diseases
Chapter 4
Photo: Flickr/Internews Network

The State of East Africa 2012 29
school enrollment rate at 45 per cent; the rest of the region had much lower enrollment rates. A lot of the challenges stem from the quality of primary school education. Many children are not learning effectively and not performing at the level they should, with alarmingly low results in reading English and Kiswa-hili effectively and doing simple arithmetic. One could point towards the high malnutrition rates, specifically stunting, as an important reason for poor child performances in primary school.
HUMAN DEVELOPMENT INDEx
Source: United Nations Development Programme, Human Development Report (2011)
Figure 4.1: Human Development Index in East Africa
Human Development and Poverty
According to the UNDP Human Development Report 2011, Kenya had the highest Human Devel-opment Index (HDI)5 in the region at 0.51, followed by Tanzania (0.47). Uganda and Rwanda had similar HDI values of 0.45 and 0.43 respectively, and Burundi with 0.33 had the lowest HDI in East Africa. The HDI had improved since 2002 for Tanzania and Kenya, and quite sharply for Burundi. It declined slightly for Uganda and was unchanged for Rwanda, which is surprising given the latter’s record of sustained rapid growth.
To put the East African performance in context, the highest HDI score in Africa was Seychelles (0.77), which was classified as having ‘high human development’ in 2011. Norway had the high-est HDI rating (0.943) in the world in 2011.
POVERTy
Table 4.1 – Share of East Africa’s Population Living Below the (National) Poverty Line
Country Earliest survey of poverty
incidence (%)
Estimated population
below baseline poverty line
(m)6
Most recent estimate
of poverty incidence (%)
Estimated population in 2010 below
latest poverty line (m)
Change from baseline year to 2010 (m)
Tanzania 39 (1990) 9.9 33 (2007) 14.9 4.9
Kenya 40 (1994) 10.6 46 (2006) 18.9 8.2
Uganda 56 (1992) 10.6 25 (2010) 8.3 (2.3)
Rwanda 59 (2000) 4.8 45 (2011) 4.7 (0.1)
Burundi 65–70 (2004) 4.8 70 (2010) 6.3 1.5
Total EAC 53.0
Source: National statistics offices, authors computation

The State of East Africa 201230
The region’s performance in reducing poverty is mixed. Tanzania, Uganda and Rwanda have been able to reduce the proportion of the population living below their nationally defined poverty lines. Uganda’s improvement, from 56 per cent to 25 per cent of the population, is significant. Kenya seems to have lost ground, as 46 per cent of its population fell below the poverty line in 2006 compared to 40 per cent in 1994. The poverty incidence has remained high in Burundi.
However, high rates of population growth in the region have created some headwind against the poverty reduction efforts. Tanzania saw an increase of 4.9 million people living below the poverty line over a 17-year period. During roughly the same period, 8.2 million Kenyans fell below that country’s poverty line. The high proportion in Burundi created 1.5 million poor people. Uganda’s lifting of 2.3 million of its citizens above the poverty line over an 18-year period stands in sharp and positive contrast to its neighbours. Rwanda’s reduction of poverty incidence by 12 per cent between 2000 and 2011 lifted 100,000 out of poverty.
In total, based on a simple calculation of applying the most recent estimate of poverty incidence to each country’s population in 2010, 53 million East Africans (38 per cent of the regional population) lived below the poverty line in 2010.
RISE OF THE MIDDLE CLASS?
Source: African Development Bank, The Middle of the Pyramid: Dynamics of the Middle Class in Africa (2011)
Figure 4.2: Size of the East African Middle and Poor Classes (2008)
The middle class has been recognized as playing an important role in driving growth and trans-formation of the economy, in part through its consumption power and patterns.7 East Africa’s middle class is relatively small. In 2008 Kenya had the largest share of its population, almost 17 per cent, who were classified as ‘middle class’. Uganda followed with 8.1 per cent. Tanzania, Rwanda and Burundi had middle classes of just under 3 per cent each. By way of comparison, North Africa was reported to have much larger shares of its populations who were middle class, with Tunisia leading at 90 per cent.

The State of East Africa 2012 31
HEALTHCARE SPENDINg PER CAPITA
PHySICIANS PER 10,000 PEOPLE
Source: United Nations Development Programme, Human Development Report (2011)
Source: African Development Bank Statistical Yearbook (2011)
Figure 4.3: Healthcare Spending Per Capita in East Africa (2000–2009)
Figure 4.4: Number of Physicians Per 10,000 People (2003–2007)
Healthcare
Rwanda had the highest total per capita healthcare expenditure in the region with $48 in 2009. This is a fivefold increase over its expenditure in 2000, and more than twice as high as Burundi’s $20 per capita. Uganda had the second-highest total per capita health expenditure of $43 in 2009, which is a threefold increase over its 2000 level of $15. Kenya doubled its expenditure from $17 to $33, as did Tanzania (from $10 to $25) during the same period.
In 2007 Tanzania had the highest number of physicians per 10,000 population in East Africa with five, an increase from four in 2005. Rwanda also saw an increase, from two to three doctors per 10,000. There was no change for Kenya, which stayed at two, and Burundi, which stayed at one. Similar data were not available for Uganda. In the same period Egypt had 227 physicians per 10,000 people, making it the best-performing country in the continent.

The State of East Africa 201232
DELIVERy By SKILLED BIRTH ATTENDANT
MATERNAL MORTALITy RATE
Source: Demographic and health surveys for individual countries
Source: UNDP and World Bank Reproductive Health Profile
Figure 4.5: Deliveries by Skilled Birth Attendants in East Africa
Figure 4.6: Maternal Mortality Rates in East Africa
Maternal Health
Data from the demographic and health survey (DHS) for each country in the region show Rwanda having the highest percentage of births (69 per cent) delivered by a skilled attendant in 2010, a major improvement from the 39 per cent achieved in 2005. Burundi’s baseline survey in 1987 showed just 32 per cent of deliveries were by skilled attendants. In the most recent DHS report, deliveries by skilled birth attendants in Burundi improved to 60 per cent in 2010, which would place Burundi second in the region after Rwanda. Improvements in the other countries were more modest. Tanzania went from 46 per cent in 2005 to 51 per cent in 2010, while Kenya’s rate increased from 42 per cent in 2004 to 44 per cent in 2009. Uganda improved from 39 per cent in 2001 to 42 per cent in 2006.
Maternal mortality rates (MMRs) have fallen across East Africa. In 2000 Tanzania had the highest MMR in the region with 1,500 deaths per 100,000 live births, but this fell sharply to 454, the lowest in the region, in 2010. Rwanda also significantly improved its MMR from 1,400 to 540. Burundi reported the region’s highest MMR at 975 deaths per 100,000 live births. The increase in the share of births delivered by skilled attendants may partially explain the reduc-tion in MMRs across the region, especially in Rwanda.

The State of East Africa 2012 33
CONTRACEPTIVE PREVALENCE
UNPLANNED AND MISTIMED BIRTHS
Source: Demographic and health surveys for individual countries
Figure 4.7: Contraceptive Prevalence Rate in East Africa
Contraceptive prevalence rates refer to any modern method used among all women (married and unmarried).8 In the latest survey, Rwanda had the highest rate of contraceptive use among women at 52 per cent, a threefold increase from just 17 per cent in the earlier survey. The contraceptive use rates in Tanzania and Kenya were approximately 24 per cent and 28 per cent. Burundi more than doubled contraceptive use to 22 per cent from 9 per cent in the earlier sur-vey. Uganda was the only East African country to report a decline in the use of contraceptives among women, from 17 per cent to 15 per cent.
In Kenya’s latest DHS, 26 per cent of births in 2008–2009 were mistimed (births wanted later) while 17 per cent were unwanted. According to the State of Kenya Population 2011, 1.8 million married women have unplanned births in Kenya, one of the highest rates in sub-Saharan Africa. In Tanzania 23 per cent of births were mistimed and 4 per cent were unwanted in 2010. The proportion of mistimed births increased from 18 per cent in 2004–2005. Uganda’s most recent DHS, published in 2006, found that 33 per cent of births were mistimed and 13 per cent were unwanted at the time of conception.

The State of East Africa 201234
UNDER-FIVE MORTALITy RATE
IMMUNIzATION
Source: Demographic and health surveys for individual countries
Source: UNICEF and WHO 2010 World Health Statistics
Figure 4.8: Estimated Under-Five Mortality Rate
Figure 4.9: Child Immunization in East Africa (2004–2009)
Child Health
All countries in East Africa reduced their under-five mortality rates between the periods of their respective surveys. Tanzania’s under-five mortality rate was 112 in 2005 but fell to 81 in 2010. Rwanda has had one of the sharpest reductions in under-five mortality, from 152 to 76 deaths per 1,000 live births between 2005 and 2010. Kenya consistently had one of the lowest rates in the region, which fell from 115 in 2004 to 74 in 2009. The under-five mortality rates in Rwanda, Kenya and Tanzania are well below the SSA average of 129. Burundi’s rate is lower than the SSA average but the highest in the region, despite its improvement from 190 to 96.
UNICEF and the World Health Organization use the coverage of infants receiving three doses of the diphtheria-tetanus-pertussis (DPT3) vaccine as a ‘benchmark indicator of annual routine immunization coverage’.9
Child immunization rates improved in Kenya and Burundi, and reached near-universal coverage in Rwanda at 97 per cent in 2009, up from 89 per cent in 2004. Tanzania dropped from first in 2004 to third in the region in 2009, with a reduction in child immunization from 95 per cent to 85 per cent. Uganda fell from third to last as its immunization rates declined from 87 per cent to 64 per cent.

The State of East Africa 2012 35
MALNUTRITION
Source: Demographic and health surveys for individual countries
Source: Demographic and health surveys for individual countries10
Figure 4.10: Trends in Under-Five Underweight Prevalence
Figure 4.11: Trends in Under-Five Stunting Prevalence
Figures 4.10 and 4.11 show the prevalence of underweight and stunted children in the region, which is an indicator of poor early childhood nourishment.11 One in five Kenyan children and as many as one-third of Burundi’s children are underweight, with the prevalence in Tanzania, Uganda and Rwanda falling in between.
With the exception of Burundi, all countries in the EAC saw a decrease in underweight preva-lence. Between 2005 and 2010 Tanzania’s underweight prevalence dropped from 22 per cent to 16 per cent. Kenya’s prevalence decreased from 20 per cent in 2003 to 16 per cent in 2009. Even higher proportions of East Africa’s children, from one-third in Kenya to over half in Bu-rundi, are stunted. While infant mortality rates have fallen across East Africa and immunization rates improved in three of the five EAC countries, malnutrition remains a serious and seemingly intractable problem in the region.
According to the Global Hunger Index12 published by the International Food Policy Research Institute, Burundi is the only country in the EAC that has not moved out of the ‘extremely alarming’ category since 1990. Burundi has been ranked the lowest in the index and has been on the bottom end since 1990 (it is ranked 80/81). Tanzania has seen a downward trend in its ranking since 1996, but has remained in the ‘alarming’ category. Uganda has remained in the ‘serious’ category, while Kenya has improved in category from alarming to serious. High food prices are linked to a ‘62% increase in cases of acute malnutrition in health centers and hospitals in Nairobi among young children between January and May 2011’.13

The State of East Africa 201236
ACCESS TO IMPROVED SANITATION
Source: World Bank Indicators
Source: World Bank Indicators
Figure 4.12: Access to Improved Sanitation Coverage in East Africa (2000–2008)
Urban Areas
Rural Areas
There has been improvement in access to improved sanitation across both urban and rural areas in the region between 2000 and 2008. Rural areas have had less access to improved sanitation than urban areas. In 2008 Rwanda (50 per cent) and Burundi (49 per cent) had the highest coverage rate in urban areas, while Kenya had the lowest (27 per cent). The highest coverage rate in rural areas in 2008 was in Rwanda (55 per cent), and the lowest rural coverage rate was in Tanzania (21 per cent).

The State of East Africa 2012 37
ACCESS TO IMPROVED WATER SOURCE
Source: World Bank Indicators
Source: World Bank Indicators
Figure 4.13: Access to Improved Water Sources in East Africa (2000–2008)
In 2008 91 per cent of urban Ugandans had access to an improved water source, the highest in the region. Uganda was the only country to improve this indicator between 2000 and 2008. The other countries saw coverage fall from 85–87 per cent to 77–83 per cent. The sharpest decline was reported in Rwanda, which reduced urban coverage from 85 per cent to 77 per cent.
Access to improved water sources in rural areas improved in Burundi, where it was the highest in the region in both 2000 and 2008, as well as in Kenya and Uganda. It was unchanged in Tanzania, and declined slightly in Rwanda from 64 per cent to 62 per cent.
Source: African Development Bank Group (December 2010)
Lake Victoria Water and Sanitation Program (Tanzania, Kenya & Uganda): In December 2010 the AfDB approved the Lake Victoria Water and Sanitation Program that would cover four key areas: water, sanitation, solid waste manage-ment and institutional capacity building. The main objective is to improve the water and sanitations services in the 15 selected towns around the Lake Victoria Basin. In addition to supporting pro-poor water and sanitation invest-ments the project hopes to reduce the environmental impact of urbanization in the Lake Victoria Basin. Lake Victoria is a major trans-boundary natural resource that is heavily utilized by its bordering countries for fisheries, transporta-tion, tourism, water supply and waste disposal. Its outflow is an important component of the Nile. In a response to rapid urbanization, the exploitation of the natural resources and its relationship to livelihoods and poverty, the EAC formulated a framework to reverse the deteriorating conditions in the Lake.
BOx 4.1 – A REgIONAL WATER AND SANITATION PROjECT
Urban Areas
Rural Areas

The State of East Africa 201238
Source: UNICEF and WHO 2010 World Health Statistics
Figure 4.14: HIV Prevalence in East Africa
The prevalence of HIV declined across East Africa, with the exception of Uganda where it jumped from 4.1 per cent to 6.5 per cent in the most recent estimate. Kenya’s 6.2 per cent prevalence rate was the second highest in East Africa in 2010. Tanzania’s rate fell from 8.8 per cent in 2003 to 5.7 per cent in 2010. Rwanda had the lowest prevalence rate in the region at 2.9 per cent, a reduction from 5.1 per cent in 2003.
HIV prevalence rates have improved compared to the baseline year in 2003, possibly due to increased access to anti-retroviral treatment and significant involvement from governments and non-governmental organizations that seek to subsidize costs for drugs and promote prevention.
HIV Prevalence

The State of East Africa 2012 39
Source: World Bank Indicators
Figure 4.15: Life Expectancy at Birth in East Africa (2005-2009)
All East African countries saw an increase in life expectancy from 2005 to 2009. Life expect-ancy in Tanzania was the highest in East Africa in 2009 at 56.6 years, an increase of 3.3 years over the period. Kenya followed with 55.8 years in 2009, up by 2.8 years from 2005. Burundi had the lowest life expectancy with 49.4, although this was an increase of almost two years from the 47.8 in 2005. Uganda and Rwanda remained in between with 53.0 and 54.6 years respectively.
Life Expectancy
Source: The State of World Population (2011)
Figure 4.16: gender-Related Life Expectancy and Birth in East Africa (2010–2015)
Figure 4.16 looks ahead to 2015 and estimates different life expectancies for men and women. It shows that East African women will outlive men by as much as three years on average in Burundi and Rwanda, and by two years in Tanzania and Kenya. The life expectancy of women will be highest in Tanzania (60 years), followed by Kenya (59 years). Men are expected to have the lowest life expectancy in Burundi (50 years) and the highest in Tanzania (59 years). Ugandan men and women live to about the same age of 54–55 years. The life expectancy in SSA is estimated to be 54 years for men and 56 years for women, the lowest in the world. Men in East Africa, with the exception of Burundi, live longer than the continental average. However, women in Uganda and Burundi live shorter lives than the SSA average.

The State of East Africa 201240
Source: WHO Country Profiles
Figure 4.17: Non-Communicable Diseases in the EAC (2008)
As Figure 4.17 shows, cardiovascular diseases are the most common form of non-communicable diseases (NCDs) in the region, with 58 per cent of total NCD cases. Various forms of cancer are also prominent at 22 per cent. NCDs are becoming common, and medical practitioners have started paying close attention to the emerging threat in East Africa.
The hard-fought battle against infant and child mortality is yielding results in the form of re-duced mortality rates across the region in the last decade. However, according to Dr Julie Makani, a Tanzanian scientist who has conducted research on sickle cell diseases, the victory comes with an important future challenge of increasing prevalence of NCDs, as children with genetic or other predispositions to NCDs and who may have been killed by infectious diseases in childhood survive to present these conditions. While the numbers may not yet be epidemic in their proportions, they will likely stress the region’s healthcare systems in new and severe ways.
Better child survival rates are not the only (and may not even be the major) reason for an observed rise in NCDs. The WHO attributes it to lifestyle risk factors. The regional director for Africa, Dr Luis Sambo, highlighted the growing negative impact of non-communicable diseases on the health status and socio-economic development of people in the region and the urgent need for concrete actions. He said, ‘Most of the risk factors for NCDs are driven by trade and human consumption of various products including alcohol, tobacco, illicit drugs and unhealthy foods and drinks. For us to effectively tackle these and other risk factors, we will have to intensify Health Promotion programmes, and undertake public health actions that involve other sectors.’
Another weak signal and pointer to a future of more NCDs and other diseases of ageing is the fact that Kenya found out in the last census that it has 3 million people aged over 60. This is the largest number of living over-60s in Kenya’s history. The pattern is likely to be similar across the region, and in addition to NCDs in young populations, there will be a need to deal with larger numbers of older people and the challenging diseases of ageing that will increase.
Non-Communicable Diseases

The State of East Africa 2012 41
PRIMARy AND SECONDARy SCHOOL ENROLLMENT
Source: EAC Secretariat Facts and Figures (2011)
Figure 4.18: Comparative Analysis of Primary and Secondary School Enrollment (2002-2009)
Education
Primary school enrollment rates increased across the region, with the exception of Uganda which has fluctuated between 2002 and 2009. Burundi had the highest primary school gross enrollment rates (GERs) in the region, with 135 per cent in 2009. What was remarkable with Burundi is the significant jump that occurred between 2002 and 2009, from 71 per cent to 135 per cent respectively. Kenya, with 110 per cent, and Tanzania, with 111 per cent, had margin-ally lower primary school GERs compared to the rest of the region.
The differences between primary school enrollment rates when compared secondary school are quite striking. In 2009 Kenya had the highest secondary school gross enrollment rate of 45 per cent but much lower than its primary school enrollment rate of 110 per cent. Although Burundi had the highest primary school GER, it had the lowest secondary school GER with 19 per cent. Tanzania’s primary school enrollment rate was 111 per cent in 2009 but 30 per cent in second-ary school. Secondary school enrollment rates in the region have been quite low over the past decade with no real evidence of significant improvement.
A working paper produced by the Center for Global Development found that despite empirical evidence suggesting that user fees significantly deter public service utilization in developing countries, it was not apparent in Kenya. The study found that the nationwide abolition of public school fees in Kenya in 2003 led to no increase in net public enrollment rates, but rather a dramatic shift towards private schooling. In fact, net enrollment in government schools stagnated in the years following the introduction of Kenya’s ‘Free Primary Education’ (FPE) policy.
The trends for private schools were even more surprising: in the wake of FPE, both enrollment levels and fee rates in Kenya’s private primary schools more than doubled. This co-movement of enrollment and fees in the unregulated private sector suggests a dramatic increase in demand for private education.
The report argues that social interactions explain why demand for private schooling went up when the price of gov-ernment schooling went down. Households responded to FPE differently on the basis of their relative wealth. Pupils from poorer households were more likely to attend government schools under FPE while their most affluent peers were likely to go to private schools after the reform. As marginal pupils entered government schools through one door, affluent pupils exited through the other.
However, despite stagnant public enrollment numbers, FPE was successful in improving educational access. Enrollment
BOx 4.2 – “WHy DID ABOLISHINg FEES NOT INCREASE PUBLIC SCHOOL ENROLLMENT IN KENyA?”

The State of East Africa 201242
Source: Center for Global Development Working Paper 271, October 2011
PUPIL-TEACHER RATIO IN PRIMARy SCHOOLS
Source: World Bank Development Indicators
Figure 4.19: Primary School Pupil-Teacher Ratios (2001-2010)
Primary school pupil-teacher ratios (PTR) in the region almost universally deteriorated between 2001 and 2010. Kenya, for example, went from 32 in 2001, better than the Millennium Devel-opment Goal target of 40, to 47 in 2010. Tanzania’s PTR in 2010 was 51, up from 46, Uganda’s improved marginally to 51 from 54, and Rwanda remained the country with the highest ratio in the region with 65 in 2010, up from 59 in 2001. Burundi’s PTR has remained relatively un-changed during the period.
Source: Based on Uwezo 2011 reports on Kenya, Uganda and Tanzania
Uwezo (Kiswahili for ‘capability’) is a four-year initiative that seeks to improve literacy and numeracy among children aged 6–16 in Kenya, Tanzania and Uganda. In 2011 Uwezo published a series of reports based on its surveys of reading and numeracy skills among primary school students across the region.
Tanzania. The Uwezo assessment covered 132 districts and 128,005 children. The survey found that many children could not read Kiswahili: 30 per cent of students in Standard 3 could read basic Kiswahili and only 10 per cent could read a basic story in English. In terms of numeracy, 30 per cent of students completing Standard 2 were unable to meet the numeracy standards of that particular level.
Uganda. The Uwezo assessors covered 80 districts and 88,373 children, and visited 2,400 schools. This assessment found that 90 per cent of children in P3 (Primary 3) could not read and understand English at a P2 difficulty. An estimated 70 per cent of children in P3 could not correctly solve numerical written division sums at P2 levels.
Kenya. The Uwezo survey covered 158 districts and 134,243 children, and visited 3,574 schools. It revealed that only 30 per cent of children in Class 4 could read a Class 3 Kiswahili story and 4 per cent of children in Class 8 could not read a Class 2 level story. The report also noted that in many districts four out of ten children miss school daily, and on a single day 13 per cent of teachers are not in school. The assessment found an average shortage of four teachers per primary school.
BOx 4.3 – WHAT ARE OUR CHILDREN LEARNINg?
among less-educated households did increase modestly. Nevertheless, abolishing fees is simply not enough to achieve enrollment goals such as the highly vaunted universal primary education. A more comprehensive approach is needed, one towards quality rather than quantity.

The State of East Africa 2012 43
Source: The East African, 8 January 2012
Rwanda is planning to hire at least 4,000 teachers from Kenya this month (January 2012), opening an employment window for thousands of unemployed teachers in the region. The move is part of a plan to scale up the use of English as the language of instruction in schools as well as increase its use in the largely French-speaking economy, as it seeks opportunities in the integrated EAC where English is the formal language of communication.
The hiring of teachers – to act as school-based mentors – will help to eliminate the heavy imbalances in the market that has left countries like Kenya and Uganda with a surplus while its neighbours experience acute shortages.
For example, Tanzania suffers an acute shortage of secondary school teachers as a result of the successful imple-mentation of a five-year Secondary Education Development Programme that began in 2004, under which 1,050 new secondary schools were built countrywide.
BOx 4.4 – “jOBS gALORE FOR KENyAN TEACHERS AS RWANDA SEEKS TUTORS”
ADULT LITERACy
Source: UNESCO EFA Global Monitoring Report (2005 and 2011)
Source: UNESCO EFA Global Monitoring Report (2005 and 2011)
Figure 4.20: Male Adult Literacy Rates in East Africa (2000–2008)
Figure 4.21: Female Adult Literacy Rates in East Africa (2000–2008)
Adult literacy rates have improved in four of the five East African countries. The exception is Tanzania: its adult literacy rate in the 2005–2008 period was 79 per cent for men and 66 per cent for women, but this was lower than the rates achieved in 2000–2004 of 85 per cent and 69 per cent. Elsewhere, Kenya’s adult literacy was the highest in the region with 90 per cent for men and 83 per cent for women, the latter being an increase from 79 per cent in 2000–2004.

The State of East Africa 201244
Source: UNESCO
According to UNESCO, 2009 saw a total of 26,100 students from the region studying at universities abroad. This is slightly higher than in 2007 (22,772) and 2005 (22,629). Kenya has been consistent, with at least 13,000 students an-nually studying abroad over the period 2005–2007. In 2009 the majority of students heading overseas originated from Kenya (52 per cent), with a total of 13,748. The minority originated from Burundi, with 1,309, or 5 per cent of total EAC students studying abroad. Tanzania (5,393) was the second highest, followed by Uganda (3,461) and Rwanda (2,188).
The top five destinations for tertiary education were the United States, United Kingdom, France, South Africa and Malaysia. Each country had its own top five destinations, but as an aggregate these were the preferred destinations of East Africans.
BOx 4.5 – gLOBAL STUDENTS: WHERE IN THE WORLD ARE EAST AFRICA’S UNIVERSITy-BOUND STUDENTS STUDyINg?
Uganda’s adult literacy rates improved from 79 per cent (men) and 59 per cent (women) in 2000–2004 to 82 per cent and 67 per cent respectively in 2005–2008. Rwanda’s rates reported no change for male adult literacy (75 per cent), while female adult literacy improved from 63 per cent to 66 per cent.
The lowest adult literacy rates were in Burundi, with 72 per cent for men and 60 per cent for women in 2005–2008. However, this masks the significant progress made by Burundi to raise literacy rates by 14 and 16 percentage points for men and women respectively from their 2000–2004 levels.
Table 4.2 – Ranking of East Africa’s Universities Regionally and globally
Africa Rank University Country World Ranking
10 Makerere University Uganda 1,256
26 University of Nairobi Kenya 2,452
38 University of Dar es Salaam Tanzania 2,438
40 Strathmore University Nairobi Kenya 3,445
58 Kenyatta University Kenya 5,831
74 African Virtual University Kenya 5,831
78 National University of Rwanda Rwanda 6,209
87 Jomo Kenyatta University of Agric. & Technology Kenya 6,831
95 United States International University Kenya 7,204
Source: Webometrics

The State of East Africa 2012 45
Infrastructure
East Africa’s infrastructure deficit is a well-documented challenge. The re-gion’s total road network in 2008 was 183,178 km, of which 91 per cent was unpaved. However, with 70 per cent of its paved roads classified as being in good condition, a part of Tanzania’s investment is paying off.
The region has a seriously underperforming rail sector, but there have been efforts to revive it. In 2011 alone a series of projects were initiated in efforts to improve the rail sector. The Tanzania-Zambia Railway received a loan from China worth $40 million and the Rift Valley Railways received $40 million in funding from the African Development Bank. The passenger volume on these trains is meagre, however, as most East Africans travel by bus or airplane. Weekly flights to and from EAC countries have increased, with Kenya receiving the largest amount of weekly airline traffic. Flights between Tanzania and Kenya account for the majority of intra-regional flights.
The ports of Dar es Salaam and Mombasa have continued to function at close to full capacity. Mombasa is the largest port in East Africa and the second largest in sub-Saharan Africa in terms of tonnage and containers handled. At the end of 2011 and the beginning of 2012 the port was facing a crisis due to significant inefficiencies and container traffic slowing down the flow of goods. The port of Dar es Salaam has an intrinsic capacity of 11 million tonnes per year and handles 94 per cent of Tanzania’s total mari-time trade activity.
The telecoms revolution has been a notable feature in the region during the last decade. Mobile phone subscriptions grew from 3 million in 2002 to 64 million in 2010, catalysing innovations such as M-Pesa that have helped deepen financial inclusion. The majority of East Africans are accessing the Internet through their phones; by September 2011 99 per cent of Kenya’s Internet users accessed it via a mobile phone.
Road Network
Non-tariff Barriers
Airports
Pipelines
Energy Sources and Use
Railways
The Major Ports in the Region
Rise of Mobile Communications
Chapter 5
Photo: Flickr/deltron3032

The State of East Africa 201246
TOTAL ROAD NETWORK
QUALITy OF PAVED ROAD NETWORK
Source: African Development Bank Infrastructure Data Bank (2008)
Source: African Development Bank Infrastructure Data Bank (2008)
Figure 5.1: East African Road Network (2008)
Figure 5.2: Quality of East Africa’s Paved Road Network (2008)
East Africa’s total road network in 2008 was 183,178 km, of which just 9 per cent was paved and 91 per cent unpaved. Kenya had the longest paved network with 7,982 km, almost twice as long as second-place Tanzania with 4,330 km. Rwanda and Uganda had the shortest paved road networks with 1,060 km and 2,331 km respectively. Burundi’s road network, although relatively small, had more of it paved (1,242 km) than unpaved (708 km).
The region’s paved roads are classified into three categories: good, fair and poor. Tanzania’s paved road network quality was the best in East Africa: 70 per cent of it was in good condition, the highest in the region. Only 5 per cent of Tanzania’s road network was in poor condition and 25 per cent of its roads were in fair condition. Less than half (47 per cent) of Kenya’s paved road network was classified as being in good condition in 2008. While 37 per cent was in fair condition, Kenya had the highest portion in East Africa (17 per cent) of its paved roads in poor condition. Uganda had the highest proportion of paved roads in fair condition (73 per cent) and the lowest proportion of its road network in good condition in the region (18 per cent). Rwanda had the second-highest proportion of paved roads in fair condition (48 per cent) and 41 per cent of its network in good condition.
Road Network

The State of East Africa 2012 47
QUALITy OF UNPAVED ROAD NETWORK
THE NORTHERN AND CENTRAL TRANSPORT CORRIDORS
Source: African Development Bank Infrastructure Data Bank (2008)
Figure 5.3: Quality of East Africa’s Unpaved Road Network (2008)
The proportion of Kenya’s unpaved road network in good condition was 50 per cent, the highest in the region, but it also had a significant amount of unpaved roads in poor condition (37 per cent). Rwanda and Uganda both had the majority of their unpaved roads in poor condition. The share of Tanzania’s unpaved road in fair or good condition was 69 per cent
East Africa’s transport corridors are noted as the most efficient solution to dealing with the growing economies in the region and infrastructure jams. The expectation is that once these corridors are fully functioning, the region will be able to accommodate the growing demands of trade and its in-creasing population. The traffic forecast for both the Northern and Central Corridors (the two major corridors in the region) may overwhelm current capacity. Demand on the major routes (highways, ports and railways) will increase by a factor of four from 24 million tonnes in 2015 to 100 million by 2030 at the ports. The roads will receive 80 per cent more traffic by 2015 and four times more by 2030. The railways will have to accommodate 6.5 million tonnes in 2015 and 18 million in 2030.
Northern CorridorThe Northern Corridor has the port of Mombasa in Kenya serving as the lifeline for Uganda, Rwanda and Burundi, ending in the city of Bujumbura. The corridor currently needs an invest-ment of $1.87 billion to revamp the infrastructure and make it fully functional. If this is implemented the following improvements will occur: • thepriceofroadtransportationwilldecreaseby25percent• thepriceofrailtransportationwilldecreaseby11–14percent• shippingtimebyroadwilldecreaseby21–33percent• shippingtimebyrailwilldecreasebyanaverageof53percent.
Central Corridor The Central Corridor has the port of Dar es Salaam as a major hub for imports, exports and trade for Rwanda, Burundi and the eastern part of the Democratic Republic of the Congo (DRC). The advantage with the Central Corridor is its two separate routes; one runs in Burundi through various key cities and towns, while the other in Rwanda goes through Kigali. The Central Cor-ridor currently needs an investment of $1.67 billion to revamp the infrastructure and make it fully functional. If this is implemented the following improvements are expected:• thecostofroadtransportationwilldecreaseby9–11percent• thecostofrailorrail/laketransportationwilldecreaseby30–36percent• shippingtimeoverallwilldecreaseby40–50percent.

The State of East Africa 201248
Source: SID Outlook on Transport Corridors and BertelsmannStiftung Future Challenges (September 2011), http://futurechallenges.org/searchlight/informal-trade-in-east-africa-will-face-an-“efficiency-shock”/
The east-west corridors ignore the north-south opportunities. It is clear that the main reason for the transport cor-ridors is to boost economic growth by lowering the costs of moving goods and thereby increasing the volume of trade. In order to sustain growth, linking the region with global markets is a priority. Both corridors run from east to west, linking the Indian Ocean ports with the population centres that are markets for imported goods. The agricul-tural, mineral and other resources in the region’s interior form the bulk of the region’s exports to the rest of the world. What is particularly striking is the relegation of intra-regional trade to a seemingly distant second place in the priority list, despite the pronouncements made about its importance. This is suggested by the little consideration of investing in the rehabilitation or the building of (new) north-south corridors.
There is scant mention of creating or upgrading the routes to link food-surplus regions in southern and western Tanzania to the food-deficit regions in northern Kenya, northern Uganda, Somalia and Ethiopia. The much-vaunted growth in the trade of goods produced within the region for consumption within seems to be left to happen almost on its own.
Informal trade could face an ‘efficiency shock’. Informal cross border trade accounts for a significant portion of overall regional trade in East Africa. Launching a new National Cross Border Trade Association in Kenya, the Permanent Sec-retary in the Ministry of Trade noted that, ‘informal cross border trade currently accounts for about 30% to 60% of all inter-regional trade. Evidence further shows that over 50% of intra-regional trade is conducted through the informal cross border trade, particularly those trading in agricultural products.’ Improving transport corridors is expected to reduce the costs of road transport by up to 25% in the northern corridor and 11% in the central corridor. The time to ship goods by road will reduce by up to a third in the north and half in the central corridors. These cost and time reductions represent a significant and positive ‘efficiency shock’ to the region’s economy. It will have an impact on the informal trade in the region, although the nature and direction of that impact is hard to determine without deeper analysis.
Certainly, informal trade will benefit from the improved transport infrastructure and the costs savings that it represents. To the extent that informal trade crosses national boundaries at designated border posts, the seven new one-stop border posts (OSBPs) that are being built across the EAC partner states also ought to have a beneficial effect by combining two countries’ formalities in a single space and eliminating the duplication procedures. However, if informal trade has thrived in part because of logistical inefficiency – allowing it to serve markets and consumers that more formal distribution channels do not reach – the improved transport corridors will reduce the constraint and may lead to greater formalization of cross border trade.
The net effect of formalization could be ambiguous. For it to be beneficial at the individual level, any increase in the cost of formalization to the trader (administration processes, fees, taxes) must be more than outweighed by an increase in business. But it is not clear that small traders will be able to capture the cost savings represented by improved transport infrastructure. Larger traders with deep pockets and distribution networks could edge out their weaker competitors by translating cost savings into lower retail prices for the final consumer. So, while systemic efficiency is good at the aggregate level, it may be painful at the level of the small and or/informal trader who for various reasons may find themselves unable to compete.
BOx 5.1 – A COMMENT ON EAST AFRICA’S TRANSPORT CORRIDORS
Source: African Development Bank Group (December 2006)
The African Development Bank has been one of the EAC’s strongest supporters. In 2010, the EAC received $495 million worth of loans and grants from the AfDB.
The Arusha-Namanga-Athi River Road (Tanzania and Kenya). In December 2006 the AfDB along with the East African Community approved the Arusha-Namanga-Athi River road development project. It consists of rehabilitating the 110 km road to 7 m wide carriageway. The overarching goal is to support regional integration, cross border trade, tourism, socio-economic development of the zone of influence and a contribution to the reduction of poverty. The Athi River Namanga road is of strategic importance to the region and forms part of the priority Corridor No. 5 of the EAC Regional Roads Network, which spans from Tunduma in southern Tanzania to Moyale in northern Kenya and onward to Addis Ababa in Ethiopia. The project includes a one-stop border post at Namanga. The AfDB and the Japan International Cooperation Agency (JICA) co-financed the $156 million cost of the project.
BOx 5.2 – REgIONAL INFRASTRUCTURE PROjECTS

The State of East Africa 2012 49
Non-tariff barriers (NTBs) signal the constant tensions that exist between having full inte-grated market access and regulatory policies that border the extreme. In August 2011, EAC Secretary-General Dr Richard Sezibera labelled NTBs ‘as the biggest impediment to full attain-ment of the objectives of the Treaty for Establishment of East African Community’.
The EAC defines NTBs as ‘administrative and technical requirements imposed by a Partner State in the movement of goods’. The working definition of NTBs within the EAC is ‘quantitative re-strictions and specific limitations that act as obstacles to trade’. The World Trade Organization, of which all five EAC countries are members, describes NTBs as red tape or ‘various bureaucratic or legal issues that could involve hindrances to trade’.
While a number of NTBs may be explicitly protectionist, the majority seek to meet an agreed regulatory objective, such as food safety or product safety. The EAC acknowledges the follow-ing most common justifications for NTBs.• Tosafeguardhealth,safetyandsecurityofhumanbeings,animalsandplantsagainstenvi-
ronmental pollution.• Toprotecthomeindustriesandconsumers.• Tosafeguardnationalsecurity.• Tosafeguardagainstrevenueloss.
While there may be a consensus that existing NTBs should be abolished, this does not mean there is agreement on how to meet legitimate regulatory objectives in a less trade-restrictive manner. Many NTBs are rooted in more structural challenges, such as ‘inadequate government structures, mismanagement, erratic application of rules and bureaucratic staff often coupled with low staff morale’.14
Establishing formal notification requirements has been an important step towards monitoring NTBs. However, the World Bank believes that it is not sufficient to reduce and remove NTBs. Still, the EAC Secretariat has come up with reporting mechanisms that try to put a handle on the challenge of NTBs.
EAC members were also urged to computerize systems at border posts to ensure efficiency and root out corruption, which remains rampant in several partner states. In response to the NTB challenge, the EAC Secretariat produced its first quarterly report in August 2011, highlighting the status of elimination of NTBs. The reporting mechanism was first prompted by the East African Business Council in 2005.
Looking at things broadly, the types of NTB that affect all EAC partner states consist of but are not limited to those shown in Table 5.1.
The EAC’s August 2011 quarterly report on the subject stated that Tanzania led the region in being a major source of NTBs, with ten reported cases, followed by Kenya (seven), Uganda (four) and Burundi (two). Rwanda had no complaints reported against it from the region. The countries singled out as being the most affected by NTBs were Uganda (nine complaints), Rwanda (seven), Burundi (seven), Tanzania (three) and Kenya (three).15 The NTB reporting
Non-Tariff Barriers
Table 5.1 – Effects of Non-Tariff Barriers
NTB description Impact on businesses
Lack of harmonized import/export documentation and procedures
Delays in clearing imports and varied application of tariff duties
Delays in transit bonds cancellation Added costs for transit including customs bonds
Numerous institutions involved in testing goods Severe overlap and time consuming
Several police roadblocks across the Northern and Central Corridors
Delays in transport and bribes
Lengthy procedures for issuing work permits by Kenya, Uganda and Tanzania
Lost business time while waiting for processing of work permits
Source: EAC Secretariat Report on the Status of Elimination of Non-Tariff Barriers (2011)

The State of East Africa 201250
The Center for Economic Prosperity (CEP), based in Tanzania, produced a policy brief analysing how roadblocks on Tanzania’s main transit routes are a hindrance to improving the business environment in the country. CEP monitored roadblocks on three main routes: Dar es Salaam-Rusumo (Rwanda), Dar es Salaam-Kabanga (Burundi) and Dar es Salaam-Tunduma (Zambia). Using mobile phones, information was collected from 25 truck drivers, including details on all roadblocks encountered during July and August 2011. Six interesting facts were established about the stops along the main transit routes.
Fact 1: Most checkpoints along the main transit routes are enforced by the traffic police. There are two types of checkpoints at which truck drivers are stopped: by traffic police and by the Tanzania Revenue Authority (TRA). The majority on the Dar es Salaam-Kabanga and Dar es Salaam-Rusumo transit routes were police checkpoints.
Fact 2: Tanzania has more roadblocks than Rwanda and Burundi. Within Tanzania, on average a truck driver was stopped twice by traffic police, three times at weighbridges, once at a traffic police checkpoint and four times at TRA checkpoints in a single trip. Once across the border, drivers were stopped only once on average in Burundi and not at all in Rwanda.
Fact 3: Bribes were paid at 25 per cent of the officially enforced stops along the main transit routes within Tanzania. Either official payments or no payment at all were made at the rest of the stops during the time of the survey.
Fact 4: Truck drivers are much more likely to pay a bribe at traffic police stops. In 55 per cent of cases where truck drivers were stopped by the traffic police a non-official payment was made. At weighbridges and TRA checkpoints, incidents of non-official payments were lower at 10 per cent and 4 per cent respectively.
Fact 5: Truck drivers pay an average of Tshs 2,219 as bribes to traffic police per stop. Between Tshs 1,000 and 5,000 was paid to traffic police in 97 per cent of incidents. Though drivers pay a bribe less often at weighbridges, when they did an average of Tshs 9,750 was paid per stop.
Fact 6: Truck drivers spend more time at TRA checkpoints than at weighbridges, traffic police checkpoints or police stops. Normally police stops do not take very long – 66 per cent range between one and ten minutes. At weighbridges, 37 per cent of the stops take one to ten minutes while 20 per cent took 11–20 minutes. More time is spent at TRA checkpoints, where 62 per cent of drivers reported spending more than 20 minutes.
BOx 5.3 – “ROAD BLOCKS ON MAIN TRUCK TRANSIT ROUTES: ARE ALL CHECKPOINTS IN TANzANIA NECESSARy?”
Source: Based on Center for Economic Prosperity (December 2011) ‘Road Blocks on Main Truck Transit Routes: Are All Checkpoints in Tanzania Necessary?’
mechanisms have yielded positive results. Seventeen cases out of 19 were resolved by either removing the NTBs or addressing them.16

The State of East Africa 2012 51
TOTAL RAIL NETWORK
Source: CIA World Factbook (2010) and African Development Bank
Figure 5.4: East Africa’s Rail Network (2010)
The total rail network in the region was 6,999 km, with no railways in Rwanda or Burundi. Tanzania’s rail network is 3,689 km, but the Tanzania–Zambia Railway (TAZARA) accounts for 969 km of track within the country. Rift Valley Railways (RVR) accounted for the majority of Kenya’s railway at 1,894 km.
Passenger traffic on the trains is low. In Kenya, between 1995 and 2005, passengers made up only 27 per cent of the railway’s ‘total cargo units’. In Tanzania, TAZARA had an average of 33 per cent in the same period and 27 per cent on the Tanzania Railway Corporation. In Uganda just 3 per cent of the total cargo units were passengers on RVR; the balance is freight transportation.
East Africa’s railway network was underused over the past decade. In 2011 two networks re-ceived significant attention regarding financing, TAZARA and RVR. TAZARA was able to secure a $40 million loan from China in September 2011 specifically for operational rehabilitation. Other investments in the rail industry included Egypt’s Citadel Capital, which completed a $70 million capital increase in September 2011 to fund RVR. The African Development Bank also committed $40 million to support a five-year capital investment programme for RVR.17 The financing will be used to rehabilitate, operate and maintain a regional railway concession and related facilities in Kenya and Uganda.
Railways

The State of East Africa 201252
Tanzania had the largest pipeline network in 2010 with 1,142 km, while Kenya had 932 km. These are the only two countries with oil pipelines; there was no change from 2004 in the establishment of new pipelines in other EAC countries. However, this is expected to change with the recent discovery of oil in Uganda and the plans to build a pipeline from South Sudan to Lamu in Kenya.
PIPELINE NETWORK
Source: African Development Bank Infrastructure Data Bank (2008)
Figure 5.5: Pipeline Network in East Africa (2004-2010)
Pipelines

The State of East Africa 2012 53
AIRPORTS
Source: CIA World Factbook (2010) and African Development Bank
Figure 5.6: Airports in East Africa (2010)
In 2010 there was a total of 378 airports in the region, a reduction of 14 from 2004. The majority were in Kenya, with 191 airports (51 per cent of total), followed by Tanzania with 124 (33 per cent). Uganda had 46 airports (12 per cent), while Rwanda and Burundi accounted for the smallest share of airports at 4 per cent. The majority of all airports are unpaved (115 in Tanzania, 174 in Kenya and 41 in Uganda). An estimated 90 per cent of airport runways in the region are unpaved.
Airports
Source: Tanzania and Kenya Airports Authority (2010)
Which airport receives the most passengers? Nairobi’s Jomo Kenyatta International Airport (JKIA) is the largest airport in the region but Dar es Salaam’s Julius Nyerere International Airport (JNIA) is one of the major destinations for foreign tourists.
JKIA had a cumulative passenger traffic of 5.5 million domestic and international passengers in 2010. This was an 8% increase from 2009. Passenger traffic is far smaller at Dar es Salaam’s JNIA with cumulative passenger traffic of 1.6 million people in 2010, representing an increase of 9.4% from the previous 2009.
JNIA achieved the one million-passenger traffic mark between 2003 and 2004, something that was achieved in the early 1990s by JKIA.
BOx 5.4 – NO CONTEST BETWEEN jOMO KENyATTA AND jULIUS NyERERE INTERNATIONAL AIRPORTS
CONNECTINg EAST AFRICA By AIR
Table 5.2 – Regional Air Flights (from one week in November 2007 for East Africa)
DESTINATION
Burundi Ethiopia Kenya Rwanda Sudan Tanzania Uganda
Burundi 7 8 20 - - 7
Ethiopia 7 11 7 15 21 14
Kenya 7 11 15 34 87 39
Rwanda 20 7 14 - 1 11
Sudan - 12 17 - - 4
Tanzania - 7 48 - - 6
Uganda 7 14 39 11 12 16
Source: African Development Bank Infrastructure Diagnostic Study (2008)
ORIg
IN

The State of East Africa 201254
Table 5.2 captures the frequency of weekly flights in the region from an African Development Bank diagnostic study on infrastructure. It shows that most flights from Kenya go to Tanzania and most flights from Tanzania go to Kenya. After Tanzania, a significant number of flights go from Uganda to Kenya. Rwanda has more flights going to Burundi than any other country in the region, while Burundi receives the most flights from Rwanda.
A November 2011 publication, ‘Leading Economic Indicators’ by the Kenya National Bureau of Statistics, adds more detail to the region’s air travel connectivity by reporting on the volume of passengers incoming and outgoing to/from Nairobi. In 2009 there were 348,755 embarked passengers travelling from Nairobi to the rest of Africa. Fifty-six per cent of passengers were travelling to East African destinations, specifically Dar es Salaam and Entebbe. From January to September 2011, 190,105 passengers flew to either Dar es Salaam or Entebbe (54 per cent of the 354,740 Africa-bound passengers). Incoming airline passenger traffic is similar: the major-ity of incoming traffic from Africa was regional (58 per cent in 2009 and 2010), mostly from Dar es Salaam and Entebbe.

The State of East Africa 2012 55
THE PORT OF DAR ES SALAAM
Source: Tanzania Ports Authority
Figure 5.7: Categories of Cargo in Dar es Salaam Port (2006–2009)
The main ports in the region are Dar es Salaam and Mombasa, which serve as major shipping hubs for not only their respective countries (Tanzania and Kenya) but the entire EAC and other countries in the interior. As these ports provide a lifeline to the transport corridors as well as import and export avenues for the entire East African region, it is important to analyse their capacities and limitations.
The Major Ports in the Region
According to the Tanzania Ports Authority, Dar es Salaam port, which is the principal port of the country, has an intrinsic capacity of 11 million tonnes per year. Dar port handles 94 per cent of the total maritime activity in the country. Between 2008 and 2009 an estimated 7.8 million tonnes were handled, which amounts to 70 per cent of capacity utilization.
As Figure 5.7 shows, liquid, dry and break bulk cargo grew by 7 per cent between 2007 and 2009, but containerized traffic grew by 22 per cent during that period.
Transit traffic and trans-shipment cargo, a good indicator of regional economic activity, to-talled 2.9 million tonnes in the 2008–2009 period, an increase from 2.7 million in 2007–2008. In 2008 transit and trans-shipment cargo was the highest to Burundi (188,382 tonnes), fol-lowed by Rwanda (136,366) and Uganda (72,902) among EAC members. Zambia was the major non-EAC user of the port. Container productivity improved from an average of 419 container moves per ship-to-shore gantry crane every 24 hours recorded in 2008 to 459 moves in 2010.
In the African Development Bank’s Tanzania infrastructure report on Dar es Salaam port’s ef-ficiency, the average dwell time in the terminal is reported as seven days.18 However, a recent corridor diagnostic study indicated ‘no reliable data was provided regarding the dwell time of boxes in marine terminals, including import boxes’.19 A major importer indicated that the dwell time was about 14 days, but also noted that 30 per cent of the boxes have a dwell time of less than seven days.
In November 2011 the Tanzania Ports Authority embarked on an expansion exercise to improve the port. The $1.4 billion investment will upgrade the port and increase its capacity to accom-modate the demand from new markets such as South Sudan and expanding ones like Uganda, the DRC and Zambia.20

The State of East Africa 201256
THE PORT OF MOMBASA
Source: Kenya Ports Authority
Figure 5.8: Categories of Cargo in Mombasa Port (2006–2009)
Mombasa is the largest port in East Africa and the second largest in SSA by tonnage and con-tainers handled. Container traffic in 2010 was 696,000 TEUs (20-foot equivalent units), which was a significant increase from the 619,000 TEUs in 2009.
The total freight handled by the port of Mombasa rose by 2.8 per cent from 16 million tonnes in 2007 to 16.4 million tonnes in 2008. Although this is almost double the volume of Dar es Salaam, it is less than a quarter of Durban and only 2.5 per cent of the volumes of Singapore and Hong Kong.
Trans-shipment also saw some growth between 2007 and 2010, from 4.4 million to 5.4 million tonnes, an increase of 1 million tonnes in a three-year period. In 2009 Uganda was the largest market for transit goods, taking 80 per cent of the total, and is also the second-largest ex-porter after Kenya. Uganda accounts for almost 70 per cent of the transit traffic, and registered 6.3 per cent growth with a total of 4.2 million tonnes of its cargo passing through Mombasa in 2010 compared to 4.0 million tonnes in 2009. Rwanda has also increased its use of the port by 49.1 per cent, followed by the DRC at 15.0 per cent. The new and emerging market of South Sudan has registered a growth of 33.5 per cent and will become an increasingly important economic market.
Container dwell time declined from 6 days in 2009 to 5.7 days in 2010, indicating a slight im-provement of productivity at the terminal. In 2009 the average ship waiting time in Mombasa was 2.3 days and the average number of port days for a containerized vessel was 3.1 days.21
Liquid bulk – petroleum, oil and lubricants – is the most important product imported through Mombasa port. With an estimated 6.4 million tonnes of liquid bulk imported in 2009 this is more than double the amount imported by the port of Dar es Salaam. Dry bulk also doubled in two years from 2.7 million tonnes in 2007 to 4.6 million in 2009.
Figure 5.9 provides a good snapshot and visualization of the ongoing challenges faced by Mom-basa and the region. The entire process of having a ship dock at the port of Mombasa, offload and transport containers to Kampala in Uganda takes 22 days. Figure 5.10 gives a snapshot of how long it takes for a container to reach Kigali in Rwanda from Mombasa. The estimated time is 24 days. In both cases, a total of almost eight days is spent at the Kenya Ports Authority facility.

The State of East Africa 2012 57
Source: Transit Transport Coordination Authority (2009)
Source: Transit Transport Coordination Authority (2009)
Figure 5.9: Mombasa-Kampala Transit Time by Port and Road
Figure 5.10: Mombasa-Kigali Transit Time by Port and Road
Source: The East African, 15 January 2012
Kenya and Tanzania have a big ‘Congo problem’ with their – and East Africa’s – largest ports, Mombasa and Dar es Salaam respectively. Last week, things had got so bad at Mombasa port that the time it took cargo to reach Nairobi after a ship’s arrival there was up to 42 days. Everyone was screaming. Dar es Salaam is equally bad. Some World Bank estimates have it that if Mombasa reached even remotely close to the efficiencies of Dubai port, it could add a record 10 per cent growth to the Kenyan economy. East African countries like Rwanda, Uganda, and South Sudan that depend on Mombasa, would also see nearly the same lift in their growth.
If Mombasa got its act together, in other words, East Africa could become so rich, we would have money coming out of our ears. Instead, Kenya and Tanzania have become like the Democratic Republic of Congo. The country’s mineral wealth is estimated at $24 trillion, more than the combined GDP of Europe and America. Yet the DRC is one of the poorest countries not just in Africa, but the world. You have to watch events from the Ugandan capital of Kampala to understand how shambolic Dar and Mombasa ports are.
It would help if, to start with, East Africans agreed that Kenya and Tanzania can’t run modern ports. Beside basic incompetence, there are too many backward political forces and corruption networks that have captured the ports. A Kenyan friend, a true nationalist, with interests in the port, is so desperate that he recently remarked, ‘Mombasa should be given to [Rwanda] President Paul Kagame to run.’ However, a better solution might be for Mombasa and Dar ports to be declared ‘East African Hot Zones,’ and given the independent status that the Vatican has in Rome.
The EAC countries would get together and appoint companies who know how to run ports, like Dubai Port or the Port of Boston, to manage Dar and Mombasa.
BOx 5.5 – “gIVE DAR, MOMBASA PORTS TO EAC BEFORE WE ALL SINK”

The State of East Africa 201258
ELECTRICITy CAPACITy AND CONSUMPTION
Source: Source: Energy Information Administration, US Department of Energy
Figure 5.11: Electricity Capacity and Consumption in East Africa (2003–2009)
The region’s total installed capacity for the generation of electricity was 3,300 MW (mega-watts) in 2009, an increase of 33 per cent from 2,475 MW in 2003. Kenya accounted for 51 per cent of installed capacity, down from 49 per cent in 2003. Tanzania accounted for 29 per cent and Uganda 16 per cent, an increase from 12 per cent previously. Rwanda and Burundi ac-counted for the least amount, with 2 per cent each.
The region’s net generation of electricity was 13.9 billion kilowatt hours (kWh) in 2009, of which the majority was generated in Kenya (47 per cent), followed by Tanzania (32 per cent), Uganda (18 per cent), Burundi (2 per cent) and Rwanda (1 per cent). Net consumption in the region was 11.8 billion kWh in 2009: the majority was in Kenya, with 47 per cent, and the least was in Rwanda and Burundi, with 3 and 2 per cent respectively.
Energy Sources and Use
Source: National Geographic (13 July 2011) and East African Community Secretariat
One of the main advantages and most lauded aspects of regional integration is the opportunities to trade and share the most coveted resources: energy. One example that symbolizes the immense possibilities is Ethiopia, which in 2011 announced that it will construct a multibillion-dollar Nile River dam that could provide 5,000 megawatts of electricity for itself and its neighbors. Though Ethiopia is not a member of the EAC, projects that are built specifically to export electricity to areas that have high demand in the region is the type of blueprint the EAC wishes to follow. The Grand Millennium Dam is expected to be completed in 2015 and will be the largest hydroelectric power plant in Africa.
Cross-Border Electrification Program. The EAC has developed a cross-border electrification program that enables border centers to access electricity from the nearest grid. Under this program, Tanzania is supplied by Kenya at Namanga while Kenya is supplied from Tanzania at Lunga Lunga. Similar schemes exist between Uganda and Tanzania and between Uganda and Rwanda. Coordination is made at the local and national level and contracts between Kenya Power and Light-ing Company (KPLC) and Tanzania Electric Supply Company (TANESCO) have been operating smoothly since 2004.
KPLC hopes to serve as the main hub for interconnection between Ethiopia and the rest of the region signified by planned projects such as a proposed Kenya-Ethiopia interconnection project with potential power imports from Ethiopia of up to 1,000 MW by 2013 and 2,000 MW by 2018. This would be implemented in tandem with the linking of Kenya-Tanzania interconnection with future linkages between Kenya, Uganda, Rwanda, Burundi and the eastern part of the Democratic Republic of Congo by 2014.
Cross-border electrification programs will increase in importance over the next few years as demand grows as a result of the region’s growing population and economies. Expect Ethiopia’s importance to increase over the next few years as well and inquiries made of pushing for it to be a new member of the EAC.
BOx 5.6 – CONNECTINg ELECTRICITy ACROSS NATIONAL BORDERS

The State of East Africa 2012 59
REgIONAL OIL CONSUMPTION
Source: Energy Information Administration, US Department of Energy
Figure 5.12: Regional Oil Consumption (2003)
Source: Energy Information Administration, US Department of Energy
Figure 5.13: Regional Oil Consumption (2010)
The region consumed an estimated 144,000 barrels per day (bpd) in 2010, a 50 per cent in-crease from 96,000 bpd in 2003. Interestingly, this is less than the 200,000 bpd expected to be produced from Uganda’s recent oil discovery. Kenya’s use accounted for 54 per cent of regional consumption with 78,000 bpd. Tanzania had the second largest consumption of oil at 38,000 bpd. Burundi consumed the least amount with 3,000 bpd.
RENEWABLE ELECTRICITy
Source: Energy Information Administration, US Department of Energy
Figure 5.14: Total Renewable Electricity Net generation (2005–2008)

The State of East Africa 201260
East Africa had a total of 8.7 billion kWh of renewable electricity net generation in 2008.22 The majority came from Kenya, which produced 4.2 billion kWh of renewable electricity, followed by Tanzania with 2.6 billion kWh and Uganda with 1.6 billion kWh. Renewable electricity generation in Rwanda and Burundi is notably absent.
In 2005 the region had a total of 8.0 billion kWh of renewable electricity net generation, thus there was only a slight increase between 2005 and 2008. Tanzania was the only country in the region with increased net generation of renewable electricity, from 1.8 to 2.6 billion kWh. Other countries had a decrease: Uganda fell from a peak of 1.8 billion kWh in 2005 to 1.6 bil-lion in 2008, while Kenya was dominant throughout the period but peaked in 2007.
CARBON DIOxIDE (CO2) EMISSIONS
Source: Energy Information Administration, US Department of Energy
Figure 5.15: Total CO2 Emissions from Energy Consumption (2005–2009)
East Africa’s CO2 emissions increased from 18 million tonnes to 21 million tonnes between 2005 and 2009. The region accounted for 2 per cent of the 119 million tonnes of CO2 emitted from Africa in 2009. Kenya has consistently emitted more CO2 into the atmosphere than its regional counterparts (Table 5.3). In 2009 Kenya emitted 11.4 million tonnes, followed by Tanzania’s 6.7 million tonnes and Uganda’s 1.9 million tonnes. These three countries account for 95 per cent of total CO2 emissions in the region. Rwanda and Burundi emit less than 1 million tonnes per year each.
Table 5.3 – Regional CO2 Emissions Per Capita
Population (2010)
Total CO2 emissions in 2009 (million tonnes)
Emissions in tonnes per person
Tanzania 45 6.7 0.15
Kenya 41 11.4 0.28
Uganda 34 1.9 0.06
Rwanda 10 0.7 0.07
Burundi 9 0.4 0.04
EAC (average) 139 21.1 0.15
Source: Energy Information Administration, US Department of Energy and UNDP Human Development Report (2011)

The State of East Africa 2012 61
MOBILE SUBSCRIBERS
‘CALLINg TANzANIA?’
Source: All EAC communications regulatory authorities
Source: Tanzania Communications Regulatory Authority
Figure 5.16: Mobile Subscribers in East Africa (2002–2010)
Figure 5.17: Tanzania’s Minutes to and from East Africa (2007–2010)
The number of mobile subscribers in the region was an estimated 64.4 million in 2010, a 21-fold increase from the 2.9 million subscribers in 2002. East Africa accounts for 10 per cent of all mobile subscribers in Africa. The mobile phone penetration rate in the region increased from 10 per cent in 2005 to 47 per cent in 2010.
Kenya led with 25 million mobile subscribers, a penetration rate of 62 per cent, followed by Tanzania with 21 million subscribers and a penetration rate of 47 per cent. Uganda’s 13.7 mil-lion subscribers yielded a 41 per cent penetration rate. Rwanda (3.5 million, 33 per cent) and Burundi (1.2 million, 1 per cent) had lower figures.
The mobile phone industry began in the early part of the decade and saw a significant surge between 2003 and 2005. Kenya was the first country in the region to reach 1 million subscrib-ers when it achieved 1.6 million mobile users in 2002. Burundi had the lowest number of mobile subscribers throughout the decade, but crossed the 1 million mark in 2010.
The mobile phone has effectively replaced fixed phone lines in the region. The increase in the number of fixed lines of 130,737 between 2002 and 2009 translates to about 19,000 new annual subscribers. This compares to 8.7 million new mobile subscribers every year in the region.
Rise of Mobile Communications

The State of East Africa 201262
Figure 5.17 shows Tanzania’s minutes to and from East Africa. It is interesting to note that Tanzania’s Communications Regulatory Authority was the only authority that had such detailed recordings of regional telecommunications. All the other national regulatory authorities dif-ferentiated minutes as either domestic/local or international.
The figure shows that between 2007 and 2008 Tanzanians made more calls to their East African neighbours than they received from them. After 2008 the roles were reversed, and between 2009 and 2010 traffic minutes from East Africa to Tanzania exceeded those from Tanzania to the region. Minutes from East Africa jumped from 33.5 million to 64 million in one year, and then to 71.7 million by 2010.
INTERNET USERS
Source: All EAC communications regulatory authorities
Figure 5.18: Internet Users in East Africa (2006–2010)
In 2010 Kenya had the highest number of internet users in the region, with approximately 8.8 million people accessing the web. This is followed by Tanzania, with 4.8 million, and Uganda with 3.5 million users. Interestingly, information and data on internet users in Rwanda were not readily available.
Many East Africans use their phones as a means to access the internet. As of April 2010, 45 per cent of Tanzanians accessed their internet subscription through a mobile device, and by September 2011 99 per cent of Kenya’s internet users accessed it using their mobile phones.
The Communications Commission of Kenya estimates that a 1 per cent increase in the number of internet users boosts total exports by 4.3 per cent and increases exports from low-income countries to high-income countries by 3.8 per cent.
Source: SID Outlook on Mobile Web Innovations in the Greater Horn of East Africa
The mobile phone is how the vast majority of East Africans are accessing and will continue to access the internet. Reporting on the October–December statistics, the Communications Commission of Kenya notes that:“The mobile data/internet subscriptions through GPRS/EDGE and 3G continue to dominate internet subscriptions and ac-counted for 99% of the total subscriptions during the period.”Furthermore, smart phones are increasing their share of the devices used to access the web. In 2011 there were 32 non-smart phones for every smart phone; by 2015 that ratio is expected to fall to less than six. This means the expansion of the space into which more sophisticated applications can be deployed. There is also increasingly money to be made in the mobile advertising business. The independent mobile phone advertising firm InMobi reported a 21% increase in overall mobile ad impressions between January and April 2011, and a 17% increase in ad impressions from smart phones. Kenya accounted for 7.1% of Africa’s total, behind South Africa (22.4%), Nigeria (17.15%), Egypt (12.4%), Ghana (9.4%) and Sudan (11%).
BOx 5.7 – MOST EAST AFRICANS gO ONLINE THROUgH THEIR MOBILE PHONES

The State of East Africa 2012 63
Economic Profile
Between 2000 and 2010 the size of East Africa’s economy grew in real terms from $32 billion to $79 billion. Kenya’s share of the regional economy was the largest at 40 per cent, while Tanzania had 29 per cent in 2010. East Africa’s economy grew at a rate of 6 per cent in 2010, with Rwanda having the fastest growth rate of 7.5 per cent. Kenya had a significant decrease in its growth rate in 2008 and 2009 (2 per cent and 3 per cent) due to the consequences of the post-election violence that occurred in December 2007 and spilled over to the first few months of 2008.
With consistent growth in its economy, East Africa has attracted significant investments both from the continent and globally. Total foreign direct in-vestment inflows in the region were an estimated $1.7 billion in 2010, with the majority share (49 per cent) going to Uganda.
East Africa is globalizing. In 2010 the value of the EAC’s total trade with the world was $37 billion, which was double the $17.5 billion achieved in 2005. The region’s trade with the world as a share of its economy expanded from 28 per cent in 2005 to 47 per cent in 2010. Intra-EAC trade also expanded from $2.2 billion to $4.1 billion between 2005 and 2010. However, as a share of East Africa’s total trade, intra-regional trade declined slightly from 13 per cent in 2005 to 11 per cent in 2010.
Size, Structure and Performance
Trends in Foreign Financing
Public Finance Profile
Volume and Direction of Trade
Labour and Employement
Chapter 6
Photo: Malimbika Photography

The State of East Africa 201264
SIzE OF REAL gDP
COUNTRy SHARE OF EAST AFRICA’S ECONOMy
Source: World Bank Development Indicators
Source: World Bank Development Indicators
Figure 6.1: Trends in Size of Real gDP in East Africa (2000-2010)
Figure 6.2: Trends in Country Share of East African Economy (2000-2010)
The East African economy grew in real terms by $47.2 billion from $31.5 billion in 2000 to $78.7 billion in 2010. Kenya’s economy increased the most between 2000 and 2010, by $18.7 billion, followed by Tanzania with $12.9 billion. Tanzania’s total real GDP in 2010 was an estimated $23 billion, while Kenya’s was an estimated $31 billion. The smallest economy in 2010 was Burundi, with an estimated real GDP of 1.6 billion. Burundi’s economy expanded by $901 million over the ten-year period.
Kenya maintained its position of holding the largest share of East Africa’s economy at 40 per cent for the decade 2000–2010. Tanzania’s share dropped from 32 per cent to 29 per cent as a result of Uganda’s share rising to 22 per cent from 20 per cent and Rwanda’s from 6 per cent to 7 per cent.
Size, Structure and Performance of the Economy

The State of East Africa 2012 65
ECONOMIC gROWTH TRENDS
INFLATION TRENDS
Source: World Bank Development Indicators
Source: National bureaux of statistics of all EAC members
Figure 6.3: Economic Performance in East Africa (2005–2011)
Figure 6.4: Inflation Trends in East Africa (2005–2011)
East Africa’s average growth rate in 2010 was 6 per cent, with Rwanda having the fastest growth rate at an estimated 7.5 per cent. Tanzania also had a relatively high growth rate with 7 per cent in 2010. Burundi had the slowest growth rate with 4 per cent, while Kenya and Uganda had similar growth rates at 5 per cent.
The region saw an average growth rate of 6.3 per cent from 2005 to 2010. Rwanda’s growth dipped below the average rate of the region only once, in 2009, when it was 4.1 per cent. Rwan-da and Uganda are the only two countries to have achieved a double-digit growth rate: in 2008 Rwanda’s rate was 11 per cent, while it was 10.7 per cent in Uganda in 2006. Burundi’s growth rate displays a more downward trend than the rest of the countries in the region. Tanzania’s growth rate remained steady, averaging 7 per cent from 2000 to 2005, while Kenya had a signifi-cant drop in performance in 2008 and 2009 (2 per cent and 3 per cent) due to the consequences of the post-election violence that straddled the end of 2007 and beginning of 2008.
Average inflation in the region was 5 per cent in 2010, the lowest rate since 2005 and coming off a peak of amost 18 per cent in 2008. The trend reversed in 2011, when East Africa saw the return of high inflation (12 per cent) due to increases in global food and fuel prices. Average inflation in 2011 was highest in Uganda at 19 per cent, and peaked at 30 per cent in October 2011. Kenya’s peaked at 19.7 per cent in November and Tanzania ended the year with 19.8 per cent in December. Rwanda enjoyed the lowest inflation rate, 6 per cent, in the region.

The State of East Africa 201266
The average headline inflation rate masks how its effects are distributed across the population. A close examination of the inflation data, especially how its different components have moved during the past 12 months, shows how the currency depreciation and price inflation transmits its effects on the poor and vulnerable populations. In most cases, food, which forms an important part of the low-income consumption basket, has seen prices increase faster than the average inflation rate.
Rwanda was the best-performing country in 2011 when all other EAC member states saw high inflation and their cur-rencies depreciate. However, prices rose by 7.4% between November 2010 and 2011. In urban areas, where bread and cereals make up 7.3% of the consumption basket, the prices of bread and cereals increased by almost 21%. Uganda’s general price level rose by 28% in the year to September 2011, but the price of food crops rose by almost 39% during that time.
Disaggregating the inflation data in Tanzania and Kenya is equally revealing in terms of where the price movements are. Tanzania’s overall inflation rate increased by almost 13.7% in the 12 months to November 2011 but food prices rose by almost 26%. Between August and September 2011, while the overall inflation rate was 2.4%, food prices rose by 3.4%. Specifically, the price of maize grains increased by 5% while the cost of grinding it increased by 3.4%, and cooking it by charcoal went up by 8.3%. For Kenya, the price of maize flour and grains fell by 3.1% and 3.7% in September 2011 compared to August 2011. However, in the year between November 2010 and 2011, overall food prices increased by 26%.
This closer examination of the components of the raising price levels in the EAC confirms the overall observation that inflation is being driven in large measure by increases in food prices. It also hints quite robustly at the fact that such food prices are exerting a burden that is not being shared ‘equally’ across the region’s income classes.
BOx 6.1 – WHAT IS HIDDEN BEHIND THE ‘AVERAgE’ INFLATION NUMBER?
Source: SID GHEA Outlook on Currency, Inflation and Monetary Union (November 2011)

The State of East Africa 2012 67
NET DISBURSEMENTS OF AID
Source: OECD
Source: OECD
Figure 6.5: Net Disbursements of Aid to East Africa (2006–2010)
Figure 6.6: Net Aid Disbursements Per Person (US$)
In 2010 East Africa received $7.9 billion in net disbursements of foreign aid, a 46 per cent increase on the $5.4 billion received in 2006. Tanzania has consistently received the larg-est share of aid, followed by Uganda and Kenya. The United States led OECD countries in aid to the EAC with an estimated $1.8 billion in 2010, with a majority of it going to Kenya. The United Kingdom was next, with $650 million in aid to the EAC, with the majority of it going to Tanzania. Finally, Germany sent a total of $331 million in aid to the region, with the majority of it also going to Tanzania.
However, the picture changes when aid disbursements are examined on a per capita basis. By this measure, Rwanda is East Africa’s largest recipient of aid, receiving $70 per person in 2006 and $100 in 2010. Burundi comes next, with aid disbursements growing from $57 to $74 over the same period. Tanzania replaced Uganda in third place by receiving $66 in aid per capita in 2010 compared to Uganda’s $51. Uganda was the only country that saw per capita aid fall, from $57 to $51.
Trends in Foreign Financing
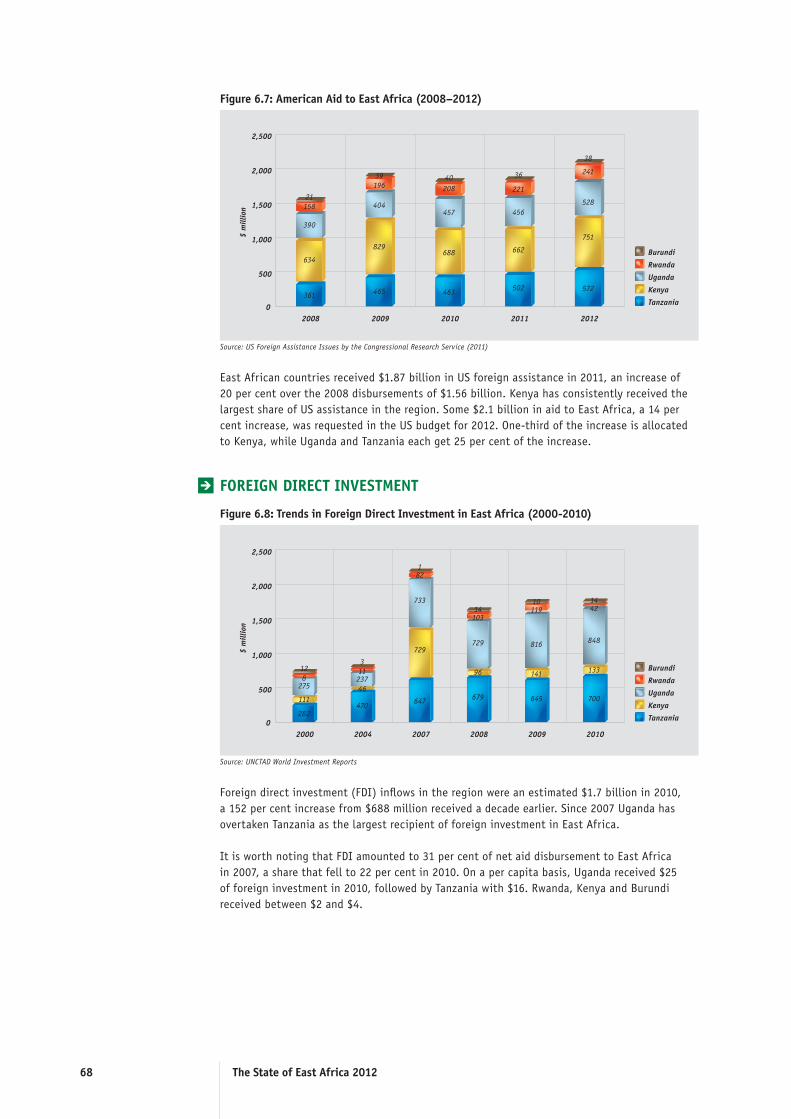
The State of East Africa 201268
Source: US Foreign Assistance Issues by the Congressional Research Service (2011)
Figure 6.7: American Aid to East Africa (2008–2012)
East African countries received $1.87 billion in US foreign assistance in 2011, an increase of 20 per cent over the 2008 disbursements of $1.56 billion. Kenya has consistently received the largest share of US assistance in the region. Some $2.1 billion in aid to East Africa, a 14 per cent increase, was requested in the US budget for 2012. One-third of the increase is allocated to Kenya, while Uganda and Tanzania each get 25 per cent of the increase.
FOREIgN DIRECT INVESTMENT
Source: UNCTAD World Investment Reports
Figure 6.8: Trends in Foreign Direct Investment in East Africa (2000-2010)
Foreign direct investment (FDI) inflows in the region were an estimated $1.7 billion in 2010, a 152 per cent increase from $688 million received a decade earlier. Since 2007 Uganda has overtaken Tanzania as the largest recipient of foreign investment in East Africa.
It is worth noting that FDI amounted to 31 per cent of net aid disbursement to East Africa in 2007, a share that fell to 22 per cent in 2010. On a per capita basis, Uganda received $25 of foreign investment in 2010, followed by Tanzania with $16. Rwanda, Kenya and Burundi received between $2 and $4.

The State of East Africa 2012 69
The East African Customs Union became effective in July 2005. Since then, the scale and scope of cross-border trade and production transactions have expanded and deepened.
Bakhresa Group of Companies, based in Tanzania, has invested in the largest wheat mill in Uganda, with a daily production capacity of 450 metric tonnes (mt) of wheat flour and a storage capacity of 6,400 mt. It plans to increase capacity by installing a new mill with a capacity of 360 mt per day.
Sumaria Group, also based in Tanzania, has expanded into the region. Anticipating the customs union, Sumaria ac-quired Beta Healthcare in Kenya in 2003. It also has a significant presence in plastics manufacturing through Sumaria Industries Limited.
Bidco Oil Refineries, based in Kenya, is the biggest manufacture of edible oils, fats and hygiene products in the East Africa region and a strong challenger to Unilever in East and Central Africa. It has invested in a fully integrated edible oil business in Uganda, its oil refinery in Kenya is the largest in East Africa and it has built a presence in Tanzania. Bidco’s CEO, Vimal B. Shah, views the EAC as a bloc that will help companies like Bidco grow. He noted that after the common market became effective, Bidco’s sales to the region doubled. Bidco wants to use its strength in East Africa to become a market leader on the entire continent.
Nakumatt is a regional retailer that is in many ways Kenya’s version of Wal-Mart. It seeks to provide all essential and luxury goods for its customers at a reasonable price and in key locations within its base, Kenya, and beyond. Nakumatt has 35 outlets in Kenya, Uganda and Rwanda, while the recently inaugurated branch in Moshi, Tanzania, is the first Nakumatt outlet in that country. In 2012 the company hopes to open at least four more outlets in Tanzania to compete directly with Shoprite Holdings and Game Stores of South Africa.
BOx 6.2 – SOME OF EAST AFRICA’S REgIONAL BUSINESS CHAMPIONS
Source: Various newspapers and company websites

The State of East Africa 201270
TRADE PERFORMANCE
TOP ExPORTS AND IMPORTS
Source: EAC Secretariat Facts and Figures (2011)
Figure 6.9: Trends in East Africa’s Trade Performance (2000–2010)
East Africa’s total trade was $37 billion in 2010, representing a fourfold increase from the $8.8 billion traded in 2000. Trade in 2010 was worth 47 per cent of East Africa’s GDP, compared to 28 per cent in 2000, signalling the region’s deepening integration with the global economy. The $11.1 billion of East African exports in 2010 were predominantly from Kenya ($5.2 billion or 47 per cent) and Tanzania ($3.9 billion or 36 per cent). Kenya also accounted for 44 per cent of the $27 billion in imports, while Tanzania’s import share was 29 per cent in 2010.
In 2010 the combined total of each country’s top three exports was $3.92 billion, or 36 per cent of the region’s total exports. Agricultural products (tea, coffee, flowers, fish, tobacco and cashews) accounted for the majority of this, estimated to be $2.7 billion of the top three exports. The balance of $1.2 billion of top three exports is made up almost entirely of gold.
Volume and Direction of Trade
Table 6.1 – East Africa’s Top Three Export Products (2010)
Country 1 2 3
Tanzania Gold $914 million
Tobacco $121 million
Cashews $118 million
Kenya Tea $1.2 billion
Cut flowers $312 million
Coffee $150 million
Uganda Coffee $283 million
Fish and fish Products$127 million
Cellular telephones$79 million
Rwanda Tin ores$66 million
Coffee$57 million
Tea$34 million
Burundi Coffee$275 million
Gold$164 million
Tea$23 million
Source: National bureaux of statistics of all EAC countries and UN Comtrade

The State of East Africa 2012 71
INTRA-REgIONAL TRADE
Source: EAC Secretariat Facts and Figures (2011)
Figure 6.10: Intra-Regional Trade as Share of East Africa’s Total Trade (1990-2010)
The share of intra-regional trade as a percentage of East Africa’s total trade with the world has trended slightly downwards. Although intra-regional trade doubled from $2.2 billion to $4.1 billion between 2005 and 2010, its share of East Africa’s total trade activity fell from 13 per cent to 11 per cent. From a peak of 22 per cent in 1995, the share of total exports that are traded within the region fell to 19 per cent in 2008 before rebounding to 21 per cent in 2010. Intra-regional imports as a share of total imports fell from 11 per cent to 7 per cent over the same period.
A potential catalyst of informal cross-border trade could be government action to ban the export of agricultural produce in a bid to ensure domestic food security (see Box 6.4).
The combined total of each country’s top three imports was valued at $6.5 billion in 2010, or 59 per cent of total imports. The major import categories were petroleum and related products ($1.8 billion), vehicles and transport equipment ($1.4 billion) and machinery ($1.07 billion).
Table 6.2 – East Africa’s Top Three Imports (2010)
Country 1 2 3
Tanzania Transport equipment$856 million
Machinery$841 million
Food and beverages$727 million
Kenya Crude petroleum$915 million
Gas and diesel oil(Value unavailable)
Vegetable oils and fats$1.2 million
Uganda Petroleum$916 million
Road vehicles$418 million
Specialized machinery for particular industries$232 million
Rwanda Motor vehicles$79 million
Petroleum oils$47 million
Portland cement$42 million
Burundi Medicaments$75 million
Portland cement$72 million
Motor vehicles$41 million
Source: National bureaux of statistics of all EAC countries and UN Comtrade

The State of East Africa 201272
A closer look at the intra-regional trade data shows interesting patterns. As Table 6.3 shows, Kenya exported $418.9 million worth of goods to Tanzania in 2010 but Tanzania only recorded $275.6 million worth of goods from Kenya, resulting in a $143.2 million difference. This pattern is evident across all countries. In 2010 Uganda exported $616.8 million worth of goods to the region, but the region claims to have imported only $359.8 million, leaving a gap of $257 million. Is this a sign of informal trade or over/under-declaration of the value of the traded goods?
In 2005 the total value of ‘missing’ intra-regional trade was $341 million. This increased to $591 million in 2010. In-terestingly, Rwanda seems consistently to uplift the value of its imports from the region. Table 6.3 shows that Kenya exported $132.9 million to Rwanda, but Rwanda imported $169.4 million (a $36.5 million difference).
BOx 6.3 – EVIDENCE OF EAST AFRICA’S BOOMINg INFORMAL CROSS BORDER TRADE?
Table 6.3 – Informal Trade in East Africa (2010)
Kenya’s export to... Imports from Kenya “Informal“ trade
Uganda $657.1 million $549 million $108.1 million
Tanzania $418.8 million $275.6 million $143.2 million
Rwanda $132.9 million $169.4 million ($36.5 million)
Burundi $68.8 million $31 million $37.8 million
Total $1,277.6 million $1,025 million $252.6 million
Source: Computed from data published by the EAC Secretariat
While inflation across the region is driven in part by global food price increases, it also reflects the actual and per-ceived shortage of food locally and in the region. As early as March 2011, governments sought to control inflation by banning the export of staples from their territories. Ethiopia started a trend and Tanzania followed suit:
Tanzania announced a food export ban in May after unregulated trade caused shortages that helped drive the rate of inflation to 14.1% in August. The government blamed food shortages in some parts of the country and high prices in urban centers on distribution constraints. (Emphasis added.)
In an August meeting of the EAC agricultural ministers, Tanzania’s deputy minister for Agriculture, Food Security and Cooperatives, Christopher Chiza, noted that although the country had a surplus of 1.1 million bags of cereals, includ-ing maize, the amount may not be sufficient to allow for export. In September, the export of sugar was also banned as an additional measure to tame the spiraling prices.
Kenya’s response was to stop the export of seeds, ‘following a shortage of maize seed in the agriculture growing regions of Western and Rift Valley during the planting season earlier this year [2011].’ The country’s Assistant Agricul-ture Minister, Kareke Mbiuki, was quoted justifying the restrictions on seed exports:
We are aware that our government has banned seed exports to other EAC member states but that does not mean that we do not abide by the requirements of a common market that allows for free movement of goods.
Uganda stayed its hand, continued to allow food exports and received the following praise from the IMF:Uganda deserves a lot of credit for resisting the temptation of limiting the export of food to remain the food basket of the region.
Once export bans are instituted, they must be enforced. And attempts at enforcing the bans had led to a rise in informal cross border trading (read: smuggling). According to the FEWS NET/FAO/WFP Joint Cross-Border Market and Trade Monitoring Initiative, the share of food commodities that was traded formally across the region’s borders fell from 76% in 2010 to 63% (January–June) and further to 42% in the July to September 2011 period.
On October 11, 2011 the government of Tanzania lifted the ban on the export of grains to the region. The sugar ban remained in place.
BOx 6.4 – gOVERNMENTS BAN CEREAL AND SUgAR ExPORTS, AND TRy (UNSUCCESSFULLy) TO ENFORCE IT
Source: SID GHEA Outlook on Currency, Inflation and Monetary Union (November 2011)

The State of East Africa 2012 73
In a speech addressed to the nation, President of the Republic of Burundi HE Pierre Nkurunziza expressed his satisfac-tion with regard to work well done by the Office Burundais des Recettes, where the set targets in terms of revenue collection during 2011 have been surpassed. Speaking about revenues, the president informed the nation that the OBR has collected over BIF470 billion ($333 million), compared to only BIF362 billion ($283 million) in 2010. There is therefore an increase of more than BIF108 billion, or roughly 30 per cent.
Based on these tangible results, the head of state reassured civil servants and their families that ‘Despite the economic crisis around the world, which reduced significantly the assistance that our country has been receiving, and considering the performance of the OBR, we can ensure you that the monthly salaries are guaranteed. Be comforted, and comfort even others, do not listen to prophets predicting disasters on the basis of this global economic crisis. We warmly congratulate all of you who were the first to understand and apply the principle of positive change. Continue that way.’
BOx 6.5 – “HEAD OF STATE CONgRATULATES OBR FOR gOOD REVENUE COLLECTION PERFORMANCE”
TAx REVENUE
Source: African Development Bank Statistical Yearbook (2011)
Source: Based on official BR website, http://english.obr.bi/home/21-news/112-the-head-of-states-congratulates-obr-for-the-good-revenue-collection-performance.html
Figure 6.11: Tax Revenue as Share of Total Revenue (2003-2010)
In 2010 Kenya’s tax revenue was 87 per cent of its total revenues (including tax and non-tax revenues and grants), which was the highest in the region – a position Kenya has maintained since 2003. Uganda’s tax revenue was 81 per cent of its total revenues in 2010, a significant in-crease from 62 per cent five years earlier. Tanzania and Burundi’s tax revenues were 66 per cent and 67 per cent respectively, demonstrating an upward trend between 2003 and 2005. Rwanda’s tax revenue was 50 per cent of its total revenue, which was the lowest in the region.
Public Finance Profile

The State of East Africa 201274
gOVERNMENT DEBT
Source: IMF World Economic Outlook (2011)
Figure 6.12: government Debt in East Africa (2002-2010)
The trend in East Africa has been to reduce gross government debt23 as a percentage of GDP. Between 2002 and 2010 Burundi reduced its government debt from over 200 per cent to 50 per cent of GDP, the most dramatic reduction in the region. Rwanda also slashed its debt from 108 per cent to a frugal 23 per cent, the lowest in East Africa in 2010. Uganda, Tanzania and Kenya had debt levels of 24 per cent, 40 per cent and 52 per cent of GDP in 2010. By way of compari-son, in 2010 the G7 economy with the lowest gross government debt-to-GDP ratio was Britain with 75 per cent. The highest was Japan with 220 per cent.

The State of East Africa 2012 75
LABOUR FORCE
EMPLOyMENT AND UNEMPLOyMENT ESTIMATES
Source: International Labour Organization Key Indicators of the Labour Market
Figure 6.13: Labour Force Participation Rate (2000–2010)
In 2010 the labour force participation rate was highest in Tanzania at 89 per cent, followed by Rwanda (86 per cent), Burundi (83 per cent), Uganda (78 per cent) and Kenya (66 per cent) – the lowest participation rate. Labour force participation in the region fluctuated from 2000 to 2010 but did not decrease significantly. Kenya has remained the only country in the region with a participation rate lower than 70 per cent, while Tanzania is the only EAC country to have reached 90 per cent since 2000.
Labour force participation rates among women have remained constant throughout the region. In 2000 Rwanda’s participation rate among women was 86 per cent, which was the same in 2010. Uganda had a more pronounced decrease in female labour force participation, from 81 per cent in 2000 to 76 per cent in 2010. The gap in labour force participation in Kenya has remained at 10 per cent in favour of men.
Labour and Employment
Table 6.4 – Trends in East Africa’s Economically Active Population in Thousands
Country 1980 1990 2000 2010 2015 2020
Tanzania 9,978 13,758 18,860 24,891 28,833 33,623
Kenya 8,133 11,963 17,550 23,362 26,760 30,845
Uganda 6,625 9,205 12,353 17,331 20,713 24,788
Rwanda 2,783 3,633 4,314 5,925 6,749 7,740
Burundi 2,282 3,106 3,479 5,289 5,933 6,586
EAC 29,802 41,665 56,558 76,799 88,987 103,582
Source: International Labour Organization’s labour statistics database, LABORSTA
Table 6.4 shows the trends in East Africa’s economically active population between 1980 and 2020. It is notable that this labour force grew by 20.2 million between 2000 and 2010, but its projected growth is an accelerated 26.7 million people in the decade to 2020. The challenge is one of absorbing this expanding workforce into the job market.
Integrated labour force surveys provide some baseline data on employment and unemployment in the region. According to Tanzania’s 2006 survey, 2.2 million Tanzanians were unemployed, yielding an unemployment rate of 12 per cent. About 1.7 million people were employed in the informal sector. The Tanzania National Bureau of Statistics estimated that 2.4 million people

The State of East Africa 201276
(10.7 per cent) were unemployed in 2011 and 2.5 million were in the informal sector.
Rwanda’s National Bureau of Statistics reports data from 2005–2006 showing that unemployment was 1.2 per cent overall, but doubled to 2.5 per cent among Rwandans aged 21–30. Interest-ingly, it states that 61 per cent of the labour force are working, while 6 per cent are inactive. Other sources claim that Rwanda had an unemployment rate of 30 per cent at the end of 2008.24 Uganda’s Bureau of Statistics reports that the total labour force increased from 10.8 million peo-ple in 2006 to 13.4 million people by 2010. The unemployment rate among Ugandans aged 14–64 was 4 per cent in 2010 and a majority of the labour force classified themselves as self-employed.
According to the Kenyan National Bureau of Statistics, there were 2.1 million people in the official employment sector (including private agriculture and forestry, the private sector and public service). An estimated 54 per cent were in the private sector, while 14 per cent worked in private agriculture and forestry. The unemployment rate in Kenya was 40 per cent in 2009, with 60 per cent of this unemployed pool being the youth. Burundi had an unemployment rate in 2009 of 35 per cent, according to the African Development Bank and the OECD. For youth aged 15–30, an estimate of 60 per cent are either unemployed or underemployed.25 Agriculture accounts for 94 per cent of employment in the country.
East Africa’s labour force will grow by 27 million people between 2010 and 2020. Where will the employment op-portunities lie to absorb this growing labour force? The unemployment and jobs creation challenge in the region is both a puzzle and a mystery. It is a puzzle because there is a glaring paucity of information about the true jobs and unemployment picture. It is a mystery because there are many options that present themselves on how to go about tackling the unemployment problem and job creation challenge.
Solving the puzzle by asking the people. One way to solve the puzzle of having too little information about the extent of unemployment is to ask citizens directly about their employment status. You will find that sometimes surveys may even have higher unemployment rates than official statistics. Periodic surveys would not make for pleasant reading, but they would go a long way towards deepening policy-makers’ understanding of the depth and dynamics of unem-ployment in their countries.
Solving the jobs crisis. In order to solve the jobs crisis, creative solutions need to be implemented. Some of these solutions could be changing the retirement age (mooted by Uganda), facilitating the export of labour, and investing in the creative economy and small and medium-sized enterprises (SMEs). The changes in retirement age that have been mooted are unlikely to have any major or long-lasting impact beyond placating restive young people for a brief moment. The increase in new jobs would be small and would only be seen in the year that the policy is implemented.
Direct job creation efforts by governments depend heavily on donor funding, and hence they may not be sustainable in the long run. While they are directed at the unemployed, their job creation targets tend to be a fraction of the annual increase in the labour force.
The creative economy’s potential to create jobs in the region is not well understood. It will likely hinge on individual entrepreneurial energy on the supply side to produce the tangible goods and services, and a deepening of the markets for those goods and services on the demand side. The potential jobs footprint appears to be small at this stage, but it could surprise. The mobile phone revolution has created hundreds of thousands of jobs in the sale of airtime, retail-ing, repair and servicing of phones and accessories and even the distribution of popular music and ringtones.
SMEs can have a significant positive job creation and poverty reduction impact. Small firms’ potency comes from being located in urban areas and able to pay the wages of more than one or two people. Single-person, rural-based non-farm SMEs will not do the job.
Which combination works the best? Direct job creation, changing the retirement age, exporting labour, investing in the creative economy or SME expansion? Will a combination of these options yield the best results in delivering a substantial portion of the 27 million new jobs needed in the region by 2020? Good judgement and a careful assess-ment of uncertainty are needed in order to unravel this particular mystery. But a good place to start must be to solve the puzzle by closing the information gaps about the extent of the unemployment problem.
BOx 6.6 – EAST AFRICA’S 27 MILLION jOBS CHALLENgE
Source: Based on SID GHEA Outlook on the Jobs Challenge (July 2010)

The State of East Africa 2012 77
Politics and Government
The political and institutional apparatuses are quite similar across the five countries and have remained relatively stable over the past five years. All of the five governments are constitutional republics with legislatures chosen through periodic multi-party elections.
By 2010, four of the five EAC countries were considered ‘partly free’ with re-spect to political freedoms. Rwanda was considered ‘not free’, and has been the only country with that ranking since 2005. However, Rwanda had the highest share of women in parliament in 2010, 56 per cent, while Kenya had the lowest with 10 per cent. Corruption remains a challenge in the region. The prevalence of bribery was perceived to be highest in Burundi and the lowest in Rwanda. The police, revenue authorities and judiciary were cited as the most corrupt institutions in the region.
Conflict intensity seems to have diminished in recent years. The region hosted an estimated 733,080 refugees in 2010, down from 1.2 million in 2004. In 2004 the majority of these refugees were hosted in Tanzania, but by 2010 the majority were hosted in Kenya, demonstrating a northward shift in conflict towards Somalia, Sudan and South Sudan.
Even with a lack of overt conflicts in the region, East Africa still spent $1.2 billion on its military in 2009, with Kenya and Uganda accounting for 73 per cent of total spending. Prior to Operation Linda Nchi, Kenya was the only country in the EAC that had not engaged in a military operation in a neighboring country. Somalia has been the theatre for joint military opera-tions, as three of the five EAC countries are now engaged there through the African Union Mission in Somalia (AMISOM). The US Africa Command (AFRICOM) has engaged with the region through support of joint military exercises. In 2009 AFRICOM invited all EAC members for military exercises in Uganda to improve interoperability and capacity building to respond to complex humanitarian emergencies, and in 2011 two AFRICOM exer-cises were planned involving soldiers from Tanzania and Uganda. Military exercises among the EAC partner states have also increased over the years, demonstrating an acknowledgement that the region is becoming an impor-tant geostrategic location.
Political and Institutional Structure
Corruption and Political Freedom
Military and Conflict
Mo Ibrahim Index EAC Spotlight
Counterterrorism
Chapter 7
Photo: UN Photo/Martine Perret

The State of East Africa 201278
Political and Institutional Structure
Table 7.1 – Political and Institutional Structures in East Africa
TANzANIA KENyA UgANDA RWANDA BURUNDI
Official name United Republic of Tanzania
Republic of Kenya Republic of Uganda Republic of Rwanda Republic of Burundi
Form of state Republic, formed by the 1964 union of Tanganyika and Zanzibar
Republic Republic Republic Republic
Independence 9 December 1961 12 December 1963 9 October 1962 1 July 1961 1 July 1962
Administrative divisions
26 regions 7 provinces 80 districts 4 provinces 17 provinces
Constitutional and legal system
Based on English common law, the 1977 union and 1985 Zanzibar Constitu-tion as amended
Mixed legal system of English common law, Islamic law and customary law: judicial review in High Court
Mixed legal system of English common law and customary law
Mixed legal system of civil law, based on German and Belgian models, and customary law
Mixed legal system of Belgian civil law and customary law
Suffrage Universal adult (18 yrs) Universal adult (18 yrs) Universal adult (18 yrs) Universal adult (18 yrs) Universal adult (18 yrs)
Latest national elections
December 2010 (presidential and legislative), next elections due in 2015
December 2007 (presidential and legislative), next elections due in 2012
February 2011 (presidential and legislative), next elections due in 2016
August 2010 (presidential and legislative), next elections due in 2017
June 2010 (presiden-tial and legislative), next elections due in 2015
Women inparliament
126 women of 350 (36%) with 102 al-located seats
22 women of 224 (10%)
131 women of 375 (35%)
45 women of 80 (56%)
34 women of 106 (32%)
Head of state President, elected by universal suffrage for a five-year term (renewable once)
President, elected by universal suffrage for a five-year term (renewable once)
President, elected by universal suffrage for a five-year term (no term limits)
President, elected by universal suffrage for a seven-year term (renewable once)
President, elected by universal suffrage for a seven-year term (renewable once)
Executive branch PresidentJakaya KikweteVice PresidentMohammed Gharib BilalPrime MinisterMizengo PindaPresident of zanzibarAli Mohamed Shein
PresidentMwai KibakiVice PresidentStephen KalonzoPrime MinisterRaila Odinga
PresidentYoweri MuseveniVice PresidentEdward Ssekandi Prime MinisterAmama Mbabazi
PresidentPaul KagamePrime MinisterPierre Habumuremyi
PresidentPierre Nkurunziza First Vice PresidentTherence Sinunguruza Second Vice PresidentGervais Rufyikiri
Legislative branch
National Assembly with 357 seats, 239 members elected directly
National Assembly with 224 seats, 210 members elected directly
National Assembly with 327 seats, 215 members elected directly
26-seat Senate, 12 members elected by local council Chamber of Deputies with 80 seats, 53 members elected directly, 24 women elected by local bodies, 3 elected by youth and disability organizations
54-seat Senate elected by indirect vote
National Assembly with 100 seats
Representatives per million people (based on 2010 population)
8 5 10 10 18
Judicial branch Court of Appeal, High Court, district courts and primary courts
Supreme Court, Court of Appeal and High Court
Court of Appeal and High Court
Supreme Court, High Courts of the Republic, provincial courts and district courts
Supreme Court, Constitutional Court and High Court of Justice
Central Bank Governor
Benno Ndulu Njuguna Ndungu Emmanuel Tumusiime-Mutebile
Claver Gatete Gaspard Sindayigaya
Source: CIA World Factbook 2011; www.quotaproject.org for information on women in parliament

The State of East Africa 2012 79
CORRUPTION PERCEPTION INDEx
Source: Transparency International
Figure 7.1: Perceptions of Corruption in East Africa (2005-2010)
Transparency International’s Corruption Perception Index (CPI) summarizes the perception of corruption as seen by business people and country analysts. The index ranges from 1 (corrupt) to 10 (clean). Between 2005 and 2008 Kenya was perceived to have the highest level of corrup-tion in East Africa, until that perception was moved to Burundi with a score of 1.9. After a dip between 2005 and 2006, Rwanda’s CPI score improved steadily to emerge significantly ahead of its East African neighbours as the least corrupt country in the region by 2010. Tanzania peaked in 2007 with a CPI of 3.2, its highest over the past five years, but has weakened since then due to a number of recent high-profile corruption scandals.
Corruption and Political Freedom
CORRUPT INSTITUTIONS
According to Transparency International, Table 7.2 shows the most corrupt institutions in the region and those most prone to bribery based on its bribery index.26 It is interesting that almost all are in law enforcement, revenue collection and the judiciary. Seven of the ten insti-tutions cited as the most corrupt were from Burundi and Uganda.
Table 7.2 – Top Ten Corrupt Institutions in the EAC (2011)
Rank Organization
1 Uganda police
2 Burundi police
3 Burundi customs/revenue authority
4 Kenya police
5 Uganda Revenue Authority
6 Tanzania police
7 Burundi Ministry of Education
8 Ugandan judiciary
9 Tanzania judiciary/courts
10 Uganda Ministry of Lands
Source: Transparency International East African Bribery Index (2011)

The State of East Africa 201280
Table 7.3 – Press Freedom Rankings (2005-2011)
Rank 2005 2011 Change Country status in 2010
Tanzania 51 48 Better Partly free
Kenya 61 54 Better Partly free
Uganda 44 54 Worse Partly free
Burundi 74 74 Unchanged Not free
Rwanda 84 84 Unchanged Not free
Source: Freedomhouse Media Freedom
PRESS FREEDOM
In 2010 Tanzania was ranked highest in the region with respect to freedom of the press, with a rating of 48 and a ‘partly free’ status. Tanzania has a reputation for a relatively independent press and has the highest number (43) of circulated newspapers in the region.
Uganda and Kenya follow behind Tanzania with a rating of 54 each. Kenya has improved since 2005 by moving from a status of ‘not free’ to ‘partly free’. Uganda’s rank dropped to 54 from 44, as Freedomhouse notes that ‘in 2010 the government passed several laws that fundamentally threaten free expression and media freedom through potentially restricting content and access to information including the ‘Regulation of Interception of Communications Act’. Burundi and Rwanda are the two countries ranked the lowest and were classified as ‘not free’ in 2011.

The State of East Africa 2012 81
Table 7.4 – Mo Ibrahim Index Rankings (2011)Country Rank Index
scoreSafety and rule of law
Political participation and
human rights
Sustainable economic
opportunity
Humandevelopment
Tanzania 13 58 60 60 58 54
Uganda 20 55 58 51 52 59
Kenya 23 53 48 53 50 60
Rwanda 25 52 49 39 57 62
Burundi 37 45 46 50 40 44Source: Mo Ibrahim Index (2011)27
The Mo Ibrahim Foundation produces an annual governance index that ranks African countries on their performance in good governance. The index rates countries across different social and economic indicators, with a focus on safety and rule of law, human development, sustain-able economic opportunity and political participation and human rights. Mauritius was ranked highest in Africa, with an index score of 82 out of a maximum 100 points. Somalia was ranked lowest with a score of 8.
Tanzania, ranked 13th out of 53 African countries, was the highest ranked in the EAC in 2011. Tanzania led the region in the safety and rule of law, participation and human rights, and sustainable economic opportunity scores. Uganda ranked 20th with a score of 55, putting it second after Tanzania in East Africa. Its highest individual score was in human development. Kenya came third in the region with a score of 53. Its weakest point was in safety and the rule of law. Rwanda was ranked 25th in Africa and fourth in East Africa. It had the highest regional score on human development, but the lowest one on political participation and human rights.
Burundi was ranked 37/53 with an index score of 45/100, the lowest ranking in the region. While its political participation and human rights performance was on par with Uganda, Burundi had a low score on the strength of institutions responsible for preserving the rule of law. It also had a low ranking in sustainable economic opportunity and human development, demonstrating the difficulties of post-conflict development.
Mo Ibrahim Index EAC Spotlight

The State of East Africa 201282
The region spent $1.2 billion on its military in 2009, up 14 per cent from the $1.04 billion spent in 2004. The largest share of this spending is taken up by Kenya and Uganda. In 2009 Uganda spent $315 million on its military and Kenya spent $580 million. Burundi and Rwanda accounted for the lowest levels of military expenditure, with $40 million and $75 million re-spectively. Data for 2010 were only available for Kenya, Uganda and Rwanda. They show Kenya’s military expenditure increasing by 2 per cent to $594 million, Rwanda’s up by 3 per cent to $77 million and Uganda’s falling 12 per cent to $276 million.
On a per capita measure, Kenya spent $14 in 2009 – over 50 per cent more than Uganda ($9) and Rwanda ($7), and almost three times more than Tanzania ($5) and Burundi ($5).
SIPRI provides an outline of the type of military hardware that was bought by these countries. Between 2007 and 2010 Kenya purchased 655 grenade launchers, 44,500 assault rifles and 550 machine guns from the Ukraine.28 Kenya also bought 6,964 M4A1 assault rifles from the United States.29 Uganda made some heavy purchases in 2010, buying three 820 mm mortars, 20 machines guns and ten grenade launchers from Bulgaria.30 That same year Uganda bought 60 machine guns from Slovakia and 798 assault rifles, 25 machine guns and 50 grenade launchers from the Ukraine.31
Table 7.5 – Per Capita Military Spending (2009)
Rank Population(million, 2010)
Military spending(US$ million, 2009)
Spending per person(US$, 2009)
Tanzania 45 217 5
Kenya 41 580 14
Uganda 34 315 9
Rwanda 10 75 7
Burundi 9 40 5
EAC 139 1,227 9
Source: SIPRI Statistical Yearbook (2010)
Military and Conflict
OVERALL ExPENDITURE
Source: SIPRI Statistical Yearbook (2010)
Figure 7.2: Military Spending in East Africa (2004–2010)

The State of East Africa 2012 83
Although Burundi’s military spending was the lowest in the region in dollar terms, it was the highest in terms of the proportion of its economy (4.0 per cent of GDP), although this is a significant reduction from the 7.3 per cent of GDP that it spent on its military in 2004. Burundi was followed by Kenya (2.0 per cent), Uganda (1.8 per cent), Rwanda (1.4 per cent) and finally Tanzania (1.1 per cent). Kenya’s growing spending is taking up a rising share of its GDP, from 1.6 per cent in 2004 to 2.0 per cent in 2010.
MILITARy ExPENDITURE AS PERCENTAgE OF gDP
Source: SIPRI Statistical Yearbook (2010)
Figure 7.3: Military Expenditure as Percentage of gDP (2003-2009)
The region hosted an estimated 733,080 refugees in 2010,32 a 55 per cent reduction from the 1.2 million refugees hosted in East African countries in 2004. With an estimated refugee popu-lation of over 400,000, Kenya hosted the majority (55 per cent) of these people. Kenya took over from Tanzania, which in 2004 hosted 51 per cent of the 1.2 million refugees. The majority of the refugees in Kenya are from Somalia.
Uganda hosted 135,960 refugees in 2010 (19 per cent of the total refugee population), while Rwanda hosted 29,410 (8 per cent). Burundi hosted the fewest with 29,410 (4 per cent). While most refugees in 2005 were from Burundi (449,900) and Sudan (282,300), by 2010 the majority were from Somalia (364,500) and the DRC (230,900).
REFUgEES HOSTED IN EAST AFRICA
Source: UNHCR Global Report (2004 and 2010)
Figure 7.4: Refugees Hosted in East Africa (2004–2010)

The State of East Africa 201284
In 2010 there were 582,800 internally dislaced persons (IDPs) in the region, a 73 per cent reduction from the 2.14 million in 2005, driven by the large reduction of IDPs in Uganda from 1.7 million (82 per cent of all IDPs) to 125,600 (22 per cent). Kenya’s 300,000 IDPs in 2010 accounted for 51 per cent of the region’s total. Burundi saw a tenfold increase in IDPs from 11,500 to 157,200 in five years, signalling intensifying internal conflict.
INTERNALLy DISPLACED PEOPLE IN EAST AFRICA
Source: UNHCR Global Report (2005 and 2010)
Figure 7.5: Internally Displaced People in East Africa (2005–2010)
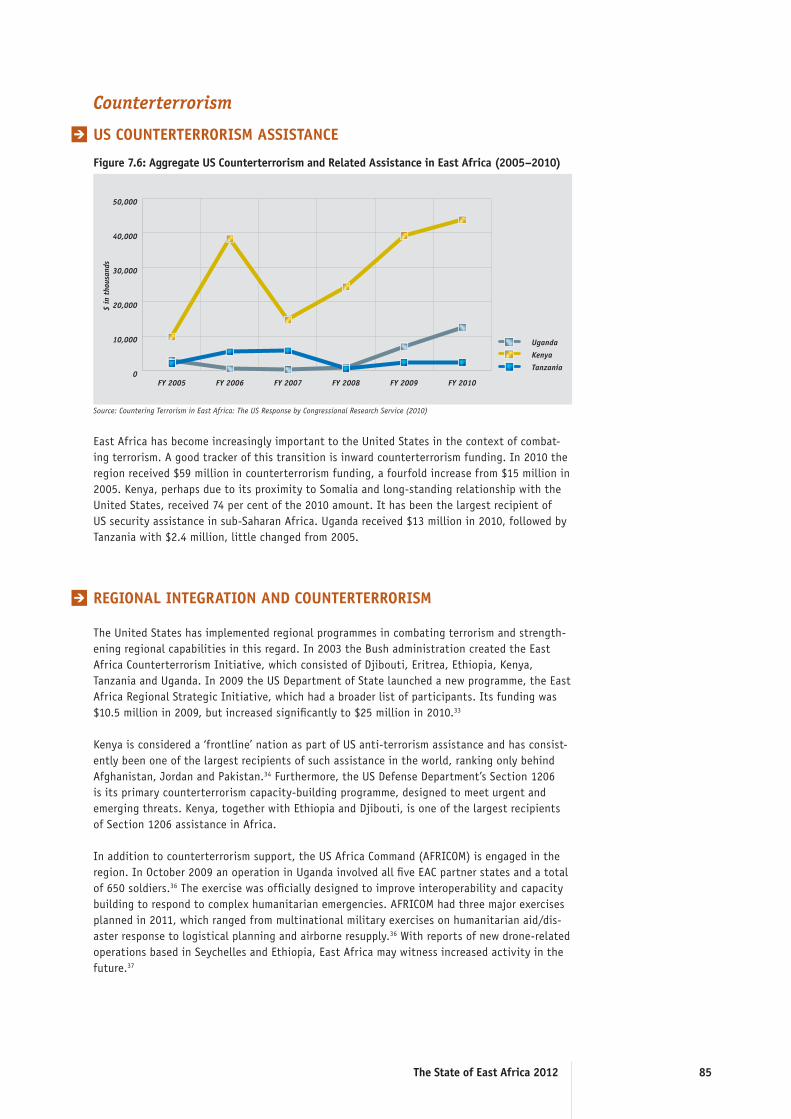
The State of East Africa 2012 85
East Africa has become increasingly important to the United States in the context of combat-ing terrorism. A good tracker of this transition is inward counterterrorism funding. In 2010 the region received $59 million in counterterrorism funding, a fourfold increase from $15 million in 2005. Kenya, perhaps due to its proximity to Somalia and long-standing relationship with the United States, received 74 per cent of the 2010 amount. It has been the largest recipient of US security assistance in sub-Saharan Africa. Uganda received $13 million in 2010, followed by Tanzania with $2.4 million, little changed from 2005.
The United States has implemented regional programmes in combating terrorism and strength-ening regional capabilities in this regard. In 2003 the Bush administration created the East Africa Counterterrorism Initiative, which consisted of Djibouti, Eritrea, Ethiopia, Kenya, Tanzania and Uganda. In 2009 the US Department of State launched a new programme, the East Africa Regional Strategic Initiative, which had a broader list of participants. Its funding was $10.5 million in 2009, but increased significantly to $25 million in 2010.33
Kenya is considered a ‘frontline’ nation as part of US anti-terrorism assistance and has consist-ently been one of the largest recipients of such assistance in the world, ranking only behind Afghanistan, Jordan and Pakistan.34 Furthermore, the US Defense Department’s Section 1206 is its primary counterterrorism capacity-building programme, designed to meet urgent and emerging threats. Kenya, together with Ethiopia and Djibouti, is one of the largest recipients of Section 1206 assistance in Africa.
In addition to counterterrorism support, the US Africa Command (AFRICOM) is engaged in the region. In October 2009 an operation in Uganda involved all five EAC partner states and a total of 650 soldiers.36 The exercise was officially designed to improve interoperability and capacity building to respond to complex humanitarian emergencies. AFRICOM had three major exercises planned in 2011, which ranged from multinational military exercises on humanitarian aid/dis-aster response to logistical planning and airborne resupply.36 With reports of new drone-related operations based in Seychelles and Ethiopia, East Africa may witness increased activity in the future.37
Counterterrorism
US COUNTERTERRORISM ASSISTANCE
REgIONAL INTEgRATION AND COUNTERTERRORISM
Source: Countering Terrorism in East Africa: The US Response by Congressional Research Service (2010)
Figure 7.6: Aggregate US Counterterrorism and Related Assistance in East Africa (2005–2010)

The State of East Africa 201286
‘During decades of violent conflict in Africa, we learnt a key lesson: while partnership with the international com-munity is important, Africans have to find lasting solutions to their own problems of peace and security and take development matters into our hands,’ President Paul Kagame said.
He was speaking at the launch of the East African Community Command Post Exercise code-named Ushirikiano Imara, hosted at the Rwanda Military Academy, Nyakinama, in Northern Province. The exercise is aimed at enhancing interop-erability and fostering cooperation between the EAC armed forces and other non-military agencies.
President Kagame said regional integration should go beyond economic integration to cooperation in the area of security, to safeguard the gains accruing from economic integration. East Africa is faced with the threat of piracy in the Indian Ocean and Al-Shabab in lawless Somalia. In addition, regional security is also at risk from the Democratic Forces for the Liberation of Rwanda, the Lord’s Resistance Army of Uganda and the Front Nationale Pour la Liberation in Burundi.
Rwanda is hosting both the command post exercise and the subsequent field training exercise that is scheduled for 2012.
EAC Secretary-General Richard Sezibera said military cooperation between the EAC member states was critical in consolidating the achievements of integration. The memorandum of understanding on defense cooperation among the EAC countries mandates the partner states to work together in joint military training, joint operations, technical assistance, exchange of information and military visits.
BOx 7.1 – “KAgAME URgES MORE jOINT MILITARy ExERCISES”
Source: Based on article in The East African, 6 November 2011

The State of East Africa 2012 87
Notes
1 Total fertility rate is an estimate of the average number of children a woman would have over the course of her entire life if current age-specific fertility rates remained constant during her reproductive years. 2 These are individuals who have been granted law-ful permanent residence in the United States, also known as ‘green card’ recipients. 3 According the UN Food and Agriculture Organiza-tion, arable land is defined as land under tempo-rary agricultural crops, temporary meadows for mowing or pasture, land under market and kitchen gardens and land temporarily fallow (less than five years). Permanent crops is land cultivated with long-term crops which do not have to be replanted for several years (cocoa or coffee) and land under trees and shrubs producing flowers, such as roses and jasmine. Pasture lands are covered with grass and other low plants suitable for grazing animals, especially cattle or sheep.4 International Food Policy Research Institute (2009).5 The Human Development Index ranges from 0 (least human development) to 1 (most human development).6 The total EAC number of people living under the poverty line was not computed due to the differing population baseline years. 7 According to the African Development Bank, the middle class is defined as individuals with annual incomes exceeding $3,900 in purchasing power parity terms. The middle class has three sub-categories: ‘floating’, ‘lower-middle class’ and ‘upper-middle class’. The ‘floating class’ has a daily per capita consumption of $2–4, just above the in-ternationally recognized consumption poverty line of $1.25 per day. For the purposes of this report the ‘floating class’ was not included as part of the middle class since it remains largely vulnerable to slipping back into poverty. The ‘lower-middle class’ has a per capita consumption level of $4–10 per day and the ‘upper-middle class’ has a daily per capita consumption of $10–20. The ‘rich’ consume more than $20 per day. 8 Modern methods consist of female sterilization, pill, injections, implants and male condoms.9 UNICEF and WHO 2010 World Health Statistics.10 There were only two DHS reports for Burundi, one in 1987 and one in 2010, so the comparisons for Burundi should be looked at differently. 11 Stunting (low height for age) is defined as having a height (or length) for age more than two standard deviations below the median WHO international reference. Underweight (low weight for age) is defined as having a weight more than two standard
deviations below the median weight for age.12 The Global Hunger Index is ranked on a score based on three equally weighted indicators: undernourishment, child underweight and child mortality. The index ranks countries on a 100-point scale, with 0 being good (no hunger) and 100 being the worst. Anything lower than 10 represents mod-erate hunger (below 5 is low hunger), and anything higher than 10 is seen as serious, with anything higher than 30 being extremely alarming. 13 International Food Policy Research Institute (2011). 14 East African Community Secretariat and Business Council (2009). 15 East African Community Secretariat (2011c). 16 Ibid.17 African Development Bank (2011c). 18 World Bank (2010a). 19 Nathan Associates (2009).20 The East African (2011b). 21 World Bank (2010b).22 Total renewable electricity includes hydroelectric and non-hydroelectric renewables, with the major-ity of these renewables being hydroelectric. 23 Gross debt consists of all liabilities that require payment or payments of interest and/or principal by the debtor to the creditor at a date or dates in the future.24 Rwanda Country Profile from Trading Economics (undated). 25 African Development Bank (2008b). 26 The East Africa Bribery Index is based on scores ranging from 1 to 100: the closer the index is to 100, the higher the bribery prevalence. 27 The index and scores are out of 100: the closer the numbers are to 100 the better the country fares with respect to good governance, and the further it is from 100 the less well the country is faring with respect to good governance. 28 Wezeman et al. (2011). 29 Ibid.30 Ibid.31 Ibid.32 This excludes asylum seekers and internally displaced people. 33 Ploch (2010). 34 Ibid.35 US Africa Command (2009). 36 US Africa Command (2011). 37 Barnes (2011).

The State of East Africa 201288
• African Development Bank (2006). Selected Statistics on African Countries 2006 (Tunis: Statistics Department Chief Economist Complex).
• African Development Bank (2007). Selected Statistics on African Countries 2007 (Tunis: Statistics Department Chief Economist Complex).
• African Development Bank (2008a). Selected Statistics on African Countries 2008 (Tunis: Statistics Department Chief Economist Complex).
• African Development Bank (2008b). Burundi 2008–2011 Country Strategy Paper. Country and Regional Department East Africa, www.afdb.org/fileadmin/uploads/afdb/Documents/Project-and-Operations/ADB-BD-WP-2008-163-EN-BURUNDI-2008-2011-COUNTRY-STRATEGY-PAPER.PDF.
• African Development Bank (2011a). African Statistical Yearbook 2011 (Tunis: AfDB, AU and ECA).
• African Development Bank (2011b). The Middle of the Pyramid: Dynamics of the Middle Class in Africa, www.afdb.org/fileadmin/uploads/afdb/Documents/Publications/The%20Middle%20of%20the%20Pyramid_The%20Middle%20of%20the%20Pyramid.pdf.
• African Development Bank (2011c). ‘AfDB, Others Commit USD165 Million to Railway Infra-structure in East Africa’, www.afdb.org/en/news-and-events/article/afdb-others-commit-usd165-million-to-railway-infrastructure-in-east-africa-8317/.
• African Development Bank Infrastructure Data Bank, www.infrastructureafrica.org/.• African Development Bank, World Bank and World Economic Forum (2011). The Africa Com-
petitiveness Report 2011 (Geneva: World Economic Forum). • Barnes, J.E. (2011). ‘U.S. Expands Drone Flights to Take Aim at East Africa’, Wall Street Jour-
nal, http://online.wsj.com/article/SB10001424053111904106704576583012923076634.html.• Department of Homeland Security (2005). 2005 Yearbook of Immigration Statistics (Wash-
ington, DC: Office of Immigration Statistics).• Department of Homeland Security (2010). 2010 Yearbook of Immigration Statistics (Washing-
ton, DC: Office of Immigration Statistics).• East African Community Secretariat (2011a). East African Community Facts and Figures 2010
(Arusha: EAC). • East African Community Secretariat (2011b). East African Community Facts and Figures 2011
(Arusha: EAC). • East African Community Secretariat (2011c). Status of Elimination of Non-Tariff Barriers
(NTBs), EAC Quarterly Publication (Arusha: EAC Secretariat).• East African Community Secretariat and Business Council (2009). Monitoring Mechanism for
Elimination of Non-Tariff Barriers in EAC (Arusha: GTZ).• Government of Burundi (1988). Burundi Demographic and Health Survey 1987 (Bujumbura:
Burundi National Bureau of Statistics).• Government of Burundi (2011). Burundi Preliminary Demographic and Health Survey 2010
(Bujumbura: Burundi National Bureau of Statistics). • Government of Kenya (2004). Kenya Demographic and Health Survey 2003 (Nairobi: Kenya
National Bureau of Statistics). • Government of Kenya (2010a). CCK Annual Report 2009/10 (Nairobi: Communications Commis-
sion of Kenya). • Government of Kenya (2010b). Kenya Demographic and Health Survey 2008/09 (Nairobi:
Kenya National Bureau of Statistics). • Government of Kenya (2011a). CPI and Inflation Rates for December 2011 (Nairobi: Kenya
National Bureau of Statistics). • Government of Kenya (2011b). Quarterly Sector Statistics Report 4th Quarter 2010/2011
(Nairobi: Communications Commission of Kenya). • Government of Rwanda (2006). Rwanda Demographic and Health Survey 2005 (Kigali: Rwanda
References

The State of East Africa 2012 89
National Bureau of Statistics). • Government of Rwanda (2009). Development in Employment Sector (Kigali: Rwanda National
Bureau of Statistics), http://statistics.gov.rw/images/PDF/employment.pdf.• Government of Rwanda (2011a). Consumer Price Index December 2011 (Kigali: National
Institute of Statistics of Rwanda). • Government of Rwanda (2011b). Rwanda Preliminary Demographic and Health Survey 2010.
(Kigali: Rwanda National Bureau of Statistics).• Government of Tanzania (2005). Tanzania Demographic and Health Survey 2004/05 (Dar es
Salaam: Tanzania National Bureau of Statistics). • Government of Tanzania (2010). Report on Internet and data Services in Tanzania: A Supply-
Side Survey (Dar es Salaam: Tanzania Communications Regulatory Authority). • Government of Tanzania (2011a). National Consumer Price Index (NCPI) for December 2011
(Dar es Salaam: Tanzania National Bureau of Statistics).• Government of Tanzania (2011b). Tanzania Demographic and Health Survey 2010 (Dar es
Salaam: Tanzania National Bureau of Statistics). • Government of Tanzania (2011c). Unemployment Estimates for the Year 2011 (Dar es Salaam:
Tanzania National Bureau of Statistics), www.nbs.go.tz/index.php?option=com_content&view=article&id=186:unemployment-estimates-for-the-year-2011&catid=51:statistics&Itemid=12.
• Government of Uganda (2001). Uganda Demographic and Health Survey 2000/01 (Kampala: Uganda National Bureau of Statistics).
• Government of Uganda (2007). Uganda Demographic and Health Survey 2006 (Kampala: Uganda National Bureau of Statistics).
• Government of Uganda (2010). Post and Telecommunications Market Review 2009/10 (Kam-pala: Uganda Communications Commission).
• Government of Uganda (2011). Consumer Price Index December 2011 (Kampala: Uganda National Bureau of Statistics).
• International Food Policy Research Institute (2009). ‘Measuring Irrigation Performance in Af-rica’, Discussion Paper 00894, www.ifpri.org/publication/measuring-irrigation-performance-africa.
• International Food Policy Research Institute (2011). The 2011 Global Hunger Index (Washington, DC: IFPRI).
• Mo Ibrahim Foundation (2011). African Agriculture: From Meeting Needs to Creating Wealth (Tunis: Ibrahim Forum).
• Nathan Associates (2009). Corridor Diagnostic Study on the Northern and Central Corridors of East Africa (Arlington, VA: Nathan Associates).
• Page, M., Viviez, L. and Molina, M. (2011). African Mobile Observatory 2011: Driving Eco-nomic and Social Development through Mobile Services (London: GSM Association).
• Ploch, L. (2010). Countering Terrorism in East Africa: The U.S. Response (Washington, DC: Congressional Research Service).
• Rwanda Country Profile from Trading Economics (undated), www.tradingeconomics.com/rwanda/unemployment-rate.
• SIPRI (2011). SIPRI Yearbook 2011 (Solna: Stockholm International Peace Research Insti-tute).
• Tanzania Ports Authority (2007). Annual Report and Accounts 2007 (Dar es Salaam: Tanzania Ports Authority).
• Tanzania Ports Authority (2009). Annual Report and Accounts 2009 (Dar es Salaam: Tanzania Ports Authority).
• The East African (2011a). ‘Nightmare of Moving Cargo From Mombasa’, The East Afri-can, www.theeastafrican.co.ke/business/Nightmare+of+moving+cargo+from+Momba
The State of East Africa 201290
sa+/-/2560/1246550/-/vnef5kz/-/index.html.• The East African (2011b). ‘Tanzania to Expand Dar, Tanga Ports’, The East African, www.
theeastafrican.co.ke/business/Tanzania+to+expand+Dar++Tanga+ports/-/2560/1272244/-/uqrstqz/-/index.html.
• Transparency International (2011). The East African Bribery Index 2011 (Nairobi: Transpar-ency International Kenya).
• UN Conference on Trade and Development (2004). World Investment Report 2004: The Shift Towards Services (Geneva: UNCTAD).
• UN Conference on Trade and Development (2006). World Investment Report 2006: FDI from Development and Transition Economies: Implications for Development (Geneva: UNCTAD).
• UN Conference on Trade and Development (2010). World Investment Report 2010: Investing in a Low Carbon Economy (Geneva: UNCTAD).
• UN Development Programme (2006). Human Development Report 2006: Beyond Scarcity – Power, Poverty and the Global Water Crisis (New York: UNDP).
• UN Development Programme (2011). Human Development Report 2011: Sustainability and Equity – A Better Future for All (New York: UNDP).
• UN Department of Economic and Social Affairs (2009). World Urbanization Prospects, The 2009 Revision (New York: Population Division, Population Estimates and Projections Sec-tion), http://esa.un.org/unpd/wup/index.htm.
• UN Department of Economic and Social Affairs (2010). World Population Prospects, The 2010 Revision. (New York: Population Division, Population Estimates and Projections Section), http://esa.un.org/wpp/unpp/p2k0data.asp
• UN Education, Scientific and Cultural Organization (2005). EFA Global Monitoring Report 2005: The Quality Imperative (Paris: UNESCO).
• UN Education, Scientific and Cultural Organization (2011). EFA Global Monitoring Report 2011: The Hidden Crisis: Armed Conflict and Education (Paris: UNESCO).
• UN High Commission for Refugees (2004). UNHCR Global Report 2004 (Geneva/New York: UNHCR), www.unhcr.org/4a0c13d76.html.
• UN High Commission for Refugees (2005). UNHCR Global Report 2005 (Geneva/New York: UNHCR), www.unhcr.org/4a0c04f96.html.
• UN High Commission for Refugees (2011). UNHCR Global Report 2010 (Geneva/New York: UNHCR), www.unhcr.org/gr10/index.html.
• UN Population Fund (2011). The State of World Population 2011 (New York: UNFPA). • US Africa Command (AFRICOM) (2009). Overview of Natural Fire 10 Humanitarian and Disaster
Relief Exercise, www.africom.mil/fetchBinary.asp?pdfID=20100503151015.• US Africa Command (AFRICOM) (2011). US Africa Command 2011 Exercises Fact Sheet, www.
africom.mil/fetchBinary.asp?pdfID=20110713140246.• Wezeman, P.D., Wezeman, S.T. and Beraud-Sureau, L. (2011). ‘Arms Flows to Sub-Saharan
Africa’, SIPRI Policy Paper No. 30 (Solna: Stockholm International Peace Research Institute).• World Bank (2010a). Tanzania’s Infrastructure: A Continental Perspective (Washington, DC:
World Bank). • World Bank (2010b). Kenya Economic Update: Running on One Engine. Kenya’s Uneven Eco-
nomic Performance with a Special Focus on the Port of Mombasa (Washington, DC: Poverty Reduction and Economic Management Unit, Africa Region).
• World Bank Development Indicators via Meta Data. • World Health Organization (2009). Global Status Report on Road Safety: Time for Action
(Geneva: WHO).

Regional Office for Eastern AfricaP O Box 2404 – 00100 Nairobi KenyaTel (+254 020) 2737991, 2737992Fax (+254 020) 2737992Email [email protected] www.sidint.netTwitter @SIDEastAfrica
9 789966 029102
ISBN 978-9966-029-10-2
Photo: Flickr/whl.travel