the state of everglades restorationfcelter.fiu.edu/.../sklar_cerp_update-2016_fce_lter_asm.pdf ·...
TRANSCRIPT

The State of
Everglades Restoration
Fred H. Sklar
14 March 2016
Deering Estate
FCE-LTER
All Scientist Meeting

CERP Project
Outline
1. Reservoirs, STAs & FEBs
2. Broward WPA’s
3. DPM
4. MFL & Seagrass
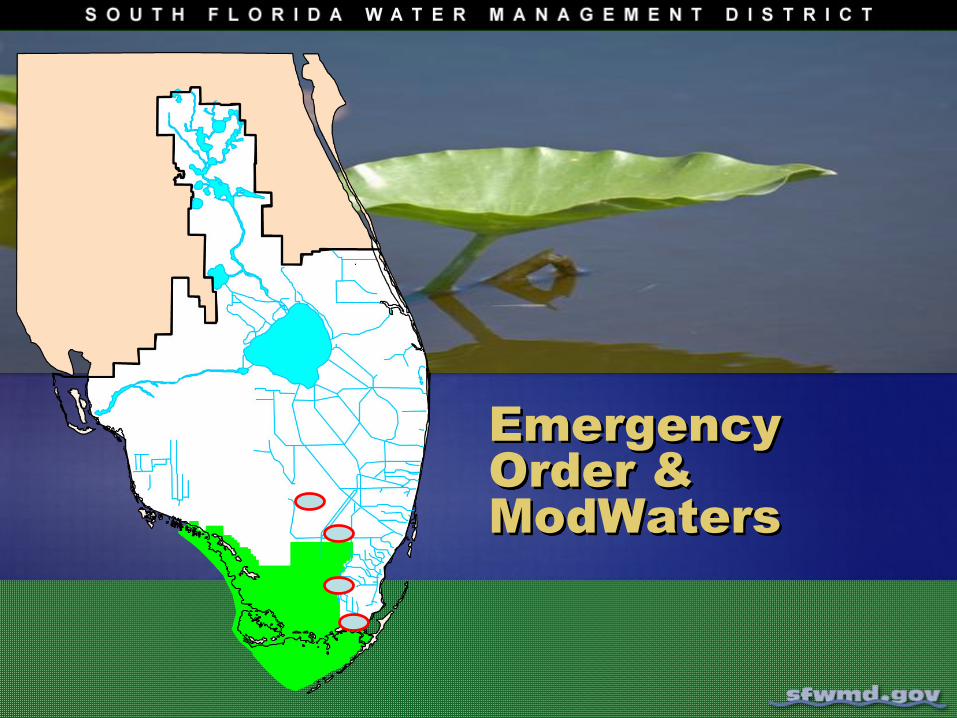
5. Emergency Order &
ModWaters
Restoration Update

Northern Estuaries
C-44
C-43

C-44 Reservoir/STA
Reduce C-44 Basin runoff peaks to the St. Lucie Estuary
Reduce nutrient loads from C-44 Basin runoff to the St. Lucie Estuary
4
Beth Kacvinsky - Lead Project Manager
Office of Everglades Policy and Coordination
3,400 acre reservoir water depth of 15 feet
- 50,600 acre-feet of storage
6,300 acre STA with emergent vegetation
1,100 cubic feet per second (cfs) capacity
- Pump station located four miles north of the C-44 Canal
Project currently under construction
- Both SFWMD and USACE are actively constructing components

C-44 RSTA Construction Status
Currently Under Construction by SFWMD
• Stormwater Treatment Area (Blue Goose Construction, Inc.)
- $100,792,387
- October 2014 - August 2017
5

C-44 RSTA Construction Status
Currently Under Construction by
SFWMD
• Reservoir Pump Station (Harry Pepper & Associates, Inc.)
- $40,289,146
- Apr. 2015 - Sept. 2018
6

Pump Station Construction
7

C-43 Reservoir
• 170,000 acre-feet of
storage
• Reduces harmful
freshwater discharges to
the Caloosahatchee
Estuary
• Estimated Cost: $619 M
• Status: Start soon; End
20188
Peter Doering, Ph.D.
Section Administrator
Coastal Ecosystems, Water Resources Division
South Florida Water Management District

Restoration
Strategies
L-8
A-1 FEB
STA-1W
Expansion

State of Florida Restoration Strategies
Six water treatment and storage facilities to improve water quality
More Clean Water available to WCAs
A-1 FEB Complete 2015
L-8 FEB Complete 2016
STA 1W Expand 2018

11
• It is a unique geological formation.
• Unique engineering
• It stores 45,000 acre-ft of water
• Three FEB’s will be built for a total
of 105,000 acre-ft.
L-8 FEB

Water Preserve
Areas

Broward Water Preserve Areas Components
and Approximate Construction Sequence
1. C-11 Northern Mitigation Area (2016-2018)
2. C-11 Impoundment (2018-2020)
3. WCA 3A/3B Seepage Management Area (2019-?)
4. C-9 Impoundment (2020-?)
Estimated Cost: $896 million

Decomp
Physical
ModelDPM

WCA-3B
WCA-3A
DPM
Flow-way

Benefits of Sustained Discharges – Slough
Velocities Increase
11/1/14 to 2/1/15
10/1/14 11/1/14 12/1/14 1/1/15 2/1/15
dis
ch
arge
(cfs)
0
50
100
150
200
250
300
2 cm
s-1
S152
discharg
e (cfs)
11/1/14 to 2/1/15
10/1/14 11/1/14 12/1/14 1/1/15 2/1/15
dis
cha
rge (cfs)
0
50
100
150
200
250
300
Data from Jud Harvey, Jay Choi and Mark Dickman, USGS
RS1 Slough
Velocity


KEY FINDINGS (DPM)
Distance East (m)
0 5 10 15 20
Flo
c H
eig
ht (c
m)
0
5
10
15
20
25
30
35
2 weeks6 weeks10 weeks
Data from Saunders, Newman and Manna)
The amount of slough
floc was decreased
under sustained flow
Floc was more erodible after
sustained high flow
(red=post-flow; black=pre-flow)

Stopping flow appeared to raise TP concentrations
Data from Newman, Cline, Tate-Boldt and Hansen
Date
01/26 01/27 01/28 01/29 01/30 01/31 02/01 02/02
TP
g
/LT
urb
idit
y (
NT
U)
2
4
6
8
10
12
14
16
Wate
r d
ep
th (
m)
0.50
0.55
0.60
0.65
0.70
0.75
Velo
cit
y (
cm
/s)
0
2
4
6
8
10TPDepth
Flow
Turbidity

Large Fish Increase in Backfilled Areas
Canal
edge
Partial & Complete Fill
areas attained similar
CPUE to canal edges
Backfill treatments have
created more high-quality
fish habitat by increasing
vegetated areas similar to
canal edges
Data from J.Trexler (FIU)
2010 2011 2012 2013 2014 2015 2016
CPUE
(5-min
transect)
0
10
20
30
40
Canal
center
2013 2014 2015 2016
CPUE
(5-min
transect)
0
5
10
15
20
25

MFL & Seagrass
Die-off
TR
Die-off

Salinity gauge
Creek flow gauge
TR
2012-2015 Conditions - Florida Bay
Taylor River Salinity & MFL Flow
>30 psu MFL rule threshold

Salinity gauge
Creek flow gauge
TR
2012-2015 Conditions - Florida Bay
Taylor River Salinity & MFL Flow
105,000 acre-feet MFL rule threshold
Lowest value ever recorded since the 5 creek
flow gauges were installed in 1996.
August 2015 – 77,602 acre-feet
Average

Florida Bay Salinity Map
Late July 2015
Difference from
2006 – 2014 Average
(Jun – Aug)
> 50 psu
Salinity highs at ENP platforms:
72 psu (Garfield Bight, 7/21)
66 psu (Buoy Key, 7/15)
57 psu (Terrapin Bay, 7/12)
57 psu (Johnson Key, 7/12)
54 psu (Whipray Basin, 7/28)
24
Johnson
Buoy
Whipray
Garfield

25Not present in surface waters
Central Florida Bay
“Yellow Fog”
Areas of yellow cloudy water withinSAV beds with very low dissolved oxygen and high sulfur
Low sport fish numbers (cannot be wholly attributed to recent hypersalinity)
Standing
Dead
Seagrass
Live Seagrass
Seagrass bed with
cloudy yellow color

BlackwaterSound
Calusa Key Basin
Eagle Key Basin
Twin Key BasinRabbit Key Basin
Johnson Key Basin
Crane Key Basin
Whipray Basin
Rankin Lake
Madeira Bay
TURTLEGRASS DIE-OFF LOCATIONS1987-1990 vs. 2015 EVENT
1987
From: P. Hall 2015, FWRI
2015
Emergency
Order &
ModWaters

2015 WET SEASON:• Driest May-July since 2004
• Ended below average
2014 WET SEASON:• May 26th – Oct 4th
• Near average (108%)
2014-15 DRY SEASON: • May was 51% below
average
• Dry Season 86% of
average
2015-16 DRY SEASON: • Nov 2015-Jan 2016 wettest
since 1932
• Jan 2016 wettest since 1932
• Dry Season projected to be
well above average
Ma
r 2
01
6:
No
re
co
rde
d r
ain
fall
as
of
03
/08
/201
6

29

Ground: 9.08’ NGVD29
2’
Gauge 63, WCA-3A,
2.5’
2.5’
WCA-3A Tree Island Inundations as
of 3/6/16
Ground:8.49’ NGVD29 Ground: 7.3’ NGVD29
Gauge 64, WCA-3A, Gauge 65, WCA-3A,
96 days
32
days
86 days

31
Flow Baby, Flow!
• WCA-3A stages have been
extremely high. District/USACE
Temporary Emergency Deviation
to lower stages in WCA-3A
• Raise L-29 stage limit from 7.5 to 8.5 feet
• Allow higher flows through S-333 into L-29
• Increase flows to NESRS
• Use S-334 to moderate L-29
• Increased use of S-26 and S-25B forward
pumps
• Send WCA-3A releases through the L-30
canal (S-337, S-335)
• Use the C-4 Detention Facility to store
water
• Temporary pumps at S-355A&B and S-357
• Future use of S-356 once stages at 8.5
square mile area stabilize
S335S336
S25BS12s S333 S334
NESRSG211
S356
L-29 Constraint
7.5 to 8.5 ft
NGVD
S338S335A&B
S-333 ~ 1,300 cfs

The State of
Everglades Restoration
Whew!
FCE-LTER
All Scientist Meeting