the testing dashboard: becoming an information provider · © 2010, rice consulting services, inc....
TRANSCRIPT
© 2010, Rice Consulting Services, Inc. 1
The Testing Dashboard – Becoming an Information Provider
1
The Testing Dashboard: Becoming an Information Provider
Randall W. Rice, CTAL, CSTE, CSQARice Consulting Services, Inc.
www.riceconsulting.com
© 2010, Rice Consulting Services, Inc.
2
What This Session is AboutLast year at StarEast, I gave a keynote presentation about Software Testing Dashboards and what it means to be an information provider.
It got a lot of good feedbackHowever, many people couldn’t make it last yearAnd…I’ve had an opportunity to try some new things since then.
This session is a deeper examination of how to apply dashboards in software testing.
© 2010, Rice Consulting Services, Inc. 2
The Testing Dashboard – Becoming an Information Provider
3
Since Last Year
I spent several months on a project primarily building a software testing dashboard.I have learned some interesting things, including:
Resources for free examplesTools to help build dashboardsThe human issues
4
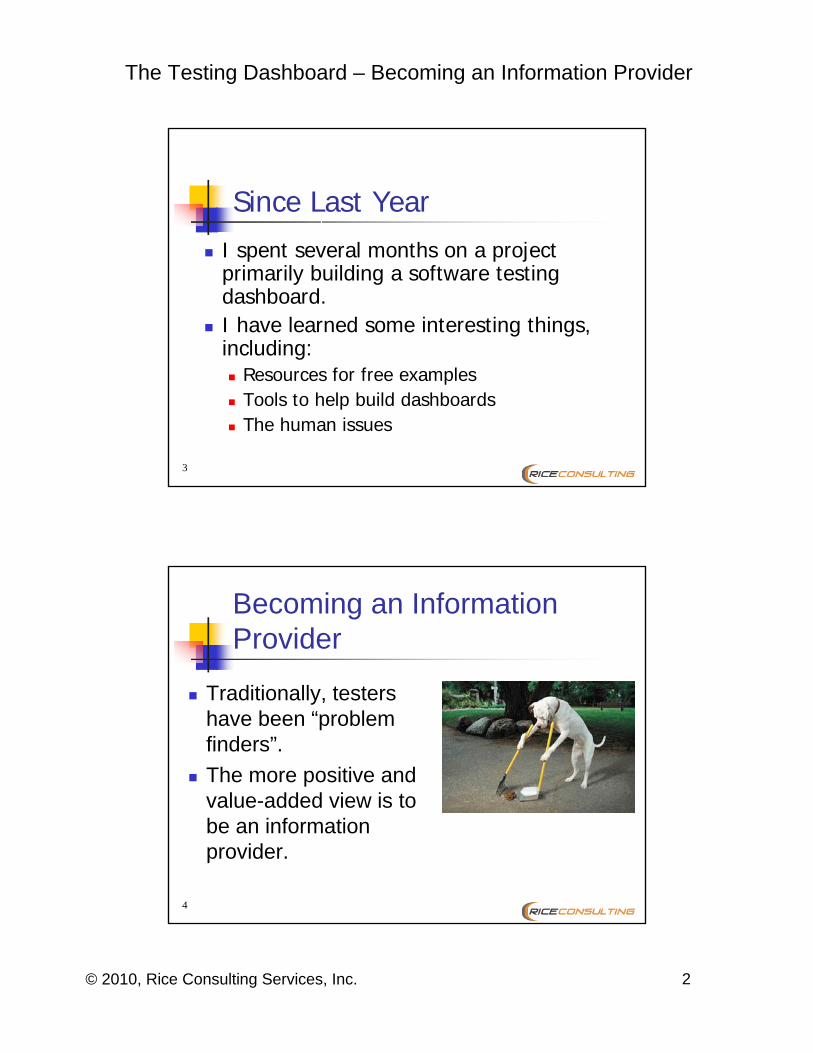
Becoming an Information Provider
Traditionally, testers have been “problem finders”.The more positive and value-added view is to be an information provider.
© 2010, Rice Consulting Services, Inc. 3
The Testing Dashboard – Becoming an Information Provider
5
What’s In This For You?An affordable and easy way to:
Build your credibilityPromote a positive view of testingHelp guide your testing projectsBe helpful to project managementAdd value to projectsStart improving processes and methodsBe seen as more than a commodity
6
The Main Objective of Testing Dashboards
To provide simple, meaningful and reliable information in one place to help guide the testing effort and convey that information to our clients.
© 2010, Rice Consulting Services, Inc. 4
The Testing Dashboard – Becoming an Information Provider
7
Where Are You?
a) We have a great set of dashboards that help us make decisions
b) We have one or two dashboards that help us make decisions
c) We have one dashboard that helps us make decisions sometimes
d) We would like to have a dashboard but don't know where to start
e) What's a dashboard?
8
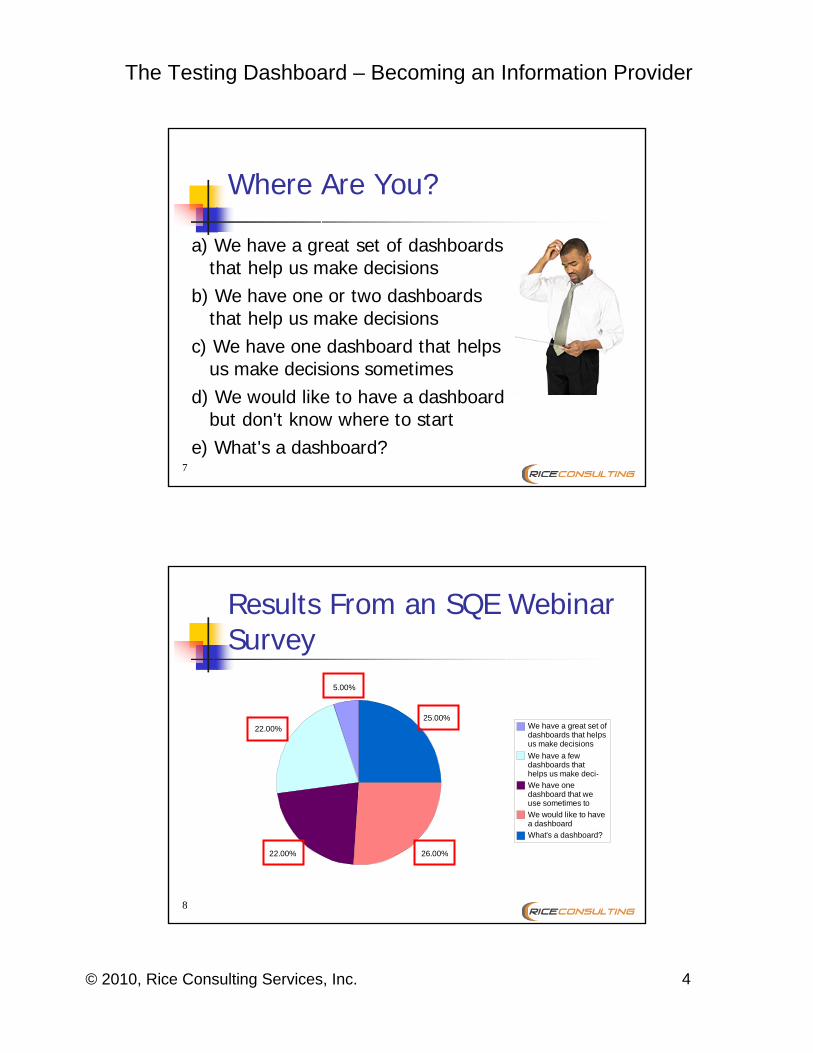
Results From an SQE WebinarSurvey
5.00%
22.00%
22.00% 26.00%
25.00%We have a great set of dashboards that helps us make decisionsWe have a few dashboards that helps us make deci-We have one dashboard that we use sometimes to We would like to have a dashboardWhat's a dashboard?
© 2010, Rice Consulting Services, Inc. 5
The Testing Dashboard – Becoming an Information Provider
9
A Testing Project is Somewhat Like Driving a Car
You need to know your:DestinationCurrent locationOrientation (Direction)Trip progressSpeedResource levels (gas, oil, etc.)Engine operation (temp, charge, etc.)
10
The Goal
Arrive at the desired destination safelyStay on the roadMake good progressDon’t get lostDon’t run out of fuelOnly one driver at a time
© 2010, Rice Consulting Services, Inc. 6
The Testing Dashboard – Becoming an Information Provider
11
Key ComponentsAn effective testing strategy
Defines the test objectives, scope and approach early in the project.
A workable test planDefines scope, resources, schedules, risks, contingencies, etc.
A dashboardMonitors defect levels, test progress, resource levels.
12
Information Dashboards are Used in…
Software ProjectsFinanceSalesGovernmentMany other applications
© 2010, Rice Consulting Services, Inc. 7
The Testing Dashboard – Becoming an Information Provider
13
The Testing DashboardDashboards are not new
They have been a common topic in articles and at conferences for several years.
At the same time, testers often struggle with how to convey accurate and timely information to management.So…let’s explore dashboards and look at some examples.Then, we’ll look at the issues behind test measurement and reporting.
14
Example: Your Car’s Dashboard
Car dashboards tell you current:
Trip progress (speedometer and odometer)Resources (fuel)Car status (temp, oil pressure, charging, engine performance)Warnings (seat belt, open doors)
© 2010, Rice Consulting Services, Inc. 8
The Testing Dashboard – Becoming an Information Provider
15
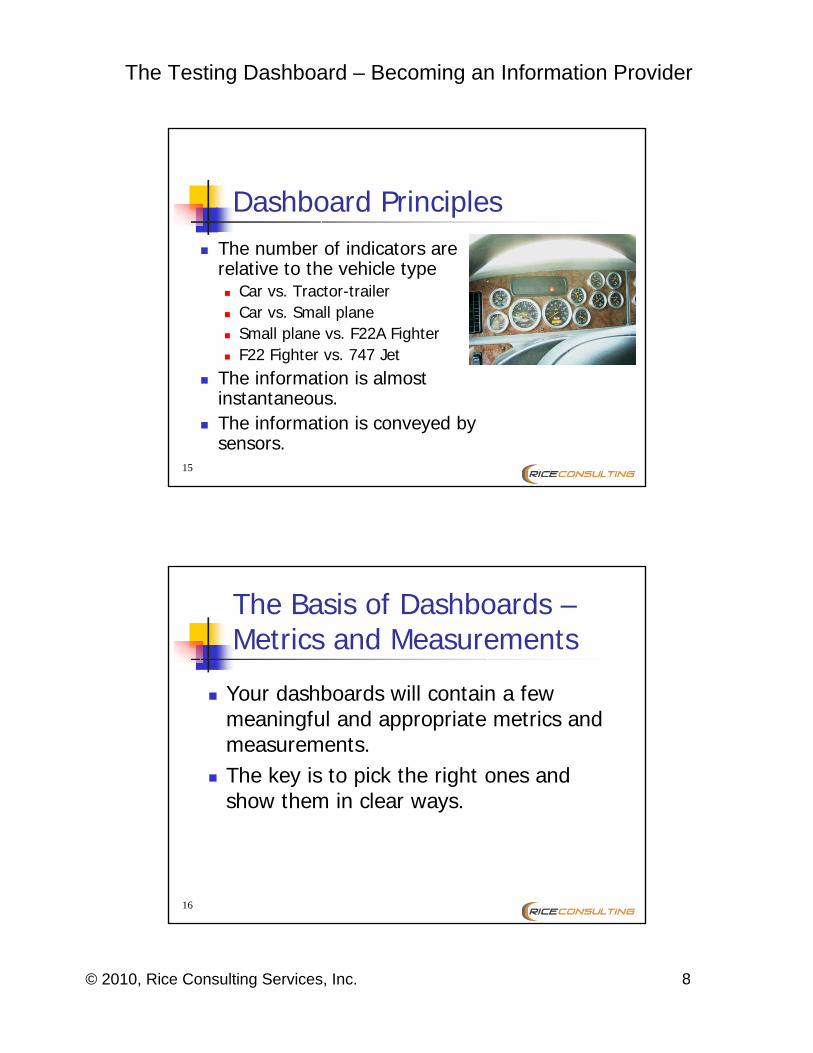
Dashboard PrinciplesThe number of indicators are relative to the vehicle type
Car vs. Tractor-trailerCar vs. Small planeSmall plane vs. F22A FighterF22 Fighter vs. 747 Jet
The information is almost instantaneous.The information is conveyed by sensors.
16
The Basis of Dashboards –Metrics and Measurements
Your dashboards will contain a few meaningful and appropriate metrics and measurements.The key is to pick the right ones and show them in clear ways.
© 2010, Rice Consulting Services, Inc. 9
The Testing Dashboard – Becoming an Information Provider
17
What Makes a Good Metric?
SimpleCan be easily measured and understood
Can be automatedSo we don’t have to take readings manuallyAlso, people don’t get the chance to manipulate the numbers
MeaningfulWe can gain useful information to make decisions
18
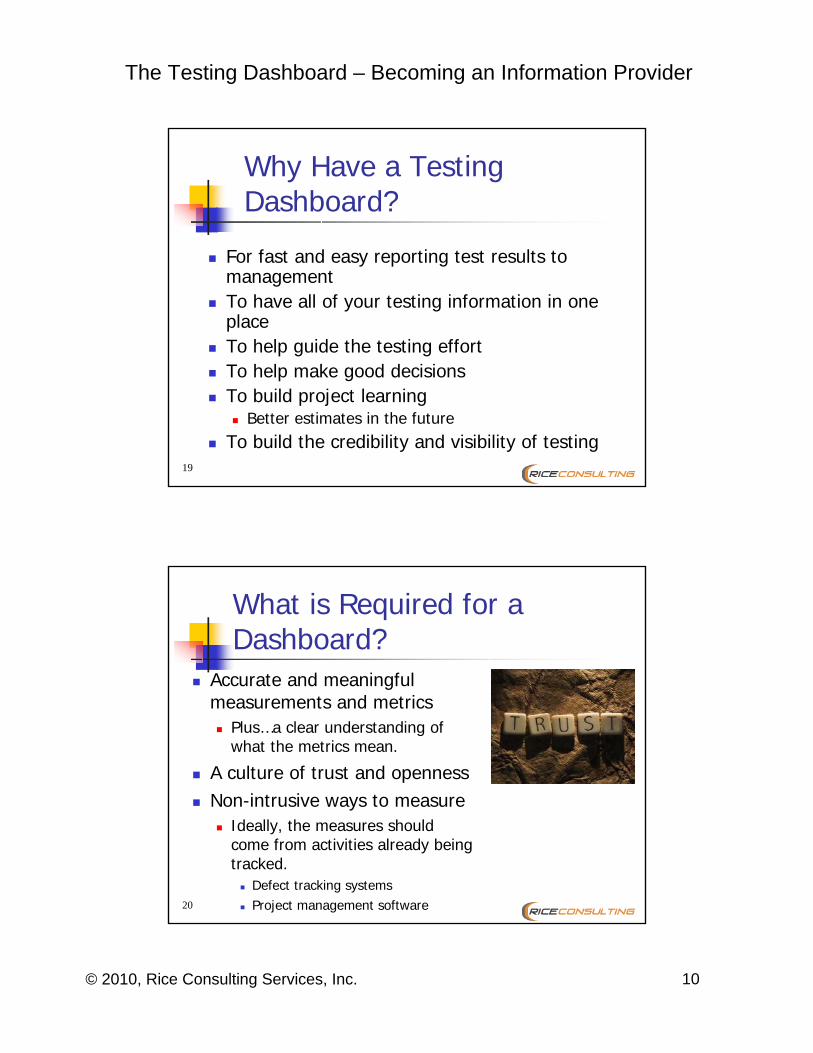
What is a Testing Dashboard?
A testing dashboard, just like a car’s dashboard, is a set of indicators that show the current status of testing.Dashboards can be seen from various perspectives:
ProjectTesting statusOngoing system maintenance
© 2010, Rice Consulting Services, Inc. 10
The Testing Dashboard – Becoming an Information Provider
19
Why Have a Testing Dashboard?
For fast and easy reporting test results to managementTo have all of your testing information in one placeTo help guide the testing effortTo help make good decisionsTo build project learning
Better estimates in the futureTo build the credibility and visibility of testing
20
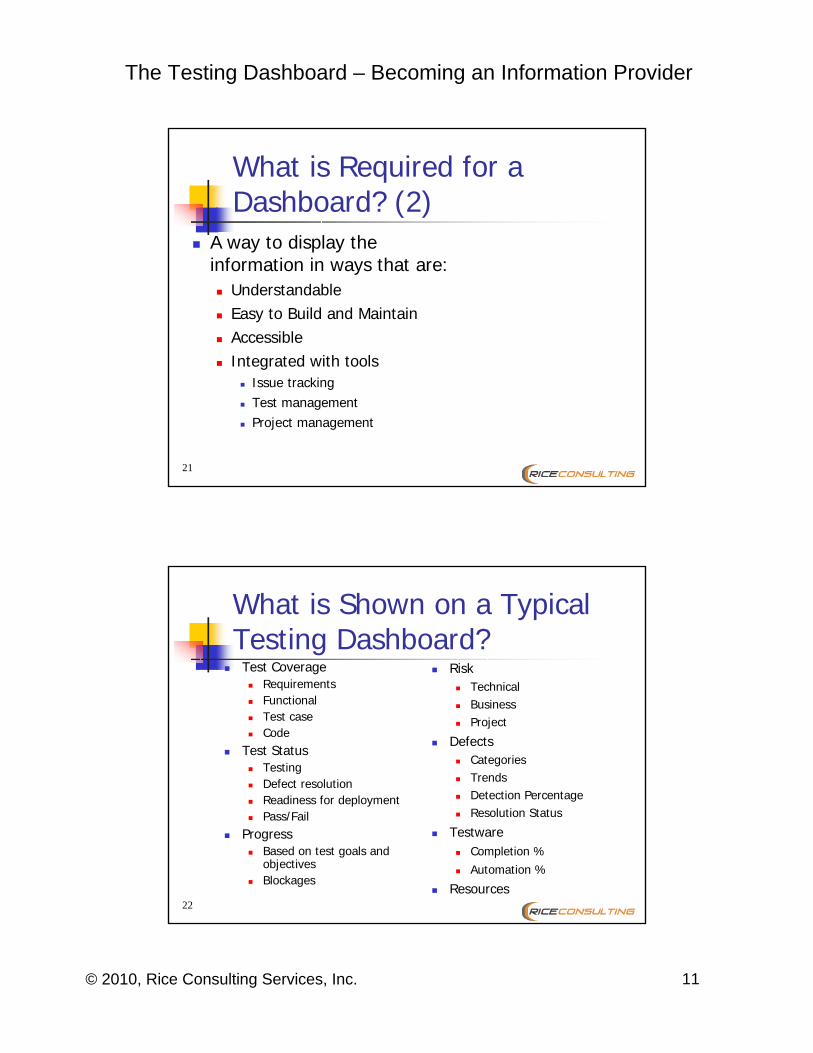
What is Required for a Dashboard?
Accurate and meaningful measurements and metrics
Plus…a clear understanding of what the metrics mean.
A culture of trust and opennessNon-intrusive ways to measure
Ideally, the measures should come from activities already being tracked.
Defect tracking systemsProject management software
© 2010, Rice Consulting Services, Inc. 11
The Testing Dashboard – Becoming an Information Provider
21
What is Required for a Dashboard? (2)
A way to display the information in ways that are:
UnderstandableEasy to Build and MaintainAccessibleIntegrated with tools
Issue trackingTest managementProject management
22
What is Shown on a Typical Testing Dashboard?
Test CoverageRequirementsFunctionalTest caseCode
Test StatusTestingDefect resolutionReadiness for deploymentPass/Fail
ProgressBased on test goals and objectivesBlockages
RiskTechnicalBusinessProject
DefectsCategoriesTrendsDetection PercentageResolution Status
TestwareCompletion %Automation %
Resources
© 2010, Rice Consulting Services, Inc. 12
The Testing Dashboard – Becoming an Information Provider
23
What Should You Show?Ask your customers!
What information do they value?How do they need it shown?When do they need it?How timely must it be?
However, just like in obtaining user requirements, people often don’t know what they want or need until they actually see it.
Start with a prototype
24
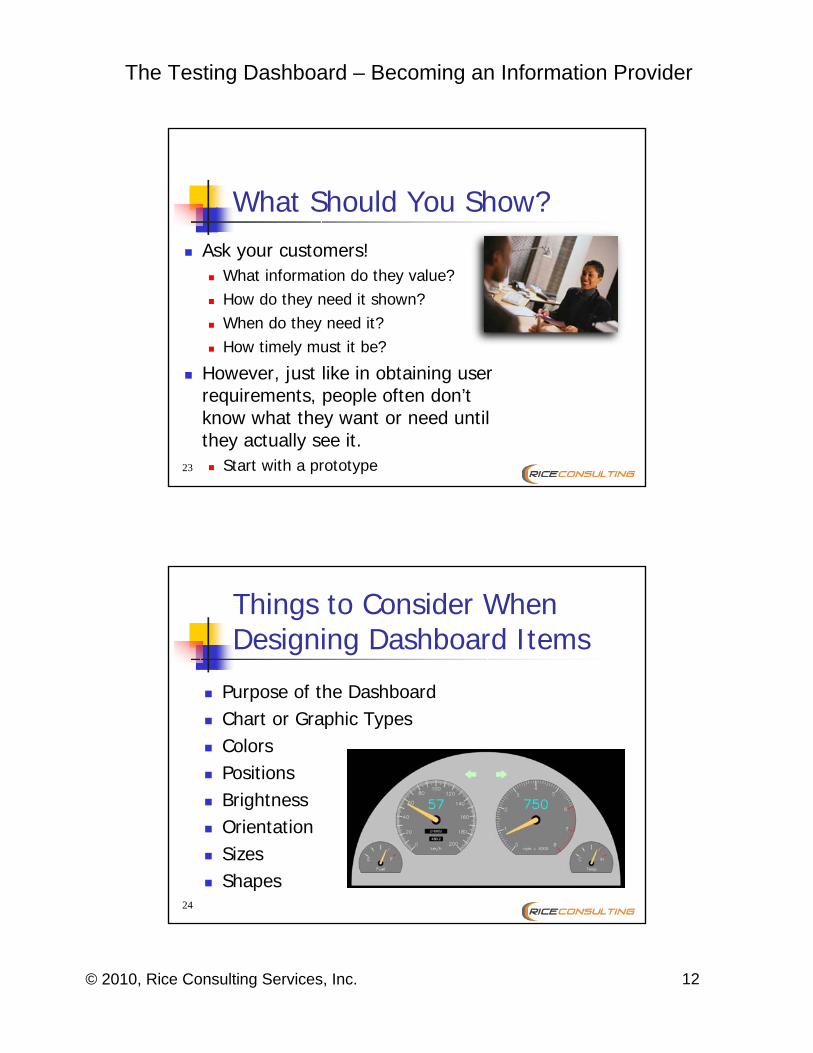
Things to Consider When Designing Dashboard Items
Purpose of the DashboardChart or Graphic TypesColorsPositionsBrightnessOrientationSizesShapes
© 2010, Rice Consulting Services, Inc. 13
The Testing Dashboard – Becoming an Information Provider
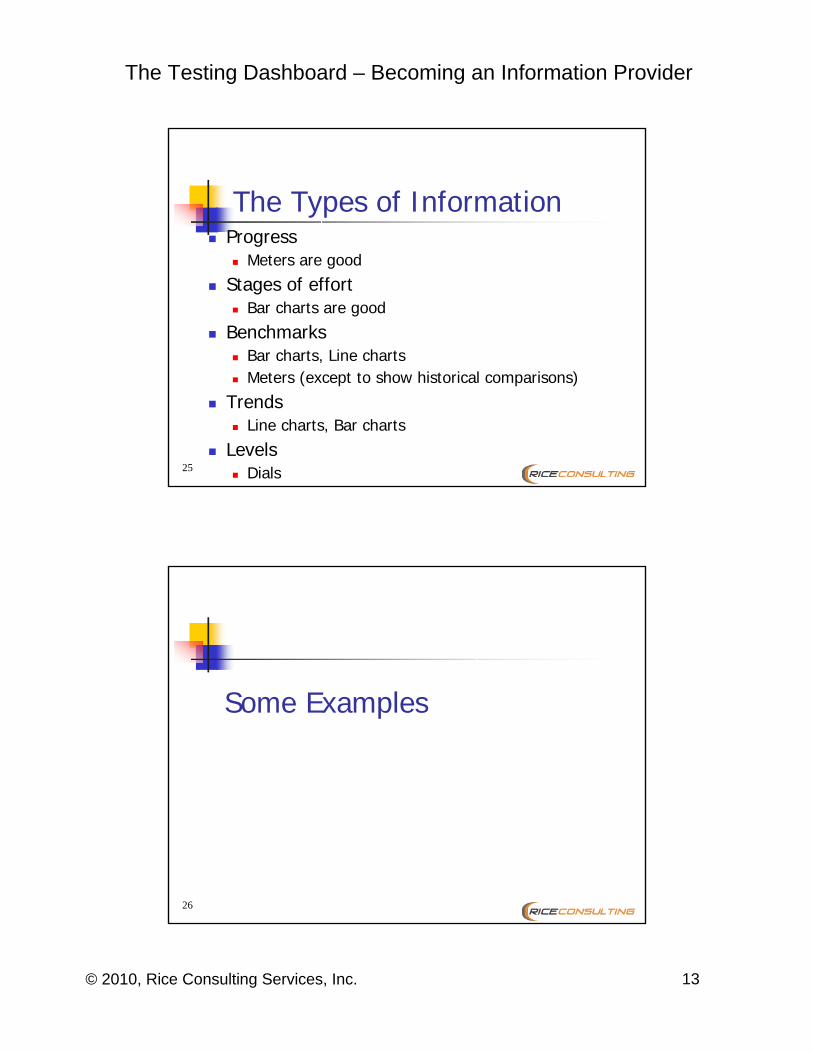
25
The Types of InformationProgress
Meters are good
Stages of effortBar charts are good
BenchmarksBar charts, Line chartsMeters (except to show historical comparisons)
TrendsLine charts, Bar charts
LevelsDials
26
Some Examples
© 2010, Rice Consulting Services, Inc. 14
The Testing Dashboard – Becoming an Information Provider
27
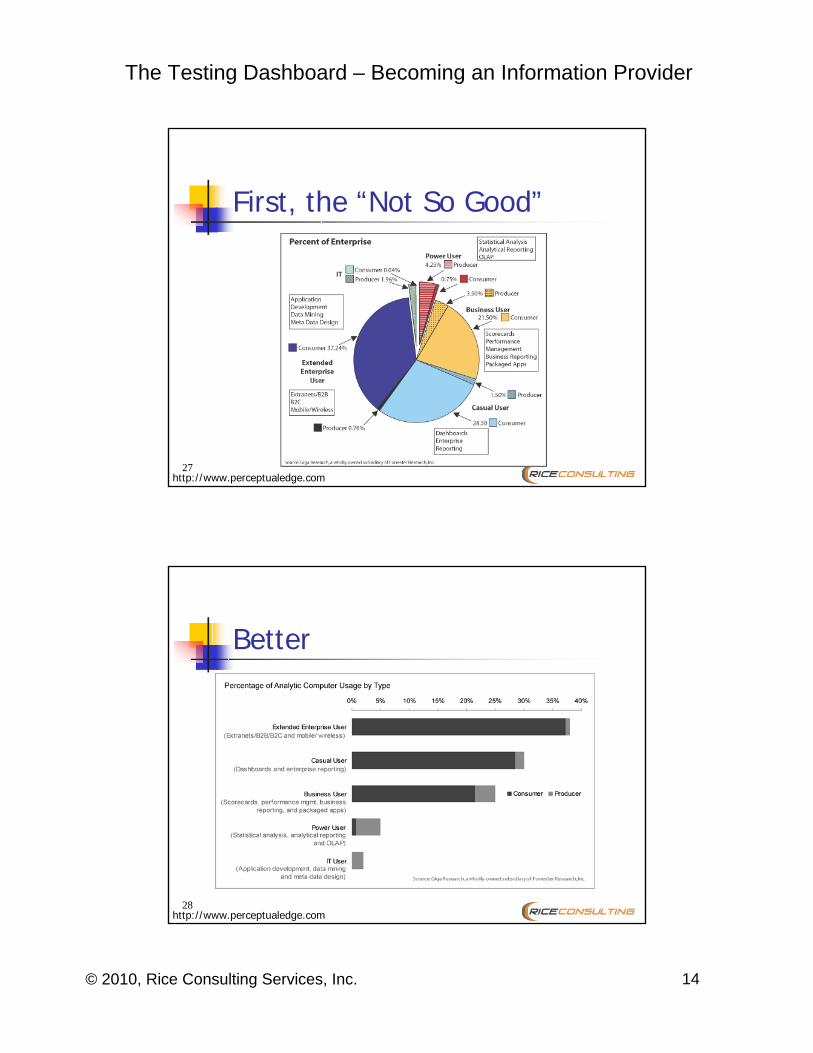
First, the “Not So Good”
http://www.perceptualedge.com
28
Better
http://www.perceptualedge.com
© 2010, Rice Consulting Services, Inc. 15
The Testing Dashboard – Becoming an Information Provider
29
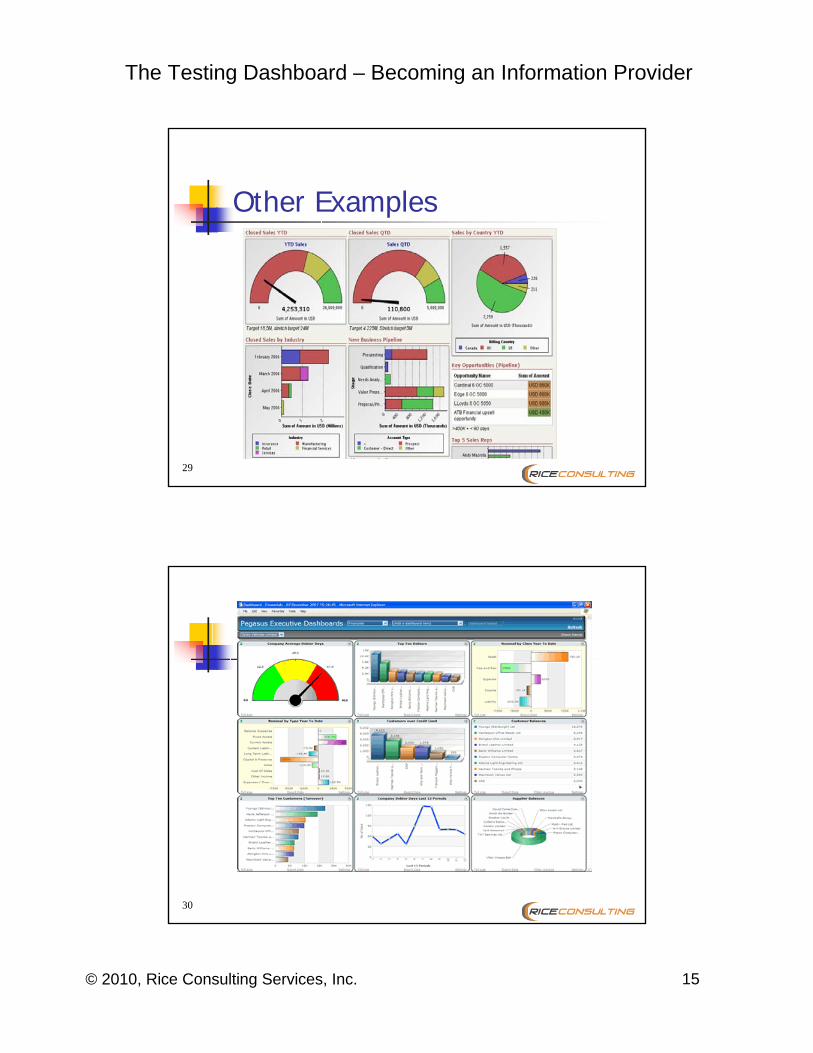
Other Examples
30
© 2010, Rice Consulting Services, Inc. 16
The Testing Dashboard – Becoming an Information Provider
31
32
© 2010, Rice Consulting Services, Inc. 17
The Testing Dashboard – Becoming an Information Provider
33
Dashboards and Usability
Good dashboards are as much about design as they are about data.
34
Some Ways to Structure Testing Dashboards
Overall Software Quality LevelsSoftware Test Center PerformanceProject Quality LevelsTest Effectiveness
OverallBy phaseBy type
Testing ProjectsProgressDefect levelsFunctional quality levels
© 2010, Rice Consulting Services, Inc. 18
The Testing Dashboard – Becoming an Information Provider
35
Expanding the View
Project DashboardsHave the same characteristics, but more points of measurement.Contain testing measures.Guide the entire project, not just testing.
36
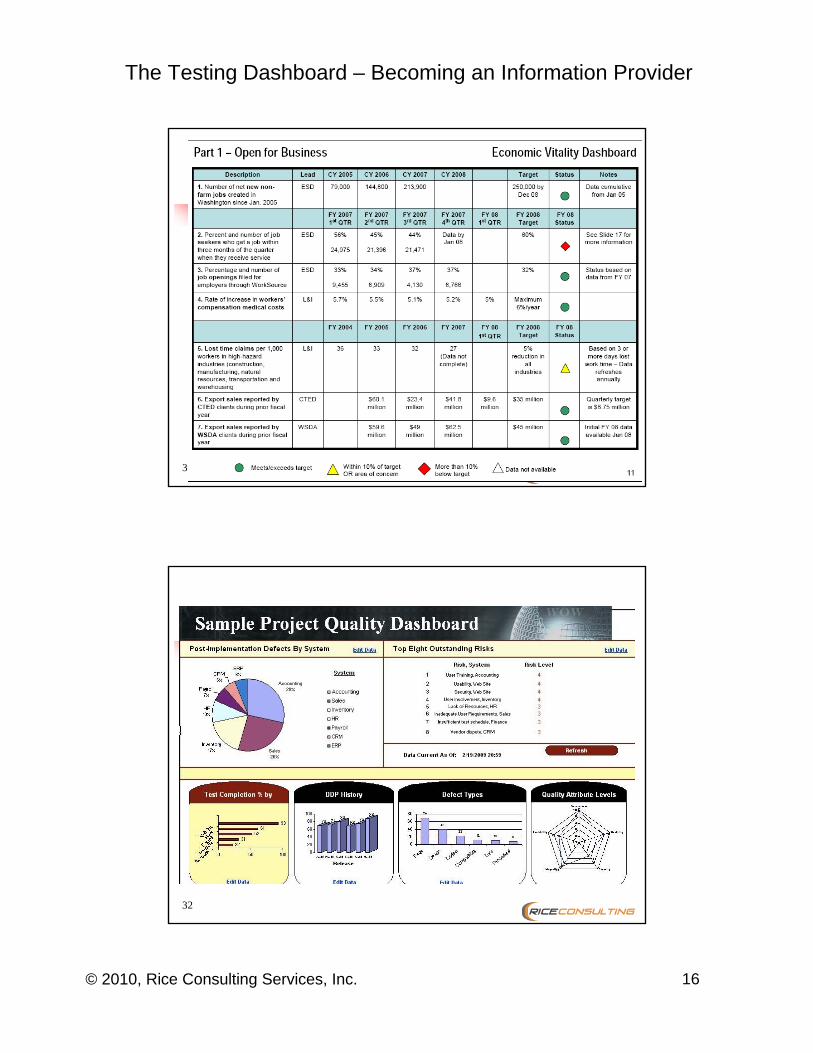
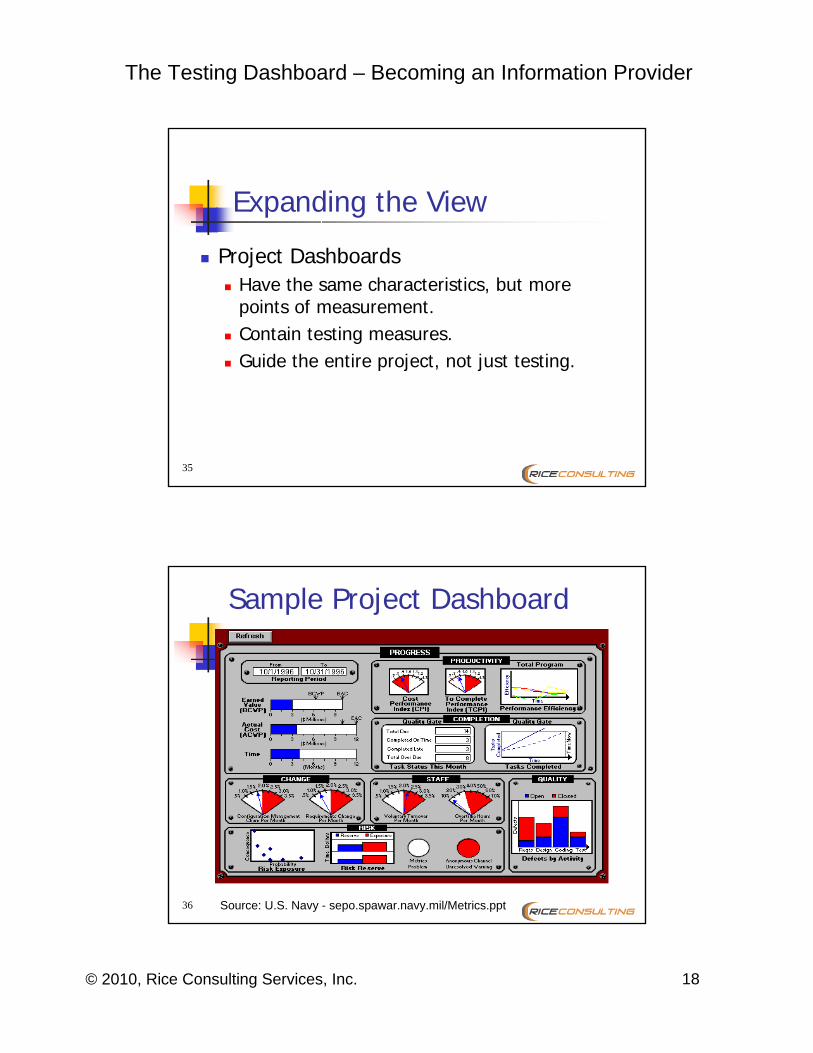
Sample Project Dashboard
Source: U.S. Navy - sepo.spawar.navy.mil/Metrics.ppt
© 2010, Rice Consulting Services, Inc. 19
The Testing Dashboard – Becoming an Information Provider
37
Methods for Creating Dashboards
Low-tech (whiteboards)Excel SpreadsheetsProprietary tools
e.g, Xcelsius
38
Demos
© 2010, Rice Consulting Services, Inc. 20
The Testing Dashboard – Becoming an Information Provider
39
What Would it Mean…
To your project managers to have access to this type of information at any point in time?To the senior management in your company to see overall software quality information?To your career to be seen as the keeper of this kind of information?
40
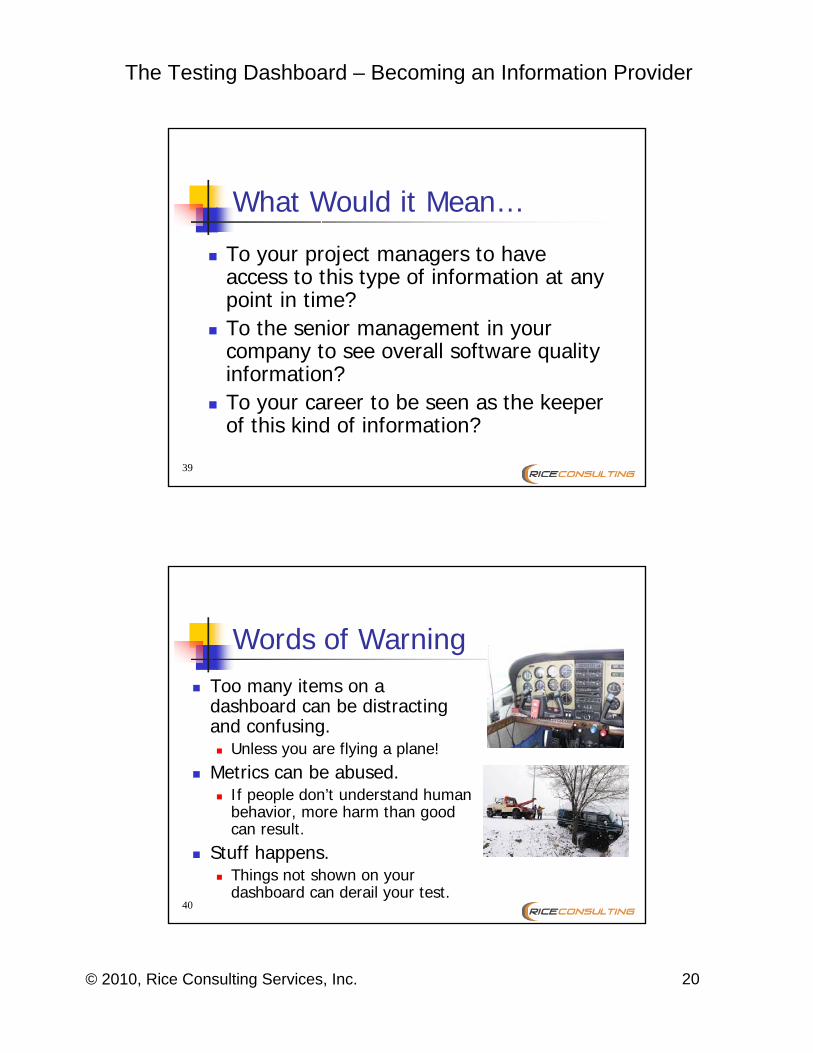
Words of WarningToo many items on a dashboard can be distracting and confusing.
Unless you are flying a plane!Metrics can be abused.
If people don’t understand humanbehavior, more harm than good can result.
Stuff happens.Things not shown on your dashboard can derail your test.
© 2010, Rice Consulting Services, Inc. 21
The Testing Dashboard – Becoming an Information Provider
41
Words of Warning (2)With dashboards, everyone can see the same information at the same time.
This may be an issue if you don’t want to show someone information until you have had a chance to see it first.
Manual input to the dashboard gets overwhelming.
You want to automate the data capture as much as possible.
Dashboards may be too general for some managers.
42
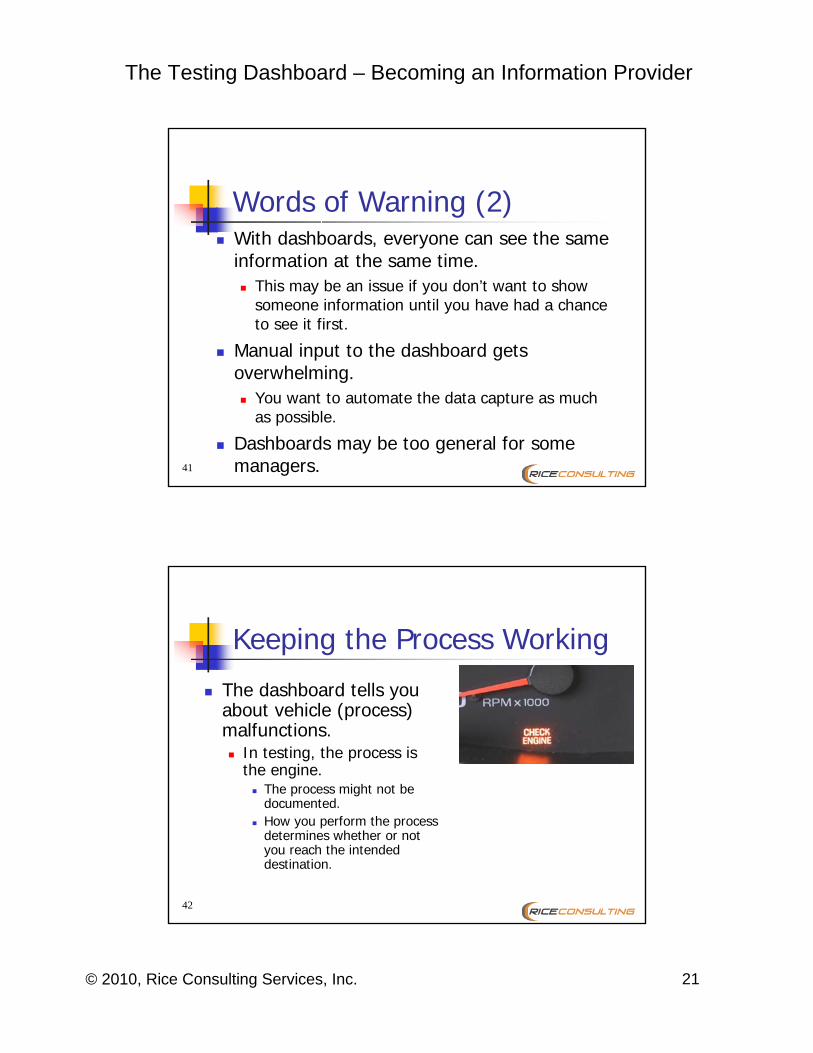
Keeping the Process Working
The dashboard tells you about vehicle (process) malfunctions.
In testing, the process is the engine.
The process might not be documented.How you perform the process determines whether or not you reach the intended destination.
© 2010, Rice Consulting Services, Inc. 22
The Testing Dashboard – Becoming an Information Provider
43
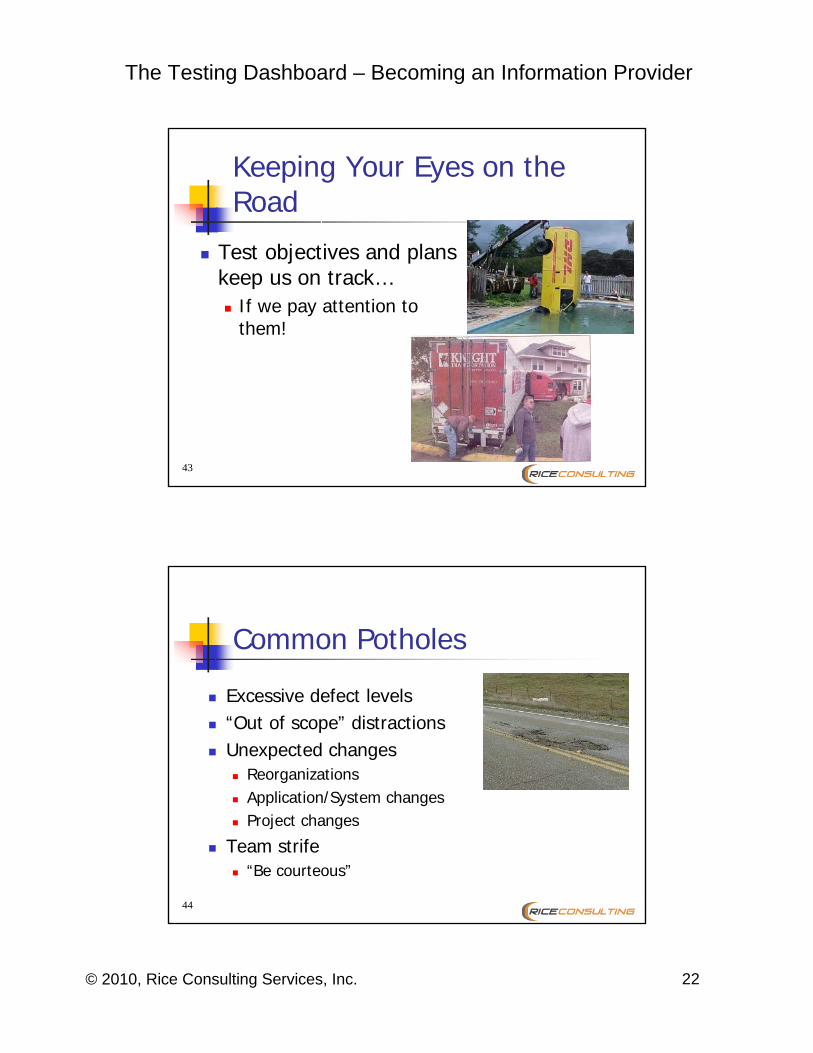
Keeping Your Eyes on the Road
Test objectives and plans keep us on track…
If we pay attention to them!
44
Common Potholes
Excessive defect levels“Out of scope” distractionsUnexpected changes
ReorganizationsApplication/System changesProject changes
Team strife“Be courteous”
© 2010, Rice Consulting Services, Inc. 23
The Testing Dashboard – Becoming an Information Provider
45
Other Concerns
Where do I find the time to create dashboards?
This is not an extra task, it's part of the job of test management!
Do I need tools?No. While there are some nice dashboard tools, all you need is a spreadsheet application.
46
Final ThoughtsA key purpose of testing is to provide meaningful information to management to make informed decisions.This is a positive value-added view of testing.Dashboards are one more tool to help you guide your testing project, but they don’t drive the car!

© 2010, Rice Consulting Services, Inc. 24
The Testing Dashboard – Becoming an Information Provider
47
Final Thoughts (2)
Good dashboards have:Good designCurrent informationThe right metrics for your situation
They should reflect the job at handThey should be understandable
Meaning and value for the readersInterpretation and guidance
Annotations are helpful
48
Resourceshttp://www.perceptualedge.com
Steven Few’s Website
http://dashboardspy.comDashboards by Example
http://www.enterprise-dashboard.com
Datapig Technologieshttp://datapigtechnologies.comA great source for Xcelsius videos
Book - How to Lie With StatisticsBy Darrell Huff
© 2010, Rice Consulting Services, Inc. 25
The Testing Dashboard – Becoming an Information Provider
49
Bio - Randall W. Rice
Over 30 years experience in building and testing information systems in a variety of industries and technical environmentsCertified Software Quality AnalystCertified Software TesterASTQB Certified Tester – Foundation level, Advanced level (Test Mgr.)Treasurer of the American Software Testing Qualification Board (ASTQB)Chairperson, 1995 - 2000 QAI’s annual software testing conferenceCo-author with William E.Perry, Surviving the Top Ten Challenges of Software TestingPrincipal Consultant and Trainer, Rice Consulting Services, Inc.
50
Contact Information
Randall W. Rice, CTAL, CSTE, CSQARice Consulting Services, Inc.P.O. Box 892003Oklahoma City, OK 73170Ph: 405-691-8075Fax: 405-691-1441Web site: www.riceconsulting.come-mail: [email protected]