the university of adelaide€¦ · chapter 1: introduction and literature review ... nature of...
TRANSCRIPT

Effect of Clay on Plant Residue Decomposition
by
SHARIAH UMAR
Thesis submitted in fulfillment of the requirement for the degree of
Master of Agricultural Science
Department of Soil and Land Systems
School of Earth and Environmental Sciences
The University of Adelaide
January 2010
THE UNIVERSITY OF ADELAIDE

i
Table of Contents
Table of Contents ......................................................................................................................... i
List of figures .............................................................................................................................. iv
List of tables ............................................................................................................................... vi
Declaration ............................................................................................................................... viii
Acknowledgement ..................................................................................................................... ix
Summary ..................................................................................................................................... x
Chapter 1: Introduction and Literature review .......................................................................... 1
1.1 Introduction .................................................................................................................................. 1
1.2 Literature review ........................................................................................................................... 2
1.2.1 Plant residue decomposition ................................................................................................. 2
1.2.2 Factors influencing plant residue decomposition .................................................................. 4
Microbial activity and community composition .......................................................................... 4
Nature of plant residues .............................................................................................................. 4
Temperature and moisture ......................................................................................................... 5
Soil structure and texture ............................................................................................................ 5
1.2.3 Soil organic matter ................................................................................................................. 6
1.2.4 Clay and its influence on soil physical properties .................................................................. 7
1.2.5 The role of clay in decomposition .......................................................................................... 8
1.3 Conclusion ..................................................................................................................................... 9
Chapter 2: General methodology ............................................................................................. 11
2.1 Soils for clay extraction ............................................................................................................... 12
2.2 Clay extraction ............................................................................................................................. 13
2.2.1 Prolonged shaking ................................................................................................................ 14
2.2.2 Citrate-dithionite-bicarbonate method ............................................................................... 14
2.3 Clay characterisation ................................................................................................................... 15
2.4 pH measurement......................................................................................................................... 17
2.5 Plant residue ............................................................................................................................... 17
2.6 Microbial inoculum ..................................................................................................................... 17
2.7 Analyses ....................................................................................................................................... 18
2.7.1 Respiration measurement .................................................................................................... 18
2.7.2 PLFA (Phospholipid Fatty Acid Analysis) ............................................................................... 20
ii
Phospholipid extraction ............................................................................................................. 20
Fatty acid nomenclature ........................................................................................................... 22
2.7.3 Particulate Organic Matter (POM) isolation ........................................................................ 22
2.8 Data analysis ................................................................................................................................ 23
Chapter 3: Effect of Wiesenboden clay concentration............................................................. 24
3.1 Introduction ................................................................................................................................ 24
3.2 Materials and methods ............................................................................................................... 26
3.3 Results ......................................................................................................................................... 28
3.3.1 Soil respiration ..................................................................................................................... 28
3.3.2 Microbial community structure ........................................................................................... 31
3.4 Discussion and conclusion ........................................................................................................... 35
Chapter 4: Effect of Red Brown Earth clay concentration ........................................................ 39
4.1 Introduction ................................................................................................................................ 39
4.2 Materials and methods ............................................................................................................... 40
4.3 Results ......................................................................................................................................... 42
4.3.1 Soil respiration ..................................................................................................................... 42
4.3.2 Particulate organic matter ................................................................................................... 45
4.3.3 Microbial community structure ........................................................................................... 47
4.4 Discussion and conclusion ........................................................................................................... 53
Chapter 5: Effect of iron oxides and clay concentration .......................................................... 58
5.1 Introduction ................................................................................................................................ 58
5.2 Materials and methods ............................................................................................................... 59
5.3 Results ......................................................................................................................................... 62
5.3.1 Soil respiration ..................................................................................................................... 62
5.3.2 Particulate organic matter ................................................................................................... 65
5.3.3 Microbial community structure ........................................................................................... 66
5.4 Discussion and conclusion ........................................................................................................... 74
Chapter 6: Effect of clay type and iron oxides .......................................................................... 78
6.1 Introduction ................................................................................................................................ 78
6.2 Materials and methods ............................................................................................................... 80
6.3 Results ......................................................................................................................................... 82
6.3.1 Soil respiration ..................................................................................................................... 82
6.3.2 Particulate organic matter ................................................................................................... 85
6.3.3 Microbial community structure ........................................................................................... 86

iii
6.4 Discussion and conclusion ........................................................................................................... 92
Chapter 7: General discussion and future studies .................................................................... 97
7.1 General discussion ....................................................................................................................... 97
Effect of clay concentration............................................................................................................ 97
Effect of clay type ......................................................................................................................... 100
Effect of iron oxide ....................................................................................................................... 101
7.2 Future studies ............................................................................................................................ 103
References ..............................................................................................................................104
iv
List of figures
3.1 Respiration rate over 32 days (mg CO2-C g soil-1 day-1) for 5, 10, 20 and 40%
clay and the control. Error bars indicate standard deviation (n=3)………………… 29
3.2 Cumulative respiration over 32 days (mg cumulative CO2-C g soil-1) for 5, 10,
20 and 40% clay and the control. Error bars indicate standard deviation
(n=3)…………………………………………………………………………………………………………….. 29
3.3 Two-dimensional nonmetric multidimensional scaling (MDS) plot of PLFAs
on the overall effect of 5, 10, 20 and 40% clay and the control, and sampling
days 0, 16 and 32………………………………………………………………………………………….. 33
3.4 Two-dimensional nonmetric multidimensional scaling (MDS) analysis of
PLFAs for 5, 10, 20 and 40% clay and the control on day 16………………………….. 34
3.5 Two-dimensional nonmetric multidimensional scaling (MDS) analysis of
PLFAs for 5, 10, 20 and 40% clay and the control on day 32………………………….. 34
4.1 Respiration rate over 32 days (mg CO2-C g soil-1 day-1) at 2.5, 5, 10 and 20%
clay and the control. Error bars indicate standard deviation (n=4)………………… 43
4.2 Cumulative respiration over 32 days (mg CO2-C g soil-1) at 2.5, 5, 10 and 20%
clay and the control. Error bars indicate standard deviation (n=4)………………. 43
4.3 Particulate organic matter (POM) concentration at 2.5, 5, 10 and 20% clay
and the control. Error bars indicate standard deviation (n=4)………………………. 45
4.4 Two-dimensional nonmetric multidimensional scaling (MDS) plot of PLFAs
on the overall effect of 2.5, 5, 10 and 20% clay and the control, and sampling
days 0, 4, 16 and 32………………………………………………………………………………………. 49
4.5 Two-dimensional nonmetric multidimensional scaling (MDS) analysis of
PLFAs at 2.5, 5, 10 and 20% clay and the control on day 0 (a), day 4 (b), day
16 (c) and day 32 (d) ……………………………………………………………………………………. 50/51
5.1 Respiration rate over 42 days (mg CO2-C g soil-1 day-1) with 0, 5 or 40% clay
either with iron oxide (N clay) or iron oxide partially removed (CD clay).
Error bars indicate standard deviation (n=4)………………………………………………… 62
5.2 Cumulative respiration in treatments over 42 (mg cumulative CO2-C g soil-1)
days with 0, 5 or 40% clay either with iron oxide (N clay) or iron oxide
partially removed (CD clay). Error bars indicate standard deviation
(n=4)…………………………………………………………………………………………………………….. 63
5.3 Particulate organic matter (POM) per g soil for 0, 5 or 40% clay either with
iron oxide (N clay) or iron oxide partially removed (CD clay). Error bars
indicate standard deviation (n=4)…………………………………………………………………. 65
5.4 (a) No fungi observed on the surface of 0% clay, (b) Hyphal mat on the
surface of 40% CD clay, white arrows indicate fungi growing on the surface.
There was no obvious fungal growth seen on any of the other treatments…… 68
v
5.5 Two-dimensional nonmetric multidimensional scaling (MDS) plot of PLFAs
for 0, 5 or 40% clay either with iron oxide (N clay) or iron oxide partially
removed (CD clay) for sampling days 14, 28 and 42 ……………………………………. 70
5.6 Two-dimensional nonmetric multidimensional scaling (MDS) plot of PLFAs
for 0, 5 or 40% clay either with iron oxide (N clay) or iron oxide partially
removed (CD clay) on day 0………………………………………………………………………….. 71
5.7 Two-dimensional nonmetric multidimensional scaling (MDS) plot of PLFAs
for 0, 5 or 40% clay either with iron oxide (N clay) or iron oxide partially
removed (CD clay) on day 14 (a), day 28 (b) and day 42(c)…………………………… 72/73
6.1 Respiration rate over 31 days (mg CO2-C g soil-1 day-1) in the control or with
5% clay as two clay types (W or RBE clay) and two clay fractions [natural (N)
clay or clay from which iron oxide was partially removed, CD clay]. Error bars
indicate standard deviation (n=4)…………………………………………………………………. 82
6.2 Cumulative respiration over 31 days (mg CO2-C g soil-1) in the control or with
5% clay as two clay types (W or RBE clay) and two clay fractions [natural (N)
clay or clay from which iron oxide was partially removed, CD clay]. Error bars
indicate standard deviation (n=4)…………………………………………………………………. 83
6.3 Particulate organic matter (POM) concentration in the control or with 5%
clay as two clay types (W or RBE clay) and two clay fractions [natural (N) clay
or clay from which iron oxide was partially removed, CD clay]. Error bars
indicate standard deviation (n=4)…………………………………………………………………. 85
6.4 Two-dimensional nonmetric multidimensional scaling (MDS) plot of PLFAs
for the control or with 5% clay as two clay types (W or RBE clay) and two
clay fractions [natural (N) clay or clay from which iron oxide was partially
removed, CD clay] on sampling days 0, 10 and 31………………………………………… 89
6.5 Two-dimensional nonmetric multidimensional scaling (MDS) analysis of
PLFAs in the control or with 5% clay as two clay types (W or RBE clay) and
two clay fractions [natural (N) clay or clay from which iron oxide was
partially removed, CD clay]: on day 0 (a), day 10 (b) and day 31(c)………………. 90/91
vi
List of tables
2.1 Height (cm) use to achieve desired bulk density …………………………………………….. 12
2.2 The amount of clay extracted from Wiesenboden and Red Brown Earth………… 13
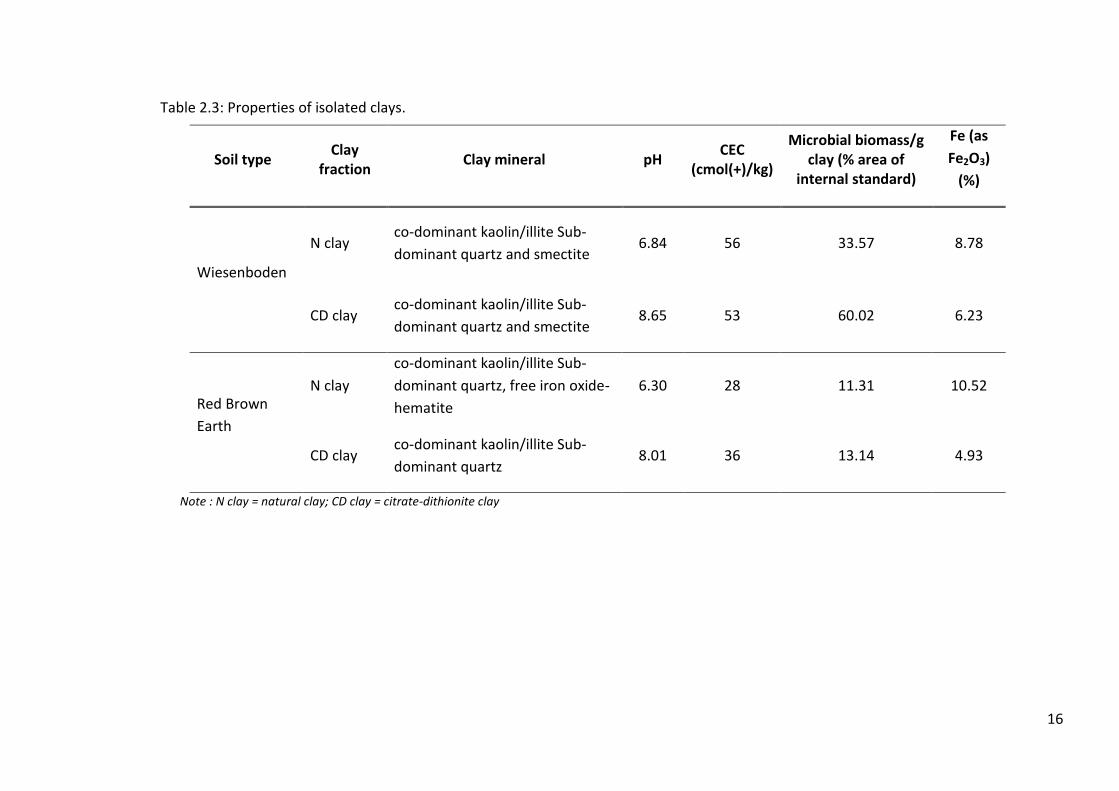
2.3 Properties of isolated clays……………………………………………………………………………… 16
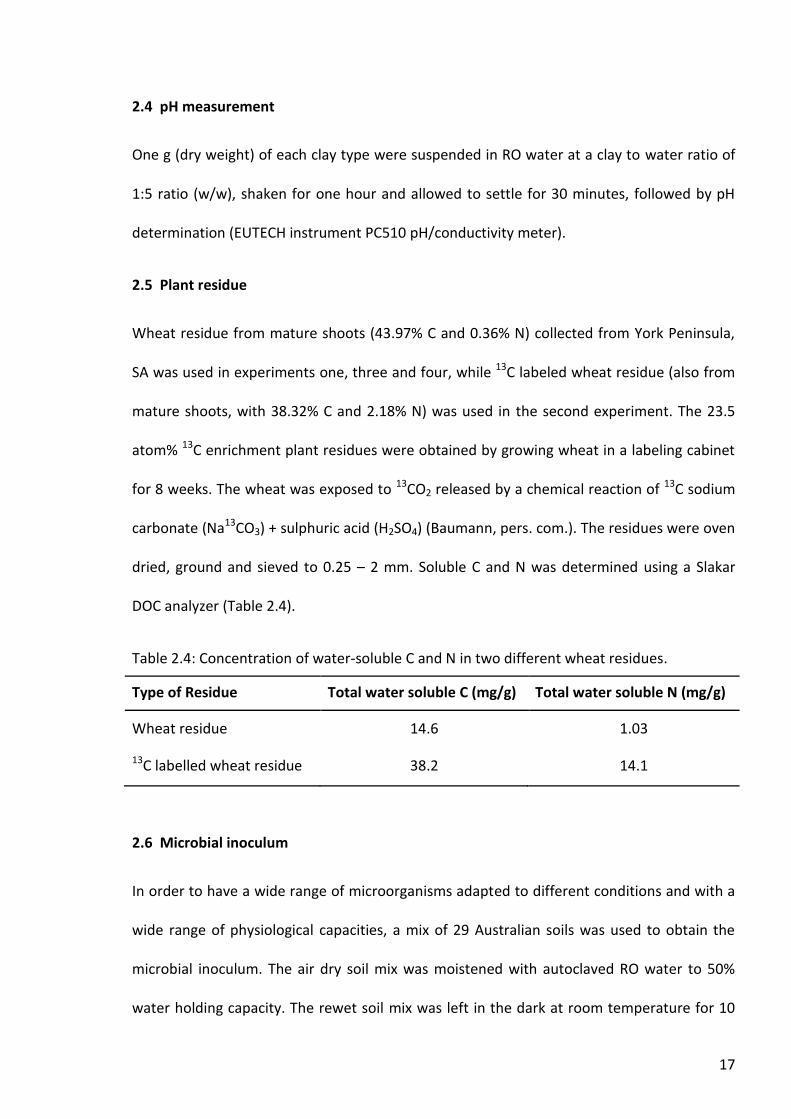
2.4 Concentration of water-soluble C and N in two different wheat residues……….. 17
3.1 Clay mineral properties (based on Churchman 2006)……………………………………… 25
3.2 Amounts of different components in 15 g substrate for each treatment………… 27
3.3 pH value of 5, 10, 20 and 40% clay and the control on day 0…………………………… 28
3.4 Water loss on days 16 and 32 for 5, 10, 20 and 40% clay and the control,
expressed in percentage (%) of amount added on day 0…………………………………. 28
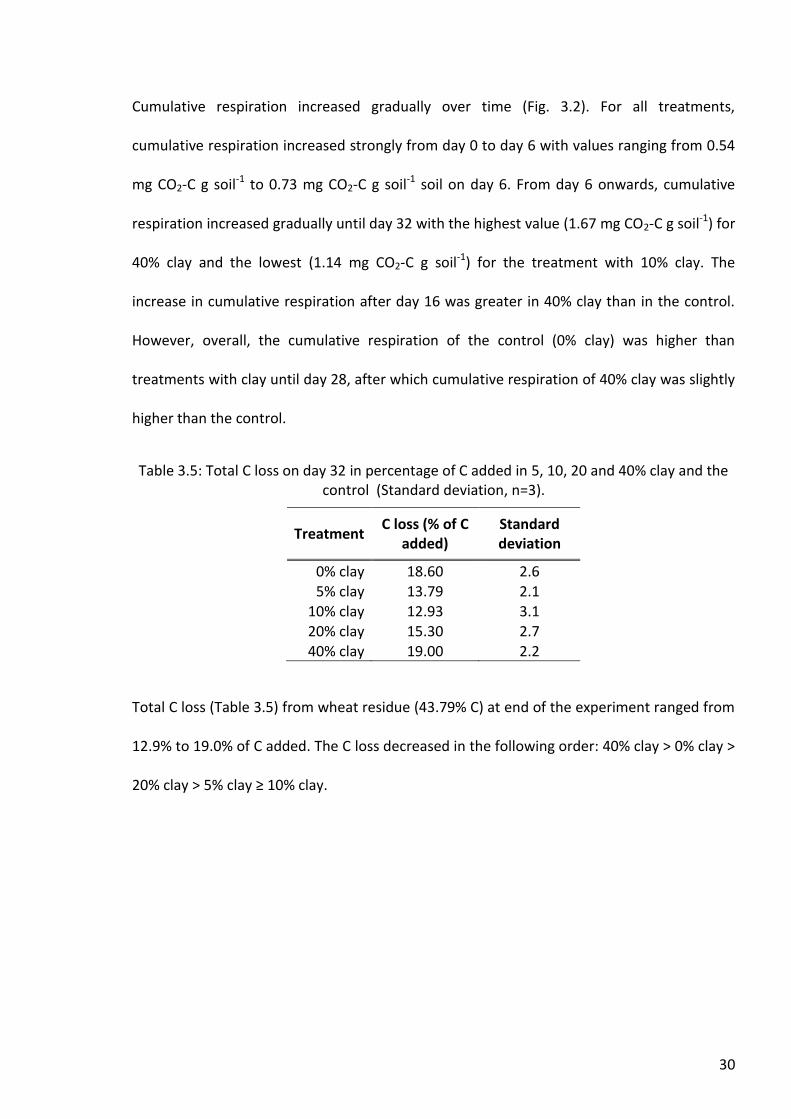
3.5 Total C loss on day 32 in percentage of C added in 5, 10, 20 and 40% clay and
the control (Standard deviation, n=3)…………………………………………….................. 30
3.6 Concentrations of total PLFAs, bacterial PLFAs and fungal PLFAs on days 0, 16
and 32, expressed as % area of internal standard, in 5, 10, 20 and 40% clay
and the control (Standard deviation, n=3)……………………………………………………… 31
3.7 PLFA richness, evenness and diversity on days 0, 16 and 32 in 5, 10, 20 and
40% clay and the control (Standard deviation, n=3)………………………………………… 32
4.1 Amounts of different components in 15 g substrate for each treatment………… 41
4.2 pH values of 2.5, 5, 10 and 20% clay and the control on day 0………………………… 41
4.3 Water loss in percentage of amount added on day 0 on days 4, 16 and 32 of
2.5, 5, 10 and 20% clay and the control ………………………………………………………….. 42
4.4 Total C loss on day 32 in percentage of C added in 2.5, 5, 10 and 20% clay and
the control (Standard deviation, n=4)………………………………….............................. 44
4.5 Concentrations total PLFAs, bacterial PLFAs and fungal PLFAs, expressed as %
area of internal standard, on days 4, 16 and 32 for 2.5, 5, 10 and 20% clay and
the control (Standard deviation, n=4)……………………………………………………………… 46
4.6 PLFA richness, evenness and diversity on days 4, 16 and 32 for 2.5, 5, 10 and
20% clay and the control (Standard deviation, n=4)………………………………………… 48
5.1 Amounts of different components in 15 g substrate for each treatment………… 60
5.2 pH value on day 0 for 0, 5 or 40% clay either with iron oxide (N clay) or iron
oxide partially removed (CD clay) …………………………………………………………………… 61
5.3 Water loss expressed in percentage of amount added on day 0 over a 14 day
period on days 14, 28 and 42 in 0, 5 or 40% clay either with iron oxide (N clay)
or iron oxide partially removed (CD clay)………………………………………………………… 62
5.4 Total C loss on day 42 in percentage of C added in 0, 5 or 40% clay either with
iron oxide (N clay) or with iron oxide partially removed (CD clay)
(n=4)…………………………………………………………........................................................ 64
5.5 Concentration of total PLFAs, bacterial PLFAs and fungal PLFAs, expressed
as % area of internal standard on days 0, 14, 28 and 42 for 0, 5 or 40% clay
either with iron oxide (N clay) or iron oxide partially removed (CD clay)
(Standard deviation, n=4)……………………………………………………………………………….. 67
vii
5.6 PLFA richness, evenness and diversity on days 0, 14, 28 and 42 for 0, 5 or 40%
clay either with iron oxide (N clay) or iron oxide partially removed (CD clay)
(Standard deviation, n=4)……………………………………………………………………………….. 69
6.1 Amounts of different components in 15 g substrate for each treatment………… 80
6.2 Iron oxide concentration and pH value on day 0 of the control or with 5% clay
as two clay types (W or RBE clay) and two clay fractions [natural (N) clay or
clay from which iron oxide was partially removed, CD clay]……………………………. 81
6.3 Water loss in percentage (%) of amount added on day 0 in the control or with
5% clay as two clay types (W or RBE clay) and two clay fractions [natural (N)
clay or clay from which iron oxide was partially removed, CD clay] after 5 and
10 days……………………………………………………………………………………………………………. 81
6.4 Total C loss on day 31 in percentage of C added in the control or with 5% clay
as two clay types (W or RBE clay) and two clay fractions [natural (N) clay or
clay from which iron oxide was partially removed, CD clay]
( n=4)…………………………………………………………....................................................... 84
6.5 Concentration of total PLFAs, bacterial PLFAs and fungal PLFAs, expressed
as % area of internal standard on days 0, 10 and 31 in the control or with 5%
clay as two clay types (W or RBE clay) and two clay fractions [natural (N) clay
or clay from which iron oxide was partially removed, CD clay] (average and
standard deviation, n=4)…………………………………………………………………………………. 86
6.6 PLFA richness, evenness and diversity on days 0, 10 and 31 in the control or
with 5% clay as two clay types (W or RBE clay) and two clay fractions [natural
(N) clay or clay from which iron oxide was partially removed, CD clay]
(Standard deviation, n=4)……………………………………………………………………………….. 88

viii
Declaration
NAME : Shariah Umar PROGRAM : Master of Agricultural Science
This work contains no material which has been accepted for the award of any other degree
or diploma in any university or other tertiary institution and, to the best of my knowledge
and belief, contains no material previously published or written by any other person, except
where due reference is made in the text.
I give consent to this copy of my thesis, when deposited in the University Library, being
made available for loan and photocopying, subject to the provisions of the Copyright Act
1968.
I also give permission for the digital version of my thesis to be made available on the web,
via the University’s digital research repository, the Library catalogue, the Australian Digital
Theses Program (ADTP) and also through web search engines, unless permission has been
granted by the university to restrict access for a period of time.
SIGNATURE : ………………………………… DATE : January 2010

ix
Acknowledgement
First and foremost, thanks to Allah, the most gracious and the most merciful.
I wish to express my deep and sincere gratitude to my supervisor, Dr. Petra Marschner for
her understanding, guidance, invaluable discussions and support throughout my study. Her
wide knowledge, useful advice, detailed and constructive comments have been of great
value for me.
I am deeply grateful to my co-supervisor, Dr. Karen Baumann for her unconditional help,
guidance and encouragement throughout my work, particularly during my hard time in the
laboratory.
I also wish to express my deepest thanks to my co-supervisor, Dr. Jock Gordon Churchman
for his interest, help and sharing of knowledge particularly with respect to clay.
I thank the government of Sarawak for the scholarship and granting me study leaves while I
am studying in Australia.
I am grateful to my fellow colleagues in Soil organic matter group for their good team work
especially to Tra and Hasnuri who always gave unconditional help and support.
My personal thanks to Kak Ana, Yaya, Tym and Nurul for their friendship, kindness and help
particularly during my initial time in Adelaide. Also, thousand thanks to my housemates and
friends for their wonderful friendship, support and care.
My special thanks to Usu, my brothers, sisters, nieces and nephews for their love and
support. My loving thanks to my mother for her endless love and care.
x
Summary
Plant residues added to soil are a source of nutrients for plants and soil organisms and
increase soil organic matter which has an important role in improving soil structure and
fertility, hence maintaining soil quality for sustainable agriculture. In order to utilize plant
residues for increasing soil organic matter more effectively, it is necessary to understand the
mechanisms of plant residue decomposition. Soil organic matter decomposition is
influenced by several factors such as plant residue quality, temperature, water availability,
soil structure and soil texture, particularly clay content. The interaction of clay and
decomposition of organic matter has been studied in the past. Nevertheless, many studies
investigated this interaction in natural soil or under field conditions over long periods of
time. Variation in environmental factors may influence the interaction of clay and
decomposition of organic matter, thus in most previous studies their effect cannot be
separated from the direct effect of clay on decomposition. To study the direct effect of clay
on organic matter decomposition, four experiments with different objectives were carried
out using isolated natural clay, under controlled conditions (e.g. temperature and organic
matter input) and a short incubation period (approximately one month).
All experiments were carried out using a sand matrix to which different clay types, clay
fractions (natural or with iron oxide partially removed) or clay concentrations were added
together with mature wheat straw (C/N 122 in most experiments, except Experiment 2
where the wheat straw had a C/N of 18) and a microbial inoculum. To investigate the effect
of clay type, two clay types were added. They were isolated from Wiesenboden (W) and Red
Brown Earth (RBE) soil. Clay types from both soils contained kaolinite and illite, but smectite
only occurred in W clay. Iron oxide is thought to be important for the binding of organic
xi
matter to clay, therefore two clay fractions were used, the clay with native iron oxide
(natural clay) and clay from which iron oxide was partially removed by citrate-dithionite-
bicarbonate treatment (citrate-dithionite clay, CD clay). The following parameters were
measured: pH, water loss, respiration rate, microbial community structure using
phospholipid fatty acid analysis and, in some experiments, particulate organic matter. In all
experiments, the water content of the substrate mixes was adjusted only at the start; water
loss was greatest in the control and decreased with increasing clay content.
The aim of the first experiment was to study the effect of the concentration of W clay on
decomposition of wheat residues. Respiration (i.e. decomposition of the wheat straw) was
affected by clay in two ways (i) decreased decomposition, thus protection of organic matter,
in the initial phase at all concentrations (5, 10, 20 and 40%) and throughout the incubation
period at ≤ 20% clay, and (ii) greater water retention at higher clay concentration
particularly 40% clay that allowed maintenance of higher respiration rates towards the end
of incubation. Generally, clay concentration had an effect on microbial community structure
but not on microbial biomass.
The effect of clay concentration was also investigated in the second experiment, but using
RBE clay and a narrower range of concentrations (0, 2.5, 5, 10 and 20 % clay) than in the first
experiment with W clay. The wheat residue used in this experiment had a lower C/N ratio
compared to the other three experiments (C/N 18 compared to 122). In contrast to the first
experiment, cumulative respiration of the clay treatments was greater than that of control
throughout the incubation, thus clay increased rather than decreased decomposition. This
may be due to the properties of the wheat residue used in this experiment which contained
more water-soluble compounds, the diffusion of which would be enhanced in treatments
with clay compared to the control due to their higher water availability. However,

xii
considering only the treatments with added clay, cumulative respiration followed the same
pattern as in the first experiment, with highest cumulative respiration at 20% clay. In general,
microbial community structure, microbial biomass and microbial groups (i.e. bacterial and
fungal fatty acids) were affected by the presence of clay and sampling time, but there was
no clear relationship between these factors and the richness and diversity of the microbial
community.
The aim of the third experiment was to determine the effect of clay concentration (5 and 40%
of W clay) and fraction (natural or citrate-dithionite clay) on decomposition of wheat straw
and microbial community structure. Clay fraction and concentration strongly affected the
respiration rate and microbial community structure as well as microbial biomass but not the
concentration of particulate organic matter (POM). Compared to the control, partial removal
of iron oxide strongly increased decomposition at both concentrations whereas clay with
iron oxides reduced the decomposition. Microbial community structure was affected by clay
fractions, particularly at 40% clay.
The aim of the fourth experiment was to determine the effect of clay fraction (natural and
citrate-dithionite clay) and clay type (W clay or RBE clay) at 5% clay on decomposition of
wheat straw and microbial community structure. Clay type and the partial removal of iron
oxide had a significant effect on the decomposition rate but did not affect POM
concentration. As in the third experiment, partial removal of iron oxide increased respiration
rate, the effect was less pronounced in RBE clay than in W clay. Clay type and fraction
strongly affected microbial community structure.
In conclusion, the experiments showed that native clay generally reduces organic matter
decomposition by binding and occlusion. The importance of iron oxide for the protective
xiii
effect of clay on organic matter decomposition was shown by the fact that partial removal of
iron oxide strongly increased decomposition rate compared to the native clay. The two clay
types differed in their effect. The W clay containing smectite protects organic matter to a
greater extent than RBE clay with predominantly illite and kaolinite due to its higher surface
area and CEC that lead to binding and or occlusion. The results also showed that although
clay reduces organic matter decomposition under optimal water availability, this effect can
be reversed as the substrates dry out because the greater water retention of substrates with
clay concentrations > 10% compared to the pure sand matrix allows maintenance of a
greater microbial activity. Clay type, fraction and concentration affected microbial
community structure via their effect on organic matter and water availability.

1
Chapter 1
Introduction and Literature review
1.1 Introduction
Soil fertility depletion is a worldwide problem (e.g. Beri et al., 1995; Dalal and Chan, 2001;
Fening et al., 2005). To maintain the long-term fertility and productivity of a soil, plant
residues can be applied (Lal, 1998). Residues are not only a major (Kumar and Goh, 2000;
Voroney et al., 1989) and effective source of nutrients (Njunie et al., 2004), but will also
increase soil organic matter content (Bhupinderpal and Rengel, 2007; Prasad and Power,
1991). Soil organic matter is crucial for soil fertility (Krull et al., 2004). It can influence
biological, chemical and physical properties of the soil (Baldock and Nelson, 2000). In order
to utilize plant residues for increasing soil organic matter content more effectively, it is
necessary to understand the mechanisms of plant residue decomposition.
Several factors are known to influence the decomposition process, such as the nature of the
plant residue (Berg and McClaugherty, 2003; Bhupinderpal and Rengel, 2007; Lavelle and
Spain, 2005), soil structure (Golchin et al., 1994a) and soil texture (Amato and Ladd, 1992;
Hassink, 1997; Jenkinson, 1977; Ladd et al., 1985; Ladd et al., 1992; Plante et al., 2006;
Saggar et al., 1996; Sørensen, 1983). Soil texture, particularly clay content, is the most
important soil property that influences decomposition (Berg and McClaugherty, 2003;
Lavelle and Spain, 2005; Rasmussen and Collins, 1990). However, there are few detailed
studies on the interaction between clay and decomposition.
Therefore, the present study focused on the effect of clay on plant residue decomposition.
This chapter will review plant residue decomposition and the factors influencing
decomposition, particularly the importance of clay on protection of organic matter. In the
2
following chapters, a series of experiments will be described which were designed to
determine the effect of clay concentration, partial removal of iron oxide and clay type on
plant residue decomposition. The final chapter will integrate the results of these
experiments, discuss them generally, ending with suggestions for future research.
1.2 Literature review
1.2.1 Plant residue decomposition
Plant residue decomposition can be defined as a change of complex chemical compounds
into simpler ones, which is mediated by microorganisms (Wagner and Wolf, 1999) and is
controlled by several factors (Berg and McClaugherty, 2003; Lavelle and Spain, 2005; Swift et
al., 1979).
During decomposition of plant residues, macro- and micronutrients are released, a process
which is essential for the maintenance of an intact nutrient cycle. Organic matter
decomposition is important for terrestrial ecosystems because it provides energy and
nutrients for soil organisms and plants (Swift et al., 1979; Van Veen and Kuikman, 1990).
Decomposition of crop residues releases a considerable amount of important nutrients such
as N and P (Ayanlaja and Sanwo, 1991). However, unlike inorganic fertilizer, the majority of
nutrients in plant residues are not readily available for plant uptake, they only become
available after mineralization during the decomposition process (Bhupinderphal et al., 2006;
Salas et al., 2003)
3
Soil microorganisms play an important role in decomposition processes and hence in
formation of soil organic matter (Wagner and Wolf, 1999). Therefore, microbial biomass
(Lavelle and Spain, 2005) and community structure (Aneja et al., 2006; Lavelle and Spain,
2005) are important variables during decomposition. Soil microorganisms change complex
forms of organic nutrients into simpler forms of inorganic nutrients; for example, through
several steps, soil microorganisms convert protein into carbon dioxide and inorganic N. This
biological process is called mineralization (Badenko, 2004). On the other hand, for their own
growth, soil microorganisms use part or all of the nutrients released during decomposition.
For instance, they may take up inorganic N, making it temporarily unavailable for plants. This
process is called immobilization (Lavelle and Spain, 2005). However, when microbes die, the
nutrients will return to the soil and become available to plants and other soil organisms
(Badenko, 2004). As a result of soil microbial activity, carbon dioxide is released into the
atmosphere and can be used as an indicator to measure the decomposition rate (Wagner
and Wolf, 1999).
However, decomposition is influenced by several factors: biological (microbial activity and
community composition), chemical (nature of the plant residue) and physical (temperature,
moisture, soil structure and texture) (Lavelle and Spain, 2005; Summerell and Burgess, 1989;
Swift et al., 1979).

4
1.2.2 Factors influencing plant residue decomposition
Microbial activity and community composition
As discussed above, the presence of microorganisms in the soil is essential for
decomposition. Microbial community structure varies during the decomposition process
depending on when and where the decomposition takes place. Microbial communities vary
in terms of population characteristics, colonization strategies and their ability to decompose
organic material (Lavelle and Spain, 2005) which may affect the decomposition of plant
residue. For example, in European woodlands, decomposition of the same type of residue is
higher in mull soils than in mor soils. This may be due to the dominance of bacteria in mull
soils, while fungi predominate in mor soils (Swift et al., 1979). However, Lavelle and Spain
(2005) explained that this result may be due rapid decomposition by white-rot fungi present
in mull soils whereas the density of white-rot fungi in mor soils is low.
Nature of plant residues
One important factor influencing decomposition of plant residues is the biochemical
composition of the residues (Aneja et al., 2006; Berg and McClaugherty, 2003; Bhupinderpal
and Rengel, 2007; Lavelle and Spain, 2005). Simple chemical compounds such as proteins
and sugars will be decomposed faster than complex compounds like lignin (Lavelle and
Spain, 2005; Summerell and Burgess, 1989). Whereas simple compounds can be taken up by
the microbial cells and mineralized directly, complex compounds have to be broken down by
extracellular enzymes into simple compounds before they can be taken up (Lavelle and
Spain, 2005; Trinsoutrot et al., 2000).
Another important residue property governing decomposition rate and mineralization-
immobilization turnover is the C/N ratio. Low C/N plant residues such as leaf residues of

5
lucerne, medics, pea and clover (legumes species) are mineralized relatively quickly, usually
accompanied by net mineralization. On the other hand, non-legume residues such as wheat,
barley, maize, canola, rice, sorghum and sugarcane, with high C/N ratios, may need addition
of inorganic N to facilitate decomposition and will result in transient net immobilization
(Bhupinderpal and Rengel, 2007).
The size of the plant residue particles is another factor affecting the decomposition rate.
When incorporated into the soil, smaller sized plant residues may have higher
decomposition rates than large pieces because small particles have a greater surface to
volume ratio, allowing greater access to the soil microorganisms (Summerell and Burgess,
1989).
Temperature and moisture
Factors such as temperature and moisture are also important for decomposition rate by
affecting microbial activity. For both temperature and moisture, there are optimal values
above and below which, decomposition is decreased. Moreover, the two factors interact;
optimal temperature will not results in high microbial activity without enough water and
likewise, optimal water content will not result in higher microbial activity at low temperature
(Berg and McClaugherty, 2003). In addition, the effect of temperature and moisture is
dependent on substrate quality. According to Paul (2001) the more easily decomposable
substrate, the more sensitive it is to both factors.
Soil structure and texture
Soil structure and texture have received much attention regarding their effect on the
decomposition process in terrestrial ecosystems (Oades, 1988; Van Veen and Kuikman,
1990).
6
Soil structure, particularly aggregation, plays an important role in decomposition processes
as aggregates may physically protect the organic matter by entrapment of the organic
substrate within aggregates, thus making it inaccessible for microorganisms (Lavelle and
Spain, 2005; Van Veen and Kuikman, 1990). Soil texture, particularly clay content, also has a
significant effect on decomposition. The effect of clay on the decomposition process will be
discussed in greater detail below.
Generally, decomposition is influenced by the interaction of the factors discussed above
(Lavelle and Spain, 2005). However, this study focused on the effect of the presence of clay
on decomposition.
1.2.3 Soil organic matter
Soil organic matter (SOM) has been defined in many ways to describe the organic
components in soil (Baldock, 2002; Baldock and Nelson, 2000; Krull et al., 2004). A simple
definition of SOM is all organic constituents that are found in soil, regardless of their origin
or state of decomposition (Baldock and Skjemstad, 1999). Soil organic matter can be divided
into living and non-living organic matter. Living organic matter consists of phytomass and
microbial and faunal biomass, and non-living organic matter consists of four main pools:
particulate organic matter (POM), dissolved organic matter (DOM) and humus, plus inert
organic matter (e.g. charcoal) (Baldock, 2002; Baldock and Nelson, 2000). Among these
pools, particulate organic matter (POM) is an important soil organic matter fraction as it is a
source of energy and nutrients for soil organisms and, after mineralization, a source of
nutrients for plants. Particulate organic matter is usually dominated by plant residues in
various stages of decomposition (Baldock and Nelson, 2000).

7
Soil organic matter increases soil fertility. An increase of soil organic matter by only 1% can
dramatically improve soil fertility. It creates a suitable living environment for a range of soil
microorganisms and improved conditions for plant growth (Gaskell et al., 2007).
Due to the importance of soil organic matter for chemical, physical and biological soil
properties, it is important to sustain or increase levels of organic matter in the soil (Hassink,
1997). It is known that physical protection by clay can preserve and consequently stabilize
soil organic matter (Dalal and Chan, 2001; Golchin et al., 1994a; Hassink, 1997; Kaiser and
Zech, 2000; Lavelle and Spain, 2005; Mtambanengwe et al., 2004; Six et al., 2002; Skjemstad
et al., 1996; Van Veen and Kuikman, 1990; Wattel-Koekkoek et al., 2001). The nature of clay
and its influence on decomposition are outlined below.
1.2.4 Clay and its influence on soil physical properties
Generally, inorganic particles in soil that are less than 2 µm in size are called clay. Clays are
the dominant colloidal fraction in soil. Clays are distinguished from other small particles in
soils by their small size, layer structure and affinity for water (Lavelle and Spain, 2005;
Theng, 1979). Clays are phyllosilicates made up of sheets based on silicon tetrahedron and
aluminium octahedron structures and, depending on the relative number of sheets in the
unit layer, they are classified into seven groups. The most common phyllosilicate groups
found in soils are kaolinite (1:1 mineral) and smectite, illite (2:1 mineral) (Goldberg et al.,
2000; Marshall et al., 1996). The 1:1 layer clay mineral structure is formed by an octahedral
layer and a tetrahedral layer whilst the 2:1 layer clay mineral consists of an octahedral layer
sandwiched between two tetrahedral layers (Sanyal, 2002; Theng, 1979). Because of their
different layer structure, these phyllosilicates differ in properties such as specific surface
area, cation exchange capacity, and water penetration (Dixon, 1991; Lavelle and Spain, 2005;

8
Marshall et al., 1996; Sanyal, 2002). These differences may affect plant residue
decomposition (Baldock, 2002; Hassink, 1997; Wattel-Koekkoek et al., 2001).
Soil organic matter content is not only affected by crystalline phyllosilicate clays, but also by
the occurrence of oxides and short-range ordered minerals. Several studies (e.g. Percival et
al., 2000; Rasmussen et al., 2005; Spain, 1990) report that their concentration can be more
strongly related to SOC than total clay content.
1.2.5 The role of clay in decomposition
Clay minerals may directly limit decomposition (Lavelle and Spain, 2005). Many studies have
shown that clay can physically protect organic matter in soil (Baldock and Skjemstad, 2000;
Golchin et al., 1994b; Hassink, 1997; Wattel-Koekkoek et al., 2001). Clay protects the organic
matter through (i) adsorption on to the inner and outer surfaces of clay particles, and (ii)
entrapment of organic substrates between the clay layers (Baldock and Skjemstad, 2000;
Lavelle and Spain, 2005) which prevent biological attack by soil microorganisms
(Mtambanengwe et al., 2004; Van Veen and Kuikman, 1990) and thus slows down the
decomposition rate and stabilizes soil organic matter.
The types and amount of clay minerals will influence decomposition and subsequently the
retention of organic matter in the soil (Lavelle and Spain, 2005). For example, soils
dominated by smectite, a clay type with a high specific surface area, may protect organic
matter more than kaolinite-dominated soil, because kaolinite has a lower specific surface
area (Hassink, 1997; Lavelle and Spain, 2005; Wattel-Koekkoek et al., 2001). Hence, the
dominant clay form affects the amount of C present in a soil (Wattel-Koekkoek et al., 2001).
In soils, iron is usually associated with clay particles (Stucki, 2006), particularly as oxides
coating the clay mineral particles (Favre et al., 2006). Clay minerals are negatively charged

9
(Dixon, 1991; Favre et al., 2006; Krull et al., 2001). Therefore, coating with positively charged
iron oxide may partly offset the negative charge of the clay (Zhuang and Yu, 2002), thus
stabilizing the clay minerals (Churchman et al., 1993) and inducing clay flocculation which
entraps organic matter thereby reducing the exposure of organic matter to biological attack
(Baldock and Nelson, 2000). Organic matter is also bound to iron oxide through ligand
exchange (Theng, 1979) involving hydroxyl groups. Bound organic matter will be less
available to soil microorganisms compared to free organic matter because microorganisms
are relatively immobile and rely on mass flow and diffusion to transport substrates to the
cell surface. Therefore, the presence of iron oxide is an important factor influencing the
capacity of clay to protect organic matter in soil (Baldock and Nelson, 2000; Krull et al., 2001).
1.3 Conclusion
The relationship between clay and soil organic matter content is well-studied (Amato and
Ladd, 1992; Baldock and Nelson, 2000; Krull et al., 2001; Ladd et al., 1985; Ladd et al., 1981;
Plante et al., 2006; Saggar et al., 1996; Spain, 1990) and it also has been established that soil
organic matter content is affected by clay mineralogy, clay concentration and iron oxide
associated with clay (Baldock and Skjemstad, 2000; Krull et al., 2001).
However, most of the previous studies have focused the long-term effect of clay on the
decomposition of organic matter using natural clay gradients in the field. Therefore, in this
study short-term dynamics were investigated because firstly, there are few studies that have
specifically focused on short-term effect of clay on organic matter decomposition, secondly
short-term effects will strongly affect long-term effects because the initial rates of
decomposition are very high, and thirdly, short-term effects may differ from long-term
effects because of (i) the sources of carbon and energy in the first few weeks after residue
10
addition are mainly soluble compounds and other relatively easily decomposable
compounds whereas later only recalcitrant C remains, and (ii) the strength of binding of
organic matter to clays may become stronger over time. Also, little is known regarding the
relationship between the microbial community structure and the decomposition of plant
residues in presence of clay.
Therefore, the aims of this research were to determine the effect of clay on residue
decomposition rate, microbial biomass and microbial community structure over 30-42 days
with particular emphasis on the effect of :
Clay concentration (Chapters 3, 4, and 5),
Clay type (presence or absence of smectite) (Chapters 3, 4 and 6)
Partial removal of iron oxide (Chapters 5 and 6)

11
Chapter 2
General methodology
In this study, four experiments were conducted. Each sample contained certain amounts of
autoclaved commercial sand (53 – 150 µm, Sloan’s sand P/L) and clay (for details see
Materials and Methods of the individual chapters), to which mature wheat residues ground
and sieved to a particle size of 0.25 to 2 mm were added at 2 g 100g-1 sand-clay mix. Fifteen
g of this mixture was weighed into a 50 ml plastic container with 3.9 cm diameter, rewet
with autoclaved RO (reverse osmosis) water up to 51% water holding capacity (WHC),
followed by addition of 0.6 ml microbial inoculum. The mix was compacted to a certain
height to give a bulk density of 1.3 to 1.7 g cm-3 depending on clay concentration according
to bulk density calculator based on the American texture triangle (www.pedosphere.com,
2008). The height to which the sand-clay-residue mix was compressed was calculated based
on the bulk density equation calculation as follows:
Bulk density (gcm-3) = g dry soil (mass of sample) / πr2h (volume of sample)
h = g dry soil/ bulk density*π*r2
with π = 3.14, r = radius of container and h = the required height.
For example, the required bulk density for 5% clay sample is 1.71 g cm-3, thus the calculation
is:
h = 15 g / 1.71*3.14*1.952
h = 0.73
The height used in the experiments for the different clay concentrations is shown in Table
2.1.
12
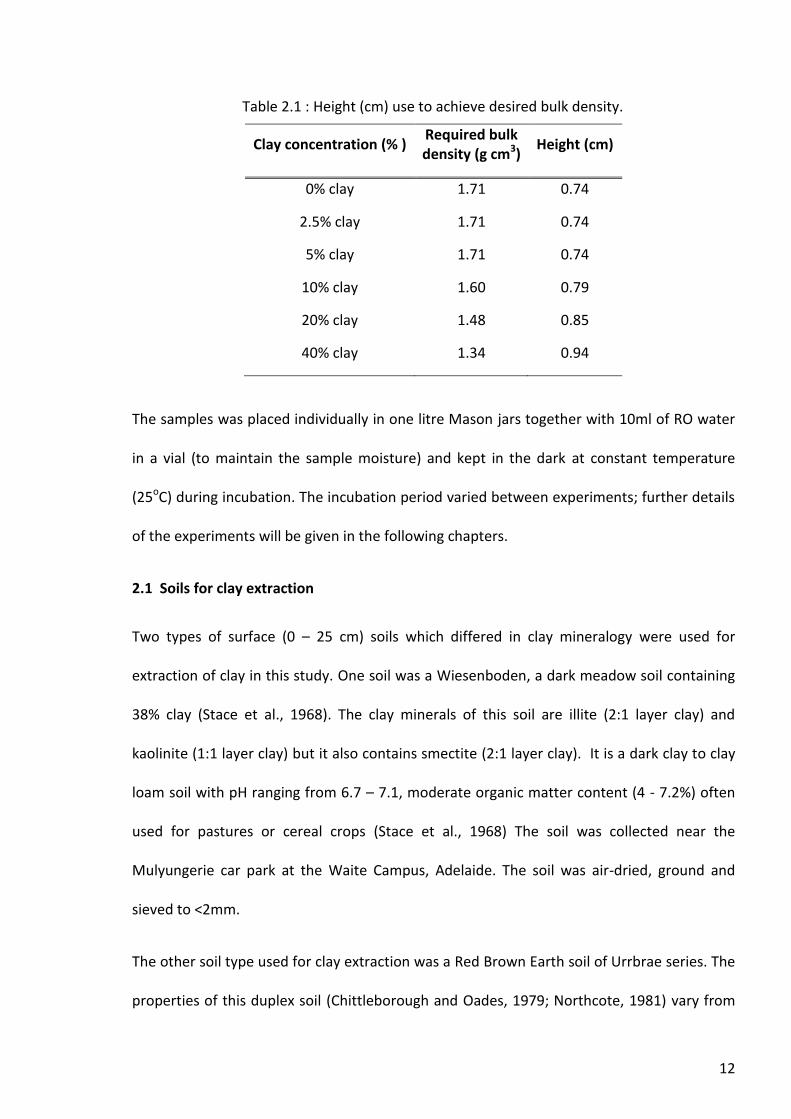
Table 2.1 : Height (cm) use to achieve desired bulk density.
Clay concentration (% ) Required bulk density (g cm3)
Height (cm)
0% clay 1.71 0.74
2.5% clay 1.71 0.74
5% clay 1.71 0.74
10% clay 1.60 0.79
20% clay 1.48 0.85
40% clay 1.34 0.94
The samples was placed individually in one litre Mason jars together with 10ml of RO water
in a vial (to maintain the sample moisture) and kept in the dark at constant temperature
(25oC) during incubation. The incubation period varied between experiments; further details
of the experiments will be given in the following chapters.
2.1 Soils for clay extraction
Two types of surface (0 – 25 cm) soils which differed in clay mineralogy were used for
extraction of clay in this study. One soil was a Wiesenboden, a dark meadow soil containing
38% clay (Stace et al., 1968). The clay minerals of this soil are illite (2:1 layer clay) and
kaolinite (1:1 layer clay) but it also contains smectite (2:1 layer clay). It is a dark clay to clay
loam soil with pH ranging from 6.7 – 7.1, moderate organic matter content (4 - 7.2%) often
used for pastures or cereal crops (Stace et al., 1968) The soil was collected near the
Mulyungerie car park at the Waite Campus, Adelaide. The soil was air-dried, ground and
sieved to <2mm.
The other soil type used for clay extraction was a Red Brown Earth soil of Urrbrae series. The
properties of this duplex soil (Chittleborough and Oades, 1979; Northcote, 1981) vary from
13
one horizon to another. The soil texture of the A horizon is fine sandy loam whereas the B
horizon is heavy clay (Northcote, 1981). The pH value of A horizon ranges from 5.6 to 9.1
while it is 6.4 to 9.6 in the B horizon. The cation exchange capacity (CEC) also varies ranging
from 5 to 40 cmol g-1 in the A horizon and 20 to 45 cmol g-1 in the B horizon. The total carbon
contents of the soil ranges from 0.4% to 2.5%. The main clay minerals of this soil are illite
(2:1 layer clay) and kaolinite (1:1 layer clay) (Williams, 1981; Yeoh and Oades, 1981) with
the clay contents ranging from 20 to 40% (Williams, 1981). This soil does not contain
smectite. The soil from the A horizon was collected from cropping soil at the Waite Campus,
Adelaide. The soil was then air-dried, ground and sieved to <2mm.
2.2 Clay extraction
Clay was extracted by two different procedures to obtain two clay fractions i.e. by (1)
prolonged shaking with gravity separation to obtain the clay fraction with iron oxide and (2)
citrate-dithionite-bicarbonate treatment to partially remove free (non-structural) iron oxide,
thus obtaining the clay fraction from which iron oxide was partially removed.
The amount of clay extracted by these methods depends on the clay content of the soil as
shown in Table 2.2.
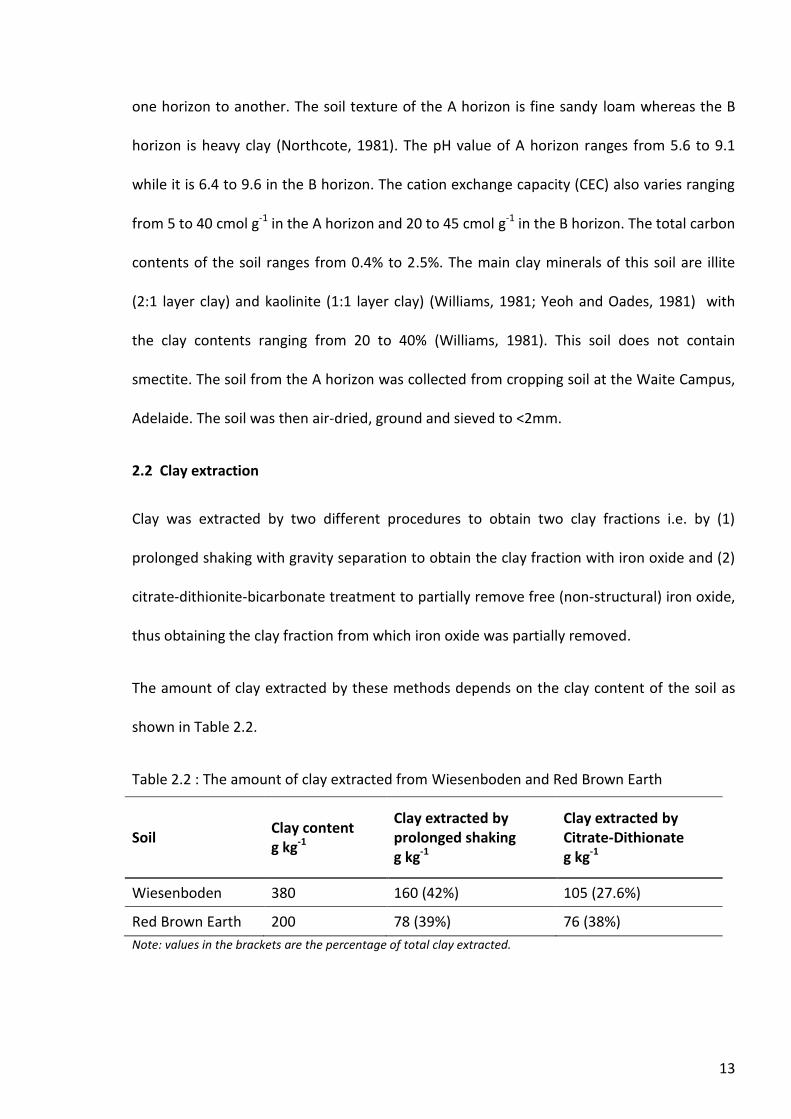
Table 2.2 : The amount of clay extracted from Wiesenboden and Red Brown Earth
Soil Clay content g kg-1
Clay extracted by prolonged shaking g kg-1
Clay extracted by Citrate-Dithionate g kg-1
Wiesenboden 380 160 (42%) 105 (27.6%)
Red Brown Earth 200 78 (39%) 76 (38%)
Note: values in the brackets are the percentage of total clay extracted.
14
2.2.1 Prolonged shaking
The prolonged shaking method after Churchman and Tate (1986) was used for physical
disaggregation.
Ten g dry weight equivalent of the soils were placed in a 250ml plastic bottle containing 100
ml of RO water (1 soil:10 water ratio). After shaking for 24 hours, the suspension was
transferred to a one liter measuring cylinder. After RO water was added to a height of 30cm
the suspension was left for precipitation for 16 hours. The <2 µm clay was collected by
siphoning off the top 22 cm of the soil suspension. The settling time (16 hours) and the soil
suspension height (22 cm) used in this method were determined based on the Stokes’ law as
described in Jackson (1956). After centrifuging at 3000 rpm for 30 minutes, the clear
supernatant was discarded and the clay paste was air dried, scraped out of the centrifuge
tube, ground and sieved to 0.2mm.
2.2.2 Citrate-dithionite-bicarbonate method
Partial removal of iron oxide was carried out by the citrate-dithionite-bicarbonate method
after Mehra and Jackson (1960). As proposed by Aguilera and Jackson (1953) sodium
dithionite with sodium citrate was added with sodium bicarbonate as pH stabilizer for
removal of iron oxide. In this method, sodium dithionite is used as reducing agent, while
sodium citrate chelates iron (Aguilera and Jackson, 1953; Mehra and Jackson, 1960).
Ten g dry weight equivalent of the soils were placed in 50ml plastic centrifuge tubes, to
which 30 ml of 0.3 M sodium citrate and 5 ml of 1M sodium bicarbonate were added. The
tubes were heated in a water bath at 90oC to 100oC followed by addition of 1g sodium
dithionite and continuous stirring for about 5 minutes. The samples were then placed in the
water bath for further 10 minutes, shaken periodically followed by centrifuging at 1500 rpm
15
for 5 minutes. After centrifugation, the iron oxide-containing suspension was decanted and
the two steps were repeated by adding 30 ml of 0.3 M sodium citrate and centrifugation.
The iron oxide suspension was decanted again and the pellet washed with RO water by
vortexing and then centrifuging at 3000 rpm for 30 minutes. The resulting pellet was again
suspended in RO water and transferred into a 1 litre measuring cylinder and RO water was
added to a height of 30cm and left for precipitation for 16 hours. The following steps were
carried out as described above for prolonged shaking.
2.3 Clay characterisation
The isolated clays were characterized by measuring pH, CEC, microbial community structure
and clay minerals. The analyses of pH and microbial community structure (as described
below for the sand-clay mixtures) were done in the soil laboratory, the University of
Adelaide. Determination of CEC was carried out by CSIRO after Rayment and Higginson
(1992). X-ray diffraction was used for clay mineral characterization with a PANalytical X’Pert
Pro microprocessor patterns recorder-controlled diffractometer using Fe filtered Co Kα
radiation as described in Brindley and Brown (1980). X-ray fluorescence was used to detect
compounds which could not be detected by x-ray diffraction such as iron oxide in
Wiesenboden clay. This analysis was also carried out by CSIRO after Norrish and Hutton
(1969). The clay properties are shown in Table 2.3.
16
Table 2.3: Properties of isolated clays.
Soil type Clay
fraction Clay mineral pH
CEC (cmol(+)/kg)
Microbial biomass/g clay (% area of
internal standard)
Fe (as
Fe2O3)
(%)
Wiesenboden
N clay co-dominant kaolin/illite Sub-
dominant quartz and smectite 6.84 56 33.57 8.78
CD clay co-dominant kaolin/illite Sub-
dominant quartz and smectite 8.65 53 60.02 6.23
Red Brown
Earth
N clay
co-dominant kaolin/illite Sub-
dominant quartz, free iron oxide-
hematite
6.30 28 11.31 10.52
CD clay co-dominant kaolin/illite Sub-
dominant quartz 8.01 36 13.14 4.93
Note : N clay = natural clay; CD clay = citrate-dithionite clay
17
2.4 pH measurement
One g (dry weight) of each clay type were suspended in RO water at a clay to water ratio of
1:5 ratio (w/w), shaken for one hour and allowed to settle for 30 minutes, followed by pH
determination (EUTECH instrument PC510 pH/conductivity meter).
2.5 Plant residue
Wheat residue from mature shoots (43.97% C and 0.36% N) collected from York Peninsula,
SA was used in experiments one, three and four, while 13C labeled wheat residue (also from
mature shoots, with 38.32% C and 2.18% N) was used in the second experiment. The 23.5
atom% 13C enrichment plant residues were obtained by growing wheat in a labeling cabinet
for 8 weeks. The wheat was exposed to 13CO2 released by a chemical reaction of 13C sodium
carbonate (Na13CO3) + sulphuric acid (H2SO4) (Baumann, pers. com.). The residues were oven
dried, ground and sieved to 0.25 – 2 mm. Soluble C and N was determined using a Slakar
DOC analyzer (Table 2.4).
Table 2.4: Concentration of water-soluble C and N in two different wheat residues.
Type of Residue Total water soluble C (mg/g) Total water soluble N (mg/g)
Wheat residue 14.6 1.03
13C labelled wheat residue 38.2 14.1
2.6 Microbial inoculum
In order to have a wide range of microorganisms adapted to different conditions and with a
wide range of physiological capacities, a mix of 29 Australian soils was used to obtain the
microbial inoculum. The air dry soil mix was moistened with autoclaved RO water to 50%
water holding capacity. The rewet soil mix was left in the dark at room temperature for 10

18
days to reactivate the microorganisms. Autoclaved RO water was added periodically to
maintain the moisture by adjusting to the initial weight at the start of the incubation. On day
10, autoclaved RO water was added to obtain a soil to water ratio of 1: 5 (w/w) and left
overnight. On the following day, the suspension was applied directly to the samples. For
amounts added see Materials and Methods of the individual chapters.
2.7 Analyses
2.7.1 Respiration measurement
Respiration in experiments one, two and three was measured using the sodium hydroxide
(NaOH) CO2 trap method while respiration in experiment four was measured using the
infrared gas analyzer.
The sodium hydroxide CO2 trap method as described in Rodella and Saboya (1999) was used.
Electrical conductivity (EC) of the NaOH solution was measured to determine the CO2
evolved from the samples. Theoretically, the amount of CO2 absorbed in NaOH solution is
negatively correlated to the EC value; the lower the EC value, the greater the amount of
absorbed CO2. The principle is that the CO2 evolved from the sample and absorbed in the
NaOH solution, will consume OH- ions and produce CO32- ions which are less mobile than OH-
thereby decreasing the EC of the solution (Rodella and Saboya, 1999).
A 50 ml Falcon tube containing 20 ml of 0.25 M NaOH was placed in the 1l Mason jar
together with the sample and a vial of 10 ml RO water after which the jars were sealed air-
tight. As the amount of CO2 evolved from the samples was expected to be low, 0.25M NaOH
was used instead of 0.5M NaOH as suggested in Rodella and Saboya (1999). The NaOH
concentration was reduced to enhance the sensitivity of the EC to absorbed CO2. For
calibration, 20 ml of fresh 0.25M NaOH was used as a 0% CO2 standard and 20 ml of 0.125M
19
sodium carbonate (Na2CO3) as a standard for complete neutralization of NaOH (100% CO2).
The EC of the NaOH in the jars was measured every two days and then replaced with fresh
NaOH for the next CO2 reading. The EC was measured using EUTECH instrument PC510
pH/conductivity meter throughout the incubation period.
The amount of absorbed CO2 was estimated by the following equation:
Absorbed CO2 (mg) = V x M x 22 [(c1-cx)/(c1-c2)]
Where cx is the EC value of the sample, c1 is the EC of the standard NaOH, c2 is the EC of the
standard Na2CO3, V is the volume (ml) of the standard NaOH and M is the concentration
(mol l-1) of the standard NaOH.
The amount of CO2-C evolved was calculated as below:
CO2-C evolved = CO2 absorbed * (molecular weight of C/ molecular weight of CO2)
For the infrared gas analysis; the sample jars were closed with a special lid with a septum
and CO2 in the headspace was measured with a Servomex 1450 series foodpack gas analyzer.
Gas sampling was done by inserting a needle through the septum into the jar. After
measuring, the jars was flushed with normal air, closed and measured again for the time 0
CO2 reading. Standards used in all experiments were 0, 0.6, 1.5, 2.5, 3.5 and 4.5 ml of CO2
gas (the standard values are approximately corresponding to mg CO2/ml, the exact
concentration depending on the temperature at the time of measurement). Respiration was
measured every 24 hours in first few days and later every 48 -72 hours until the end of the
experiment.
The respiration rate per day for both methods was calculated based on the following
calculation:
20
Respiration rate per day (mg CO2-C g soil-1 day-1) = CO2-C release (mg) / amount of soil (g) /
time since resealing (hours) * 24.
Cumulative respiration rates were calculated by adding the respiration rates per day over
time.
2.7.2 PLFA (Phospholipid Fatty Acid Analysis)
PLFA analysis has been used in many studies to measure microbial community structure (e.g.
Bååth et al., 1992; Frostegård et al., 1993; McMahon et al., 2005). The method used in this
study is based on the procedure described in Frostegård et al. (1993).
Extraction of the phospholipids was done in three steps which are (1) lipid extraction, (2)
lipid fractionation, and (3) alkaline methanolysis followed by analyses by gas
chromatography (GC).
All solvents used in this method were of analytical grade and all glassware was chloroform
rinsed and autoclaved. For safety reasons, all procedures in this method were done under
the fume hood and wearing appropriate safety protection.
Phospholipid extraction
(1) Lipid extraction
Approximately 2 g of freeze dried or frozen sand-clay mix was weighed in a 25ml glass
centrifuge tube, incubated in the dark and mixed every 20 minutes for 2 hours in a 9.2 ml
mixture of chloroform, methanol and citrate buffer (1:2:0.8, v/v/v), modified from Bligh and
Dyer (1959), followed by centrifugation at 2000 rpm for 15 minutes. The supernatant was
transferred into a new 25ml tube, followed by addition of 3.1 ml of each chloroform and
citrate buffer and then centrifuged at 2000 rpm for 10 minutes to split it into two phases.
21
The organic phase containing lipids was then transferred into a 15ml glass tube and stored at
-20oC.
(2) Lipid fractionation
The extracted lipid phase was dried under nitrogen gas (N2) at 40oC, reconstituted in
chloroform and fractionated on silica columns (Supelco, Bellefonte, PA, USA) into neutral-,
glyco- and phospholipids using chloroform, acetone and methanol respectively. Neutral and
glycolipid fractions were discarded and phospholipid fraction was dried under N2 at 40oC.
(3) Alkaline methanolysis
Methanolysis was carried out by dissolving the sample in methanol-toluene solution (1:1 v/v),
mixed with 0.2M methanolic KOH and the process was stopped by adding
hexane:chloroform (4:1 v/v), 1M acetic acid and autoclaved RO water. The organic phase
containing fatty acid methyl esters was separated from the aqueous phase by centrifuging at
2000 rpm for 10 minutes. The aqueous phase was transferred into a 15ml glass tube and
dried under N2. The sample was dissolved in dichloromethane and methylnonadecanoate
was added as an internal standard.
The samples were run on a HP 6890 gas chromatograph with a flame ionization detector
under the following conditions (Baumann, pers. com):
Capillary column : SP-2560, fused silica (75m, 180µm x 0.14µm film thickness)
Carrier gas : Helium 20cm/sec
Oven temperature : 140oC for 5 minutes, increased to 240oC at 4oC per minute and maintained at 240oC for 15 minutes.
Temperature of the injector : 250oC
Temperature of detector : 260oC
Split : 50:1
Detector gases : Synthetic air, Hydrogen
Make up gas : Nitrogen

22
Comparisons of retention time of the fatty acid methyl esters mix (Supelco 37) and the
standards as well as identification by GC-MS (Baumann et al., 2009) were used as a basis of
fatty acid identification.
The concentration of the fatty acids is expressed in percentage of internal standard.
Fatty acid nomenclature
The fatty acids nomenclature follows that given by Frostegård et al. (1993). They are named
upon the total number of carbon atom:number of double bonds, followed by the double
bond location from the methyl end of the molecule. The ‘-c’ and ‘-t’ are used to indicate the
cis and trans respectively. Other indicators used are ‘a’ for anteiso- , ‘i’ for iso-branching and
‘br’ for unknown methyl branching position. A methyl group on the tenth C atom from the
carboxyl end of the molecule refer as ‘10Me’ and ‘cy’ is for cycloprophane fatty acid.
2.7.3 Particulate Organic Matter (POM) isolation
Free POM was isolated to obtain the amount of remaining residue which can be used to
estimate decomposition of plant residues. The method of POM isolation is modified from
the method described in Cambardella and Elliot (1992).
To obtain POM, 10g sand-clay mix was suspended in 500ml RO water and passed through a
53 µm sieve. The material retained on the sieve was rinsed with RO water several times to
remove clay particles. The organic matter which was now clay-free was then transferred into
a 100 ml beaker and RO water was added to separate the POM from the sand by transferring
the floating POM onto the 53µm sieve. The POM remaining on the sieve was collected and
freeze dried and weighed.

23
2.8 Data analysis
Microsoft Excel was used for analyzing the data and standard deviation was used as a
measure of variability of a data set.
The PLFA data were log (x+1) transformed to focus attention on patterns of the whole
community by giving rare fatty acids similar weighting as common fatty acids. Log
transformed PLFA patterns were analyzed by Primer E software (Primer-E Ltd, Plymouth
Marine Laboratory, Plymouth, UK). Non-metric multi-dimensional scaling was used to plot
the PLFA patterns. In MDS, stress values indicate how well the ordination represents the
actual variability in community structure of the samples. Stress values ≤ 0.2 indicate that the
ordination is a good reflection of the overall structure of the communities. Significance of
differences in microbial community structure between treatments was determined by
PERMANOVA.
PLFA diversity, evenness and richness were defined as follows (Clarke and Warwick,
2001):
Shannon diversity index H’=-i pi log(pi)
Pielou’s evenness index J’= H’/log S
Margalef’s richness index d=(S-1)/log N
With pi: proportion of the total PLFAs arising from the i-th species; S: total number of PLFAs
and N: total PLFA concentration of the sample.
24
Chapter 3
Effect of Wiesenboden clay concentration
3.1 Introduction
Clay plays an important role in physical and chemical protection of organic matter in soil.
The presence of clay in soil is correlated with soil aggregation and stability, thus affecting
physical and chemical protection of soil carbon (Chaney and Swift, 1984; Schlecht-Pietsch et
al., 1994). Additionally, clay mineral type may affect organic matter decomposition. Smectite
and mica (2:1 layer clays) and kaolin (1:1 layer clay) are the groups of minerals that
commonly occur in soils as montmorilonite, illite and kaolinite, respectively (Marshall et al.,
1996).
Among the clay minerals present (Illite, kaolinite and smectite), smectite dominates the
properties of the Wiesenboden soil (Grant and Blackmore, 1991; Stace et al., 1968).
Smectites have a high relative surface area due to their small particle size and a high CEC,
and thus a high sorption capacity. They also have the ability to expand in the presence of
water (Dixon, 1991; Marshall et al., 1996; Sanyal, 2002). On the other hand, illite and
kaolinite are dominant in Red Brown Earth (Chittleborough and Oades, 1979; Norrish and
Pickering, 1983; Northcote, 1981; Turchenek and Oades, 1979). Illites and kaolinites have a
greater particle size, smaller relative surface area and a lower CEC than smectites
(Churchman, 2006; Dixon, 1991; Marshall et al., 1996; Sanyal, 2002) and do not swell in the
presence of water (Marshall et al., 1996; Sanyal, 2002). The CEC of kaolinites is pH
dependent (Sollin et al., 1996). Illites have a moderate CEC (more than kaolinite but less than
smectite) and do not expand in the presence of water (Marshall et al., 1996; Sanyal, 2002).
25
Smectites are highly reactive clay minerals compared to both illites and kaolinites. The
properties of these clay minerals are shown in Table 3.1 (based on Churchman, 2006).
Table 3.1: Clay mineral properties (based on Churchman 2006).
Smectite, illite and kaolinite are the most types of common clay minerals found in soil
(Goldberg et al., 2000; Marshall et al., 1996). Thus it is important to study the different effect
of these clay minerals on organic matter decomposition. In this chapter, the effect of
Wiesenboden clay (W clay) on organic matter decomposition was studied. It is hypothesized
to have a greater effect on decomposition as it contains smectites (Table 2.3, Chapter2)
compared to the Red Brown Earth clay, which does not contain smectites (described in the
following chapter). The amount of clay in the soil also has an important role in organic
matter decomposition. A relationship between clay concentration and soil organic matter
content has been reported in many studies (Amato and Ladd, 1992; Ladd et al., 1985; 1981;
Saggar et al., 1996; Spain, 1990). However, clay content was found not to be related to the
protection of free particulate organic matter (Koelbl and Koegel-knabner, 2004; Plante et al.,
2006). Plante et al. (2006) also found that clay content had no significant effect on physical
protection but was positively correlated with chemically and biochemically protected

26
organic C. They suggested that clay content may not always provide a good estimate for
total organic C content in soils. Therefore the effect of clay concentration on residue
decomposition is controversial.
Furthermore, the studies cited were limited to the long term effect of clay in a particular soil
type and were carried out mostly in natural conditions while there are few short-term
studies in a controlled environment. In the field studies, factors such as different soil organic
matter content, climate (temperature and moisture), type of residues and clay minerals will
affect the decomposition rate. Therefore, this experiment was carried out to study the effect
of increasing clay concentration on decomposition of wheat residues under controlled
conditions over a short period of time.
3.2 Materials and methods
To determine the effect of clay concentration on plant residue decomposition, four clay
concentrations were used (%w/w): 5, 10, 20 and 40, and 0% clay was used as control. The
clay used in this experiment was isolated from Wiesenboden soil by the prolonged shaking
method described in Chapter 2.
The clay was mixed with autoclaved commercial sand (53-150 µm, Sloan sand P/L) to which
2% (w/w) of ground mature wheat residue was added. Autoclaved RO water mixed with
microbial suspension was added at a rate equivalent to 4 ml/2 g residue to rewet the sample
to 65% WHC. The amounts of clay, sand, residue, water and microbial suspension for a 15 g
sample for each treatment are shown in Table 3.2.
27
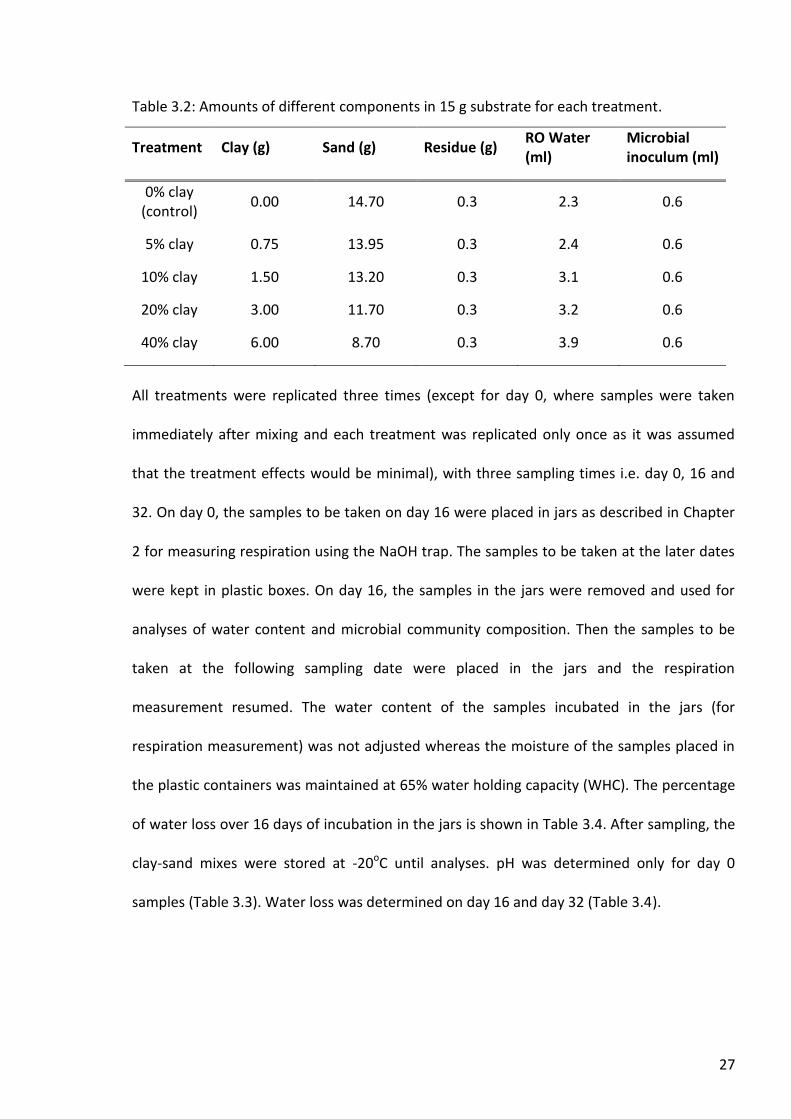
Table 3.2: Amounts of different components in 15 g substrate for each treatment.
Treatment Clay (g) Sand (g) Residue (g) RO Water (ml)
Microbial inoculum (ml)
0% clay (control)
0.00 14.70 0.3 2.3 0.6
5% clay 0.75 13.95 0.3 2.4 0.6
10% clay 1.50 13.20 0.3 3.1 0.6
20% clay 3.00 11.70 0.3 3.2 0.6
40% clay 6.00 8.70 0.3 3.9 0.6
All treatments were replicated three times (except for day 0, where samples were taken
immediately after mixing and each treatment was replicated only once as it was assumed
that the treatment effects would be minimal), with three sampling times i.e. day 0, 16 and
32. On day 0, the samples to be taken on day 16 were placed in jars as described in Chapter
2 for measuring respiration using the NaOH trap. The samples to be taken at the later dates
were kept in plastic boxes. On day 16, the samples in the jars were removed and used for
analyses of water content and microbial community composition. Then the samples to be
taken at the following sampling date were placed in the jars and the respiration
measurement resumed. The water content of the samples incubated in the jars (for
respiration measurement) was not adjusted whereas the moisture of the samples placed in
the plastic containers was maintained at 65% water holding capacity (WHC). The percentage
of water loss over 16 days of incubation in the jars is shown in Table 3.4. After sampling, the
clay-sand mixes were stored at -20oC until analyses. pH was determined only for day 0
samples (Table 3.3). Water loss was determined on day 16 and day 32 (Table 3.4).

28
Table 3.3: pH value of 5, 10, 20 and 40% clay and the control on day 0.
Treatment pH
0% clay 6.63
5% clay 6.78
10% clay 6.98
20% clay 6.99
40% clay 7.05
Table 3.4: Water loss on days 16 and 32 for 5, 10, 20 and 40% clay and the control, expressed in percentage (%) of amount added on day 0.
Sampling day 0% clay 5% clay 10% clay 20% clay 40% clay
16 days 15.6 14.8 14.5 15.6 8.7
32 days 21.5 23.3 19.4 16.9 11.0
3.3 Results
3.3.1 Soil respiration
All treatments showed the greatest respiration rates in the first 2 days of incubation, ranging
from 0.16 – 0.18 mg CO2-C g soil-1 day-1 (Fig. 3.1). The respiration rate decreased by about 50%
from day 2 to day 4 in the control (0% clay) and by 75% in the clay treatments. After that,
the respiration rate decreased slowly to 0.02-0.04 mg CO2-C g soil-1 day-1 on day 18 and then
remained constant. Until day 12, the control had higher respiration rates than the
treatments with clay. However from day 18 onwards, the respiration rate of 40% clay was
higher than the control and the other clay treatments.

29
Figure 3.1: Respiration rate over 32 days (mg CO2-C g soil-1 day-1) for 5, 10, 20 and 40% clay
and the control. Error bars indicate standard deviation (n=3).
Figure 3.2: Cumulative respiration over 32 days (mg cumulative CO2-C g soil-1) for 5, 10, 20
and 40% clay and the control. Error bars indicate standard deviation (n=3).
0.00
0.02
0.04
0.06
0.08
0.10
0.12
0.14
0.16
0.18
0.20
0 2 4 6 8 10 12 14 16 18 20 22 24 26 28 30 32
Me
an m
g C
O2-
C g
so
il-1d
ay-1
day
0% clay 5% clay 10% clay 20% clay 40%clay
0.00
0.20
0.40
0.60
0.80
1.00
1.20
1.40
1.60
1.80
2.00
0 2 4 6 8 10 12 14 16 18 20 22 24 26 28 30 32
Cu
mu
lati
ve m
g C
O2-C
g s
oil-1
day
0% clay 5% clay 10% clay 20% clay 40%clay
30
Cumulative respiration increased gradually over time (Fig. 3.2). For all treatments,
cumulative respiration increased strongly from day 0 to day 6 with values ranging from 0.54
mg CO2-C g soil-1 to 0.73 mg CO2-C g soil-1 soil on day 6. From day 6 onwards, cumulative
respiration increased gradually until day 32 with the highest value (1.67 mg CO2-C g soil-1) for
40% clay and the lowest (1.14 mg CO2-C g soil-1) for the treatment with 10% clay. The
increase in cumulative respiration after day 16 was greater in 40% clay than in the control.
However, overall, the cumulative respiration of the control (0% clay) was higher than
treatments with clay until day 28, after which cumulative respiration of 40% clay was slightly
higher than the control.
Table 3.5: Total C loss on day 32 in percentage of C added in 5, 10, 20 and 40% clay and the control (Standard deviation, n=3).
Treatment C loss (% of C
added) Standard deviation
0% clay 18.60 2.6 5% clay 13.79 2.1
10% clay 12.93 3.1 20% clay 15.30 2.7 40% clay 19.00 2.2
Total C loss (Table 3.5) from wheat residue (43.79% C) at end of the experiment ranged from
12.9% to 19.0% of C added. The C loss decreased in the following order: 40% clay > 0% clay >
20% clay > 5% clay ≥ 10% clay.

31
3.3.2 Microbial community structure
On day 0, the concentration of total PLFAs (as a measure of microbial biomass) was highest
in 40% clay while on day 16, the total PLFA concentration was relatively similar in all
treatments (Table 3.6). Total PLFA concentration increased from day 0 to day 16 in all
treatments except 40% clay where it decreased by about two-thirds. Compared to day 16,
the total PLFA concentration on day 32 had decreased by 10-12% in the control and 5% clay
but increased by up to 50% at the higher clay concentrations.
In treatments with less than 20% clay, the concentration of bacterial fatty acids and fungal
fatty acids differed between sampling days. On day 0, the concentration of both bacterial
and fungal fatty acids was similar, but on day 16, the concentration of bacterial fatty acids
was higher than that of fungi, and the reverse was true on day 32. On the other hand, for
treatments with 20% and 40% clay, the abundance of bacterial fatty acids was higher than of
fungal fatty acids at all sampling days (Table 3.6).
Table 3.6: Concentrations of total PLFAs, bacterial PLFAs and fungal PLFAs on days 0, 16 and
32, expressed as % area of internal standard, in 5, 10, 20 and 40% clay and the control
(Standard deviation, n=3).
Treatment 0% 5% 10% 20% 40%
Day 0 16 32 0 16 32 0 16 32 16 32 0 16 32
Total PLFA 2.40 8.23 6.71 2.12 7.86 6.84 4.52 6.98 10.60 8.14 12.23 22.17 9.17 10.44
Stdev Na 0.19 0.89 na 1.03 1.24 na 3.15 1.14 1.19 0.78 na 1.22 2.37
Total bac 0.84 3.89 1.99 0.71 2.78 2.61 1.61 2.30 2.63 2.39 3.30 5.35 4.01 2.53
Stdev Na 1.59 0.40 na 0.36 1.23 na 0.91 0.34 0.35 0.15 na 2.79 0.46
Total fung 0.80 1.37 3.72 0.77 1.16 3.65 1.47 1.15 3.16 1.18 2.38 3.10 2.14 1.59
Stdev Na 0.57 3.38 na 0.16 2.14 na 0.46 0.42 0.09 0.27 na 1.64 0.22
Note: na = not available

32
Table 3.7: PLFA richness, evenness and diversity on days 0, 16 and 32 in 5, 10, 20 and 40% clay and the control (Standard deviation, n=3).
Treatment/ 0% clay 5% clay 10% clay 20% clay 40% clay
sampling day Richness
Day 0 9.07 8.92 6.52 Na 9.81 Stdev 0.00 0.00 0.00 Na 0.00
Day 16 5.45 9.19 10.78 11.83 11.15 Stdev 0.79 1.77 0.55 0.53 1.95
Day 32 6.32 7.29 8.39 9.39 10.95 Stdev 0.26 1.24 0.46 1.91 0.20
Evenness
Day 0 0.89 0.93 0.92 Na 0.94 Stdev 0.00 0.00 0.00 Na 0.00
Day 16 0.94 0.88 0.89 0.90 0.91 Stdev 0.02 0.01 0.01 0.00 0.01
Day 32 0.92 0.90 0.91 0.92 0.92 Stdev 0.02 0.01 0.01 0.01 0.01
Diversity
Day 0 1.74 1.67 2.02 Na 3.10 Stdev 0.00 0.00 0.00 Na 0.00
Day 16 2.27 2.48 2.57 2.82 2.94 Stdev 0.10 0.19 0.21 0.09 0.08
Day 32 2.27 2.38 2.61 2.80 2.89 Stdev 0.08 0.31 0.07 0.16 0.12
Note: na = not available
The richness of PLFAs was higher on day 16 than on days 0 and 32 in all treatments except
the control (Table 3.7). PLFA richness was similar in 0, 5 and 40% on day 0 and was higher in
all clay treatments compared to the control on day 16. On day 32, PLFA richness increased
with increasing clay concentration. The evenness of PLFAs was similar in all treatments on all
sampling days (Table 3.7). In general, PLFA diversity was also similar for all treatments on all
sampling days but increased slightly with increasing of clay concentration (Table 3.7).
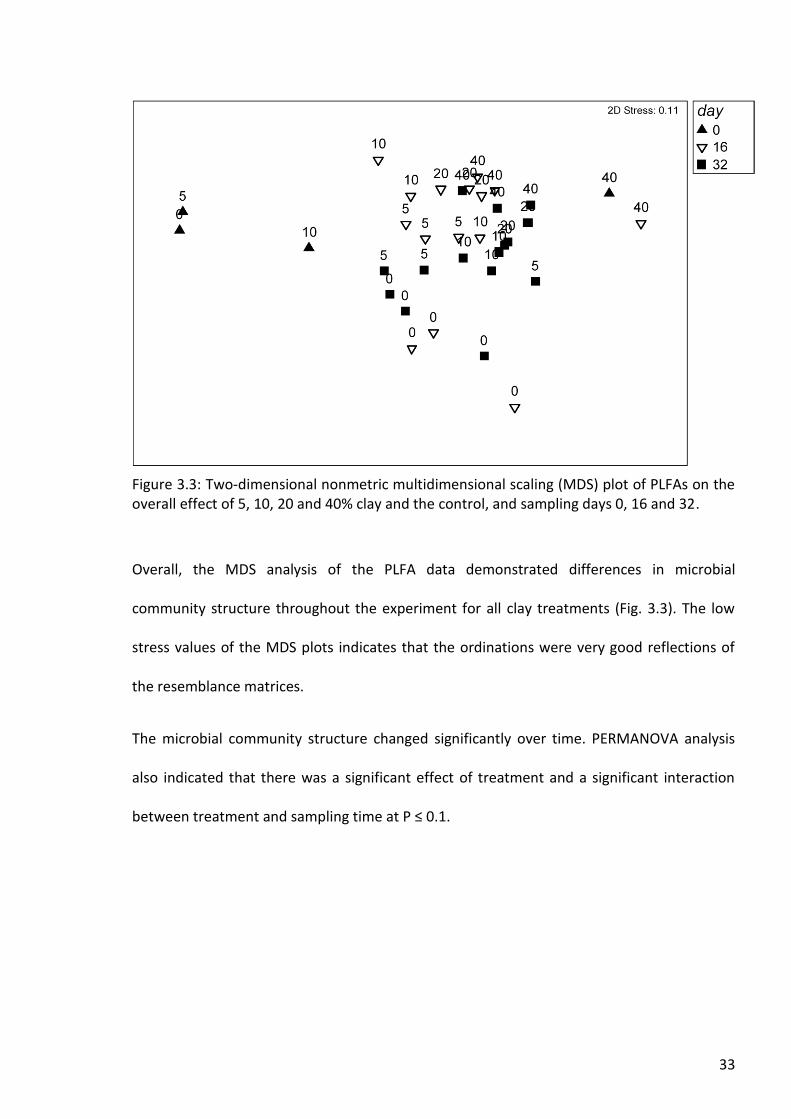
33
Figure 3.3: Two-dimensional nonmetric multidimensional scaling (MDS) plot of PLFAs on the overall effect of 5, 10, 20 and 40% clay and the control, and sampling days 0, 16 and 32.
Overall, the MDS analysis of the PLFA data demonstrated differences in microbial
community structure throughout the experiment for all clay treatments (Fig. 3.3). The low
stress values of the MDS plots indicates that the ordinations were very good reflections of
the resemblance matrices.
The microbial community structure changed significantly over time. PERMANOVA analysis
also indicated that there was a significant effect of treatment and a significant interaction
between treatment and sampling time at P ≤ 0.1.

34
Figure 3.4: Two-dimensional nonmetric multidimensional scaling (MDS) analysis of PLFAs for 5, 10, 20 and 40% clay and the control (0% clay) on day 16.
Figure 3.5: Two-dimensional nonmetric multidimensional scaling (MDS) analysis of PLFAs for 5, 10, 20 and 40% clay and the control on day 32.

35
On day 16, the microbial community structure of the control (0% clay) was significantly
different from that of the 10, 20 and 40% clay treatments (Fig. 3.4). There were also
significant differences in microbial community structure between 5% clay and either 20%
clay or 40% clay (P ≤ 0.1), but no difference between 5% and 0% or 10% clay. On day 32, the
microbial community structure of the control (0% clay) was significantly different from that
of the 10, 20 and 40% clay treatments (Fig. 3.5). There were significant differences in
community structure between 5% clay and 40% clay (P ≤ 0.1), and between 10% clay and 20%
or 40% clay.
3.4 Discussion and conclusion
Overall, the results of this experiment show that the presence of clay affected the
decomposition rate. By adding clay, the cumulative respiration was decreased at least until
day 28. These results are in agreement with previous studies (e.g. Plante et al., 2006; Spain,
1990; Swift et al., 1979) and can be explained by binding of organic matter to the clay. Clay
and organic matter are negatively charged, hence, multivalent cations on the clay mineral
surfaces most likely provide the bridging among clay particles and between clay minerals
and organic matter as well as maintaining the clay particles flocculated (Baldock and
Skjemstad, 2000; Krull et al., 2001; Van Veen and Kuikman, 1990). This binding as well as
entrapment of organic matter between clay minerals protection will decrease
decomposition rate as the organic substrates are physically separated from the
decomposers or their extracellular enzymes (Baldock and Skjemstad, 2000; Krull et al., 2001)
The decomposition rate was similar at 5% and 10%, which had a lower rate than that with
both 20% and 40% clay. Thus, increasing clay concentration did not result in decreasing
decomposition rate, which is in contrast to Ladd et al. (1985) and Spain (1990), while in
agreement with Thomsen et al. (1999). This may be explained by the effect of clay on the
36
water content of the substrate. The water loss after 32 days decreased with increasing clay
concentration (Table 3.4). This suggests that the greater the clay content, the more water is
retained in the substrate. This is in agreement with Marshall et al. (1996), who stated that
the water storage in clayey soil is greater than that of sandy soil and Thomsen et al. (1999)
who found that soils containing more clay hold more microbially available water.
Water is an important factor in decomposition. According to Thomsen et al. (1999), the
decomposition rate of soil C is strongly correlated with water holding capacity and
volumetric water content, whereas clay content alone was not important. Additionally,
respiration rate is related to the availability of water around the microorganisms (Ilstedt et
al., 2000). As water availability decreases, microbial activity will also decrease, thus reducing
mineralization rate; as reported by Raubuch et al. (2002) who found that, regardless of soil
type, drying of soils reduced the respiration rate. This may be due to reduced movement of
decomposers to the substrate and limited diffusion of the substrate to the decomposers or
of enzymes to the substrate.
Therefore, in this experiment, clay affected decomposition rate in two ways. Firstly,
protection of organic matter by sorption and entrapment mechanisms seems to be the
dominating process for all clay treatments in the initial phase and throughout the incubation
period for treatments with less than 20% clay. Secondly, the greater water retention at
higher clay content (particularly 40%) allowed maintenance of higher respiration rates after
day 18.
On day 0, the microbial biomass was greater with 40% clay than in other treatments.
According to Jenkinson (1977) and Sorensen (1983) greater microbial biomass is usually
found in soils with high clay content. In addition, this may be due to microbes in the clay

37
itself. The total microbial biomass per gram Wiesenboden clay was about 33.6% area of
internal standard (Table 2.3, Chapter 2). Thus, the higher clay concentration, the higher the
initial microbial biomass in the substrates.
Overall, the presence of clay and the sampling time had a strong effect on the concentration
of total PLFAs as well as on microbial community structure. Although they strongly affected
the microbial community structure, there was no clear relationship between these factors
and certain microbial groups (i.e. the concentration of bacterial and fungal PLFAs), the
richness or the diversity of the microbial community (Table 3.7).
This suggests that clay does not affect the abundance of bacteria and fungi in general. On
the other hand, clay concentration had an effect on microbial community structure. Thus,
the abundance of certain microorganisms was affected by clay. This could be due to the
effect of clay on (i) organic matter availability, favouring microorganisms that can access
adsorbed or entrapped organic matter, and/or (ii) water availability, enabling growth of
microorganisms that require higher water availability which are unable to survive in lighter-
textured substrates that dry out more quickly.
In conclusion, the presence of Wiesenboden clay initially retarded decomposition of plant
residue at all clay concentrations. However, in the later stages of decomposition,
decomposition rate was increased at high clay concentrations due to the greater water
retention. Generally, clay concentration had an effect on microbial community structure but
not on microbial biomass.
In this experiment, Wiesenboden clay was used which contains smectite. However, this clay
mineral is not present in many Australian soils, whereas illite and kaolinitic clay are major
clay minerals in most Australian soils (Norrish and Pickering, 1983). Therefore, the following

38
chapter will describe an experiment with clay isolated from Red Brown Earth which does not
contain smectite and in which illite and kaolinite are the dominating clay types.

39
Chapter 4
Effect of Red Brown Earth clay concentration
4.1 Introduction
In Chapter 3, the effect of different concentrations of Wiesenboden (W) clay on organic
matter decomposition was described. Red Brown Earths (RBE) are wide-spread in Australia
(Norrish and Pickering, 1983; Northcote, 1981); in South Australia they are often used for
wheat (Thomson et al., 1983) and grape production (Clark, 2004). The effect of its clay on
organic matter decomposition should therefore also be investigated. Illite and kaolinite are
the dominant clay minerals, while smectite is absent. The different properties such as
specific surface area, CEC and ability to swell in the presence of water between illite and
kaolinite, on the one hand, and smectites on the other, are shown in Chapter 3 (see also
Table 3.1) and are likely to influence the effect of clay on decomposition of organic matter.
In the present chapter the effect of clay isolated from Red Brown Earth soil on
decomposition of organic matter is described.
As discussed in Chapter 3, clay concentration is one of the factors that control organic
matter decomposition. However, the clay used in the experiment described in Chapter 3
contains smectite, which has been used in many clay-organic matter studies (e.g. Plante et
al., 2006; Schimel et al., 1985). Although some of previous studies also used kaolinitic soil or
a mixture of pure kaolin and sand (e.g. Kaiser and Zech, 2000; Skene et al., 1996; Skene et al.,
1997), little is known about the effect of the concentration of kaolinitic or illitic clay on plant
residue decomposition. Kaolinite and illite are the dominanting clay minerals in both clay
types (W and RBE) , but smectite occurs only in W clay (Table 2.3, Chapter 2).
40
We hypothesized that the presence of RBE clay would limit the decomposition of organic
matter, but that the reduction of organic matter decomposition would be less pronounced
than for the W clay due to the smaller surface area, lower CEC and different physical
properties of both kaolinite and illite compared to smectite (Table 3.1).
4.2 Materials and methods
The Red Brown Earth clay was isolated by the prolonged shaking method described in
Chapter 2 and the properties are shown in Table 2.3, Chapter 2. The experiment had 5
treatments, namely control (0% clay), 2.5%, 5%, 10% and 20% clay (%w/w). In contrast to
the other experiments described in this thesis, 13C-labelled mature wheat residue (C/N 18)
was used in this experiment to measure the carbon chemistry of the POM by Nuclear
Magnetic Resonance (NMR). However, the NMR analysis had not been conducted by the
time of submission of this thesis due to a prolonged breakdown of the NMR instrument. The
residue was prepared as described in Chapter 2.
The amounts of clay, sand, residue, water and microbial suspension for 15 g substrate for
each treatment are shown in Table 4.1. The sampling was carried out on days 0, 4, 16 and 32,
with four replications for each treatment. The pH of substrate was measured on day 0 (Table
4.2).

41
Table 4.1: Amounts of different components in 15 g substrate for each treatment.
Treatment Clay (g) Sand (g) Residue
(g) RO Water
(ml) Microbial inoculum
(ml)
0% clay (control)
0.00 14.70 0.3 2.30 0.6
2.5% clay 0.38 14.32 0.3 2.35 0.6
5% clay 0.75 13.95 0.3 2.40 0.6
10% clay 1.50 13.20 0.3 3.10 0.6
20% clay 3.00 11.70 0.3 3.20 0.6
Table 4.2: pH values of 2.5, 5, 10 and 20% clay and the control on day 0
Treatment pH
0% clay 6.15
2.5% clay 6.31
5% clay 6.32
10% clay 6.34
20% clay 6.19
The arrangement of the samples was similar as in the experiment described in Chapter 6.
Samples for respiration measurement were kept in jars as described in Chapter 2 and
substrate moisture was not adjusted. The weight of substrates in the jars was measured on
the sampling day to determine water loss. The percentage of water loss over 16 days of
incubation is shown in Table 4.3. The samples for the following periods of respiration
measurement were kept in the plastic boxes and the moisture was maintained at 65% water
holding capacity (WHC).
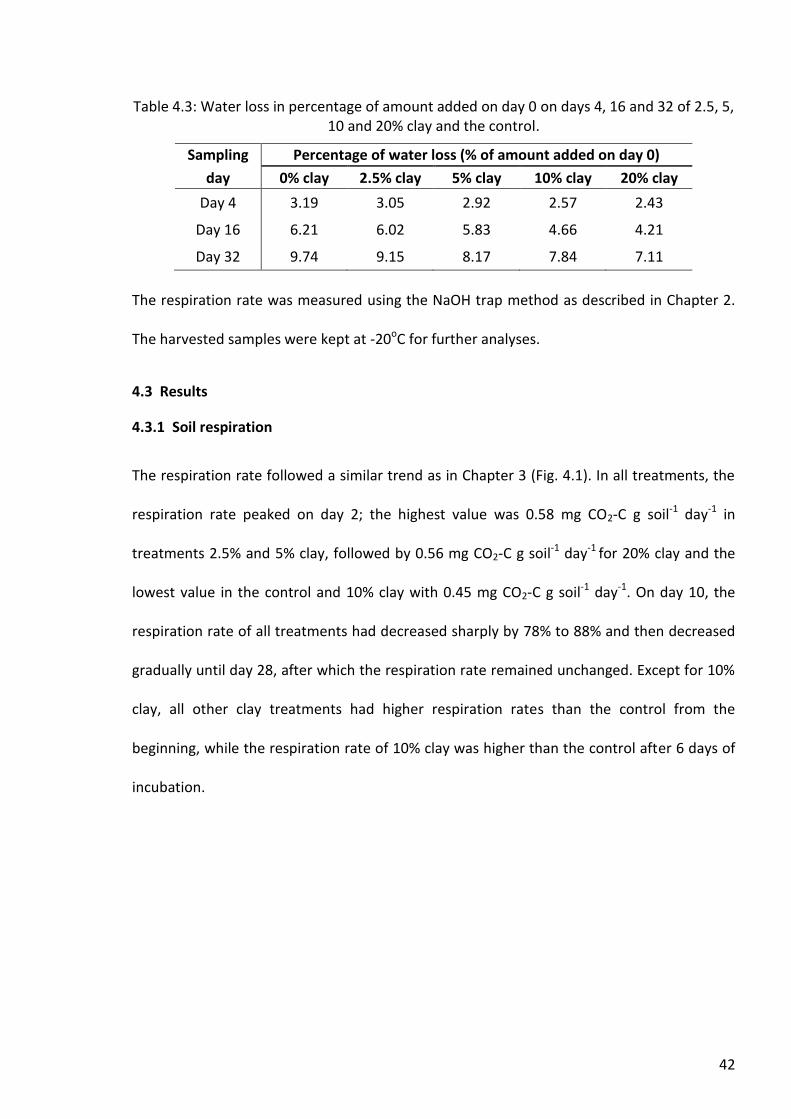
42
Table 4.3: Water loss in percentage of amount added on day 0 on days 4, 16 and 32 of 2.5, 5, 10 and 20% clay and the control.
Sampling Percentage of water loss (% of amount added on day 0)
day 0% clay 2.5% clay 5% clay 10% clay 20% clay
Day 4 3.19 3.05 2.92 2.57 2.43
Day 16 6.21 6.02 5.83 4.66 4.21
Day 32 9.74 9.15 8.17 7.84 7.11
The respiration rate was measured using the NaOH trap method as described in Chapter 2.
The harvested samples were kept at -20oC for further analyses.
4.3 Results
4.3.1 Soil respiration
The respiration rate followed a similar trend as in Chapter 3 (Fig. 4.1). In all treatments, the
respiration rate peaked on day 2; the highest value was 0.58 mg CO2-C g soil-1 day-1 in
treatments 2.5% and 5% clay, followed by 0.56 mg CO2-C g soil-1 day-1 for 20% clay and the
lowest value in the control and 10% clay with 0.45 mg CO2-C g soil-1 day-1. On day 10, the
respiration rate of all treatments had decreased sharply by 78% to 88% and then decreased
gradually until day 28, after which the respiration rate remained unchanged. Except for 10%
clay, all other clay treatments had higher respiration rates than the control from the
beginning, while the respiration rate of 10% clay was higher than the control after 6 days of
incubation.
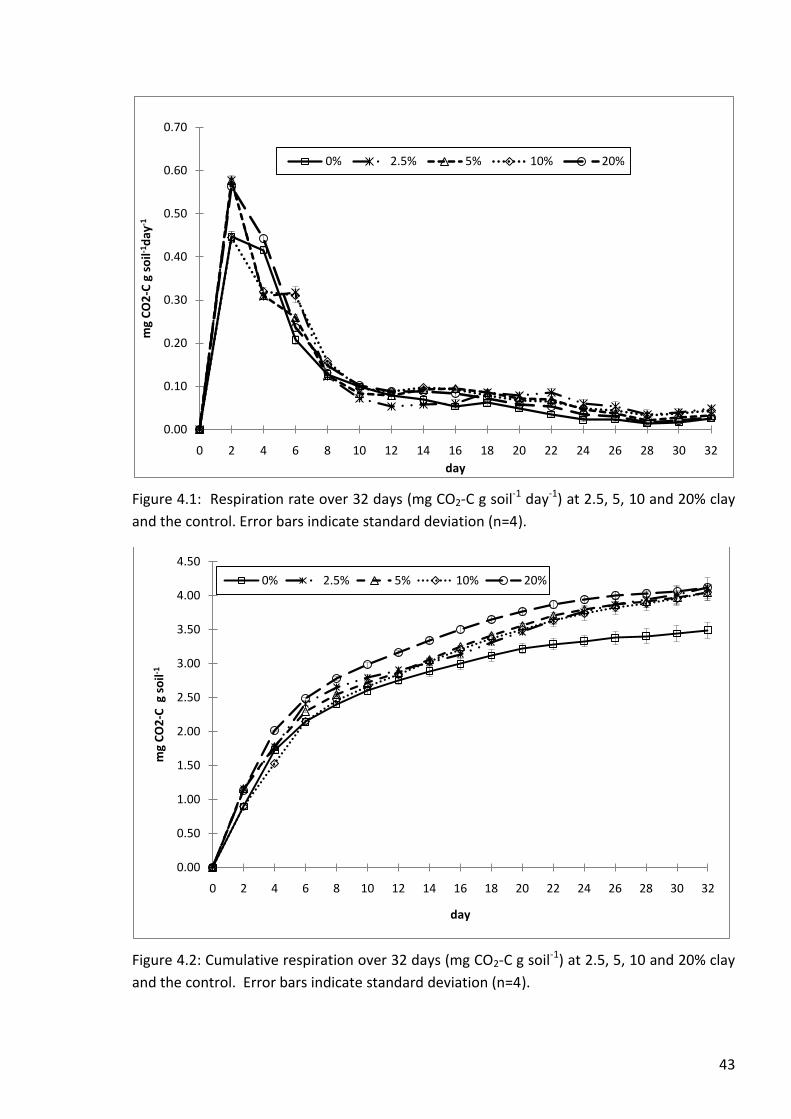
43
Figure 4.1: Respiration rate over 32 days (mg CO2-C g soil-1 day-1) at 2.5, 5, 10 and 20% clay
and the control. Error bars indicate standard deviation (n=4).
Figure 4.2: Cumulative respiration over 32 days (mg CO2-C g soil-1) at 2.5, 5, 10 and 20% clay
and the control. Error bars indicate standard deviation (n=4).
0.00
0.10
0.20
0.30
0.40
0.50
0.60
0.70
0 2 4 6 8 10 12 14 16 18 20 22 24 26 28 30 32
mg
CO
2-C
g s
oil-1
day
-1
day
0% 2.5% 5% 10% 20%
0.00
0.50
1.00
1.50
2.00
2.50
3.00
3.50
4.00
4.50
0 2 4 6 8 10 12 14 16 18 20 22 24 26 28 30 32
mg
CO
2-C
g s
oil-1
day
0% 2.5% 5% 10% 20%

44
Cumulative respiration increased sharply in the first days with 2.14 to 2.48 mg CO2-C g soil-1
on day 6 and then increased more gradually (Fig. 4.2). However, unlike in the previous
experiment, all clay treatments had higher cumulative respiration than the control after the
first 10 days. On day 32, cumulative respiration was 4.0-4.1 mg CO2-C g soil-1 in all clay
treatments and 3.5 mg CO2-C g soil-1 in the control. Until day 24, 20% clay had the highest
cumulative respiration with no difference between the other treatments with clay added.
However, on day 32, there were no differences in cumulative respiration between clay
treatments due to a stronger increase in cumulative respiration in the treatments with 2.5, 5
and 10% clay compared to 20% clay.
Table 4.4: Total C loss on day 32 in percentage of C added in 2.5, 5, 10 and 20% clay and the control (Standard deviation, n=4).
Treatment C loss (% of C
added) Standard deviation
0% clay 45.5 6.0
2.5% clay 53.6 7.4
5% clay 52.7 5.6
10% clay 52.7 5.5
20% clay 53.8 3.0
Total C loss from wheat residue (38.3% C) at end of the experiment ranged from 45.5% to
53.8% of C added (115 mg C). The C loss was similar in all clay treatments but greater than
that in the control.
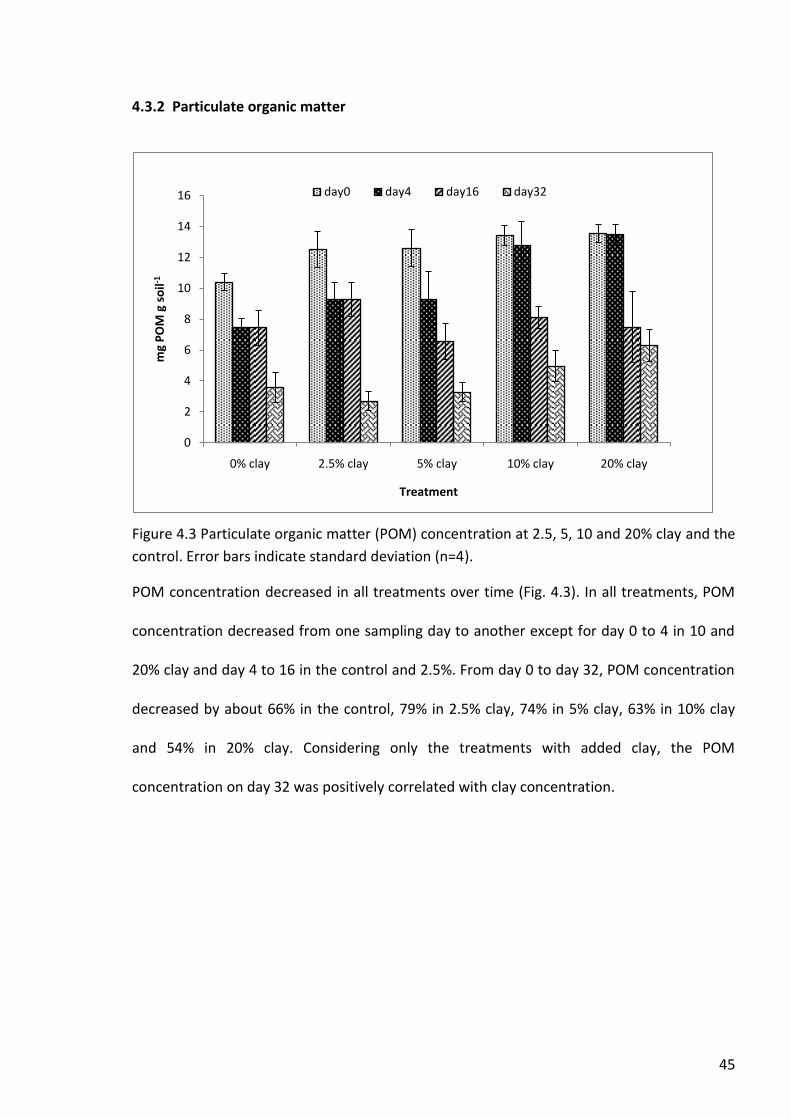
45
4.3.2 Particulate organic matter
Figure 4.3 Particulate organic matter (POM) concentration at 2.5, 5, 10 and 20% clay and the
control. Error bars indicate standard deviation (n=4).
POM concentration decreased in all treatments over time (Fig. 4.3). In all treatments, POM
concentration decreased from one sampling day to another except for day 0 to 4 in 10 and
20% clay and day 4 to 16 in the control and 2.5%. From day 0 to day 32, POM concentration
decreased by about 66% in the control, 79% in 2.5% clay, 74% in 5% clay, 63% in 10% clay
and 54% in 20% clay. Considering only the treatments with added clay, the POM
concentration on day 32 was positively correlated with clay concentration.
0
2
4
6
8
10
12
14
16
0% clay 2.5% clay 5% clay 10% clay 20% clay
mg
PO
M g
so
il-1
Treatment
day0 day4 day16 day32
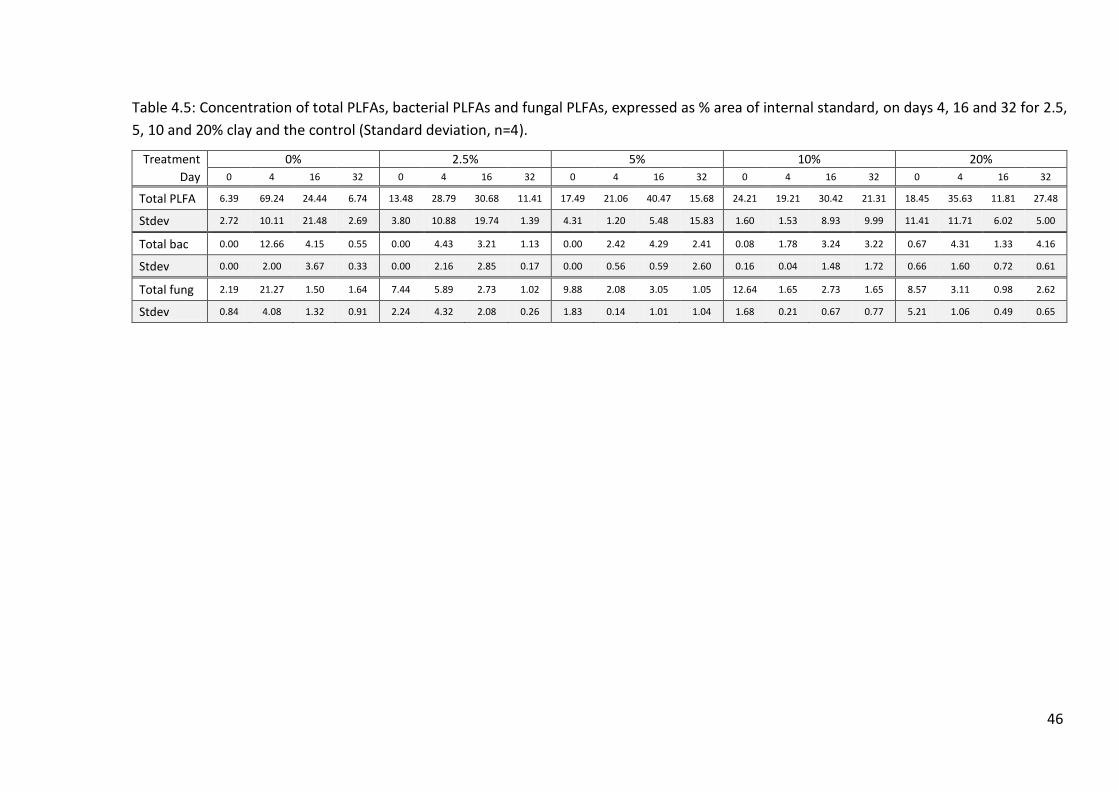
46
Table 4.5: Concentration of total PLFAs, bacterial PLFAs and fungal PLFAs, expressed as % area of internal standard, on days 4, 16 and 32 for 2.5,
5, 10 and 20% clay and the control (Standard deviation, n=4).
Treatment 0% 2.5% 5% 10% 20%
Day 0 4 16 32 0 4 16 32 0 4 16 32 0 4 16 32 0 4 16 32
Total PLFA 6.39 69.24 24.44 6.74 13.48 28.79 30.68 11.41 17.49 21.06 40.47 15.68 24.21 19.21 30.42 21.31 18.45 35.63 11.81 27.48
Stdev 2.72 10.11 21.48 2.69 3.80 10.88 19.74 1.39 4.31 1.20 5.48 15.83 1.60 1.53 8.93 9.99 11.41 11.71 6.02 5.00
Total bac 0.00 12.66 4.15 0.55 0.00 4.43 3.21 1.13 0.00 2.42 4.29 2.41 0.08 1.78 3.24 3.22 0.67 4.31 1.33 4.16
Stdev 0.00 2.00 3.67 0.33 0.00 2.16 2.85 0.17 0.00 0.56 0.59 2.60 0.16 0.04 1.48 1.72 0.66 1.60 0.72 0.61
Total fung 2.19 21.27 1.50 1.64 7.44 5.89 2.73 1.02 9.88 2.08 3.05 1.05 12.64 1.65 2.73 1.65 8.57 3.11 0.98 2.62
Stdev 0.84 4.08 1.32 0.91 2.24 4.32 2.08 0.26 1.83 0.14 1.01 1.04 1.68 0.21 0.67 0.77 5.21 1.06 0.49 0.65

47
4.3.3 Microbial community structure
Microbial biomass (expressed as total PLFAs) was lower on days 0 and 32 than on days 4 and
16 in all treatments. The temporal changes in microbial biomass varied between clay
treatments (Table 4.5). In the control and 20% clay, microbial biomass was greatest on day 4,
while it was greatest on day 16 in the other treatments but barely so in 2.5% clay.
On day 0, microbial biomass was 2-4 times greater in the treatments with added clay than in
the control; among clay treatments it was highest in 10% clay and lowest in 2.5% clay. On
day 4, microbial biomass in the control was two times greater than in 20% clay, while from
2.5 to 10%, microbial biomass increased as the clay concentration increased. On day 16, the
microbial biomass was greatest in 5% clay. The microbial biomass in the control was lower
than in 10% clay and below, but greater than in 20% clay. On day 32, all clay treatments had
greater microbial biomass than the control, with the microbial biomass increasing with
increasing clay concentration.
The concentration of fungal fatty acids in all clay treatments was greater than in control on
day 0 while it varied greatly at the other sampling days. There were no clear differences in
concentration of fungal fatty acids among the clay treatments at any of the sampling days.
Whereas the concentration of bacterial fatty acids increased from day 0 to day 32, the
concentration of fungal fatty acids decreased. In all treatments, the concentration of fungal
fatty acids was greater than that of bacterial fatty acids on day 0 and but, except for the
control, the reverse was true on day 32. Signature PLFAs for bacteria were not detected on
day 0 in treatments with less than 10% clay, with very low concentrations of bacterial fatty
acids in 10 and 20% clay. From day 0 to day 16, the concentration of bacterial fatty acids
increased in all treatments except in 20% clay, where it increased from day 0 to day 4 but

48
then decreased to day 16. From day 16 to day 32, the concentration of bacterial fatty acids
decreased in treatments with 5% clay and below, while it remained similar in 10% clay and
increased in 20% clay.
Table 4.6: PLFA richness, evenness and diversity on days 4, 16 and 32 for 2.5, 5, 10 and 20% clay and the control (Standard deviation, n=4).
Treatment/ control 2.5% 5% 10% 20%
sampling Richness
Day 0 1.10 0.52 0.44 0.59 5.56 Stdev 0.21 0.10 0.04 0.23 6.11 Day 4 3.55 2.64 3.97 4.15 3.80 Stdev 0.16 0.39 1.58 0.37 0.58 Day 16 7.32 4.18 3.50 4.30 5.59 Stdev 5.02 1.57 0.31 0.20 0.70 Day 32 6.82 7.50 3.94 4.42 4.12 Stdev 0.42 0.60 0.41 0.35 0.26
Evenness
Day 0 0.97 0.96 0.96 0.83 0.54 Stdev 0.02 0.00 0.01 0.17 0.07 Day 4 0.71 0.84 0.83 0.86 0.78 Stdev 0.02 0.05 0.07 0.02 0.04 Day 16 0.87 0.78 0.79 0.79 0.82 Stdev 0.06 0.03 0.03 0.02 0.01 Day 32 0.77 0.86 0.91 0.89 0.89 Stdev 0.03 0.02 0.02 0.01 0.01
Diversity
Day 0 0.67 0.67 0.67 0.71 1.03 Stdev 0.01 0.00 0.01 0.04 0.09 Day 4 1.86 1.65 1.66 1.66 1.75 Stdev 0.04 0.13 0.07 0.08 0.08 Day 16 1.88 1.67 1.78 1.84 1.85 Stdev 0.11 0.10 0.06 0.14 0.04 Day 32 1.58 1.93 2.04 2.12 2.08 Stdev 0.22 0.03 0.10 0.06 0.06
There was no clear trend in PLFA richness over time (Table 4.6). PLFA richness increased
from day 0 to day 16 and then remained unchanged in the control, gradually increased over
time in 2.5% clay, and increased from day 0 to day 4 and remained stable thereafter in 5%
and 10% clay while it showed no clear trend over time in 20% clay. On day 0, PLFA richness
was highest in 20% clay. PLFA richness was similar in all treatments on day 4, but it was

49
higher in the control than the other treatments on day 16. On day 32, PLFA richness was
higher in the control and 2.5% clay compared to treatments with ≥5% clay.
The evenness of PLFAs was lower in 20% clay than in the other treatments. In the control,
PLFA diversity was lowest on day 32. In contrast, PLFA diversity in all clay treatments was
higher in later phases of the experiment than at the start.
Figure 4.4: Two-dimensional nonmetric multidimensional scaling (MDS) plot of PLFAs on the overall effect of 2.5, 5, 10 and 20% clay and the control, and sampling days 0, 4, 16 and 32.
In general, the MDS plot (Fig. 4.4) shows that microbial community structure of all
treatments on day 0 was clearly separated from those of days 4, 16 and 32. This was
supported by the PERMANOVA which showed a significant difference between day 0 and the
other sampling days. PERMANOVA indicated that there were significant differences in
microbial community structure between all sampling days except between day 16 and 32 in
the control, day 4 and 16 in 2.5% clay and day 4 and 32 in 5% clay.

50
(a)
(b)

51
(c)
(d)
Figure 4.5: Two-dimensional nonmetric multidimensional scaling (MDS) analysis of PLFAs at 2.5, 5, 10 and 20% clay and the control on day 0 (a), day 4 (b), day 16 (c) and day 32 (d).
MDS plots for the separate sampling times are shown in Figure 4.5. On day 0 and day 4 (Fig.
4.5a, b), the microbial community structure of the control and 20% clay were clearly

52
separated from the other clay treatments. PERMANOVA showed that the microbial
community structure was significantly affected by clay concentration on days 0 and 4. On
day 0, microbial community structure was significantly different between the control and 2.5%
or 5 % clay and between 10% clay and control, 2.5% or 5% clay. All treatments were
significantly different from each other on day 4. On the other hand, in the MDS of day 16 (Fig.
4.5c) there were no apparent differences in microbial community structure between the
treatments, which could be due to the high variability in microbial community structure
within the treatments. Nevertheless, PERMANOVA indicated that the microbial community
structure in 5 and 10% clay was significantly different from that of 20% clay. On day 32 (Fig.
4.5d), the microbial community structure of the control was different from that of the other
treatments. PERMANOVA showed that the microbial community structure of the control was
significantly different from all treatments except 10% clay.
53
4.4 Discussion and conclusion
Among the clay treatments, 20% clay had higher cumulative respiration than 10% clay or less.
These results are in agreement with the experiment with Wiesenboden (W) clay described in
Chapter 3. The greater cumulative respiration with 20% compared to the lower clay
concentrations is probably due to the greater water availability, as discussed in Chapter 3.
In contrast to Chapter 3, where all treatments had similar maximal respiration rates, the
maximal respiration rate of the clay treatments except 10% clay was higher than the control.
This effect of RBE clay on decomposition rate can also be seen in the cumulative respiration:
all clay treatments had greater cumulative respiration than the control after 6 days. This
suggests that the presence of RBE clay did not limit mineralization or protect organic matter
but, instead, increased the decomposition rate. This result is not in agreement with the
hypothesis of this experiment or the results of the experiment with W clay in Chapter 3. This
surprising result may be due to the low C/N ratio residue used in this experiment (section
4.2, Materials and methods). One of the factors influencing the mineralization is plant
residue quality including C/N ratio (Chotte et al., 1998; Lavelle and Spain, 2005; Swift et al.,
1979). Decomposition rate generally increases with decreasing C/N ratio (Swift et al., 1979,
Lavelle and Spain, 2005). Low C/N ratio residue not only contains relatively more N but also
more soluble compounds (Table 2.4, Chapter 2) which could diffuse in the water films within
the substrate mix. Since water loss after 16 days was lower in the clay treatments than the
control (Table 4.6), the higher water availability in the substrate with clay resulted in greater
nutrient availability for the microbial decomposer, thus increasing the respiration rate. The
fact that there was little difference in decomposition rate between 2.5%, 5% and 10% clay
although their water content differed, suggests that there is a range of water contents in
which nutrient diffusion is similar. The higher cumulative respiration of 20% than in the

54
other clay treatments in the first 24 days could be due to a greater diffusion rate at the
higher water content in this treatment, and/or maintenance of generally more favourable
conditions (due to higher water availability) for the microorganisms for a longer time.
Overall, POM concentration decreased over time in all treatments. This demonstrates that
the plant residue was decomposed over time. However unlike cumulative respiration, clay
concentration did not affect POM concentration until day 32. On day 32, considering only
treatments with added clay, POM concentration was positively correlated with clay
concentration, which in agreement with previous studies (e.g. Hook and Burke, 2000;
Needelman et al., 1999). However, this is in contrast to the cumulative respiration which
was highest at 20% clay. These contrasting results may be explained by (i) a stronger loss of
CO2 per unit C decomposed (lower C utilization efficiency) with 20% clay because it is more
difficult to decompose organic matter bound to clay, or (ii) overestimation of POM weight at
high clay concentrations in the substrate because of insufficient separation of POM and clay,
particularly on day 32 when residues are more decomposed and therefore may be more
strongly bound to clay e.g. by bacterial slimes, which would make the separation of POM
from clay more difficult.
Microbial community structure was strongly affected by clay concentration at all sampling
days. As described earlier, water may play an important role in microbial activity. Water
retention in the substrate increased with clay concentration. Thus the microorganisms were
probably more active at greater clay concentration (Raubuch et al., 2002). This may have led
to stronger competition between microbial species and greater changes in residue chemistry
and thus microbial community structure than in treatments with lower clay concentrations.

55
The microbial community structure changed between all sampling days in the treatments
with 10% and 20% clay, while there was no difference in microbial community structure
between day 16 and 32 in the control, day 4 and 16 in 2.5% clay and between day 4 and 32
in 5% clay. This suggests that the effect of time was stronger at higher clay concentration,
which is different from the experiment with W clay (Chapter 3), where sampling time
strongly affected microbial community structure in all clay treatments. At the early stages of
the experiment, where water availability was quite similar between treatments, the
differences in microbial community structure between clay concentrations for both clay
types (W and RBE), are probably related to differences in substrate availability (amount of
free compared to bound organic matter). In the later stages of the incubation, the
differences in microbial community structure between clay treatments are most likely due
to differences in water availability. Wiesenboden clay can retain water better than RBE clay
due to the presence of smectite which can swell thus retaining water in between the layers
(Marshall et al., 1996; Sanyal, 2000), whereas illite and kaolinite do not swell. As a result, the
effect of time on microbial community structure was more pronounced in W clay than in
RBE clay. The greater microbial biomass in all treatments with added clay compared to the
control on day 0 indicates that addition of clay increased the microbial biomass in the
substrate because the clay itself contained microorganisms (Table 2.3, Chapter 2). Whereas
no clear difference in microbial biomass between clay treatments occurred on days 4 to 16,
there was a positive relationship between microbial biomass and clay concentration on day
32 (Table 4.5). This suggests that the clay concentration only affected microbial biomass in
the later stage of incubation. This effect may be due to the increasing water content with
increasing clay concentration allowing the microbial biomass to remain high towards the
end of incubation.
56
There was no clear relationship between individual microbial groups (fungal or bacterial
fatty acids) and the RBE clay concentration throughout the experiment, however on day 0 all
treatments with added clay had a higher concentration of fungal fatty acids than the control,
which suggests that the clay isolated from RBE contained a relatively high amount of fungi.
This result differed from that in W clay where, compared to the control, the concentration of
bacterial fatty acids was higher than of fungal fatty acids on day 0 at 20% and 40% clay. Thus,
the clay isolated from the Wiesenboden soil was dominated by bacteria.
The abundance of certain microbial groups in all clay treatments changed over time which is
different from the experiment with W clay where there was no clear relationship between
sampling time and microbial groups. In the present experiment, the communities were
initially dominated by fungi, but bacteria dominated later when clay was present. This
suggests that once the clay was mixed with the sand and the residues, bacteria became
more competitive than fungi, which could be due to the addition of residues which supplied
readily available substrates. On day 32, the concentration of bacterial fatty acids was greater
in the treatments with added clay than in the control, thus bacterial growth was favoured by
the presence of clay, which could be due to greater availability of water.
On the other hand, the presence of clay and sampling time had no effect on the richness and
the diversity of microbial community. Thus, although the composition of the microbial
community changed over time, the number of species remained stable.
In conclusion, when comparing only treatments with added clay, the results presented here
are in agreement with the results with W clay: decomposition rate was greater at higher
concentration of RBE clay due to greater water availability. However, in contrast to the W
clay, RBE clay stimulated the decomposition rate instead of retarding it. This may be due to

57
the low C/N residue used in this experiment. With respect to the effect on microorganisms,
RBE clay affected microbial community structure which changed over time, while microbial
biomass was only affected in the later stages of incubation period. Generally, high
concentrations of RBE clay increased the concentration of POM on day 32, but this could be
an analytical artifact.
However, the differences between the results described in this chapter and Chapter 3 may
not be solely due to differences in clay mineralogy between RBE and W clay since different
residues were used in the two experiments: a high C/N wheat residue in the experiment
with W clay and a low C/N residue in the experiment with RBE clay. Therefore, to allow a
direct comparison of the two clay types, the experiment described in Chapter 5 was carried
out in which the same residue (high C/N wheat residue) was added to both clay types.
The effect of clay on decomposition and microbial community structure may not only be due
to the crystalline clay type or clay concentration but also to the presence of metal oxides
such as iron oxide attached to the clay particles. Therefore, in the following chapter, two
clay fractions were used, natural clay and clay from which iron oxides were partially
removed.

58
Chapter 5
Effect of iron oxides and clay concentration
5.1 Introduction
The accessibility of organic matter to the decomposer community may affect the
decomposition process (Baldock and Skjemstad, 2000). In part, the accessibility of organic
matter is controlled by protection of the organic matter and the distribution of the
decomposer community; both of which are influenced by the presence of clay (Hassink, 1997;
Oades, 1989).
One important factor influencing the capacity of clay minerals to potentially protect organic
matter is the presence of metal compounds such as iron oxides (which include iron
oxyhydroxides) (Baldock and Skjemstad, 2000; Krull et al., 2001). Iron oxide is often
intimately associated with clay minerals by coating the clay mineral particles (Favre et al.,
2006). In soils, clay minerals are negatively charged (Dixon, 1990; Krull et al., 2001; Farve et
al., 2006). Therefore, positively charged iron oxide coatings may partly compensate the
negative charge of the clay (Zhuang and Yu, 2002), thus stabilizing the clay minerals
(Churchman et al., 1993) and inducing clay flocculation that reduces the exposure of organic
matter to biological attack by entrapment of organic matter in flocculated clay (Baldock and
Skjemstad, 2000). Iron oxide also provides cation bridges between clay and organic matter
(Krull et al., 2001). A positive relationship between the iron oxide content and soil organic
matter content was shown by Spain et al. (1983) and Oades (1988).
Thus, removal of iron oxide is likely to have a profound effect on the interaction of
negatively charged clay surfaces with negatively charged organic matter. In a smectite-
kaolinite clay fraction, removal of iron oxide from clay mineral surfaces increased cation
capacity exchange (CEC) which reduced the stability of clay surface charge (Favre et al., 2006)
59
and caused dispersion of clay particles (Turchenek and Oades, 1979), thereby reducing the
capacity of the clay to physically protect organic matter by entrapment. In addition, the
absence of iron oxides on the clay mineral surfaces may reduce the ability of clay to bind the
organic matter by cation bridging.
The importance of iron oxide on organic matter protection has been studied previously
(Baldock and Skjemstad, 2000; Krull et al., 2001; Oades, 1988), however no studies appear to
have been carried out to investigate the effect of iron oxide on decomposition of organic
matter and microbial community structure under controlled conditions by comparing natural
clay with iron oxide and clay from which iron oxide was partially removed. Therefore, this
experiment was carried out to determine the effect of iron oxide on the decomposition of
wheat residue and microbial community structure under controlled conditions using
different concentrations of isolated natural clay. The hypotheses were that partial removal
of iron oxide from clay mineral surfaces would (i) increase the decomposition rate at a range
of clay concentrations, and (ii) change microbial community structure because of its effect
on substrate availability.
5.2 Materials and methods
In this experiment, two fractions of Wiesenboden clay were used i.e. clay with iron oxide
(natural clay) and clay from which iron oxide had been partially removed (Citrate-Dithionite
clay) by prolonged shaking and citrate-dithionite-bicarbonate method, respectively, as
described in Chapter 2. The iron (Fe2O3) concentrations of the natural and Citrate-Dithionite
clay were 8.78% and 6.23% respectively (Table 2.3, Chapter2)
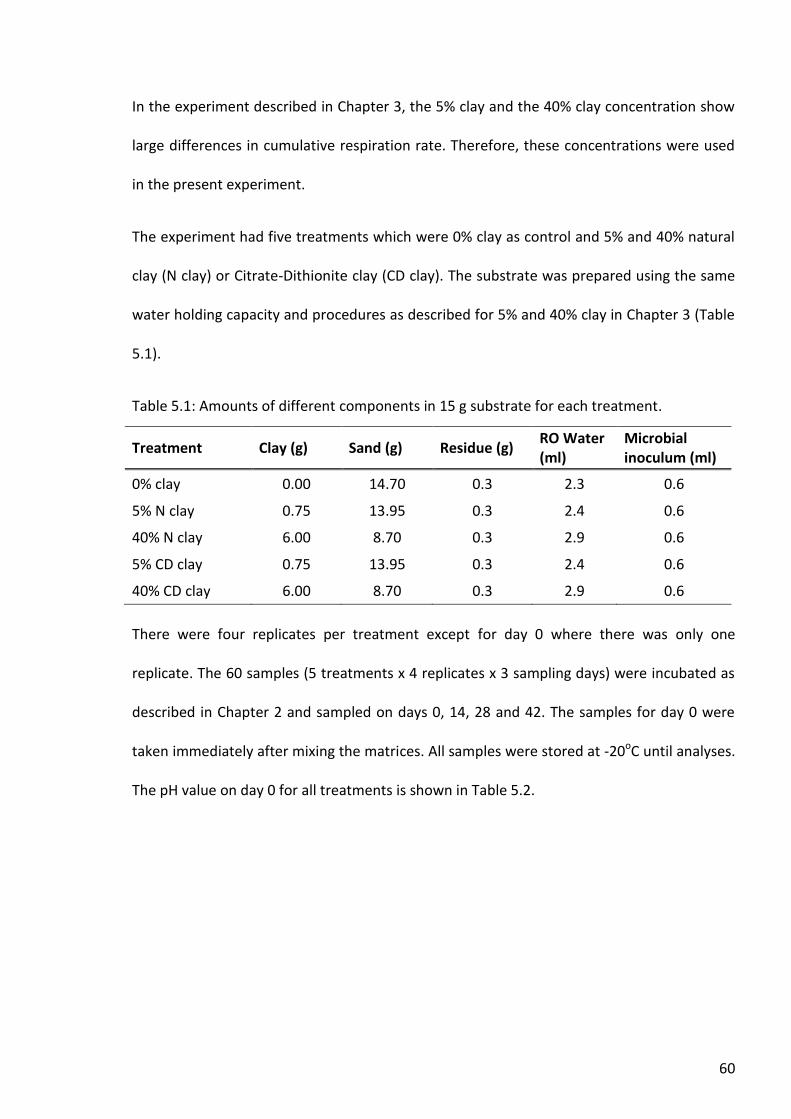
60
In the experiment described in Chapter 3, the 5% clay and the 40% clay concentration show
large differences in cumulative respiration rate. Therefore, these concentrations were used
in the present experiment.
The experiment had five treatments which were 0% clay as control and 5% and 40% natural
clay (N clay) or Citrate-Dithionite clay (CD clay). The substrate was prepared using the same
water holding capacity and procedures as described for 5% and 40% clay in Chapter 3 (Table
5.1).
Table 5.1: Amounts of different components in 15 g substrate for each treatment.
Treatment Clay (g) Sand (g) Residue (g) RO Water (ml)
Microbial inoculum (ml)
0% clay 0.00 14.70 0.3 2.3 0.6
5% N clay 0.75 13.95 0.3 2.4 0.6
40% N clay 6.00 8.70 0.3 2.9 0.6
5% CD clay 0.75 13.95 0.3 2.4 0.6
40% CD clay 6.00 8.70 0.3 2.9 0.6
There were four replicates per treatment except for day 0 where there was only one
replicate. The 60 samples (5 treatments x 4 replicates x 3 sampling days) were incubated as
described in Chapter 2 and sampled on days 0, 14, 28 and 42. The samples for day 0 were
taken immediately after mixing the matrices. All samples were stored at -20oC until analyses.
The pH value on day 0 for all treatments is shown in Table 5.2.

61
Table 5.2: pH value on day 0 for 0, 5 or 40% clay either with iron oxide (N clay) or iron oxide partially removed (CD clay).
Treatment pH
0% clay 7.02
5% N clay 7.04
40% N clay 7.03
5% CD clay 8.07
40% CD clay 8.42
The replicates to be sampled on day 14 were kept in jars for respiration measurement as
described in Chapter 2 while the other replicates (to be sampled on days 28 and 42) were
kept separately in two plastic containers with vials containing RO water to maintain the
substrate moisture. The substrate moisture of the samples in the plastic containers was
maintained at 65% of water holding capacity by adding RO water every alternate day.
Substrate moisture of the replicates used for respiration measurement was not adjusted and
the water loss was measured for each sampling. The average water loss for the different
sampling dates is shown in Table 5.3.
The respiration rate of the samples in the jars was measured using the NaOH trap method as
described in Chapter 2 and replicates were harvested on day 14. The harvested samples
were stored at -20oC for POM and PLFA analyses. Then, a new set of samples was placed into
jars (for respiration measurement over 14 days and determination of POM and PLFA on day
28). This process was repeated on day 28 for the replicates to be harvested on day 42.
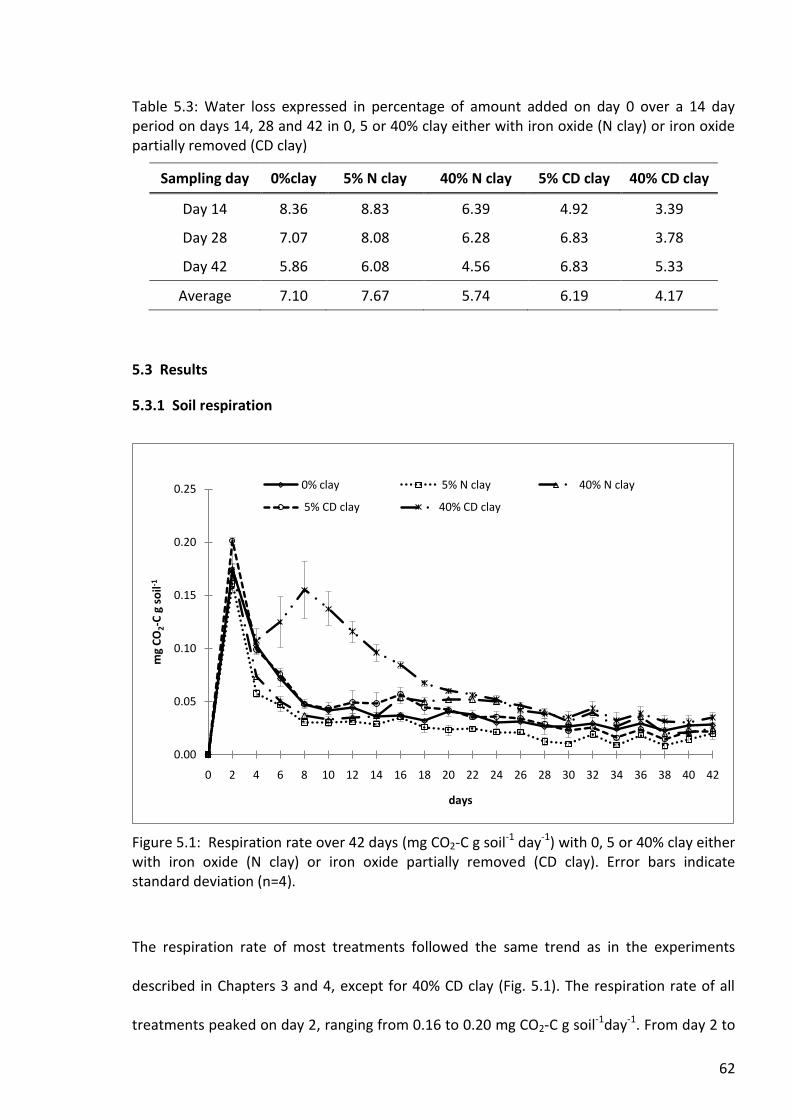
62
Table 5.3: Water loss expressed in percentage of amount added on day 0 over a 14 day period on days 14, 28 and 42 in 0, 5 or 40% clay either with iron oxide (N clay) or iron oxide partially removed (CD clay)
Sampling day 0%clay 5% N clay 40% N clay 5% CD clay 40% CD clay
Day 14 8.36 8.83 6.39 4.92 3.39
Day 28 7.07 8.08 6.28 6.83 3.78
Day 42 5.86 6.08 4.56 6.83 5.33
Average 7.10 7.67 5.74 6.19 4.17
5.3 Results
5.3.1 Soil respiration
Figure 5.1: Respiration rate over 42 days (mg CO2-C g soil-1 day-1) with 0, 5 or 40% clay either with iron oxide (N clay) or iron oxide partially removed (CD clay). Error bars indicate standard deviation (n=4).
The respiration rate of most treatments followed the same trend as in the experiments
described in Chapters 3 and 4, except for 40% CD clay (Fig. 5.1). The respiration rate of all
treatments peaked on day 2, ranging from 0.16 to 0.20 mg CO2-C g soil-1day-1. From day 2 to
0.00
0.05
0.10
0.15
0.20
0.25
0 2 4 6 8 10 12 14 16 18 20 22 24 26 28 30 32 34 36 38 40 42
mg
CO
2-C
g s
oil-1
days
0% clay 5% N clay 40% N clay
5% CD clay 40% CD clay

63
day 4, the respiration rate fell sharply to about 41% and 50% of the rate on day 2 in the
control and the treatments with added clay except 40% CD clay. In all treatments except 40%
CD clay, the respiration rate decreased gradually from day 4 to day 8 to 0.03-0.05 mg CO2-C
g soil-1 day-1 and became steady after day 8 until end of the incubation. In 40% CD clay, a
second peak occurred on day 8 with respiration rates about 50% higher than on day 4. After
day 8, the respiration rate in this treatment decreased gradually to values similar as in the
other treatments on day 22.
Figure 5.2: Cumulative respiration in treatments over 42 (mg cumulative CO2-C g soil-1) days with 0, 5 or 40% clay either with iron oxide (N clay) or iron oxide partially removed (CD clay). Error bars indicate standard deviation (n=4).
There was a steady increase in cumulative respiration for all treatments (Fig. 5.2). Until day 6,
the cumulative respiration of all treatments was similar and increased gradually with values
ranging from 0.5 to 0.8 mg CO2-C g soil-1 on day 6, followed by a slower increase for the
0.00
0.50
1.00
1.50
2.00
2.50
3.00
3.50
0 2 4 6 8 10 12 14 16 18 20 22 24 26 28 30 32 34 36 38 40 42
cum
ula
tive
mg
CO
2-C
g s
oil
-1
days
0% clay 5% N clay 40% N clay
5% CD clay 40% CD clay
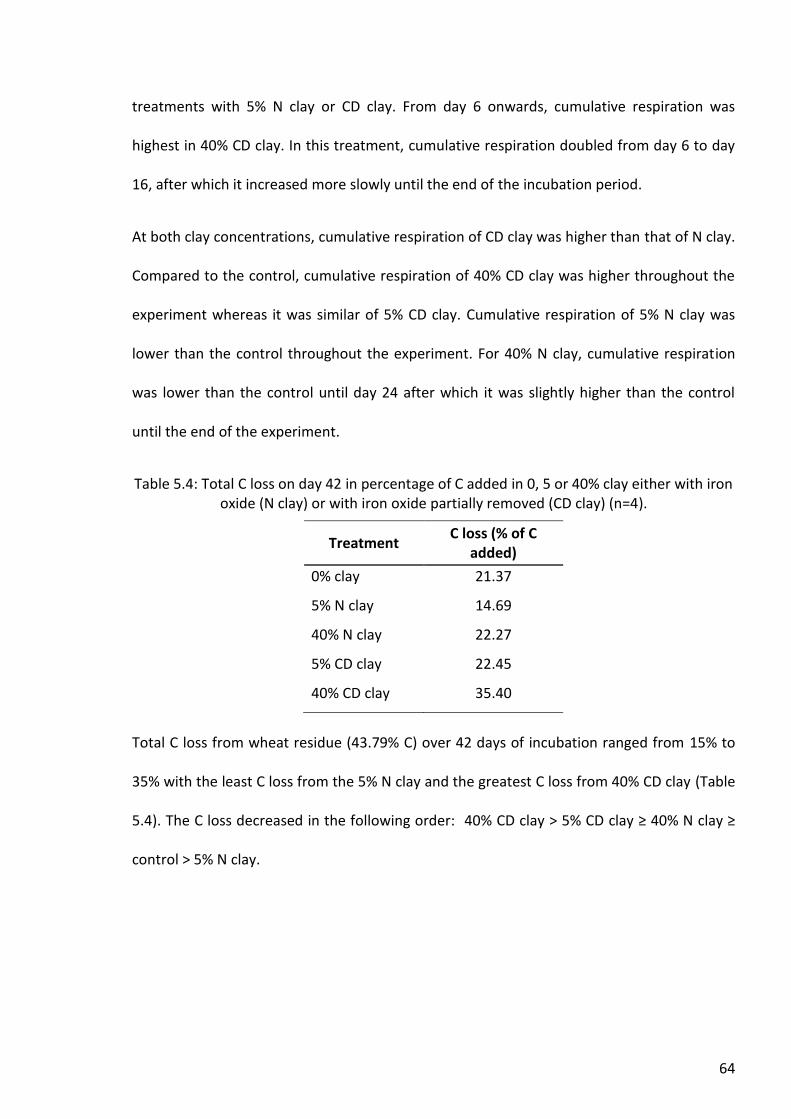
64
treatments with 5% N clay or CD clay. From day 6 onwards, cumulative respiration was
highest in 40% CD clay. In this treatment, cumulative respiration doubled from day 6 to day
16, after which it increased more slowly until the end of the incubation period.
At both clay concentrations, cumulative respiration of CD clay was higher than that of N clay.
Compared to the control, cumulative respiration of 40% CD clay was higher throughout the
experiment whereas it was similar of 5% CD clay. Cumulative respiration of 5% N clay was
lower than the control throughout the experiment. For 40% N clay, cumulative respiration
was lower than the control until day 24 after which it was slightly higher than the control
until the end of the experiment.
Table 5.4: Total C loss on day 42 in percentage of C added in 0, 5 or 40% clay either with iron oxide (N clay) or with iron oxide partially removed (CD clay) (n=4).
Treatment C loss (% of C
added)
0% clay 21.37
5% N clay 14.69
40% N clay 22.27
5% CD clay 22.45
40% CD clay 35.40
Total C loss from wheat residue (43.79% C) over 42 days of incubation ranged from 15% to
35% with the least C loss from the 5% N clay and the greatest C loss from 40% CD clay (Table
5.4). The C loss decreased in the following order: 40% CD clay > 5% CD clay ≥ 40% N clay ≥
control > 5% N clay.
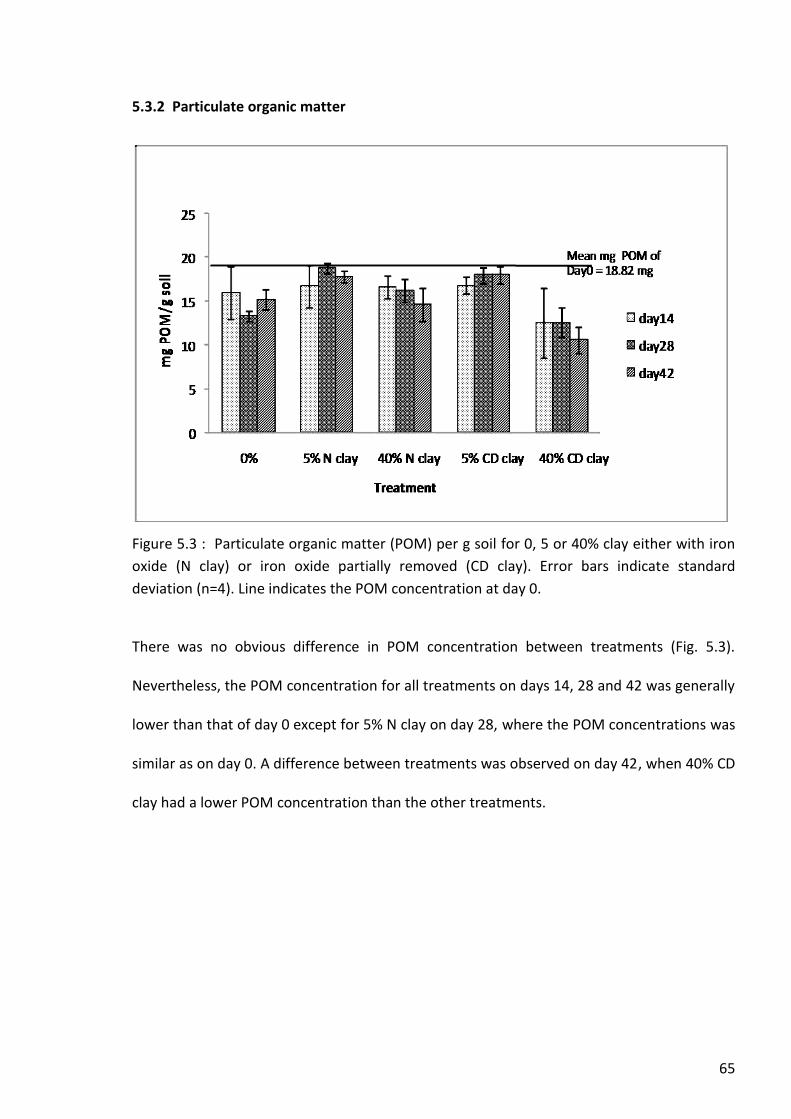
65
5.3.2 Particulate organic matter
Figure 5.3 : Particulate organic matter (POM) per g soil for 0, 5 or 40% clay either with iron
oxide (N clay) or iron oxide partially removed (CD clay). Error bars indicate standard
deviation (n=4). Line indicates the POM concentration at day 0.
There was no obvious difference in POM concentration between treatments (Fig. 5.3).
Nevertheless, the POM concentration for all treatments on days 14, 28 and 42 was generally
lower than that of day 0 except for 5% N clay on day 28, where the POM concentrations was
similar as on day 0. A difference between treatments was observed on day 42, when 40% CD
clay had a lower POM concentration than the other treatments.

66
5.3.3 Microbial community structure
The microbial biomass as indicated by the sum of PLFAs was influenced by the clay
concentration on days 0 and 14, but not on the following sampling days for N clay
treatments. The microbial biomass was greater in 40% N clay than in 5% N clay on days 0 and
14 while it was similar at both concentrations on days 28 and 42. However, the CD clay
concentration had an effect on microbial biomass on all sampling days. The microbial
biomass was 2 to 3 fold greater in 40% CD clay than that of 5% CD clay at all sampling days
(Table 5.5). The high biomass based on PLFAs in 40% CD was supported by the observation
of a dense fungal hyphal mat on the surface of the 40% CD clay treatments (Fig. 5.4b).
Overall, the abundance of bacterial signature PLFAs was greater than of fungal fatty acids in
all treatments on all sampling days (Table 5.5). However, the abundance of fungal fatty acids
was higher in the 40% CD clay than in the other clay treatments, which is also in agreement
with the occurrence of the hyphal mat on the surface of this treatment.
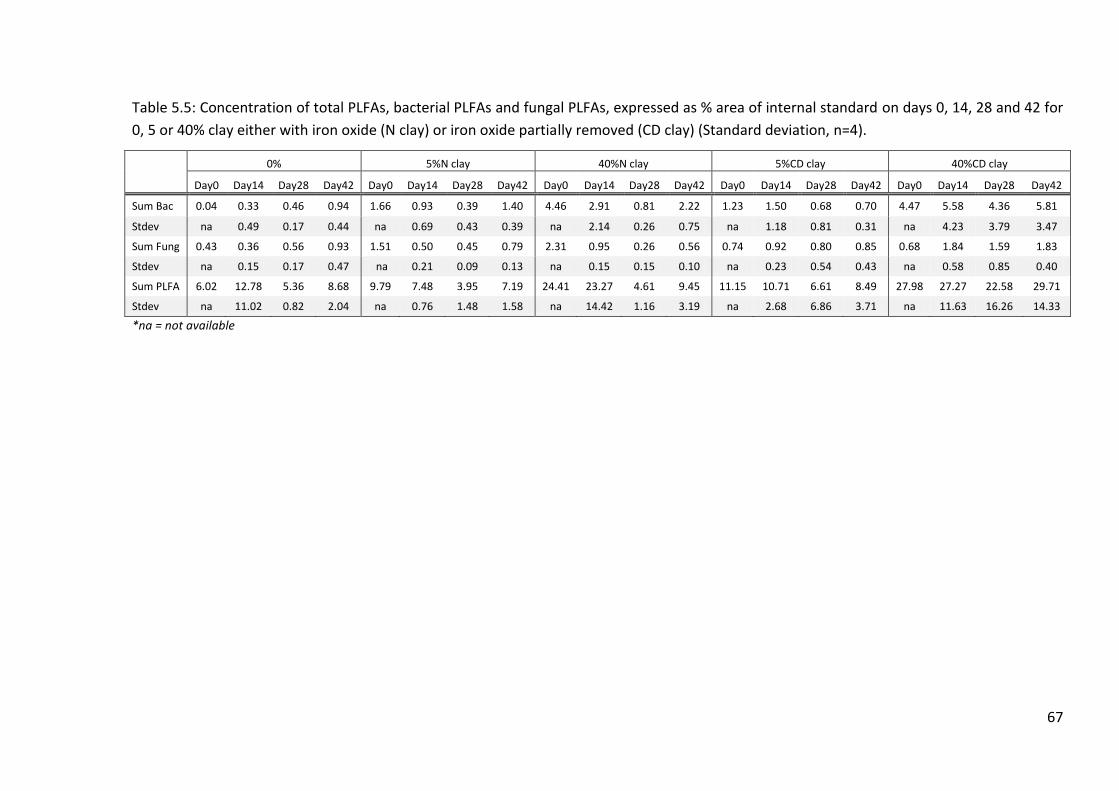
67
Table 5.5: Concentration of total PLFAs, bacterial PLFAs and fungal PLFAs, expressed as % area of internal standard on days 0, 14, 28 and 42 for
0, 5 or 40% clay either with iron oxide (N clay) or iron oxide partially removed (CD clay) (Standard deviation, n=4).
0% 5%N clay 40%N clay 5%CD clay 40%CD clay
Day0 Day14 Day28 Day42 Day0 Day14 Day28 Day42 Day0 Day14 Day28 Day42 Day0 Day14 Day28 Day42 Day0 Day14 Day28 Day42
Sum Bac 0.04 0.33 0.46 0.94 1.66 0.93 0.39 1.40 4.46 2.91 0.81 2.22 1.23 1.50 0.68 0.70 4.47 5.58 4.36 5.81
Stdev na 0.49 0.17 0.44 na 0.69 0.43 0.39 na 2.14 0.26 0.75 na 1.18 0.81 0.31 na 4.23 3.79 3.47
Sum Fung 0.43 0.36 0.56 0.93 1.51 0.50 0.45 0.79 2.31 0.95 0.26 0.56 0.74 0.92 0.80 0.85 0.68 1.84 1.59 1.83
Stdev na 0.15 0.17 0.47 na 0.21 0.09 0.13 na 0.15 0.15 0.10 na 0.23 0.54 0.43 na 0.58 0.85 0.40
Sum PLFA 6.02 12.78 5.36 8.68 9.79 7.48 3.95 7.19 24.41 23.27 4.61 9.45 11.15 10.71 6.61 8.49 27.98 27.27 22.58 29.71
Stdev na 11.02 0.82 2.04 na 0.76 1.48 1.58 na 14.42 1.16 3.19 na 2.68 6.86 3.71 na 11.63 16.26 14.33
*na = not available
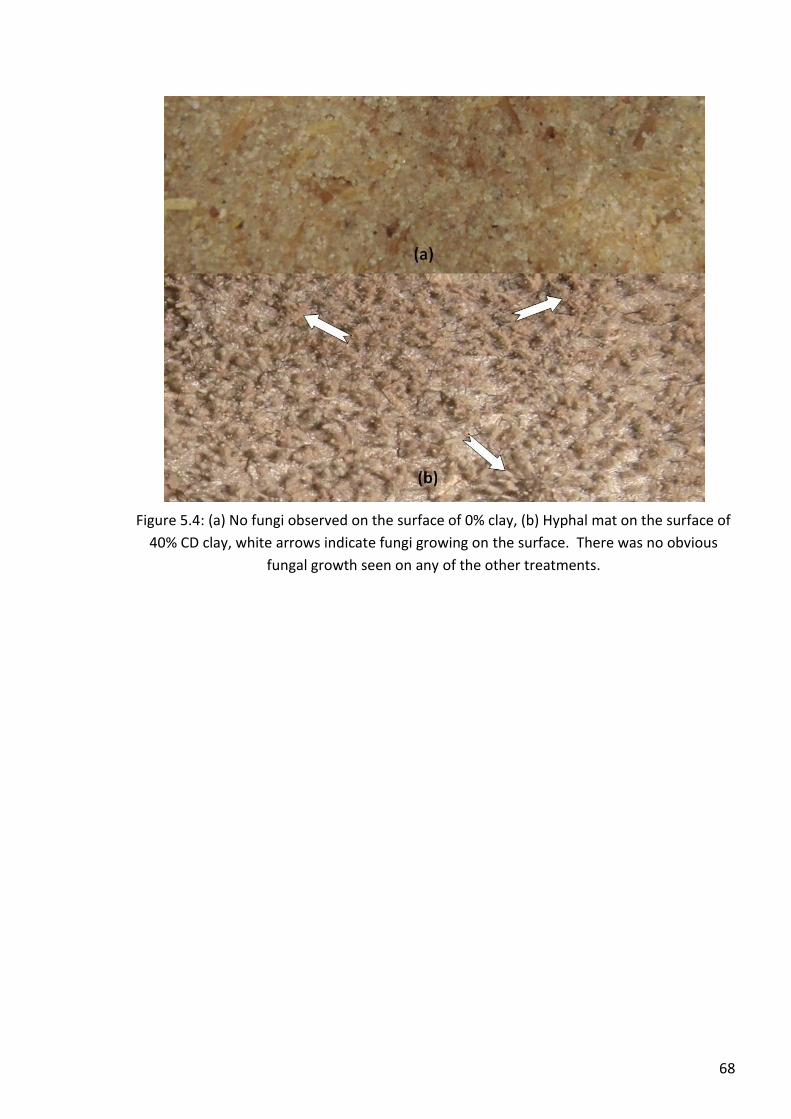
68
Figure 5.4: (a) No fungi observed on the surface of 0% clay, (b) Hyphal mat on the surface of
40% CD clay, white arrows indicate fungi growing on the surface. There was no obvious
fungal growth seen on any of the other treatments.
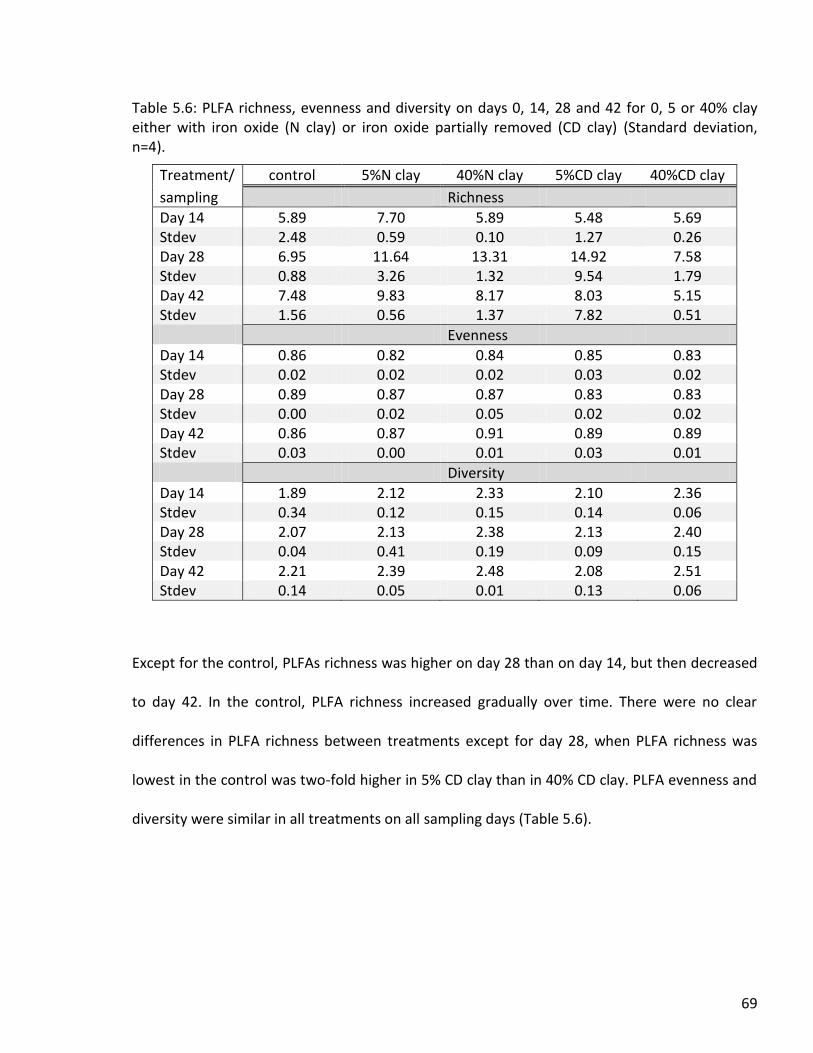
69
Table 5.6: PLFA richness, evenness and diversity on days 0, 14, 28 and 42 for 0, 5 or 40% clay either with iron oxide (N clay) or iron oxide partially removed (CD clay) (Standard deviation, n=4).
Treatment/ control 5%N clay 40%N clay 5%CD clay 40%CD clay
sampling Richness
Day 14 5.89 7.70 5.89 5.48 5.69 Stdev 2.48 0.59 0.10 1.27 0.26 Day 28 6.95 11.64 13.31 14.92 7.58 Stdev 0.88 3.26 1.32 9.54 1.79 Day 42 7.48 9.83 8.17 8.03 5.15 Stdev 1.56 0.56 1.37 7.82 0.51
Evenness
Day 14 0.86 0.82 0.84 0.85 0.83 Stdev 0.02 0.02 0.02 0.03 0.02 Day 28 0.89 0.87 0.87 0.83 0.83 Stdev 0.00 0.02 0.05 0.02 0.02 Day 42 0.86 0.87 0.91 0.89 0.89 Stdev 0.03 0.00 0.01 0.03 0.01
Diversity
Day 14 1.89 2.12 2.33 2.10 2.36 Stdev 0.34 0.12 0.15 0.14 0.06 Day 28 2.07 2.13 2.38 2.13 2.40 Stdev 0.04 0.41 0.19 0.09 0.15 Day 42 2.21 2.39 2.48 2.08 2.51 Stdev 0.14 0.05 0.01 0.13 0.06
Except for the control, PLFAs richness was higher on day 28 than on day 14, but then decreased
to day 42. In the control, PLFA richness increased gradually over time. There were no clear
differences in PLFA richness between treatments except for day 28, when PLFA richness was
lowest in the control was two-fold higher in 5% CD clay than in 40% CD clay. PLFA evenness and
diversity were similar in all treatments on all sampling days (Table 5.6).
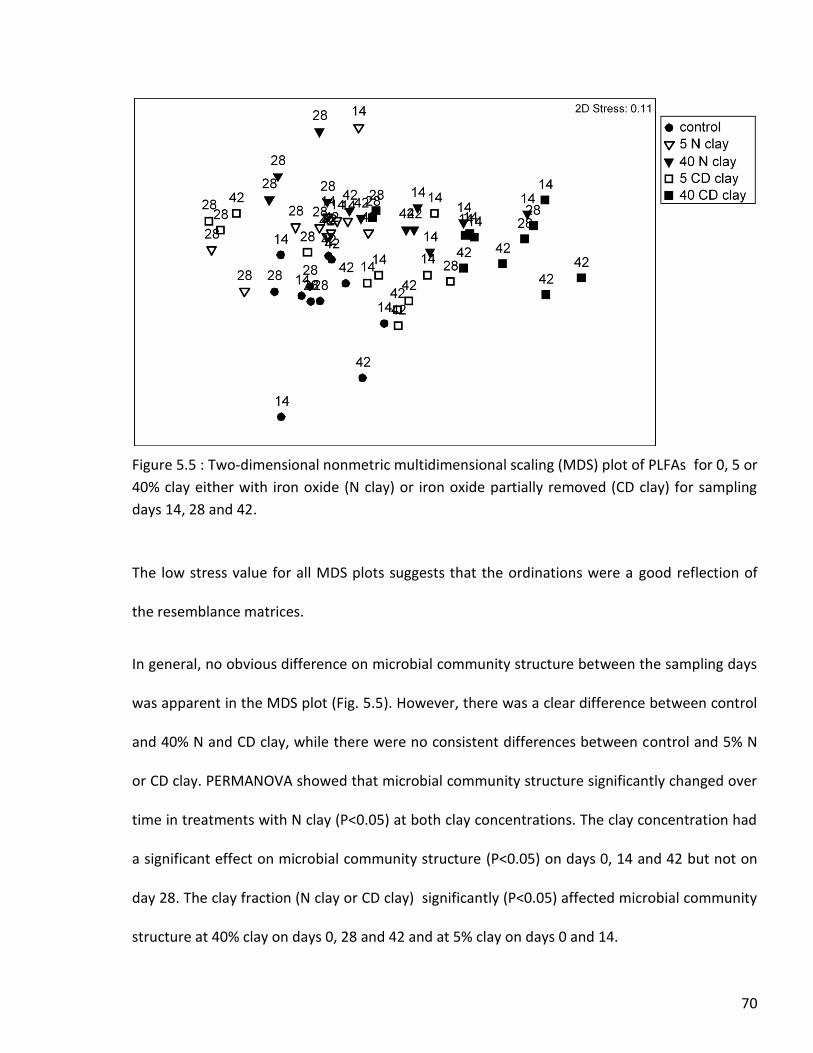
70
Figure 5.5 : Two-dimensional nonmetric multidimensional scaling (MDS) plot of PLFAs for 0, 5 or
40% clay either with iron oxide (N clay) or iron oxide partially removed (CD clay) for sampling
days 14, 28 and 42.
The low stress value for all MDS plots suggests that the ordinations were a good reflection of
the resemblance matrices.
In general, no obvious difference on microbial community structure between the sampling days
was apparent in the MDS plot (Fig. 5.5). However, there was a clear difference between control
and 40% N and CD clay, while there were no consistent differences between control and 5% N
or CD clay. PERMANOVA showed that microbial community structure significantly changed over
time in treatments with N clay (P<0.05) at both clay concentrations. The clay concentration had
a significant effect on microbial community structure (P<0.05) on days 0, 14 and 42 but not on
day 28. The clay fraction (N clay or CD clay) significantly (P<0.05) affected microbial community
structure at 40% clay on days 0, 28 and 42 and at 5% clay on days 0 and 14.
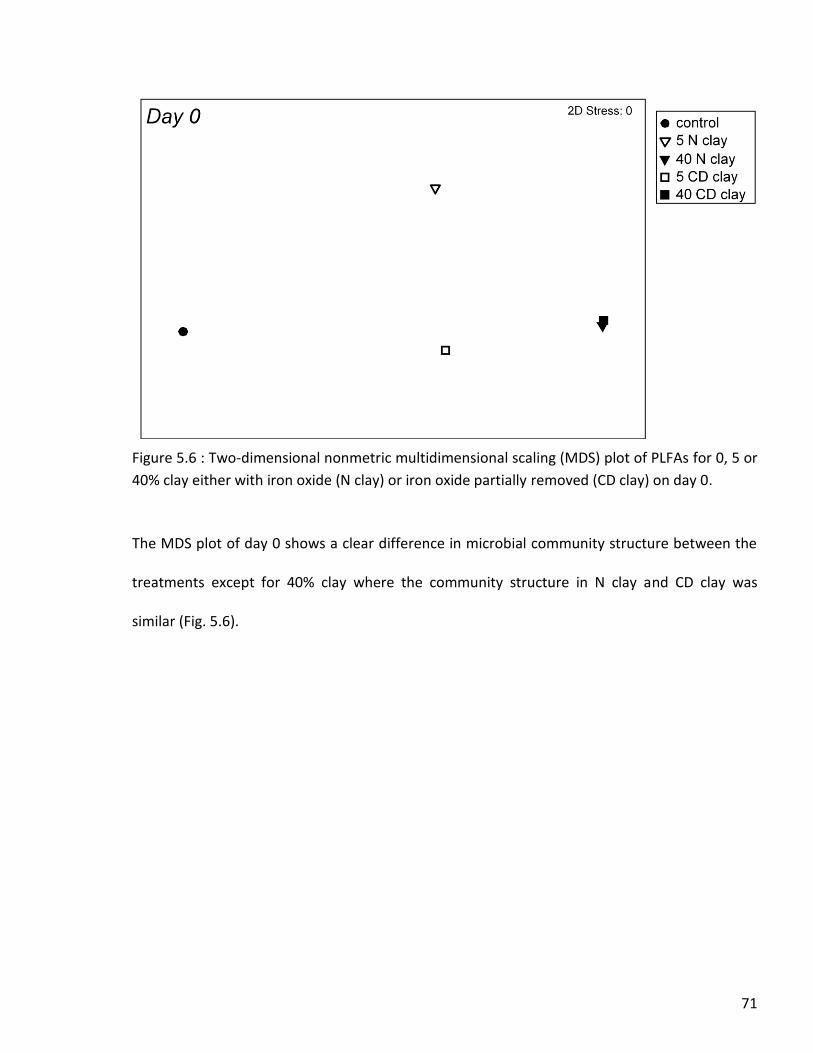
71
Figure 5.6 : Two-dimensional nonmetric multidimensional scaling (MDS) plot of PLFAs for 0, 5 or
40% clay either with iron oxide (N clay) or iron oxide partially removed (CD clay) on day 0.
The MDS plot of day 0 shows a clear difference in microbial community structure between the
treatments except for 40% clay where the community structure in N clay and CD clay was
similar (Fig. 5.6).
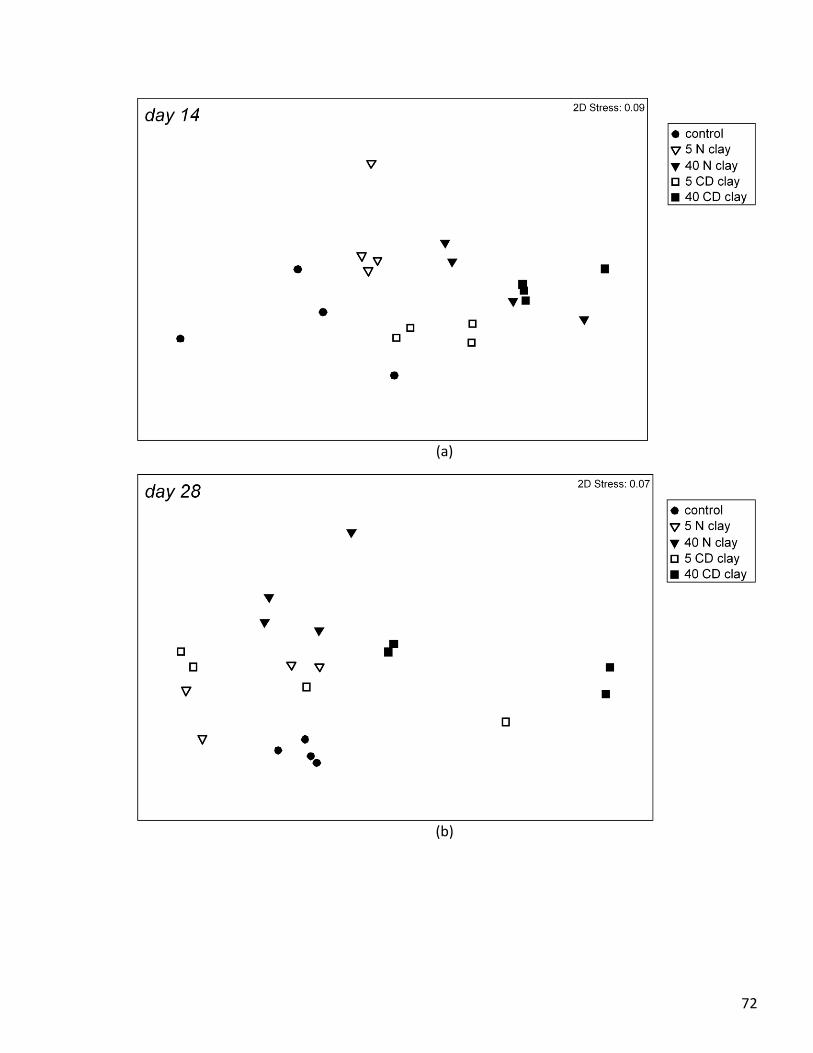
72
(a)
(b)

73
(c)
Figure 5.7 : Two-dimensional nonmetric multidimensional scaling (MDS) plot of PLFAs for 0, 5 or
40% clay either with iron oxide (N clay) or iron oxide partially removed (CD clay) on day 14 (a),
day 28 (b) and day 42 (c).
The MDS plot for day 14 (Fig. 5.7a) demonstrates that the microbial community structure of the
control was similar to that of 5% N clay and CD clay but clearly separated from that of 40% N
clay and CD clay. On day 28 (Fig. 5.7b), the microbial community structure of all clay treatments
was different from the control. There was a clear difference between the clay concentrations
while the difference in microbial community structure between clay fractions was clear only for
40% clay.
On day 42, unlike on the previous sampling days, the microbial community structure of N clay
was clearly different from CD clay at both clay concentrations. As at the other sampling days,
the community structure of the control differed from that of the clay treatments (Fig. 5.7c).

74
5.4 Discussion and conclusion
In agreement with our hypothesis, partial removal of iron oxide strongly increased
decomposition of wheat residue at both clay concentrations whereas natural clay which
contained iron oxides reduced decomposition.
The negative effect of iron oxides on decomposition can be explained by the role of iron oxide in
the protection of organic matter by clay minerals. The positive charge of the iron oxide provides
cation bridging between clay and organic matter which both have permanently negative surface
charge.
Secondly, iron oxide coatings stabilize clay minerals against dispersion (Churchman et al., 1993)
and cause flocculation of the clay minerals, hence protecting the organic matter through
entrapment in clay aggregations (Baldock and Skjemstad, 2000). Thus, removal of iron oxide will
increase free organic matter; making it available to microbial decomposers which leads to an
increase of the decomposition rate.
The positive effect of clay concentration on respiration in this experiment is not in agreement
with the results of previous studies which found that the decomposition rate was negatively
correlated with clay concentration (Oades, 1988; Baldock and Skjemstad, 2000; Krull et al.,
2001). However, the present result was similar to the results obtained in experiment described
in Chapter 3. As mentioned in Chapter 3, the greater decomposition with 40% clay may be due
to the greater water availability in the 40% clay treatment.
The difference in respiration rate at 40% clay between fractions (N or CD) was greater than that
at 5% clay. This indicates that the clay concentration influences the effect of partial removal of

75
iron oxide on decomposition. Besides reducing cation bridging, partial removal of iron oxide also
reduces the loss of water from soil because water become more strongly bound to clay (Stucki,
2006). Indeed, as shown in Table 5.3, water loss was least in 40% CD clay whereas there was
little difference between 5% clay and the control. The greater availability of water will facilitate
microbial movement and enzyme and substrate diffusion resulting in a higher decomposition
rate. Furthermore, strong fungal growth was observed in 40% CD clay (Fig. 5.4b). This was
supported by the high abundance of total PLFAs and fungal fatty acids in this treatment, which
may have contributed to the higher decomposition rate. The strong fungal growth in this
treatment may be due to the relatively high pH in 40% CD clay (Table 5.2). Although fungi
normally prefer acidic conditions (Rousk et al., 2009; Zak and Wildman, 2004), there are also
fungi that prefer alkaline pH (Nagai et al., 1998; Zak and Wildman, 2004).
The MDS and PERMANOVA analyses showed that microbial community structure changed over
time in the N clay treatments at both clay concentrations. These differences appear be due to
the greater amount of iron oxide in N clay minerals (Table 2.3, Chapter 2) as there were no
changes detected over time in CD clay treatments. This may be due to the greater changes in
substrate availability by binding organic matter through cation bridging whereas substrate
availability may have been more stable with CD clay due to reduced organic matter binding.
At 40% clay, the microbial community structure of the N clay differed from that of the CD clay at
all sampling days except day 14, while at 5% clay the microbial community structure differed
between clay fractions only on days 0 and 14. This suggests that the effect of iron oxide on clay
minerals is greater at 40% clay than at 5% clay. The effect of the presence of iron oxides on the
microbial community structure only in the first half of incubation in the 5% clay indicates that at
76
low clay concentrations, the microbial community may only be affected by iron oxides and thus
substrate availability when it is highly active. The greater effect of partial removal of iron oxide
on microbial community structure at 40% clay may be due to the greater water availability in
the CD clay until the end of incubation. Additionally, with 40% clay, the relative increase in
substrate availability by partial removal of iron oxide is greater than at 5% clay where less
substrate is bound even in presence of iron oxide. Clay concentration had a strong effect on
microbial community structure being different at 5% clay compared to 40% clay at all sampling
days except for day 28. The higher clay concentration also supported a greater microbial
biomass at all sampling days. The difference in the microbial community structure and greater
microbial biomass may explain the higher respiration rate at 40% clay compared to 5% clay.
Particulate organic matter (POM) can be used to estimate plant residue decomposition (Baldock
and Skjemstad, 2000). Many studies have shown that the amount of residue remaining is
correlated to the amount of C mineralized in the soil (e.g. Denef et al., 2004; Koelbl and Koegel-
knabner, 2004). However, in this experiment, POM concentrations did not reflect mineralization
of C. This may be due to the fact that the amount of mineralized C was very small and
insufficient to be detected in changes in POM. Furthermore, the skill of isolating POM was not
well developed and therefore the results were highly variable.
In conclusion, decomposition was greater in 40% clay than 5% clay which is agreement with the
results described in Chapter 3. Iron oxide strongly affected decomposition rate at both clay
concentrations due to its role on organic matter protection through cation bridging and
entrapment. As a result, clay from which iron oxide was partially removed resulted in a greater
decomposition rate than the control at the higher clay concentration and no reduction at 5%

77
clay. The greater decomposition rate with clay from which iron oxide was partially removed
compared to natural clay can be explained by greater substrate availability and water retention.
Microbial community structure also was affected by iron oxide, particularly at 40% clay.
The present experiment was carried out with W clay which contains smectite. The effect of
partial removal of iron oxide may be different in clay which does not contain smectite because
this clay would have a smaller surface area and a smaller water holding capacity. Therefore, an
experiment on the effect of iron oxide on plant residue decomposition using two different types
of clay was carried out and is discussed in Chapter 6.
78
Chapter 6
Effect of clay type and iron oxides
6.1 Introduction
Apart from clay content and the effect of iron oxides on clay surfaces, clay mineralogy may also
have an important role in plant residue decomposition (Krull et al., 2001; Wattel-Koekkoek et al.,
2001). Previous studies (Chapters 3 and 4, Saggar et al., 1996; Wattel-Koekkoek et al., 1999;
Baldock and Skjemstad, 2000, Krull et al., 2001) showed that differences in clay mineral
properties have a significant effect on decomposition of soil organic matter.
The surface area of clay minerals is negatively correlated with particle size (Kahle et al., 2003).
According to Sorensen (1975), minerals with high specific surface area such as montmorilonite
stabilize organic matter more than kaolinite which has low specific surface area. This was
supported by comparison of the results in Chapters 3 and 4 and by Saggar et al. (1996) who
found that decomposition of 14C labeled ryegrass was not correlated with clay content but
strongly correlated to the specific surface area of the clay minerals. In addition, clay particle size
also influences the CEC of the clay (Marshall et al., 1996, Sanyal, 2000). In the presence of
multivalent cations, high CEC clay minerals may protect the organic matter more than low CEC
clay minerals (Baldock and Skjemstad, 2000; Krull et al., 2001). As a result, organic matter
storage is negatively correlated with particle size (Amato and Ladd, 1992; Hassink, 1997).
However, some studies reported that the coarse clay fraction contains more C than the fine clay
fraction (Anderson et al., 1981; Tiessen and Stewart, 1983; Baldock et al., 1992; Laird et al.,
2001 as cited in Kahle et al., 2003). Moreover, the results of Chapters 3 and 4 are not directly
79
comparable because residues with different properties and thus decomposability were used.
Therefore, more studies need to be carried out to determine the influence of different clay
minerals on the decomposition and protection of organic matter.
As shown in Chapter 5 in Wiesenboden clay, partial removal of iron oxide increased
decomposition of organic matter, particularly at high clay concentrations. Previous studies
indicate that the effect of iron oxide may differ between clay types. Kahle et al. (2003) found
that the presence of iron oxide was more important for binding of organic matter in fine clay
than in coarse clay. Indeed, removal of iron oxide had less effect on organic matter binding in
kaolinitic clays compared to smectitic clays (Stucki, 2006).
Most the studies on the effect of clay mineral types and iron oxide were carried out in natural
soils over long observation periods which can influence the results due to other factors such as
climate, organic matter input and soil structure and do not necessarily reflect the actual effect
of clay mineral type and iron oxide on organic matter protection. Thus, this experiment was
carried out to determine the effect of two different clay types which differ in clay mineralogy
(one containing smectite, the other only kaolinite and illite, see Table 2.3, Chapter 2) on
decomposition of wheat residue under controlled conditions over a short period of time. It was
hypothesized that (i) the greater relative surface charge of the clay containing smectite will lead
to greater protection of the organic matter than with clay that contains no smectite, and (ii)
partially removal of iron oxide will have a different effect on organic matter protection in the
different types of clay minerals.
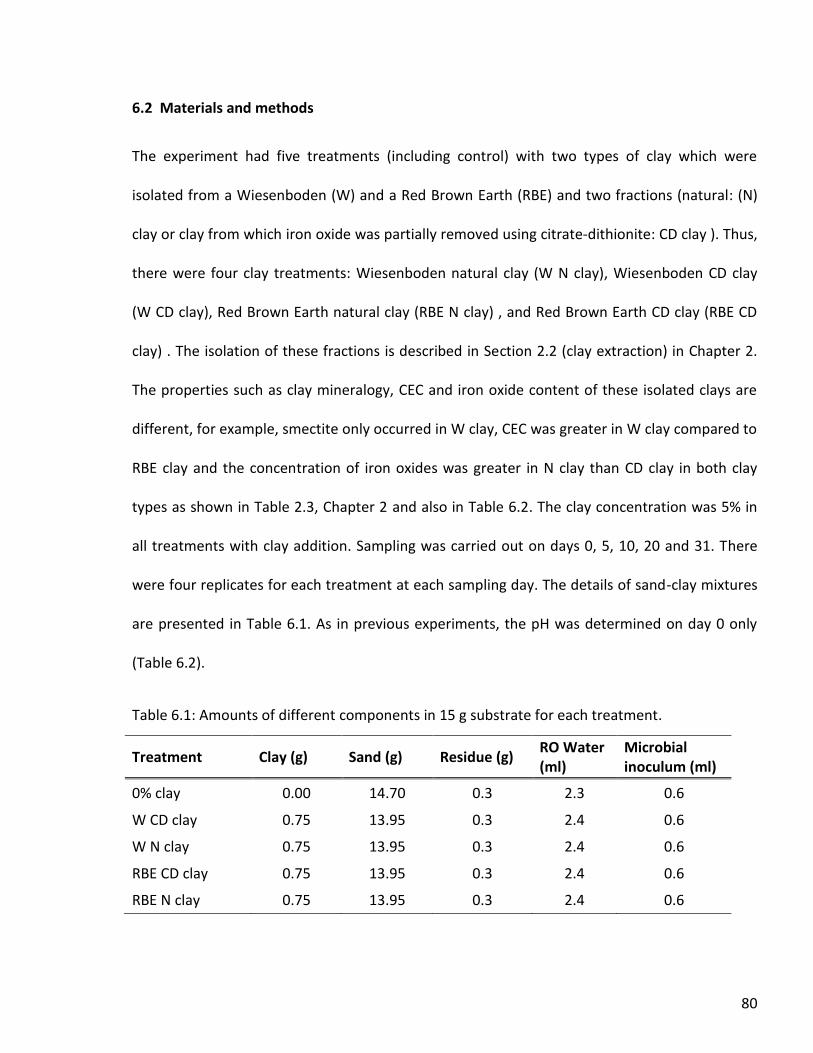
80
6.2 Materials and methods
The experiment had five treatments (including control) with two types of clay which were
isolated from a Wiesenboden (W) and a Red Brown Earth (RBE) and two fractions (natural: (N)
clay or clay from which iron oxide was partially removed using citrate-dithionite: CD clay ). Thus,
there were four clay treatments: Wiesenboden natural clay (W N clay), Wiesenboden CD clay
(W CD clay), Red Brown Earth natural clay (RBE N clay) , and Red Brown Earth CD clay (RBE CD
clay) . The isolation of these fractions is described in Section 2.2 (clay extraction) in Chapter 2.
The properties such as clay mineralogy, CEC and iron oxide content of these isolated clays are
different, for example, smectite only occurred in W clay, CEC was greater in W clay compared to
RBE clay and the concentration of iron oxides was greater in N clay than CD clay in both clay
types as shown in Table 2.3, Chapter 2 and also in Table 6.2. The clay concentration was 5% in
all treatments with clay addition. Sampling was carried out on days 0, 5, 10, 20 and 31. There
were four replicates for each treatment at each sampling day. The details of sand-clay mixtures
are presented in Table 6.1. As in previous experiments, the pH was determined on day 0 only
(Table 6.2).
Table 6.1: Amounts of different components in 15 g substrate for each treatment.
Treatment Clay (g) Sand (g) Residue (g) RO Water (ml)
Microbial inoculum (ml)
0% clay 0.00 14.70 0.3 2.3 0.6
W CD clay 0.75 13.95 0.3 2.4 0.6
W N clay 0.75 13.95 0.3 2.4 0.6
RBE CD clay 0.75 13.95 0.3 2.4 0.6
RBE N clay 0.75 13.95 0.3 2.4 0.6

81
Table 6.2: Iron oxide concentration and pH value on day 0 of the control or with 5% clay as two clay types (W or RBE clay) and two clay fractions [natural (N) clay or clay from which iron oxide
was partially removed, CD clay].
Treatment Fe (as Fe2O3)* (%) pH
0% clay na 6.68
W CD clay 6.23 7.96
W N clay 8.78 7.07
RBE CD clay 4.93 7.13
RBE N clay 10.52 6.58
Note : na = not available, * from Table 2.3, Chapter 2.
The samples were arranged in different sets according to the sampling day. The replicates for
measuring respiration between sampling dates were kept in the jars as described in Chapter 2,
while the others were kept separately in plastic containers with vials containing RO water to
maintain the substrate moisture at approximately 68% water holding capacity. Substrate
moisture of the replicates used for respiration measurement was not adjusted. Weight loss of
substrate after respiration measurement was used to determine water loss during particular
period. The percentage of water loss is shown in Table 6.3.
Table 6.3: Water loss in percentage (%) of amount added on day 0 in the control or with 5% clay as two clay types (W or RBE clay) and two clay fractions [natural (N) clay or clay from which iron oxide was partially removed, CD clay] after 5 and 10 days.
water loss (% of amount added on day 0)
Incubation control W CD clay W N clay RBE CD clay RBE N clay
5 days 8.0 7.4 7.3 7.3 8.2
10 days 8.4 7.8 7.7 7.8 8.8
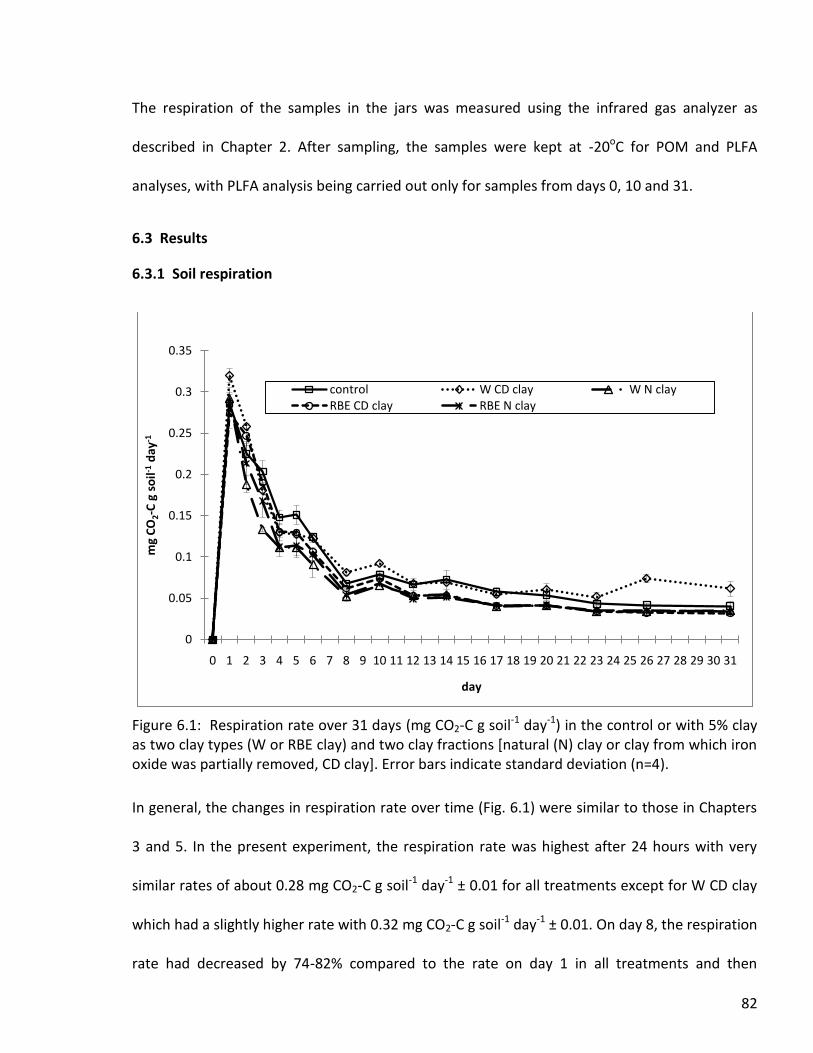
82
The respiration of the samples in the jars was measured using the infrared gas analyzer as
described in Chapter 2. After sampling, the samples were kept at -20oC for POM and PLFA
analyses, with PLFA analysis being carried out only for samples from days 0, 10 and 31.
6.3 Results
6.3.1 Soil respiration
Figure 6.1: Respiration rate over 31 days (mg CO2-C g soil-1 day-1) in the control or with 5% clay as two clay types (W or RBE clay) and two clay fractions [natural (N) clay or clay from which iron oxide was partially removed, CD clay]. Error bars indicate standard deviation (n=4).
In general, the changes in respiration rate over time (Fig. 6.1) were similar to those in Chapters
3 and 5. In the present experiment, the respiration rate was highest after 24 hours with very
similar rates of about 0.28 mg CO2-C g soil-1 day-1 ± 0.01 for all treatments except for W CD clay
which had a slightly higher rate with 0.32 mg CO2-C g soil-1 day-1 ± 0.01. On day 8, the respiration
rate had decreased by 74-82% compared to the rate on day 1 in all treatments and then
0
0.05
0.1
0.15
0.2
0.25
0.3
0.35
0 1 2 3 4 5 6 7 8 9 10 11 12 13 14 15 16 17 18 19 20 21 22 23 24 25 26 27 28 29 30 31
mg
CO
2-C
g s
oil-1
day
-1
day
control W CD clay W N clayRBE CD clay RBE N clay
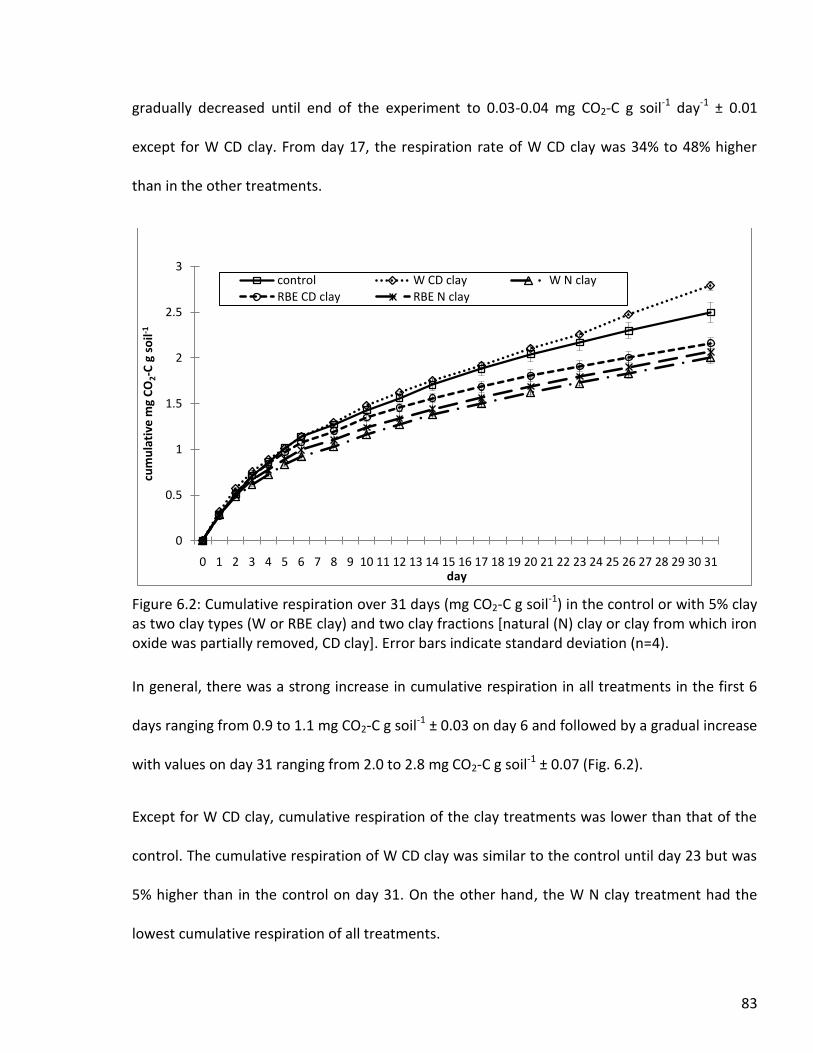
83
gradually decreased until end of the experiment to 0.03-0.04 mg CO2-C g soil-1 day-1 ± 0.01
except for W CD clay. From day 17, the respiration rate of W CD clay was 34% to 48% higher
than in the other treatments.
Figure 6.2: Cumulative respiration over 31 days (mg CO2-C g soil-1) in the control or with 5% clay as two clay types (W or RBE clay) and two clay fractions [natural (N) clay or clay from which iron oxide was partially removed, CD clay]. Error bars indicate standard deviation (n=4).
In general, there was a strong increase in cumulative respiration in all treatments in the first 6
days ranging from 0.9 to 1.1 mg CO2-C g soil-1 ± 0.03 on day 6 and followed by a gradual increase
with values on day 31 ranging from 2.0 to 2.8 mg CO2-C g soil-1 ± 0.07 (Fig. 6.2).
Except for W CD clay, cumulative respiration of the clay treatments was lower than that of the
control. The cumulative respiration of W CD clay was similar to the control until day 23 but was
5% higher than in the control on day 31. On the other hand, the W N clay treatment had the
lowest cumulative respiration of all treatments.
0
0.5
1
1.5
2
2.5
3
0 1 2 3 4 5 6 7 8 9 10 11 12 13 14 15 16 17 18 19 20 21 22 23 24 25 26 27 28 29 30 31
cum
ula
tive
mg
CO
2-C
g s
oil-1
day
control W CD clay W N clay
RBE CD clay RBE N clay
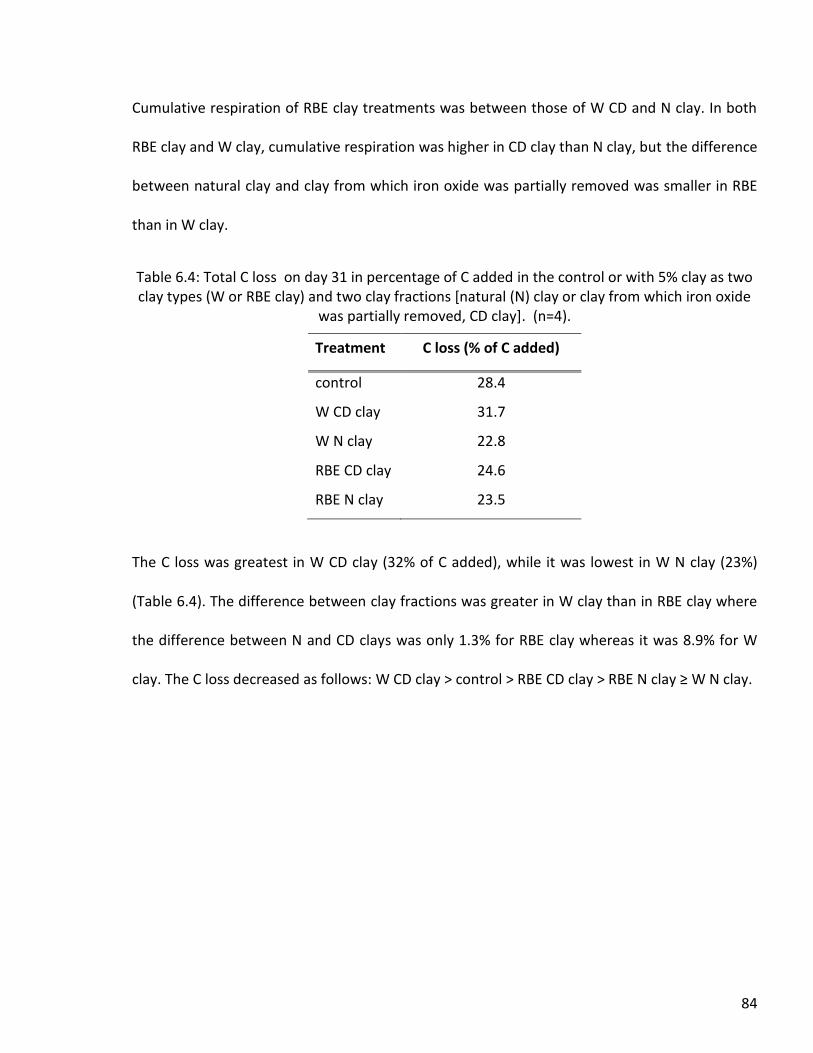
84
Cumulative respiration of RBE clay treatments was between those of W CD and N clay. In both
RBE clay and W clay, cumulative respiration was higher in CD clay than N clay, but the difference
between natural clay and clay from which iron oxide was partially removed was smaller in RBE
than in W clay.
Table 6.4: Total C loss on day 31 in percentage of C added in the control or with 5% clay as two clay types (W or RBE clay) and two clay fractions [natural (N) clay or clay from which iron oxide
was partially removed, CD clay]. (n=4).
Treatment C loss (% of C added)
control 28.4
W CD clay 31.7
W N clay 22.8
RBE CD clay 24.6
RBE N clay 23.5
The C loss was greatest in W CD clay (32% of C added), while it was lowest in W N clay (23%)
(Table 6.4). The difference between clay fractions was greater in W clay than in RBE clay where
the difference between N and CD clays was only 1.3% for RBE clay whereas it was 8.9% for W
clay. The C loss decreased as follows: W CD clay > control > RBE CD clay > RBE N clay ≥ W N clay.

85
6.3.2 Particulate organic matter
Figure 6.3 : Particulate organic matter (POM) concentration in the control or with 5% clay as two clay types (W or RBE clay) and two clay fractions [natural (N) clay or clay from which iron oxide was partially removed, CD clay]. Error bars indicate standard deviation (n=4).
Overall, the POM concentration was highest on day 0 in all treatments except in RBE CD clay on
day 5 where the POM concentration was similar as on day 0. However, except for the control
and W CD clay, there was no obvious trend over time. In the control and the W CD clay
treatment, the POM concentration decreased over time. In the control, it decreased from about
17.6 mg POM (88% of residue added) on day 0 to 8.5 mg POM (42% of residue added) on day 31
with a similar trend in the W CD clay treatment i.e. 88% to 48% of residue added.
0
5
10
15
20
25
Control W CD clay W N clay RBE CD clay RBE N clay
mg
PO
M g
so
il-1
Treatment
day0 day5 day10 day20 day31
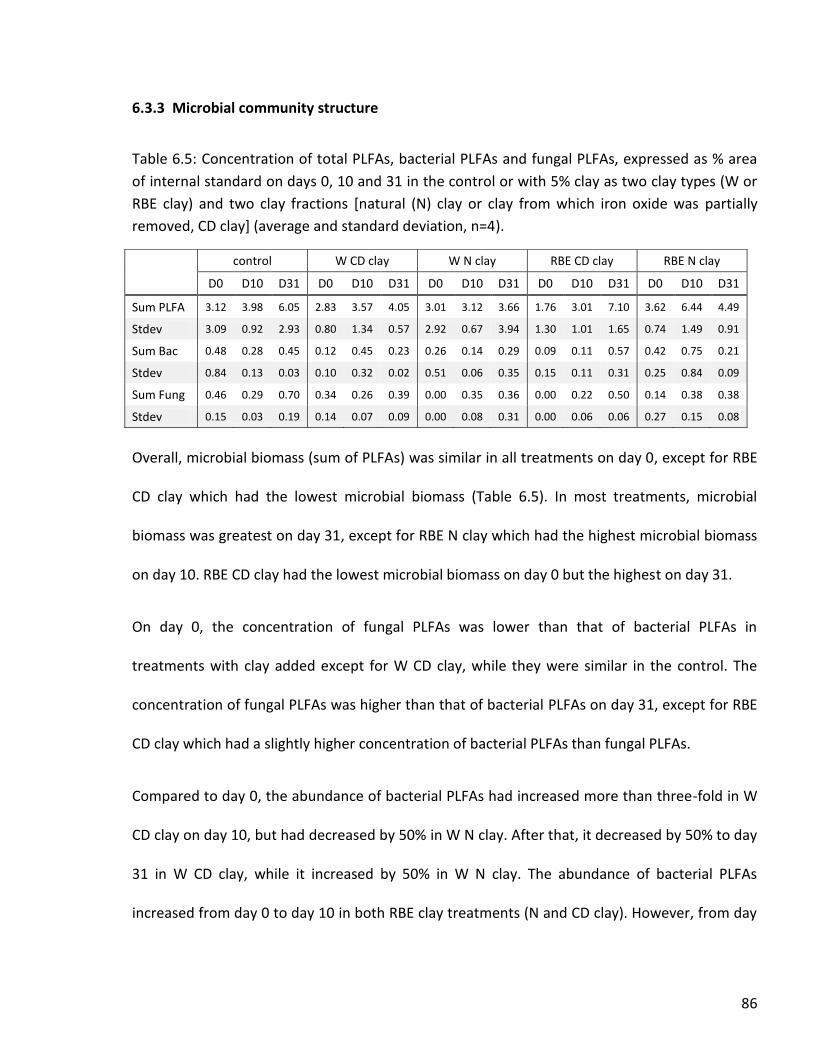
86
6.3.3 Microbial community structure
Table 6.5: Concentration of total PLFAs, bacterial PLFAs and fungal PLFAs, expressed as % area
of internal standard on days 0, 10 and 31 in the control or with 5% clay as two clay types (W or
RBE clay) and two clay fractions [natural (N) clay or clay from which iron oxide was partially
removed, CD clay] (average and standard deviation, n=4).
Overall, microbial biomass (sum of PLFAs) was similar in all treatments on day 0, except for RBE
CD clay which had the lowest microbial biomass (Table 6.5). In most treatments, microbial
biomass was greatest on day 31, except for RBE N clay which had the highest microbial biomass
on day 10. RBE CD clay had the lowest microbial biomass on day 0 but the highest on day 31.
On day 0, the concentration of fungal PLFAs was lower than that of bacterial PLFAs in
treatments with clay added except for W CD clay, while they were similar in the control. The
concentration of fungal PLFAs was higher than that of bacterial PLFAs on day 31, except for RBE
CD clay which had a slightly higher concentration of bacterial PLFAs than fungal PLFAs.
Compared to day 0, the abundance of bacterial PLFAs had increased more than three-fold in W
CD clay on day 10, but had decreased by 50% in W N clay. After that, it decreased by 50% to day
31 in W CD clay, while it increased by 50% in W N clay. The abundance of bacterial PLFAs
increased from day 0 to day 10 in both RBE clay treatments (N and CD clay). However, from day
control W CD clay W N clay RBE CD clay RBE N clay
D0 D10 D31 D0 D10 D31 D0 D10 D31 D0 D10 D31 D0 D10 D31
Sum PLFA 3.12 3.98 6.05 2.83 3.57 4.05 3.01 3.12 3.66 1.76 3.01 7.10 3.62 6.44 4.49
Stdev 3.09 0.92 2.93 0.80 1.34 0.57 2.92 0.67 3.94 1.30 1.01 1.65 0.74 1.49 0.91
Sum Bac 0.48 0.28 0.45 0.12 0.45 0.23 0.26 0.14 0.29 0.09 0.11 0.57 0.42 0.75 0.21
Stdev 0.84 0.13 0.03 0.10 0.32 0.02 0.51 0.06 0.35 0.15 0.11 0.31 0.25 0.84 0.09
Sum Fung 0.46 0.29 0.70 0.34 0.26 0.39 0.00 0.35 0.36 0.00 0.22 0.50 0.14 0.38 0.38
Stdev 0.15 0.03 0.19 0.14 0.07 0.09 0.00 0.08 0.31 0.00 0.06 0.06 0.27 0.15 0.08
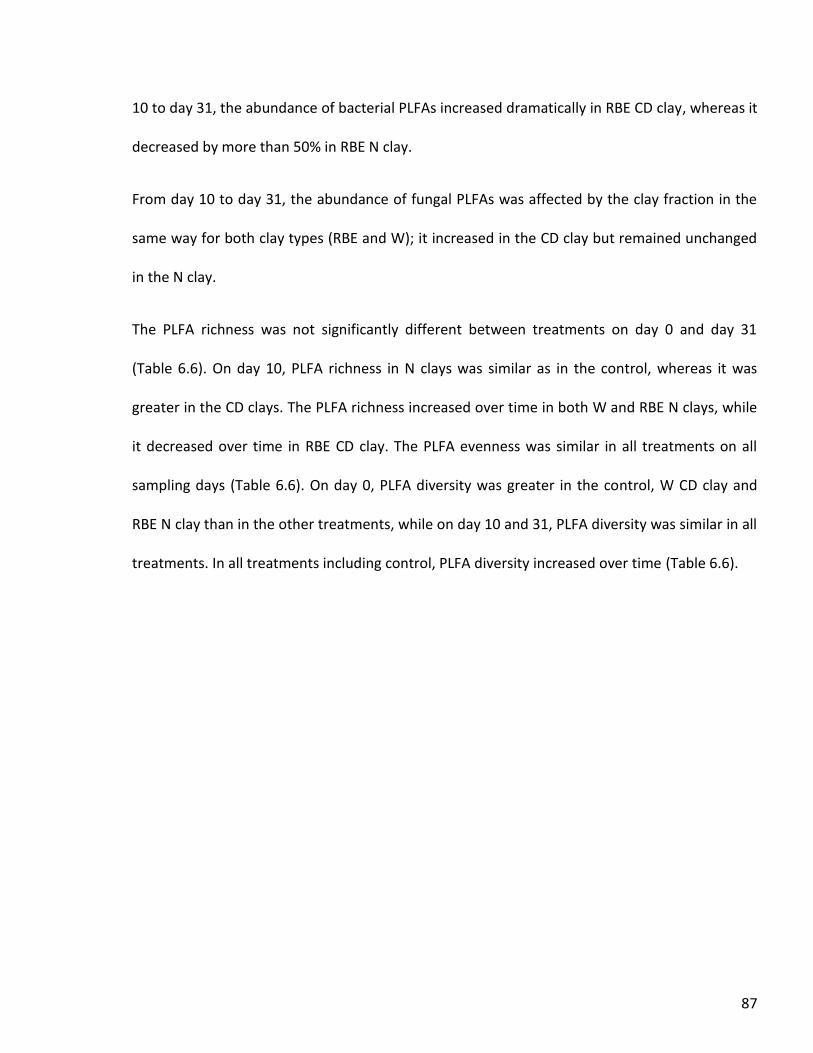
87
10 to day 31, the abundance of bacterial PLFAs increased dramatically in RBE CD clay, whereas it
decreased by more than 50% in RBE N clay.
From day 10 to day 31, the abundance of fungal PLFAs was affected by the clay fraction in the
same way for both clay types (RBE and W); it increased in the CD clay but remained unchanged
in the N clay.
The PLFA richness was not significantly different between treatments on day 0 and day 31
(Table 6.6). On day 10, PLFA richness in N clays was similar as in the control, whereas it was
greater in the CD clays. The PLFA richness increased over time in both W and RBE N clays, while
it decreased over time in RBE CD clay. The PLFA evenness was similar in all treatments on all
sampling days (Table 6.6). On day 0, PLFA diversity was greater in the control, W CD clay and
RBE N clay than in the other treatments, while on day 10 and 31, PLFA diversity was similar in all
treatments. In all treatments including control, PLFA diversity increased over time (Table 6.6).
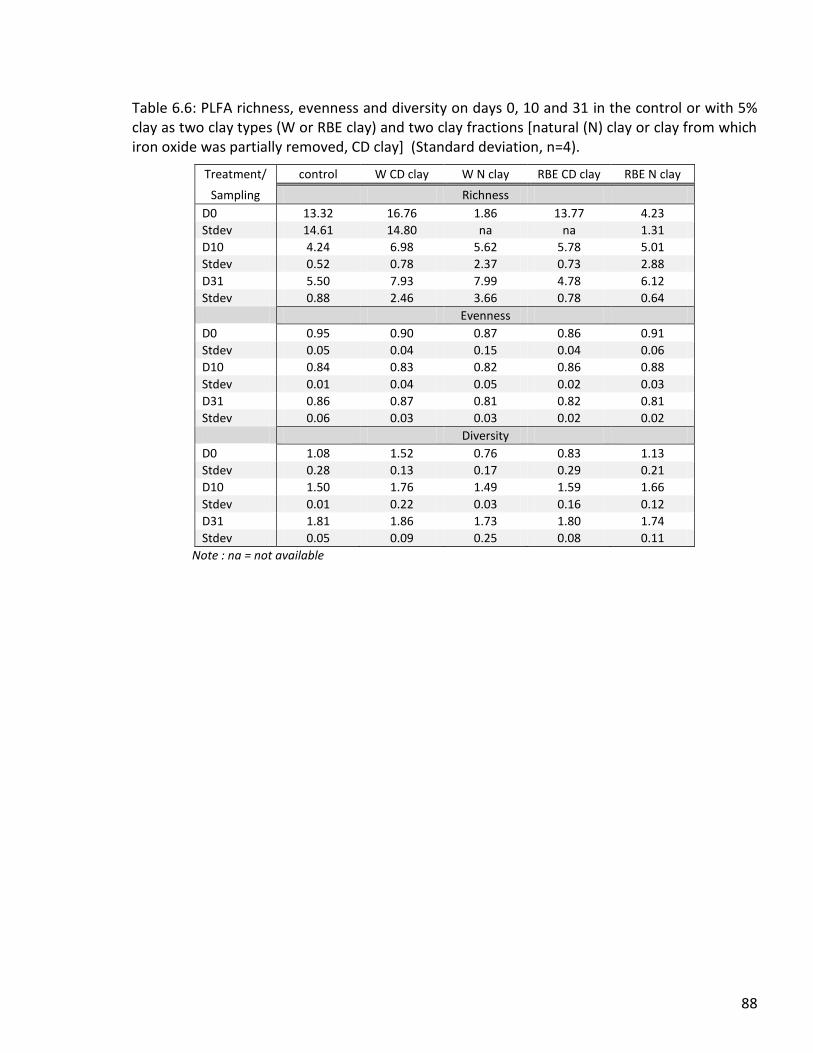
88
Table 6.6: PLFA richness, evenness and diversity on days 0, 10 and 31 in the control or with 5% clay as two clay types (W or RBE clay) and two clay fractions [natural (N) clay or clay from which iron oxide was partially removed, CD clay] (Standard deviation, n=4).
Treatment/ control W CD clay W N clay RBE CD clay RBE N clay
Sampling Richness
D0 13.32 16.76 1.86 13.77 4.23
Stdev 14.61 14.80 na na 1.31
D10 4.24 6.98 5.62 5.78 5.01
Stdev 0.52 0.78 2.37 0.73 2.88
D31 5.50 7.93 7.99 4.78 6.12
Stdev 0.88 2.46 3.66 0.78 0.64
Evenness
D0 0.95 0.90 0.87 0.86 0.91
Stdev 0.05 0.04 0.15 0.04 0.06
D10 0.84 0.83 0.82 0.86 0.88
Stdev 0.01 0.04 0.05 0.02 0.03
D31 0.86 0.87 0.81 0.82 0.81
Stdev 0.06 0.03 0.03 0.02 0.02
Diversity
D0 1.08 1.52 0.76 0.83 1.13
Stdev 0.28 0.13 0.17 0.29 0.21
D10 1.50 1.76 1.49 1.59 1.66
Stdev 0.01 0.22 0.03 0.16 0.12
D31 1.81 1.86 1.73 1.80 1.74
Stdev 0.05 0.09 0.25 0.08 0.11
Note : na = not available
89
Figure 6.4: Two-dimensional nonmetric multidimensional scaling (MDS) plot of PLFAs for the control or with 5% clay as two clay types (W or RBE clay) and two clay fractions [natural (N) clay or clay from which iron oxide was partially removed, CD clay] on sampling days 0, 10 and 31.
The low stress value in all MDS plots indicates that the ordinations were very good reflection of
the resemblance matrices.
The MDS plot of the PLFA patterns of all sampling dates (Fig. 6.4) shows that microbial
community structure of day 0 was clearly separated from those of days 10 and 31 in all
treatments. PERMANOVA showed that the interaction of clay type and fraction significantly
affected the microbial community structure. Microbial community structure was also
significantly affected by time, as well as the interaction between the treatment (clay type x
fraction) and time. In the control and RBE CD clay, microbial community structure significantly
differed between all sampling days. The microbial community structure on day 0 was
significantly different from that on day 10 in W CD clay, W N clay and RBE N clay, while the
difference between day 0 and day 30 was significant in W CD clay and RBE N clay.

90
(a)
(b)

91
(c)
Figure 6.5: Two-dimensional nonmetric multidimensional scaling (MDS) analysis of PLFAs in the control or with 5% clay as two clay types (W or RBE clay) and two clay fractions [natural (N) clay or clay from which iron oxide was partially removed, CD clay]: on day 0 (a), day 10 (b) and day 31 (c).
The MDS plot of day 0 (Fig 6.5a) shows that in both clay types, the microbial community
structure of N clay was clearly separated from that of CD clay and also the control. The microbial
community structure of the control was similar to that of W CD clay but clearly separated from
that of RBE CD clay. PERMANOVA showed that the microbial community structure of the control
was significantly different from that of W N clay and RBE CD clay and the microbial community
structure of W CD clay was significantly different from both fractions of RBE clay.
On day 10 (Fig 6.5b), there was no clear difference among the treatments except between the
control and W CD clay. However, PERMANOVA indicated that there were no significant
differences between any of the treatments.
92
The microbial community structure of the control was clearly separated from that of the other
treatments on day 31 (Fig. 6.5c). There was also a clear difference between W CD clay and both
fractions of RBE clay. PERMANOVA indicated that the following microbial community structures
were significantly different: control compared to W CD clay and RBE N clay, W CD clay
compared to RBE CD clay and RBE N clay, and RBE CD clay compared to RBE N clay.
6.4 Discussion and conclusion
As shown in Table 2.3 in Chapter 2, the clay isolated from Wiesenboden soil contains smectite
which is not present in the clay from the Red Brown Earth. However, clay from both soils
contains kaolinite and illite. No crystalline iron oxide was detected by X-ray diffraction in either
fractions of the Wiesenboden clay (W N clay and W CD clay). On the other hand, by using X-ray
fluorescence analysis, iron was detected in W clay as shown in Table 2.3 in Chapter 2. This
suggests that the iron oxides present are non- or partially-crystalline. If native W clay contains
iron oxide, some of it will be removed by the CD treatment since in RBE clay, hematite was
detected in the N clay but not in RBE CD clay. However, iron was also detected in both fractions
of RBE clay by X-ray fluorescence analysis, confirming that iron oxide was only partially removed.
Clay mineral type and the partial removal of iron oxide had a significant effect on the
mineralization rate. Compared to the other treatments, partial removal of iron oxide from W
clay strongly increased cumulative respiration. Natural W clay had the lowest respiration rate.
Although partial removal of iron oxide from RBE clay also increased the decomposition rate, the
effect was not as pronounced as in the W clay. This suggests that iron oxides play a particularly
important role in protection of organic matter in smectite clays, which occur only in W clay. This
is supported by the higher decomposition of RBE N clay compared to W N clay. Smectite has a

93
large specific surface area and high CEC (Table 3.1, Chapter 3). The large specific surface area
may increase the capacity of the clay to bind organic matter either through van-der-Waals
adsorption or cation bridging (Churchman, pers. com). The strong increase in respiration in W
CD clay compared to W N clay shows that partial removal of iron oxide reduces cation bridging
and therefore decreases organic matter protection. This is in agreement with Wattel-Koekkoek
et al. (2001), who stressed the importance of cation bridging on clay-organic matter association
for smectite minerals.
The increase of respiration rate by partial removal of iron oxide in the RBE clay which does not
contain smectite was less pronounced than in W clay, although the amount of iron oxides
removed from RBE clay was greater than that in W clay; ca. 53% in RBE and 29% in W clay (Table
6.2). This suggests that different clay types have different interactions with iron oxide. Although
relatively more iron oxide was removed from RBE than from W clay, the greater increase in
respiration by partial removal of iron oxide in W clay suggests that in this clay, the iron oxide
involved in organic matter binding was removed to a greater extent than in RBE clay.
Nonetheless, in general, the respiration results are in agreement with the hypotheses that clay
type and partial removal of iron oxide will affect respiration rate.
Free or occluded POM can be used to estimate mineralization of organic matter in soil (Golchin
et al., 1994b; Koelbl and Koegel-knabner, 2004). In this experiment, only free POM was isolated;
this is the most active organic matter fraction in soil (Baldock and Nelson, 2000; Wander, 2004).
Despite differences in cumulative respiration, POM concentration did not differ between clay
treatments. This was in contrast to the result in Denef et al. (2004) who found that POM
entrapped within soil macroaggregates was greater in soils containing 2:1 clay minerals than in
94
soils with 1:1 clay minerals. In the present experiment, only 5% clay was mixed with sand
resulting in a relatively coarse substrate in which macroaggregates may not have formed. As
explained in Chapter 3, the inconsistent POM results may be due to the lack of skill in POM
isolation. Nevertheless, POM concentration decreased over time in the control and W CD clay,
indicating that POM concentration may be useful for estimating decomposition rate when POM
isolation is carried out with sufficient skill.
Microbial biomass increased over time due to addition of residues but was not affected by clay
type. On the other hand, partial removal of iron oxide strongly affected microbial biomass in
RBE clay. In RBE CD clay, microbial biomass increased over time while it decreased in RBE N clay.
The stimulation of microbial biomass over time by partial removal of iron oxide was greater in
RBE clay than in W clay, whereas the reverse was true for respiration, which shows that the size
of the microbial biomass was not correlated with mineralization rate. It is possible that the
partial removal of iron oxide allowed a more efficient use of the substrate by the
microorganisms in the RBE clay, thus increasing microbial biomass more strongly than
respiration. The stimulation of the microbial biomass by partial removal of iron oxide supports
the explanation given above that the presence of iron oxide leads to stronger binding of organic
matter thus reducing substrate availability and microbial growth.
With respect to fungal and bacterial signature fatty acids, no clear effect of different clay types
and partial removal of iron oxide was found since the concentration of fungal and bacterial PLFA
varied among the treatments over time. While the concentration of bacterial fatty acids did not
have an obvious trend over time, the concentration of fungal fatty acids increased in most the

95
treatments including the control, indicating that there was a shift from a bacteria-dominated
community to a fungi-dominated community over time.
Due to the high variability, PLFA richness on day 0 was similar among treatments. Partial
removal of iron oxide increased PLFA richness in both clays on day 10 while it did not differ
between control and N clay of both fractions. However, there were no differences between
treatments on day 31. The stronger effect of partial removal of iron oxides after 10 days of
incubation in both types of clay may be due to the higher microbial activity in the early stages
compared to the later stages of incubation as a result of the greater substrate availability at the
beginning, shortly after residue addition. PLFA evenness, which is a measure of the relative
concentration of PLFAs, was not affected by clay type, partial removal of iron oxide or time. The
diversity of PLFAs increased strongly over time whereas clay type and fraction had little effect.
This demonstrates that, during plant residue decomposition, the microbial decomposer
community became more diverse, probably due to changes in substrate composition over time.
Microbial community structure was affected by incubation time, clay type and partial removal
of iron oxide as well as their interactions. These results suggest that the effect of clay type and
partial removal of iron oxide on the microbial community structure changed over time. There
was no difference between N clay and CD clay in either clay type on days 0 and 16. However, on
day 31 there was a difference in microbial community structure between N and CD clay in RBE
clay, but not in W clay. Hence, the effect of partial removal of iron oxide on microbial
community structure can only be seen in RBE clay and in the later stages of incubation. This
suggests that the microbial community structure in the RBE clay treatment was more sensitive
to changes in substrate availability than in the W clay. However, this is in contrast to the

96
decomposition rate which was more strongly increased by partial removal of iron oxide in the W
clay. Therefore the microbial community in the W clay adapted to the increased substrate
availability by partial removal of iron oxide by increasing its activity rather than changing the
community structure, whereas the opposite is true for the community in the RBE clay.
In conclusion, this experiment showed that decomposition rate was affected by clay type since,
in their natural state, C loss was greater in RBE clay than in W clay. Partial removal of iron oxide
increased decomposition in both clay types, but the increase was more pronounced in clay that
contains smectites (W clay) than the clay that contains no smectite (RBE clay). This indicates
that iron oxides are more important in protecting organic matter in clays with high specific
surface area.
In contrast to the respiration results, the partial removal of iron oxide initially increased
microbial biomass more in RBE clay than W clay and affected microbial community structure in
the later stages of decomposition in the RBE clay but not in W clay. This suggests that the
microbial community in the W clay responded to the increased substrate availability not by
increased growth or changes in relative abundance of certain species, but by an increased
activity.

97
Chapter 7
General discussion and future studies
7.1 General discussion
Clay is known to be an important factor regulating organic matter decomposition. There are a
number of previous studies in which the relationship between clay content, type and its
association with iron oxide and organic matter decomposition was assessed, but these were
mostly conducted in the natural environment over long periods of time (Oades, 1988; Baldock
and Skjemstad, 2000; Krull et al., 2001). In the natural environment, the effects of clay can be
masked by other factors such as climate and vegetation. In order to elucidate the effect of clay
on organic matter decomposition without interference by other factors, the experiments in the
present study were carried out in controlled environments over a short period of time in a
model substrate which only contained sand, clay and organic matter. The results from these
experiments are discussed in Chapters 3 to 6. The following general discussion will summarize
the findings and is divided in three main topics: effect of clay concentration, effect of clay type
and effect of clay fraction.
Effect of clay concentration
The clay concentration may influence the decomposition of organic matter in soils. Many
studies using a natural clay gradient, reported that the amount of clay in soil negatively
correlated with decomposition rate (e.g. Schimel, 1985; Ladd et al., 1985; Spain, 1990). However
in the present study, clay only decreased decomposition up to a certain concentration (10-20%),
above which decomposition was increased compared to the control. This contrasting effect is
98
due to binding of organic matter to clay on the one hand and increased water availability at high
clay concentrations on the other. Clay decreases accessibility of organic matter to
microorganisms and thus decomposition rate by protection of organic matter through sorption
and entrapment, which dominated throughout the experiment at low clay concentrations (less
than 10-20% clay). The reduction in decomposition rate was independent of clay concentration
at <20% clay, indicating that in these experiments, 5% clay was sufficient to reduce substrate
availability to microorganisms significantly. At higher organic matter content or residue addition
rates, this may not be the case. Then the amount of substrate still available to the decomposers
may be higher at 5% clay than at 10 or 20%. At high clay concentrations, particularly at 40% clay,
this negative effect of clay on decomposition rate was also noticeable in the first weeks of the
experiments. However in the later stages of the incubation, the increased water availability at
high clay concentrations lead to greater decomposition rates than in the control or the low clay
concentrations. Thus, in situations where soils dry out periodically, clay may increase
decomposition rate. Additionally, clay concentration also influenced the effect of partial
removal of iron oxide on decomposition. At higher clay concentrations (40% clay) the partial
removal of iron oxide increased decomposition rate more strongly than at lower clay
concentration (5% clay) which may be due to a greater difference in water retention of clay
between the two fractions and or the stronger reduction of substrate availability at high
concentrations of natural clay. In W clay, clay concentration had no effect on POM
concentration (Chapter 5). In RBE clay (Chapter 4), clay concentration only affected POM at the
end of the incubation where POM concentration increased with increasing of clay concentration,
which is in contrast to the result of decomposition rate measured by respiration. In both clay
types, this may be due to the methodology of POM isolation, and therefore not reflect the
99
actual POM concentrations. Methodological factors include lack of experience in POM isolation,
the relative small amount of residue decomposed during the incubation period and the poor
separation of POM from clay. The latter would increase POM weight, particularly at high clay
concentrations. These POM results indicate that although POM can be used to estimate C
mineralization as reviewed by Baldock and Skjemstad (2000), it may not applicable in short-term
studies or in soils with high clay content. The microbial biomass generally increased with
increasing clay content, but this increase occurred at different times. This will be further
discussed in the following section on the effect of clay type on plant residue decomposition.
Microbial community structure was affected by clay concentration in both clay types with
significant differences between the lowest (2.5% clay in RBE and 5% in W) and highest clay
concentration (40% clay in both clay types) at most sampling days. Microbial community
structure also changed over time. This suggests that clay concentration affected microbial
community structure in two ways; by affecting availability of substrate (particularly in the early
stages of incubation) and water (in the later stages of the experiments). It should be noted, that
the high decomposition rates at 40% W clay could also be due to the strong fungal growth in
this treatment which was not found in any other treatment. Thus, the specific conditions in the
40% clay treatment (water availability and pH) appear to have stimulated the growth of fungi.
These fungi may have come from the clay or the microbial inoculum and could therefore be
specific to this clay and the experimental conditions.
In conclusion, the results indicate that binding of organic matter to clay can decrease
decomposition rate, but under conditions where the substrates dry out, this effect can be
100
counteracted by the greater water availability in soils with relatively high clay content. This
needs to be considered particularly in field studies in climates in which soils temporarily dry out.
Effect of clay type
As described in Chapters 3, 4 and 6, the two clay types used in the experiments had different
properties and thus differed in their effect on decomposition rate and microbial community
structure. The W clay, which contained smectite decreased decomposition rate at low clay
concentrations more than RBE clay which does not contain smectite. This can be explained by
the smaller particle size and thus greater specific surface area and binding capacity for organic
matter of smectite compared to other clay minerals such as kaolinite.
In the experiment described in Chapter 4, RBE clay increased respiration rate at all clay
concentrations (2.5 to 20% clay) compared to the control. This result was surprising and is in
contrast to the effect of RBE clay on decomposition described in Chapter 6. Since all other
parameters were similar in the experiments described in this thesis, the contrasting results
found in Chapter 4 are due to the other residue type used. The residue used in the experiment
in Chapter 4 had a lower C/N ratio and a higher concentration of water-soluble C and N (Table
2.4, Chapter 2) which would increase substrate availability compared to residues with lower
concentrations of water-soluble compounds used in the other experiments. The increasing
water content with increasing RBE clay concentration would increase diffusion of these water-
soluble compounds, thus increasing substrate availability compared to the control in which
diffusion was limited by low water content.
101
Both clay types increased microbial biomass. In the experiment described in Chapter 6,
microbial biomass was greater in RBE clay than in W clay in both clay fractions. With natural clay,
the greater biomass in RBE clay coincided with higher decomposition rates compared to W clay.
However in clay from which iron oxide was partially removed, decomposition rate was greater
in W clay than in RBE clay. Thus, it appears that the higher decomposition rates in W clay from
which iron oxide was partially removed was due to a greater activity per unit biomass.
In conclusion, the type of clay strongly influence its effect on decomposition with smectitic clays
having a greater surface area thus binding capacity than kaolinitic and illitic clays. When
studying the effect of clay on organic matter decomposition it is therefore important to consider
which clay types are present. Hence, studies on the effect of clay concentration on soil organic
matter content should only be carried out with soils with the same clay types.
Effect of iron oxide
In the present study, partial removal of iron oxides increased decomposition rate regardless of
clay type. This is in agreement with (Huang et al., 2005) who discuss that iron oxide decreases
decomposition by binding of organic matter particles, soluble compounds and microorganisms.
Hence, partial removal of iron oxide would increase decomposition by increasing accessibility of
organic matter to microorganisms and increasing diffusion of enzymes and substrates.
However, as shown in Chapter 6, the effect of partial removal of iron oxide on decomposition
rate was more pronounced in W clay than RBE clay. Partial removal of iron oxide may increase
water retention (Chapter 5) in W clay more than in RBE clay which then stimulated
decomposition by providing greater substrate availability for microorganisms and thus
102
mineralization rate. Moreover, it is possible that in W clay, the iron oxide involved in organic
matter binding was removed to a greater extent than in RBE clay.
In W clay, microbial community structure changed over time in natural clay but not in clay from
which iron oxide was partially removed (Chapter 5 and 6). The change in microbial community
structure in N clay may be due to binding of organic matter and microbial metabolites to iron
oxides which would have affected substrate availability. This effect would be more pronounced
in the later stages of decomposition when the amount of substrate, particularly the easily
available compounds, was decreased in natural clay, while it would remain higher in clay from
which iron oxide was partially removed. However, while the microbial community structure in
RBE clay was affected by partial removal of iron oxide, this was not the case for W clay. Thus, in
RBE the increased decomposition rate in clay from which iron oxide was partially removed was
accompanied by changes in microbial community structure. In W clay, where decomposition
was increased to a greater extent by partial removal of iron oxide than in RBE clay, microbial
community structure did not differ between N clay and CD clay. Hence in RBE clay, the
increased substrate availability in CD clay changed the competitive ability of microbial species
significantly while this was not the case in W clay where partial removal of iron oxide apparently
increased the activity of all microorganisms detectable by PLFA equally.
In conclusion, these studies confirmed the importance of iron oxide for binding of organic
matter to clay but also showed that the effect of partial removal of iron oxide differs between
clay types.
The lack of effect of partial removal of iron oxide on microbial community structure in W clay
showed that changes in substrate availability do not necessarily lead to changes in microbial

103
community structure. The more adaptable the species in a community are, the less will changes
in substrate availability or environmental conditions, e.g. water availability, affect community
structure. Moreover, decomposition rate was not necessarily related to microbial biomass;
higher decomposition rates can be accompanied by a greater microbial biomass or a greater
activity per unit biomass.
7.2 Future studies
The experiments carried out in the present study revealed some new aspects of the clay organic
matter interactions but also indicated knowledge gaps or new questions. In order to study the
effect of clay on organic matter decomposition, the following studies could be carried out:
Repeat experiments with different clay concentrations, maintaining a constant water availability
to avoid differences in water availability between clay concentrations.
Longer incubation periods to study the longer term effects of clay which may differ from the
short-term effects shown in the present experiments, because as the amount of residue
remaining decreases, the effect of clay may become more pronounced.
Comparisons of clays that differ more strongly in clay types, e.g. clays dominated by smectite
compared to clays dominated by kaolinite.
Effect of clay on the C chemistry of the organic matter to assess if presence of clay results in
altered decomposition rates of certain C compounds. Decreased decomposition of a certain C
compound in presence of clay would indicate preferential binding of this compound to clay.
104
References
Aguilera, N.H. and Jackson, M.L., 1953. Iron oxide removal from soils and clays. Soil Science Society America Proceedings, 17: 359-364.
Amato, M. and Ladd, J.N., 1992. Decomposition of 14C-labelled glucose and legume material in soils: Properties influencing the accumulation of organic residue C and microbial biomass C. Soil Biology & Biochemistry, 24(5): 455-464.
Aneja, M.K. et al., 2006. Microbial colonization of Beech and Spruce litter - Influence of decomposition site and plant litter species on the divrsity of microbial community. Microbial Ecology, 52: 127-135.
Ayanlaja, S.A. and Sanwo, J.O., 1991. Management of soil organic matter in the farming systems of the lowland humid tropics of West Africa: A review. Soil Technology, 4: 265-279.
Bååth, E., Frostegård, Å. and Fritze, H., 1992. Soil bacterial biomass, activity, Phospholipid Fatty Acid pattern, and pH tolerance in area polluted with alkaline dust deposition. Applied and Enviromnental Microbiology, 58(12): 4026-4031.
Badenko, V., 2004. Organic matter. In: S. Collins (Editor), Soil Health. University of Western Australia, Perth.
Baldock, J. and Skjemstad, J., 1999. Soil organic carbon/soil organic matter. In: K.I Peverill, L.A. Sparrow and D.J. Reuter (Editors), Soil analysis: an interpretation manual. CSIRO Publishing, Collingwood, pp. 159-170.
Baldock, J.A., 2002. Interactions of organic materials and microorganisms with minerals in the stabilization of soil structure. In: P.M. Huang, J.M. Bollag and N. Senesi (Editors), Interaction between soil particles and microorganism - impact on the terresterial ecosystem. John Wiley & Sons, Ltd, pp. 85-131.
Baldock, J.A. and Nelson, P.N., 2000. Soil organic matter. In: M.E. Sumner (Editor), Handbook of soil science. CRC Press LLC, Boca Raton, Florida, pp. B25-B84.
Baldock, J.A. and Skjemstad, J.O., 2000. Role of soil matrix and minerals in protecting natural organic minerals against biological attack. Organic Geochemistry, 31: 697-710.
Baumann, K., Marschner, P., Smernik, R.J. and Baldock, J.A., 2009. Residue chemistry and microbial community structure during decomposition of eucalypt, wheat and vetch residues. Soil Biology & Biochemistery, (in press).
Berg, B. and McClaugherty, C., 2003. Plant litter. Springer, Bayreuth, Germany. Beri, V., Sidhu, B.S., Bhal, G.S. and Bhat, A.K., 1995. Nitrogen and phosphorus transformations as
affected by crop residue management practices and their influence on crop yield. Soil Use and Management, 11: 51-54.
Bhupinderpal, S. and Rengel, Z., 2007. The role of crop residues in improving soil fertility. In: Petra Marschner and Z. Rengel (Editors), Nutrient cycling in terrestrial ecosystem. Soil Biology. Springer Berlin Heidelberg, Berlin, pp. 183-214.
Bhupinderphal, S., Rengel, Z. and Bowden, J.W., 2006. Carbon, nitrogen and sulphur cycling following incorporation of canola residue of different sizes into a nutrient-poor sandy soil. Soil Biology & Biochemistery, 38: 32-42.
Bligh, E.G. and Dyer, W.J., 1959. A rapid method of total lipid extraction and purification. Canadian Journal of Biochemistry and Physiology, 37: 911-917.
105
Brindley, G.W. and Brown, G. (Editors), 1980. Crystal structures of clay minerals and their X-ray identification. Mineralogical Society, London.
Cambardella, C.A. and Elliott, E.T., 1992. Particulate soil organic matter changes across a grassland cultivation sequence. Soil Science Society of America Journal, 56(3): 777-783.
Chaney, K. and Swift, R.S., 1984. The influence of organic matter on aggregate stability in some British soils. Journal of Soil Science, 35: 223-230.
Chittleborough, D.J. and Oades, J.M., 1979. The development of a Red-Brown Earth. I. A reinterpritation of published data. Australian Journal of Soil Research, 17: 371-381.
Chotte, J.L., Ladd, J.N. and Amato, M., 1998. Sites of microbial assimilation, and turnover of soluble and particulate 14C-labelled substrates decomposing in a clay soil. Soil Biology & Biochemistery, 30(2): 205-218.
Churchman, G.J., 2006. Soil phases: the inorganic solid phase. In: C. Giacomo and S. Riccardo (Editors), Soils: Basic concepts and future challenges. Cambridge University Press, New York, pp. 23-45.
Churchman, G.J., Skjemstad, J.O. and Oades, J.M., 1993. Influence of clay minerals and organic matter on effects of sodicity on soils. Australian Journal of Soil Research, 31(6): 779-800.
Churchman, G.J. and Tate, K.R., 1986. Aggregation of clay in six New Zealand soil types as measured by disaggregation procedure. Geoderma, 37: 207-220.
Clark, L.J., 2004. Changes in properties of vineyard red brown earths under long - term drip irrigation, combined with varying water qualities and gypsum application rates, University of Adelaide, Adelaide.
Clarke, K.R. and Warwick, R.M., 2001. Change in marine communities: an approach to statistical analysis and interpretation. 2nd Edition. Primer-E, Plymouth, UK.
Dalal, R.C. and Chan, K.Y., 2001. Soil organic matter in rainfed cropping systems of the Australian cereal belt. Australian Journal of Soil Research, 39(3): 435-464.
Denef, K., Six, J., Merckx, R. and Paustian, K., 2004. Carbon sequestration in microaggregates of no-tillage soils with different clay mineralogy. Soil Science Society of America Journal, 68(6): 1935-1944.
Dixon, J.B., 1991. Roles of clays in soils. Applied Clay Science, 5: 489-503. Favre, F., Bogdal, C., Gavillet, S. and Stucki, J.W., 2006. Changes in the CEC of a soil smectite-
kaolinite clay fraction as induced by structural iron reduction and iron coatings dissolution. Applied Clay Science, 34(1-4): 95-104.
Fening, J.O., Adjei-Gyapong, T., Yeboah, E., Ampontuah, E.O., Quansah, G. and Danso, S.K.A., 2005. Soil fertility status and potential organic inputs for improving small holder crop production in the interior savanna zone of Ghana. Journal of Sustainable Agriculture, 25(4): 69-92.
Frostegård, Å., Baath, E. and Tunlid, A., 1993. Shifts in the structure of soil microbial communities in limed forests as revealed by phospholipid fatty acid analysis. Soil Biology & Biochemistery, 25(6): pp. 723-730.
Gaskell, M. et al., 2007. Soil fertility management for organic crops, Organic vegetable production in California. Division of Agriculture and Natural Resources, University of Carlifonia, Oakland, Carlifonia.
Golchin, A., Oades, J.M., Skjemstad, J.O. and Clarke, P., 1994a. Soil structure and carbon cycling. Australian Journal of Soil Research, 32(5): 1043-1068.

106
Golchin, A., Oades, J.M., Skjemstad, J.O. and Clarke, P., 1994b. Study of free and occluded particulate organic matter in soils by solid state 13C Cp/MAS NMR spectroscopy and scanning electron microscopy. Australian Journal of Soil Research, 32(2): 285-309.
Goldberg, S., Lebron, I. and Suarez, D.L., 2000. Soil collodial behaviour. In: M.E. Sumner (Editor), Handbook of soil science. CRC Press LLC, Boca Raton, Florida, pp. B195-B235.
Grant, C.D. and Blackmore, A.V., 1991. Self-mulching behaviour in clay soil: its definition and measurement. Australian Journal of Soil Research, 29: 155-173.
Hassink, J., 1997. The capacity of soils to preserve organic C and N by their association with clay and silt particles. Plant and Soil, 191(1): 77-87.
Hook, P.B. and Burke, I.C., 2000. Biogeochemistry in a shortgrass landscape: control by topography, soil texture, and microclimate. Ecology, 81(10): 2686-2703.
Huang, P.M., Wang, M.K. and Chiu, C.Y., 2005. Soil mineral-organic matter-microbe interactions: impacts on biogeochemical processes and biodiversity in soils. Pedobiologia, 49(6): 609-635.
Ilstedt, U., Nordgren, A. and Malmer, A., 2000. Optimum soil water for soil respiration before and after amendment with glucose in humid tropical acrisols and a boreal mor layer. Soil Biology & Biochemistry, 32(11-12): 1591-1599.
Jackson, M.L., 1956. Soil chemical analysis: advanced courses. Published by the author, Department of soil, University of Wisconsin, Madison, 991 pp.
Jenkinson, D.S., 1977. Studies on the decomposition of plant material in soil. V. The effects of plant cover and soil type on the loss of carbon from 14C labelled ryegrass decomposing under field conditions. European Journal of Soil Science, 28(3): 424-434.
Kaiser, K. and Zech, W., 2000. Dissolve organic matter sorption by mineral constituents of subsoil clay fraction. Journal of Plant Nutrition and Soil Science, 163: 531-535.
Koelbl, A. and Koegel-knabner, I., 2004. Content and composition of free occluded particulate organic matter in a differently textured arable Cambisol as revealed by solid-state 13C NMR spectroscopy. Journal of Plant Nutrition and Soil Science, 167: 45-53.
Krull, E., Baldock , J. and Skjemstad, J.O., 2001. Soil texture effects on decomposition and soil carbon storage. In: U.F.K. Miko and R. Mueller (Editors), Net ecosystem exchange: workshop proceeding. CRC for Greenhouse Accounting, Canberra, pp. 103-110.
Krull, E.S., Skjemstad, J.O. and Baldock, J.A., 2004. Functions of soil organic matter and the effect on soil properties, Grains Research and Development Corporation, Glen Osmond.
Kumar, K. and Goh, K., 2000. Crop residues and management practices: effects on soil quality, soil Nitrogen dynamics, crop yield, and nitrogen recovery. Advance in Agronomy, 68: 197-319.
Ladd, J.N., Amato, M. and Oades, J.M., 1985. Decomposition of plant material in Australian soils. III. Residual organic and microbial biomass C and N from isotope-labelled legume material and soil organic matter, decomposing under field conditions. Australian Journal of Soil Research, 23(4): 603-611.
Ladd, J.N., Jocteur-Monrozier, L. and Amato, M., 1992. Carbon turnover and nitrogen transformations in an alfisol and vertisol amended with [U-14C] glucose and [15N] ammonium sulfate. Soil Biology & Biochemistry, 24(4): 359-371.
Ladd, J.N., Oades, J.M. and Amato, M., 1981. Microbial biomass formed from 14C, 15N-labelled plant material decomposing in soils in the field. Soil Biology & Biochemistry, 13(2): 119-126.
107
Lal, R., 1998. Soil quality and agricultural sustainability. In: R. Lal (Editor), Soil quality and agricultural sustainability. Ann Abour Press, Chelsea, pp. 3-12.
Lavelle, P. and Spain, A.V., 2005. Decomposition, Soil ecology. Springer, Dordrecht, The Netherlands, pp. 359-387.
Marshall, T.J., Holmes, J.W. and Rose, C.W., 1996. Soil Physics. The Press Syndicate of The University of Cambridge, Cambridge.
McMahon, S.K., Williams, M.A., Bottomley, P.J. and Myrold, D.D., 2005. Dynamics of microbial communities during decomposition of Carbon-13 Labeled ryegrass fractions in soil. Soil Science Society of America Journal, 69: 1238-1247.
Mehra, O.P. and Jackson, M.L., 1960. Iron-oxide removal from soils and clays by a dithionite-citrate system buffered with sodium bicarbonate. Clay Mineral, 7: 317-327.
Mtambanengwe, F., Mapfumo, P. and Kirchmann, H., 2004. Decomposition of organic matter in soil as influenced by texture and pore size distribution. In: B. André (Editor), Managing nutrient cycles to sustain soil fertility in Sub-Saharan Africa. Academy Science Publishers, Nairobi, pp. 261-276.
Nagai, K., Suzuki, K. and Okada, G., 1998. Studies on the distribution of alkalophilic and alkali-tolerant soil fungi II: Fungal flora in two limestone caves in Japan. Mycoscience, 39(3): 293-298.
Needelman, B.A., Wander, M.M., Bollero, G.A., Boast, C.W., Sims, G.K. and Bullock, D.G., 1999. Interaction of tillage and soil texture: biologically active soil organic matter in Illinois. Soil Science Society of America Journal, 63(5): 1326-1334.
Njunie, M.N., Wagger, M.G. and Luna-Orea, P., 2004. Residue decomposition and nutrient release dynamics from two tropical forage legumes in a Kenyan environment. Agronomy Journal, 96: 1073-1081.
Norrish, K. and Hutton, J.T., 1969. An accurate X-ray spectrographic method for the analysis of a wide range of geological samples. Geochimia Cosmochimia Acta, 33: 431-53.
Norrish, K. and Pickering, J.G., 1983. Clay Minerals, Soil: an Australian viewpoint. CSIRO, Melbourne and Academic Press, London, pp. 281-308.
Northcote, K.H., 1981. Morphology, distribution and classification. In: J.M. Oades, D.G. Lewis and k. Norrish (Editors), Red-Brown Earths of Australia. Waite Agricultural Institute & CSIRO Division of Soils, Adelaide, pp. 11-28.
Oades, J., 1988. The retention of organic matter in soils. Biogeochemistry, 5(1): 35-70. Oades, J.M., 1989. An introduction to organic matter in mineral soils. In: J.B. Dixon and S.B.
Weed (Editors), Minerals in soil environment. Soil Science Society of America, Wisconsin, USA, pp. 89-152.
Paul, K., 2001. Temperature and moisture effects on decomposition. In: U.F.K. Miko and R. Mueller (Editors), Net ecosystem exchange: workshop proceeding. CRC for Greenhouse Accounting, Canberra, pp. 95-102.
Percival, H.J., Parfitt, R.L. and Scott, N.A., 2000. Factors Controlling Soil Carbon Levels in New Zealand Grasslands: Is Clay Content Important? Soil Sci Soc Am J, 64(5): 1623-1630.
Plante, A.F., Conant, R.T., Stewart, C.E., Paustian, K. and Six, J., 2006. Impact of soil texture on the distribution of soil organic matter in physical and chemical fractions. Soil Science Society of America Journal, 70: 287-296.
Prasad, R. and Power, J.F., 1991. Crop residue management. Advance in Soi Science, 15: 205-239.
108
Rasmussen, C., Torn, M.S. and Southard, R.J., 2005. Mineral assemblage and aggregates control carbon dynamics in a California conifer forest. Soil Sci Soc Am J, 69: 1711-1721.
Rasmussen, P. and Collins, H., 1990. Long term impacts of tillage, fertiliser, and crop residue on soil organic matter in temperate semiarid regions. Advance in Agronomy, 45: 93-134.
Raubuch, M., Dyckmans, J., Joergensen, R.G. and Kreutzfeldt, M., 2002. Relation between respiration, ATP content, and Adenylate energy charge (AEC) after incubation at different temperatures and after drying and rewetting. Journal of Plant Nutrition and Soil Science, 165: 435-440.
Rayment, G.E. and Higginson, F.R., 1992. Australian laboratory handbook of soil and water chemical methods. Australian soil and land survey handbook. Inkata Press, Melbourne.
Rodella, A.A. and Saboya, L.V., 1999. Calibration for conductimetric determination of carbon dioxide. Soil Biology & Biochemistery, 31: 2059-2060.
Rousk, J., Brookes, P.C. and Baath, E., 2009. Contrasting soil pH effects on fungal and bacterial growth suggest functional redundancy in carbon mineralization. Applied and Enviromnental Microbiology, 75(6): 1589-1596.
Saggar, S., Parshotam, A., Sparling, G.P., Feltham, C.W. and Hart, P.B.S., 1996. 14C-labelled ryegrass turnover and residence times in soils varying in clay content and mineralogy. Soil Biology & Biochemistry, 28(12): 1677-1686.
Salas, A.M., Elliot, E.T., Westfall, D.G., Cole, C.V. and Six, J., 2003. The role of particulate organic matter in phosphorus cycling. Soil Science Society of America Journal, 67: 181-189.
Sanyal, S.K., 2002. Soil colloids. In: G.S. Sekhon et al. (Editors), Fundamentals of soil science. Indian society of soil science, New Delhi.
Schimel, D.S., Coleman, D.C. and Horton, K.A., 1985. Soil organic matter dynamics in paired rangeland and cropland toposequences in North Dakota. Geoderma, 36(3-4): 201-214.
Schlecht-Pietsch, S., Wagner, U. and Anderson, T.H., 1994. Changes in composition of soil polysaccharides and aggregate stability after carbon amendments to different textured soils. Applied Soil Ecology, 1(2): 145-154.
Six, J., Conant, R.T., Paul, E.A. and Paustian, K., 2002. Stabilization mechanisms of soil organic matter: implications for C-saturation of soils. Plant and Soil, 241(2): 155-176.
Skene, T.M., Skjemstad, J.O., Oades, J.M. and Clarke, P.J., 1996. The influence of inorganic matrices on the decomposition of straw. Australian Journal of Soil Research, 34(3): 413-426.
Skene, T.M., Skjemstad, J.O., Oades, J.M. and Clarke, P.J., 1997. The influence of inorganic matrices on the decomposition of Eucalyptus litter. Australian Journal of Soil Research, 35(1): 73-88.
Skjemstad, J.O., Clarke, P., Taylor, J.A., Oades, J.M. and McClure, S.G., 1996. The chemistry and nature of protected carbon in soil. Australian Journal of Soil Research, 34(2): 251-271.
Sollin, P., Hofmann, P. and Caldwell, B.A., 1996. stabilization and destabilization of soil organic matter: mechanisms and controls. Geoderma, 74: 65-105.
Sørensen, L., 1983. Size and persistence of the microbial biomass formed during the humification of glucose, hemicellulose, cellulose, and straw in soils containing different amounts of clay. Plant and Soil, 75(1): 121-130.
Spain, A.V., 1990. Influence of environmental conditions and some soil chemical properties on the carbon and nitrogen contents of some tropical Australian rainforest soils. Australian Journal of Soil Research, 28(6): 825-839.
109
Spain, A.V., Isbell, R.F. and Probert, M.E., 1983. Soil organic matter, ISoil: an Australian viewpoint. CSIRO, Melbourne and Academic Press, London, pp. 551-63.
Stace, H.C.T. et al., 1968. A Handbook of Australian Soils. Rellim Technical Publications, Glenside,SA.
Stucki, J.W., 2006. Properties and iron in clay minerals. In: F. Bergaya, B. Theng and G. Lagaly (Editors), Handbook of clay science. Elsevier Ltd., pp. 423-475.
Summerell, B.A. and Burgess, L.W., 1989. Decomposition and chemical composition of cereal straw. Soil Biology & Biochemistery, 21(4): 551-559.
Swift, M.J., Heal, O.W. and Anderson, J.M., 1979. Decomposition in terrestrial ecosystems. Blackwell Scientific Publication, California, 372 pp.
Theng, B., 1979. Formation and properties of clay-polymer complexes. Development in soil science, 9. Elsevier Scientific Publishing Company, Amsterdam, 353 pp.
Thomsen, I.K., Schjønning, P., Jensen, B., Kristensen, K. and Christensen, B.T., 1999. Turnover of organic matter in differently textured soils: II. Microbial activity as influenced by soil water regimes. Geoderma, 89(3-4): 199-218.
Thomson, C.H., Moore, A.W. and Northcote, K.H., 1983. Soils and land use, In Soils: an Australian View Point. CSIRO, Melbourne and Academic Press, London, pp. 759-760.
Trinsoutrot, I., Recous, S., Bentz, B., Lineres, M., Cheneby, D. and Nicolardot, B., 2000. Biochemical quality of crop residues and carbon and nitrogen mineralisation kinetics under nonlimiting nitrogen conditions. Soil Science Society of America Journal, 64: 918-926.
Turchenek, L.W. and Oades, J.M., 1979. Fractionation of organo-mineral complexes by sedimentation and density techniques. Geoderma, 21(4): 311-343.
Van Veen, J.A. and Kuikman, P.J., 1990. Soil structural aspects of decomposition of organic matter by micro-organisms. Biogeochemistry, 11: 213-233.
Voroney, R.P., Paul, E.A. and Anderson, D.W., 1989. Decomposition of wheat straw and stabilization of microbial products. Canadian Journal of Soil Science, 69: 63-77.
Wagner, G.H. and Wolf, D.C., 1999. Carbon transformations and soil organic matter formation. In: D.M. Sylvia, J.J. Fuhrmann, P.G. Hartel and D.A. Zuberer (Editors), Principles and application of soil microbiology. Prentice Hall, Inc., New Jercy, pp. 218-258.
Wander, M., 2004. Soil organic matter fractions and their relevance to soil function. In: F. Magdoff and R.R. Weil (Editors), Soil organic matter in sustainable agriculture. Advances in agroecology. CRC Press LLC, Boca Raton, Florida, pp. 67-102.
Wattel-Koekkoek, E.J.W., van Genuchten, P.P.L., Buurman, P. and van Lagen, B., 2001. Amount and composition of clay-associated soil organic matter in a range of kaolinitic and smectitic soils. Geoderma, 99(1-2): 27-49.
Williams, C.H., 1981. Chemical Properties. In: J.M. Oades, D.G. Lewis and k. Norrish (Editors), Red-Brown Earths of Australia. Waite Agricultural Institute & CSIRO Division of Soils, Adelaide, pp. 47-61.
Yeoh, N.S. and Oades, J.M., 1981. Properties of clays and soils after acid treatment. II* Urrbrae fine sandy loam. Australian Journal of Soil Research, 19: 159-166.
Zak, J.C. and Wildman, H.G., 2004. Fungi in stressful environment. In: G.M. Mueller, G.F. Bills and M.S. Foster (Editors), Biodiversity of fungi: inventory and monitoring methods. Elsevier Academic Press, San Diego, CA, pp. 303-316.
110
Zhuang, J. and Yu, G.-R., 2002. Effects of surface coatings on electrochemical properties and contaminant sorption of clay minerals. Chemosphere, 49(6): 619-628.