the university of hong kong librariesebook.lib.hku.hk/hkg/b3584453x.pdf · ... ericsson's...
TRANSCRIPT


THE UNIVERSITY OF HONG KONGLIBRARIES
Hong Kong Collection
http://www.ofta.gov.hk/report-paper-guide/report/rp20000117.html
Reports on Trials on IMT-2000 and Local Multipoint Distribution Services (LMDS)Technology
The Office of the Telecommunications Authority (OFTA) has approved a number of trials onIMT-2000 and LMDS technologies at the request of members of the industry on theunderstanding that the results of the trials should be made available for reference byinterested parties.
The following companies have already submitted the reports on their trials to OFTA . Youmay download them for reference -
Trial on IMT-2000 Technology
SmarTone Mobile Communications Limited on Wideband CDMA Technology
Trial on LMDS Technology
• HKNet-Telliqent Company Limited
• PSINet Hong Kong Limited IMS
• SmarTone Mobile Communications Limited
City Telecom (HK) Limited
Office of the Telecommunications Authority17 January 2000
*
Report for Wideband CDMA Field TrialSmarTone Mobile Communications Limited
SIB.
DATE
CLAS^JSIO.
NO.
Evaluation ReportFor
Wideband CDMA Field Trial
Version
A
B
Date
11*00199
23rd Dec 99
Prepared by
Jimmy Ling
Jimmy Ling
Approved by
Katherine Kwan
Katherine Kwan
Consultancy Business Unit17/01/00
Page/

Report for Wideband CDMA Field TrialSmarTone Mobile Communications Limited
VERSION HISTORY
Ver Date Description
A 11th Oct 99 Draft Report
B 23rd Dec 99 Grammatical Correction
DISTRIBUTION
To: Stephen Chau, Alan Mok, Daniel Leung, Katherine Kwan, Vivian Ng,Martin Ma, SL Lee
cc.: Edas Wong (Ericsson)
FILE REFERENCE
S:\CBU\DEV\Report\CB90238.DOC[si]
APPENDICES
Consultancy Business Unit Page 217/01/00
SMARTONE
Report for Wideband CDMA Field TrialSmarTone Mobile Communications Limited
TABLE OF CONTENTS
VERSION HISTORY
DISTRIBUTION
FILE REFERENCE
APPENDICES
TABLE OF CONTENTS
1 . EXECETIVE SUMMARY
2. OBJECTIVES
3. SYSTEM OVERVIEW
3,1 SYSTEM SETUP3 .2 THE NETWORK ELEMENTS
4. TEST PROCEDURES AND RESULTS
TEST ITEMS4. l IDLE MODE AGAINST ACTIVE MODE COVERAGE4.1.1 IDLE MODE COVERAGE4. 1 .2 ACTIVE MODE COVERAGE (VOICE SERVICE)4. 1 .3 ACTIVE MODE COVERAGE (DATA SERVICE)4.2 OWN SECTOR SELECTION - EVALUATION CRITERION4.3 OWN SECTOR SELECTION - FILTERING TIME4.4 SOFTER/SOFT HANDOVER PERFORMANCE4.5 SOFTER/SOFT HANDOVER EVALATION CRITERIONS4.6 HANDOVER - FILTERING LENGTH4.7 INTER-FREQUENCY HANDOVER EVALUATION CRITERIONS4.8 MINIMUM AND MAXIMUM MS TRANSMIT POWER4.9 FAST POWER CONTROL PERFORMANCE4. 1 0 FAST POWER CONTROL IN "SOFT HANDOVER" CASE
Requirement: Two BTSs, each BTS has one sectorFigure 34 The active set of the test route is shared by BTS 1 and BTS 2
4. 1 1 "POOR DOWNLINK" AND "POOR UPLINK" CONDITIONRequirement: One BTS with one sector
4. 1 2 MULTIPLE PATH CHARACTERISTICSPreparation: 1 . Activate uplink or downlink fast power control
5 CONCLUSION
APPENDIX A - ABBREVIATIONS
APPENDIX B - WCDMA BTS ANTENNA
APPENDIX C - NETWORK ELEMENT FUNCTIONAL OUTLINE
W-BSC (RNC) FUNCTIONSDistribution of System InformationTraffic Channel AssignmentHandover evaluation and execution
2
2
2
2
3
5
6
7
810
14
1414141617192224283437404346464748485151
53
54
55
56
56565656
Consultancy Business Unit Page 317/01/00
SMART ONE
Report for Wideband CDMA Field TrialSmarTone Mobile Communications Limited
W-MSC FUNCTIONS 57Call Control Functions 57Mobile Station to PRI, PRI to Mobile Station, voice call 57Mobile Station to Mobile Station, voice call 57Other functions 57
MSSIM FUNCTION 57Call Control Functions 57Radio Network Control Functions 58
BTS FUNCTIONS 58Radio Link Control 58
APPENDIX D - RELEVENT MEASUREMENT OBJECT & COMMAND 59
APPENDIX E - MEASUREMENT & RADIO PARAMETER DESCRIPTION 62
Consultancy Business Unit Page 417/01/00

Report for Wideband CDMA Field TrialSmarTone Mobile Communications Limited
L EXECETTVE SUMMARY
By the next millennium, the demand for mobile telephony access would not be limited tovoice communications. In fact, there is an increasing urge for internet access, videoconferencing, real-time transmission of high quality image files, etc. from users withmobility. Continuous development of today's 2nd generation mobile system would allowup to 384kbps. The change from 2nd to 3rd generation mobile communications systems isnot as fundamental as the technology shift from analogue to digital generation networks.It is necessary to provide a high bandwidth backbone (to data-rate @ 2Mbps) with globalroaming capability, as well as improved capacity & coverage on the radio interface, tosupport the high bit-rate multimedia services in the future.
Wideband Code Division Multiple Access (W-CDMA) is one of the prospective 3rd
Generation (3G) Mobile Communication technologies, supported by European (ETSI)and Japanese (ARIB) standardisation organisations. ITU will finalise the radiorecommendations for IMT-2000 by year 1999. It is understood that 3G system isexpected to be licensed in Hong Kong within the next couple of years.
SmarTone and Ericsson have jointly conducted a field trial on the W-CDMAexperimental system supplied by Ericsson. Similar experimental systems have been setup in Germany, Sweden, UK, Italy, Canada, Japan and China.
The trial is to facilitate the understanding and appreciation of the system characteristicsand multimedia capability of W-CDMA technology, to the advanced knowledge of thestaffs. The results produced would be opened to the industry and academia for reference,which will stimulate local interest on the technology & application development. Finally,the trial result would be one of the important references to the local regulatory body forlying the licensing specifications.
The trial & demonstration, consisting of two base stations, was run from mid-April to endAugust 99. Ericsson's experimental system supports up to 384kbps for circuit and472.6kbps for packet-switched wireless services with a wide-area coverage. The systemin Hong Kong has been used for demanding real-life tests and demonstrations of new andinnovative multimedia applications, while much efforts have been spent on the evaluationof its radio characteristics. Tested features include active and idle mode coverage, cellselection criterion, softer/ soft handover, fast power control and inter-frequency handover,etc. Investigations on the possible adjacent channel interference from other narrow band& wideband communications systems have been conducted and the results beingpublished in an earlier report. Apparently, no adjacent channel interference fromneighboring WCDMA systems could be observed, with the 5 MHz carrier separationdefined.
Consultancy Business Unit Page 517/01/00
SMARTONK
Report for Wideband CDMA Field TrialSmarTone Mobile Communications Limited
On the radio planning for WCDMA system, the relative interference level, perceived bythe system as 'Energy per Detected Bit to Interference Density Ratio1, would be one of thecritical input factors to be considered. Cell coverage is affected by the interference level,instead of the received signal strength alone, for CDMA systems. For supporting a highdata rate channel, a degradation in sensitivity has been noticed, which is proportional tothe logarithm of the channel data rate. Hence, higher transmission power would berequired to maintain the same cell service area for wideband data as for voice services.
The closed loop fast power control feature for WCDMA can achieve a control cycle of0.625 ms on the Experimental System. Careful considerations on the operational range onimplementation would be required, since the unprotected power control information bitcould be corrupted under poor signal condition.
Soft handover and inter-frequency handover are important characteristics of the system toprovide improvements on the radio performance and effective spectral utilisation. Thesystem loading effect and interference have to be further investigated when more trafficcould be generated.
2. OBJECTIVES
The objectives of the WCDMA field evaluation :
2.1 To provide an early chance to experience the radio characteristics and operation ofthe WCDMA system for the engineering staffs of Smartone. Some of the special areaof focus include its wideband properties and CDMA features such as frequencydiversity, multi-path diversity and power control problem, etc.
2.2 To provide understanding of the technology and system architecture as a backgroundfor the strategic planning of the evolution path of the existing GSM network to merge/ migrate to the next generation system, in terms of infrastructure investment andapplications development.
2.3 To arise general awareness and useful results for the industry and academia on theadvanced technology development.
2.4 To provide reference results for the authoring bodies and industry on the spectrumallocation and other related issues for considerations on how to fit the technology intothe Hong Kong microcell environment,
2.5 To enhance the image of the local telecommunications industry as 'technologyleadership' and pave way for the future Asian 'telecom hub' in the region.
Consultancy Business Unit Page 617/01/00
SMARTONE

Report for Wideband CDMA Field TrialSmarTone Mobile Communications Limited
3. SYSTEM OVERVIEW
The Experimental System (ES) is a facilitator for the UMTS/MT-2000 standardization.It aims to demonstrate new advanced third generation services and WCDMA technicalsolutions in an ATM backbone environment.
The experimental system consists of:• Mobile Station Simulator (MS-SIM)• Base Transceiver Station Antenna (BTS-ANT)• Base Transceiver Station (BTS)• Radio Network Controller (RNC / W-BSC)• Mobile Service Switching Centre (MSC)• WCDMA Operations System (WOS)
BTS-ANT
Voice
BTS-AWT Raws Tranaosswef Slaiion Antenna {noi BTSincluded) MSOS opewttona system M5CRNC Radio Nclvrarfc Carrirriler
9ase Transceiver SiaiionMobile SlaltanMoDlte Seivtee* Swstemn^ Centre
Figure 1 System Overview
The system is built for experimenting with the WCDMA Radio Access network andATM transport network, applying to different wideband services. The Mobile StationSimulator (MS-SIM), Base Transceiver Station (BTS), Radio Network Controller (RNC),Mobile Services Switching Centre (MSC) and the WCDMA Operations Systems (OS) allhave similar and flexible architecture.
The newly defined "lub-" and "lu-" interface is the BTS - RNC and RNC - MSC interfacerespectively, where ATM is supported.
Consultancy Business Unit17/01/00
Page/
SMARTONE
Report for Wideband CDMA Field TrialSmarTone Mobile Communications Limited
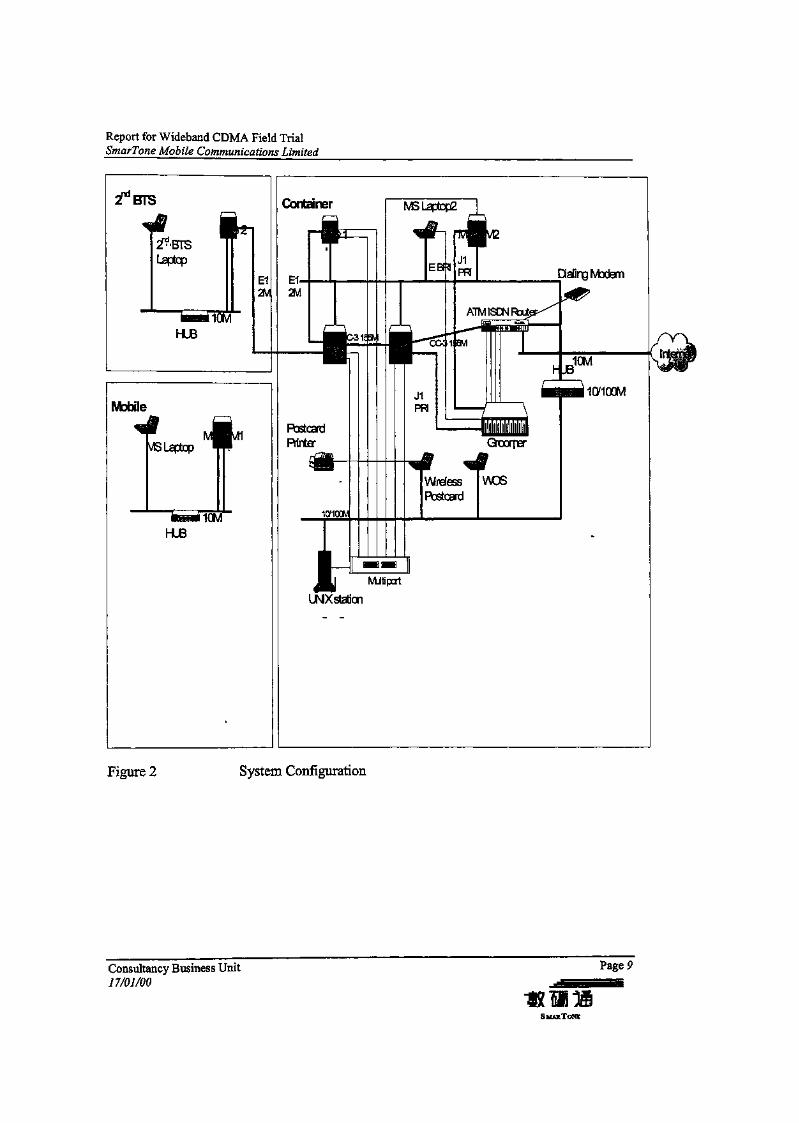
During the evaluation, all measurement data required from the experimental system arecollected from appropriate parts over the system and sent to the WCDMA operatingsystem for logging, and thereafter be post-processed and presented.
3.1 System Setup
The WCDMA ES is located at Shek Mun, Shatin. A MSC, a RNC and 2 BTS areinstalled in the test area. BTSs and Antenna are located at the two sites, Topsail Plaza andNew Commerce Centre.
The main container, which consists of a MSC, a RNC, a BTS, a fixed MS-SIM and someapplication tools, is placed at the ground floor of Topsail Plaza. Regarding the sectors,two of them are mounted on the outside wall pointing to the remote site. The third sectoris mounted inside the car park for the indoor coverage.
The New commerce Centre site, which is about 300 meter away from the Topsail site,contains a BTS with two sectors. The BTS is connected to the previously mentionedcontainer's RNC with an El link and two sector antennae are mounted outside thebuilding with the directions pointing towards the first site.
MS-SIM is installed on a demo car. With the aid of measurement tools, the MS-SIM canbe driven along the test route and the corresponding data can be captured.
The infrastructure of the experiment system is shown as below:
Consultancy Business Unit Page 817/01/00
S MAR TONE
Report for Wideband CDMA Field TrialSmarTone Mobile Communications Limited
Figure 2 System Configuration
Consultancy Business Unit17/01/00
PageP
•mmm
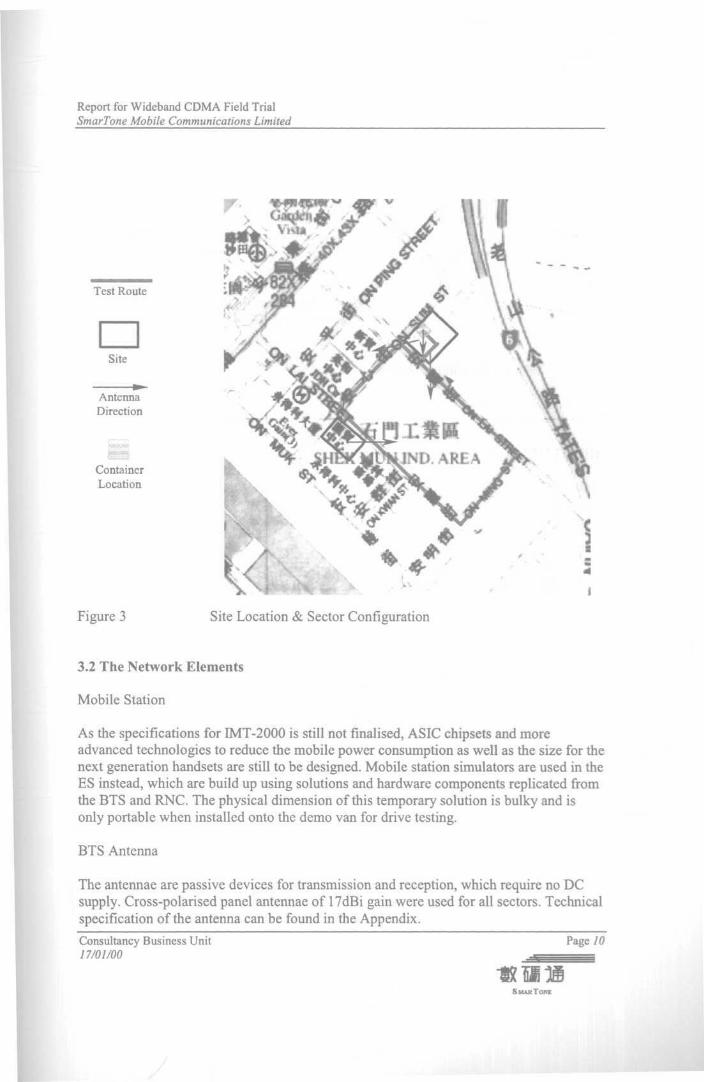
Report for Wideband CDMA Field TrialSmarTone Mobile Communications Limited
Test Route
Site
AntennaDirection
ContainerLocation
MFigure 3 Site Location & Sector Configuration
3.2 The Network Elements
Mobile Station
As the specifications for IMT-2000 is still not finalised, ASIC chipsets and moreadvanced technologies to reduce the mobile power consumption as well as the size for thenext generation handsets are still to be designed. Mobile station simulators are used in theES instead, which are build up using solutions and hardware components replicated fromthe BTS and RNC. The physical dimension of this temporary solution is bulky and isonly portable when installed onto the demo van for drive testing.
BTS Antenna
The antennae are passive devices for transmission and reception, which require no DCsupply. Cross-polarised panel antennae of 17dBi gain were used for all sectors. Technicalspecification of the antenna can be found in the Appendix.
Consultancy Business Unit17/01/00
Page 10
SMARTONE

Report for Wideband CDMA Field TrialSmarTone Mobile Communications Limited
Base Transceiver Station BTS
In order to meet the flexibility needed for an experimental system, the hardwarearchitecture is structured on a functional basis. The MS user data capacity, radio cell sizeand the radio interference will be limiting factors for the total user data bandwidth. Ineach BTS, it is possible to connect traffic capacity corresponding to a maximum sixsectors with 5MHz carrier or three sectors with two 5MHz carriers per sector.
It is possible to connect 64 voice channels, or 16UDI 64kbps, or 8UDI 2*64kbps or forpacket, eight 76kbps to two 472kbps channels on each BTS. Mixed service is alsopossible.
ES BTS supports 20MHz bandwidth in both uplink and downlink with a duplex distanceof 190MHz.
For the experimental system, two carriers were used
Downlink 2120 - 2130MHz with two 5MHz carriers at 2122.5MHz and 2127.5MHz
Uplink 1930 -- 1940MHz with two 5MHz carriers at 1932.5MHz and 1937.5MHz
Some important ES BTS radio characteristics and performance :
Table 3.1 Common Radio Characteristics of ES BTSItem
Bandwidth
Carrier frequency spacingFrequency stabilityChip rateNumber of carriersNumber of sectors
Modulation/ Demodulationmethod
Frame lengthNumber of time slots perframeEncoding / Decoding method
Specifications
5 MHz per carrier with the supported 20MHz frequencyband5 MHz+/- 0,02 ppm4.096 Mcps26 (1 carrier per sector) or3 (2 carriers per sector)Data : QPSK, pilot symbol aided coherent detectionRAKESpreading : QPSK10ms16
Inner coding for traffic channels and ACCH:convolutional encoding (R=l/3, K=9), soft decisionViterbi decoding
Inner coding for control channels except ACCH :
Consultancy Business Unit17/01/00
Page 11
S MAE TONE
Report for Wideband CDMA Field TrialSmarTone Mobile Communications Limited
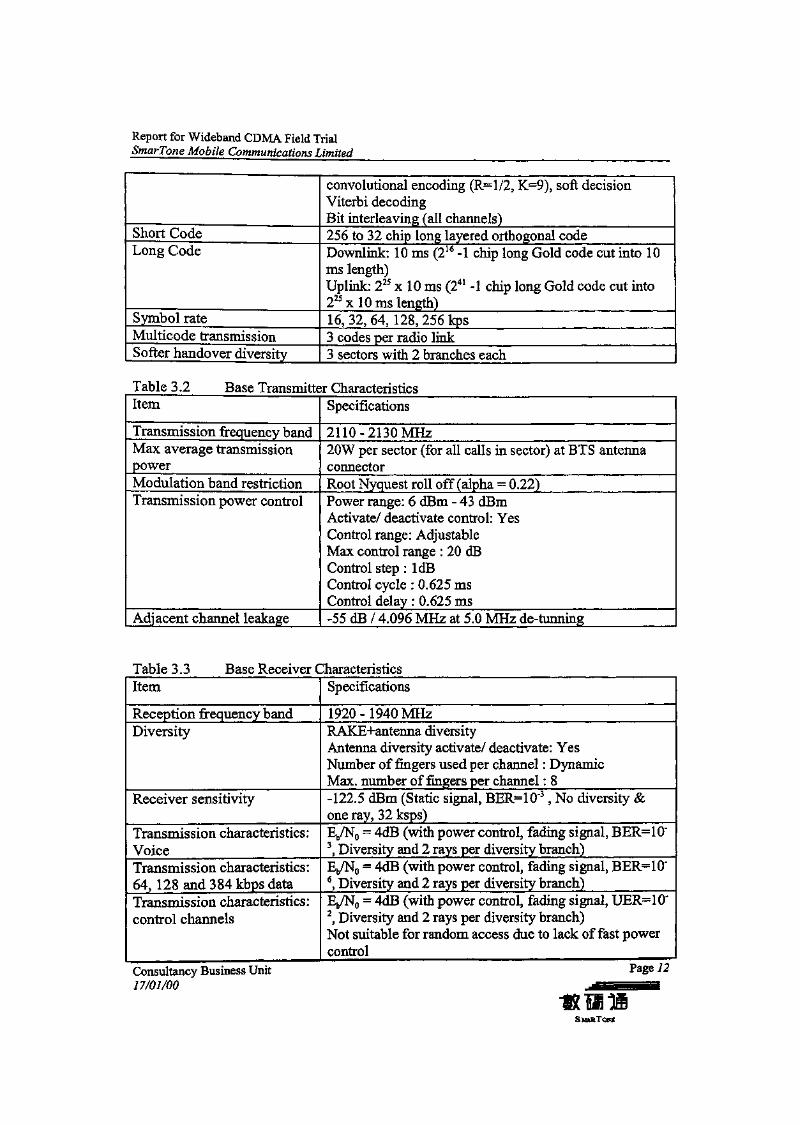
Short CodeLong Code
Symbol rateMulticode transmissionSofter handover diversity
convolutional encoding (R=l/2, K=9), soft decisionViterbi decodingBit interleaving (all channels)256 to 32 chip long layered orthogonal codeDownlink: 10 ms (216 -1 chip long Gold code cut into 10ms length)Uplink: 225 x 10 ms (241 -1 chip long Gold code cut into225x 10ms length)16, 32, 64, 128, 256 kps3 codes per radio link3 sectors with 2 branches each
Table 3.2 Base Transmitter CharacteristicsItem
Transmission frequency bandMax average transmissionpowerModulation band restrictionTransmission power control
Adjacent channel leakage
Specifications
2110 -2130 MHz20W per sector (for all calls in sector) at BTS antennaconnectorRoot Nyquest roll off (alpha = 0.22)Power range: 6 dBm - 43 dBmActivate/ deactivate control: YesControl range: AdjustableMax control range : 20 dBControl step : IdBControl cycle : 0.625 msControl delay : 0.625 ms-55 dB / 4.096 MHz at 5.0 MHz de-tunning
Table 3.3 Base Receiver CharacteristicsItem
Reception frequency bandDiversity
Receiver sensitivity
Transmission characteristics:VoiceTransmission characteristics:64, 128 and 3 84 kbps dataTransmission characteristics:control channels
Specifications
1920 -1940 MHzRAKE+antenna diversityAntenna diversity activate/ deactivate: YesNumber of fingers used per channel : DynamicMax. number of fingers per channel : 8-122.5 dBm (Static signal, BER=10~3 , No diversity &one ray, 32 ksps)Eb/N0 = 4dB (with power control, fading signal, BER=10~3, Diversity and 2 rays per diversity branch)Eb/N0 = 4dB (with power control, fading signal, BER=10~6, Diversity and 2 rays per diversity branch)Eb/N0 = 4dB (with power control, fading signal, UER=10"2, Diversity and 2 rays per diversity branch)Not suitable for random access due to lack of fast powercontrol
Consultancy Business Unit/ 7/01/00
Page 12
S MAE TONE
Report for Wideband CDMA Field TrialSmarTone Mobile Communications Limited
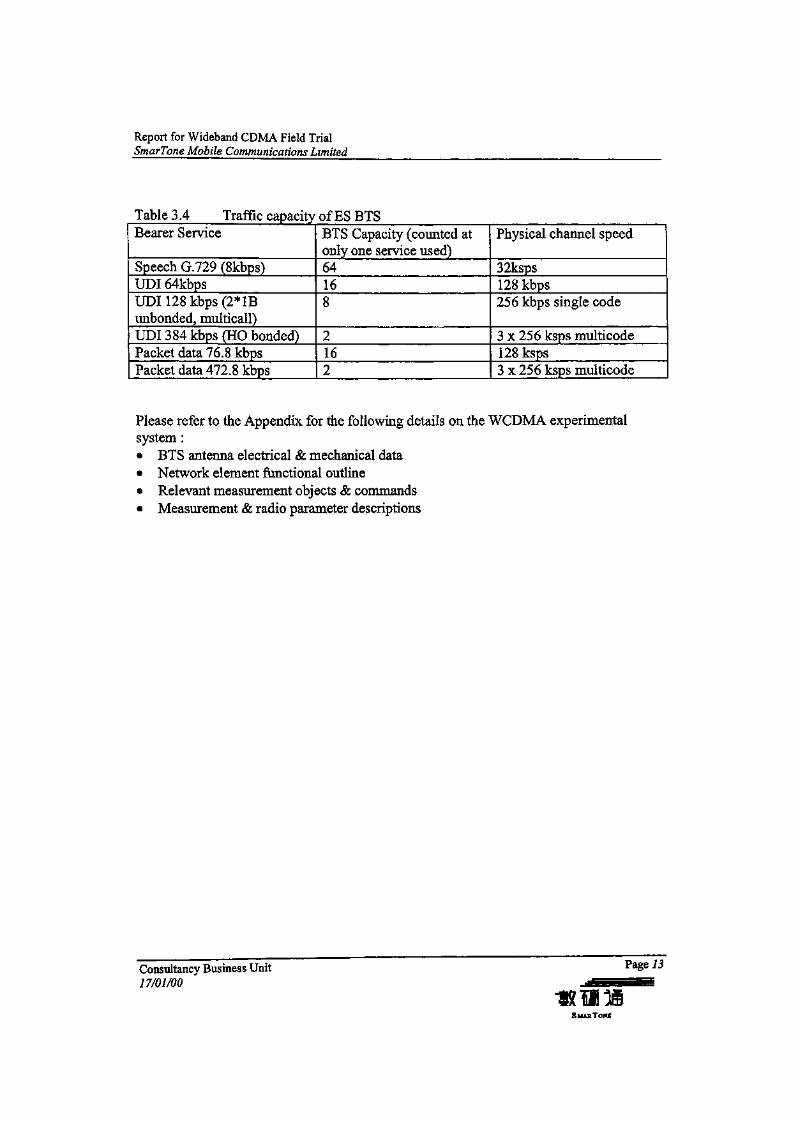
Table 3.4 Traffic capacity of ES BTSBearer Service
Speech G.729 (8kbps)UDI 64kbpsUDI128kbps(2*lBunbonded, multicall)UDI 384 kbps (HO bonded)Packet data 76.8 kbpsPacket data 472.8 kbps
BTS Capacity (counted atonly one service used)64168
2162
Physical channel speed
32ksps128 kbps256 kbps single code
3 x 256 ksps multicode128 ksps3 x 256 ksps multicode
Please refer to the Appendix for the following details on the WCDMA experimentalsystem :• BTS antenna electrical & mechanical data« Network element functional outline» Relevant measurement objects & commands* Measurement & radio parameter descriptions
Consultancy Business Unit17/01/00
Page 13
SMARTONE
Report for Wideband CDMA Field TrialSmarTone Mobile Communications Limited
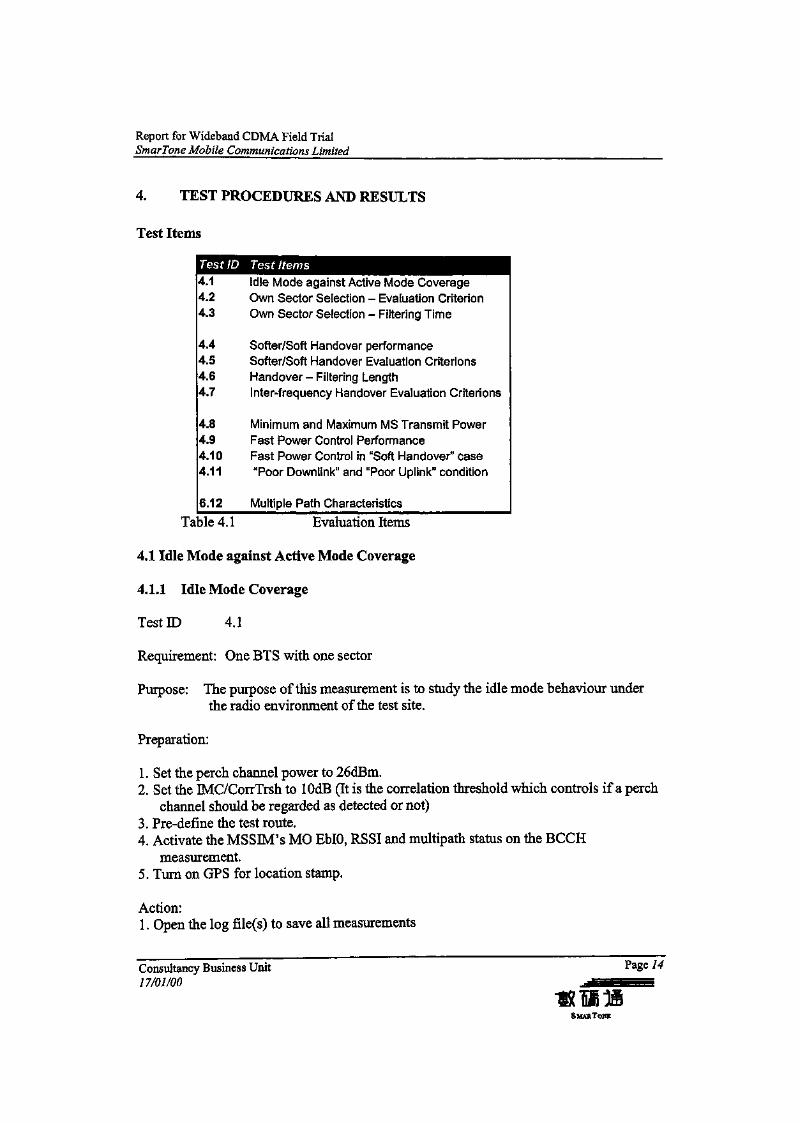
4. TEST PROCEDURES AND RESULTS
Test Items
4.1 Idle Mode against Active Mode Coverage4.2 Own Sector Selection - Evaluation Criterion4.3 Own Sector Selection - Filtering Time
4.4 Softer/Soft Handover performance4.5 Softer/Soft Handover Evaluation Criterions4.6 Handover - Filtering Length4.7 Inter-frequency Handover Evaluation Criterions
4.8 Minimum and Maximum MS Transmit Power4.9 Fast Power Control Performance4.10 Fast Power Control in "Soft Handover" case4.11 "Poor Downlink" and "Poor Uplink" condition
6.12 Multiple Path Characteristics
Table 4.1 Evaluation Items
4.1 Idle Mode against Active Mode Coverage
4.1.1 Idle Mode Coverage
Test ID 4.1
Requirement: One BTS with one sector
Purpose: The purpose of this measurement is to study the idle mode behaviour underthe radio environment of the test site.
Preparation:
1. Set the perch channel power to 26dBm.2. Set the IMC/CorrTrsh to lOdB (It is the correlation threshold which controls if a perch
channel should be regarded as detected or not)3. Pre-define the test route.4. Activate the MSSM's MO EblO, RSSI and multipath status on the BCCH
measurement.5. Turn on GPS for location stamp.
Action:1. Open the log file(s) to save all measurements
Consultancy Business Unit1 7/01/00
Page 14
Report for Wideband CDMA Field TrialSmarTone Mobile Communications Limited
2. Drive the demo car along the pre-defined test route at least two times.
Results:
When the demo car was driven along the test route, the MS-SIM was attempting to getsynchronised with the perch channel. BCCH is an unidirectional downlink channel whichtells the system control information for each sector from BTS to MS. These informationcontents may change with time, e.g. uplink long code of the RACE, neighbouringsectors' long codes and long code phases, uplink interference power etc. If the MS-SIMcannot synchronise with any BCCH, no connection between BTS and MS can beestablished. Then "no network coverage" will be shown on MS-SIM and then logged bythe managed object "TECBCCH/syncStatSup".
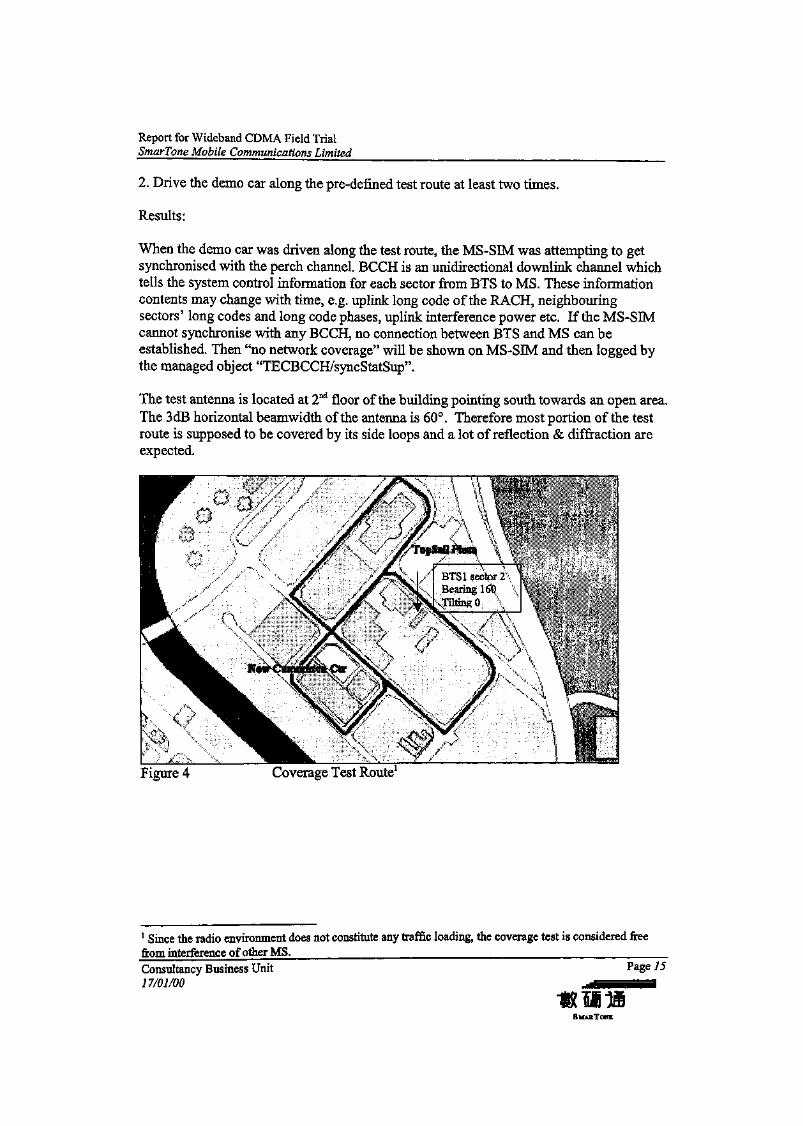
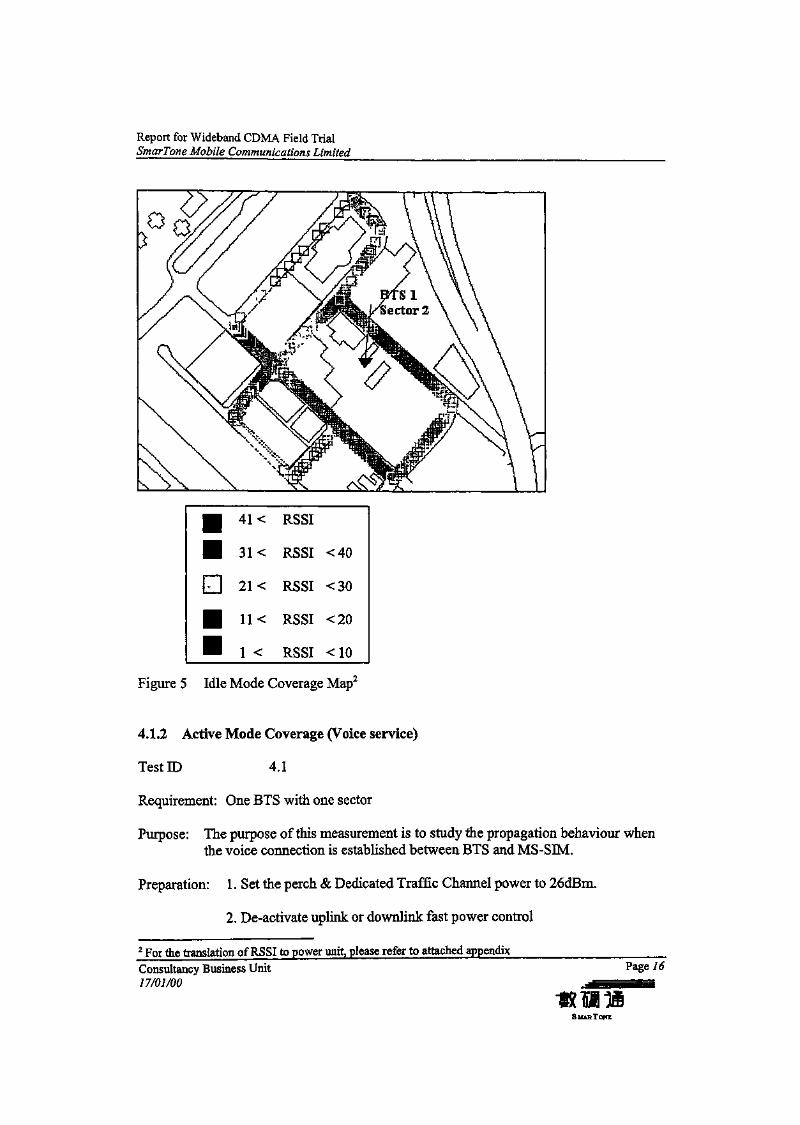
The test antenna is located at 2nd floor of the building pointing south towards an open area.The 3dB horizontal beamwidth of the antenna is 60°. Therefore most portion of the testroute is supposed to be covered by its side loops and a lot of reflection & diffraction areexpected.
Figure 4 Coverage Test Route1
1 Since the radio environment does not constitute any traffic loading, the coverage test is considered freefrom interference of other MS. __Consultancy Business Unit27/01/00
Page 75
SMARTONE
Report for Wideband CDMA Field TrialSmarTone Mobile Communications Limited
41 < RSSI
31< RSSI <40
21< RSSI <30
IK RSSI <20
1 < RSSI <10
Figure 5 Idle Mode Coverage Map2
4.1.2 Active Mode Coverage (Voice service)
Test ID 4.1
Requirement: One BTS with one sector
Purpose: The purpose of this measurement is to study the propagation behaviour whenthe voice connection is established between BTS and MS-SIM.
Preparation: 1. Set the perch & Dedicated Traffic Channel power to 26dBm.
2. De-activate uplink or downlink fast power control
2 For the translation of RSSI to power unit, please refer to attached appendix
Consultancy Business Unit Page 1617/01/00
S MAR TONE
Report for Wideband CDMA Field TrialSmarTone Mobile Communications Limited
Action:
3. Measure "rate of lost synchronization", "after and before UER in DLand UL", "RSSIUL and DL", "Eb/IO 3UL and DL"
1. Start sync supervision by setting MS-SM/ DTCH ACCH/ syncStatSupto ON2. Set up a call and drive the predefined route two times,
3. Turn on GPS for location stamp.
Results:
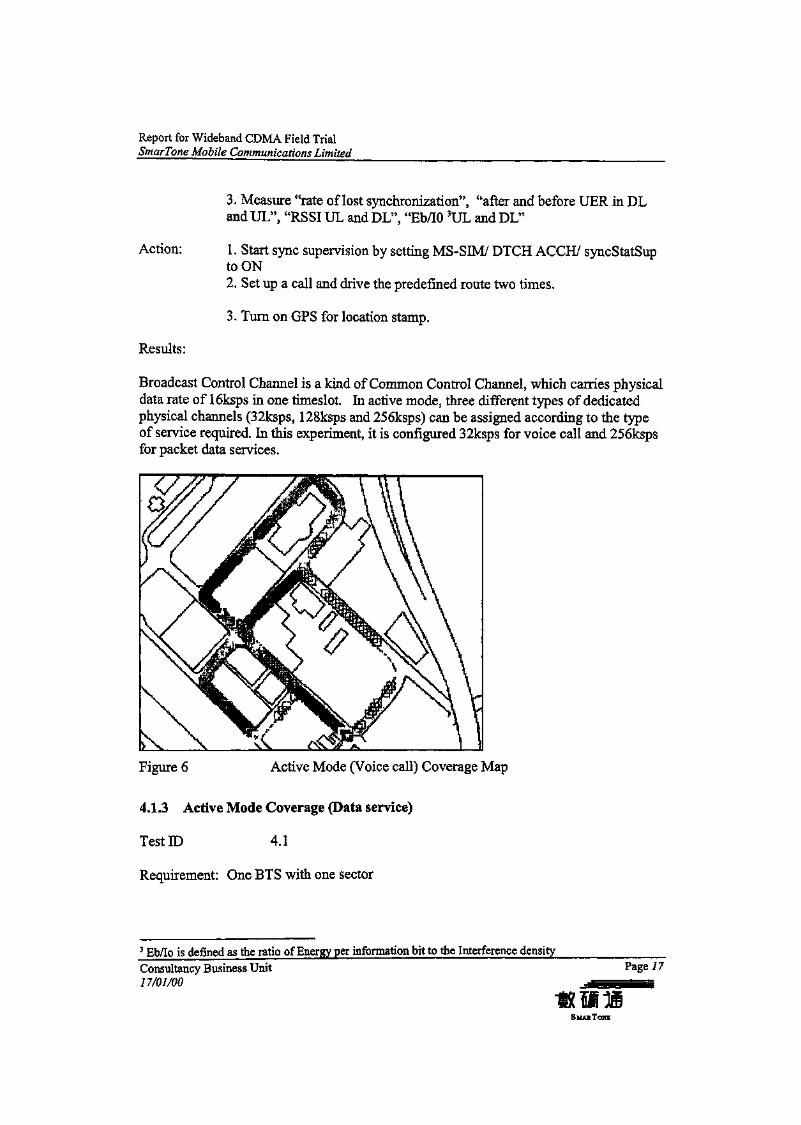
Broadcast Control Channel is a kind of Common Control Channel, which carries physicaldata rate of 16ksps in one timeslot. In active mode, three different types of dedicatedphysical channels (32ksps, 128ksps and 256ksps) can be assigned according to the typeof service required. In this experiment, it is configured 32ksps for voice call and 256kspsfor packet data services.
Figure 6 Active Mode (Voice call) Coverage Map
4.1.3 Active Mode Coverage (Data service)
Test ID 4.1
Requirement: One BTS with one sector
3 Eb/Io is defined as the ratio of Energy per information bit to the Interference density
Consultancy Business Unit17/01/00
Page/7
SMARlOKE
Report for Wideband CDMA Field TrialSmarTone Mobile Communications Limited
Purpose: The purpose of this measurement is to study the propagation behaviour whenthe data connection is established between BTS and MS-SIM.
Preparation: 1. Set the User Packet Channel power to 26dBm.
2. De-activate uplink or downlink fast power control
3. Measure "RSSIUL and DL", "EblO UL and DL", "actualDataRate"
Action: 1. Initiate a data connection.
2. Set up a file download and drive the predefined route two times.
3. Turn on GPS for location stamp.
Results:
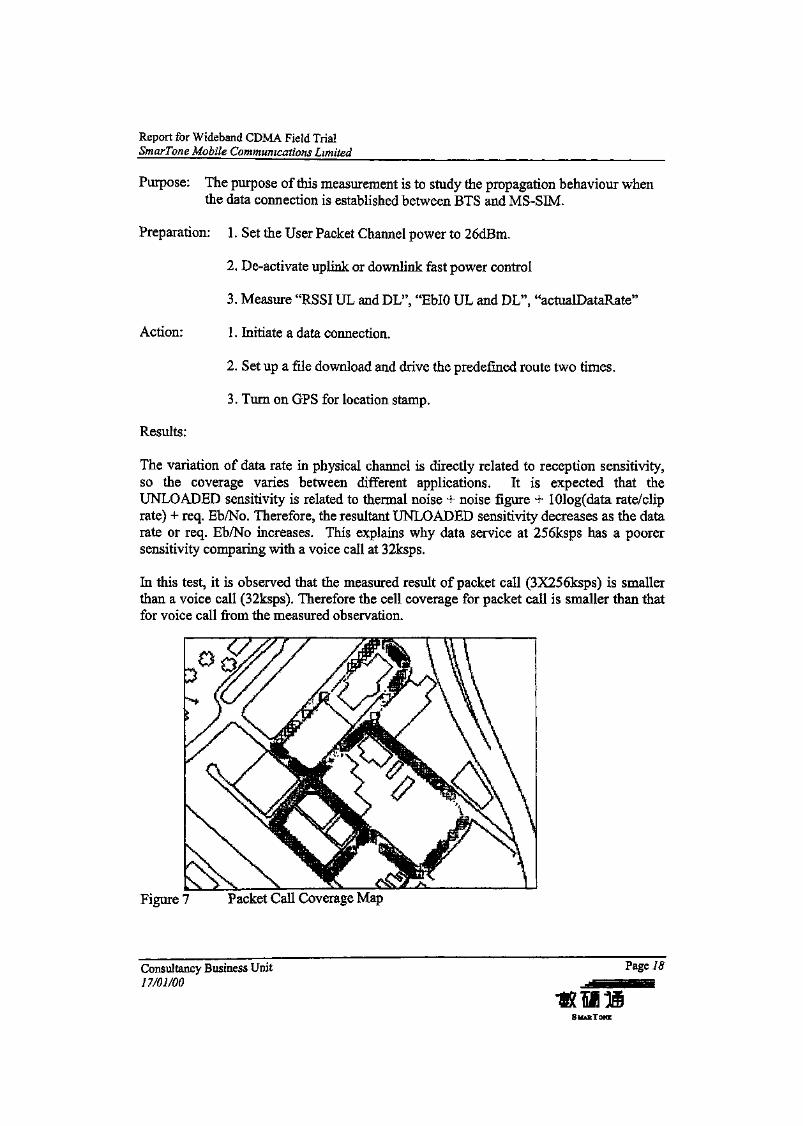
The variation of data rate in physical channel is directly related to reception sensitivity,so the coverage varies between different applications. It is expected that theUNLOADED sensitivity is related to thermal noise 4- noise figure + 101og(data rate/cliprate) + req. Eb/No. Therefore, the resultant UNLOADED sensitivity decreases as the datarate or req. Eb/No increases. This explains why data service at 256ksps has a poorersensitivity comparing with a voice call at 32ksps.
In this test, it is observed that the measured result of packet call (3X256ksps) is smallerthan a voice call (32ksps). Therefore the cell coverage for packet call is smaller than thatfor voice call from the measured observation.
Figure 7 Packet Call Coverage Map
Consultancy Business Unit17/01/00
Page 18
S MAS TOME

Report for Wideband CDMA Field TrialSmarTone Mobile Communications Limited
For the experimental system, the maximum output of Multiple Channel Power Amplifieris limited to +39dBm. This figure limits the actual downlink output of each physicalchannel since the total power is being shared by different connections.
In real environment, the effect of interference on both uplink and downlink is moresignificant as the traffic increases. Regarding uplink interference, they are mainlyconsequences of "intracell" and "intercell" interference. In CDMA systems, all useswithin a sector use the same frequency carrier. Thus, the received power from the servedsector, except signal power for own connection, can be considered as the cintracell'interference. "Intercell" interference is the received uplink signal strength generated fromMSs which belong to other sectors.
On the downlink, in theory, signal streams from all connections should be orthogonal toeach other. However, due to multipath channel and transmitter and receiver imperfection,they no longer remain orthogonal. Thus, downlink interference is created. Sensitivity ofthe receiver then becomes lower and the maximum endurable pathloss of the celldecreases: the cell boundary shrinks (cell breathing) from theoretical size. For a newlylaunched cell, it is possible to roughly estimate its coverage by plotting contours forachieving a target Eb/Io.
4.2 Own Sector Selection - Evaluation Criterion
Test ID: 4.2
Requirement: Two BTSs -- One BTS with three sectors, another BTS with two sectors
Purpose: To verify idle mode HO behaviour under different evaluation criterion.
Preparation: 1. Define the own sector selection criteria in each test case
2. Pre-define the test route.
3. Activate the MSSIM's MO Eb/IO and RSSI status on the BCCHmeasurement.
4. Turn on GPS for location stamp.
Action: 1. Turn on the Notification Logging Manager to log the measurement results.
2. Drive along the test route two times.
Turn off and save the log after completing the measurements.
Consultancy Business Unit Page 1917/01/00
S MAS TONE
Report for Wideband CDMA Field TrialSmarTone Mobile Communications Limited
Results:
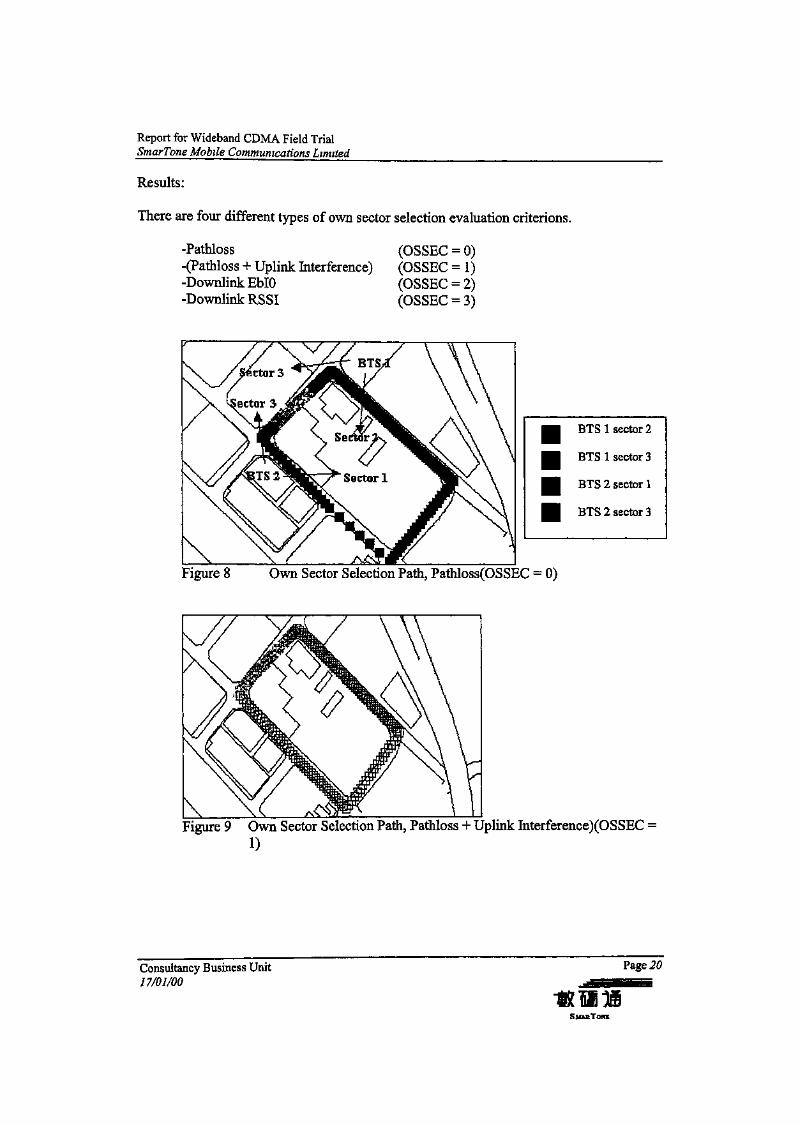
There are four different types of own sector selection evaluation criterions.
-Pathloss (OSSEC = 0)-(Pathless + Uplink Interference) (OSSEC = 1)-Downlink EblO (OSSEC = 2)-Downlink RSSI (OSSEC = 3)
BTS 1 sector 2
BTS 1 sector 3
BTS 2 sector 1
BTS 2 sector 3
Figure 8 Own Sector Selection Path, Pathloss(OSSEC = 0)
Figure 9 Own Sector Selection Path, Pathloss + Uplink Interference)(OSSEC =1)
Consultancy Business Unit17/01/00
Page 20
SMARTONE
Report for Wideband CDMA Field TrialSmarTom Mobile Communications Limited
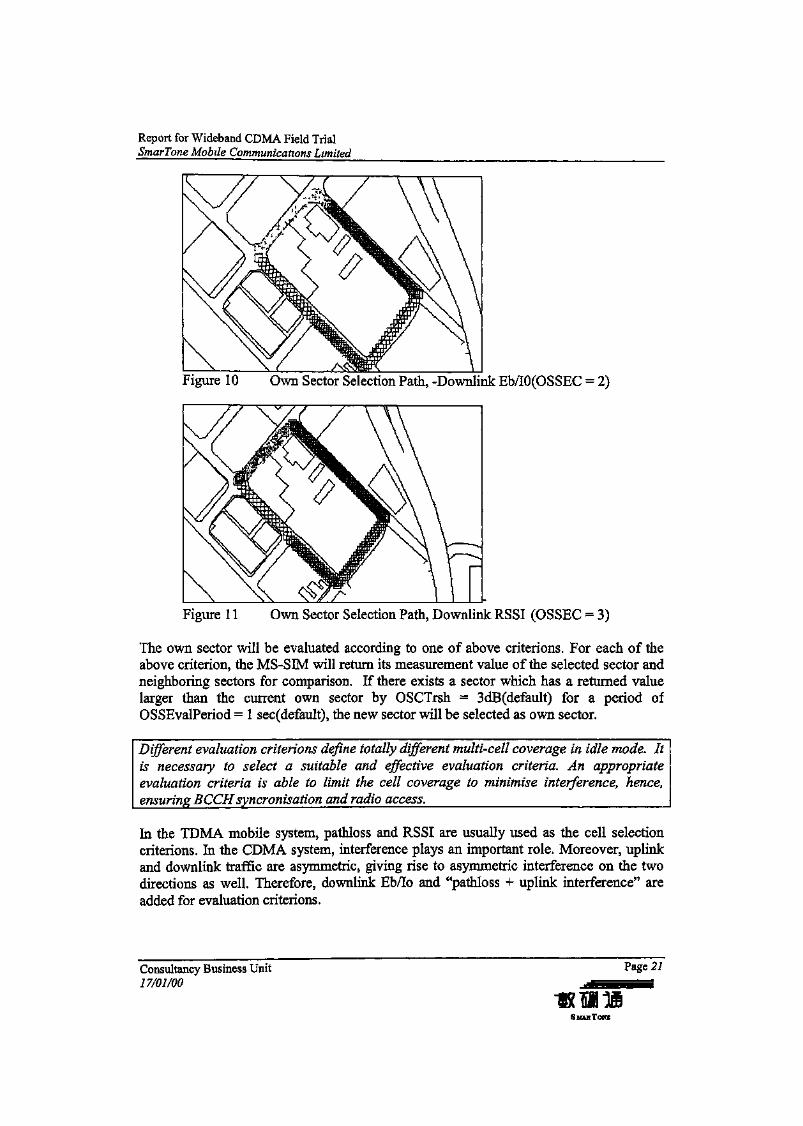
Figure 10 Own Sector Selection Path, -Downlink Eb/IO(OSSEC = 2)
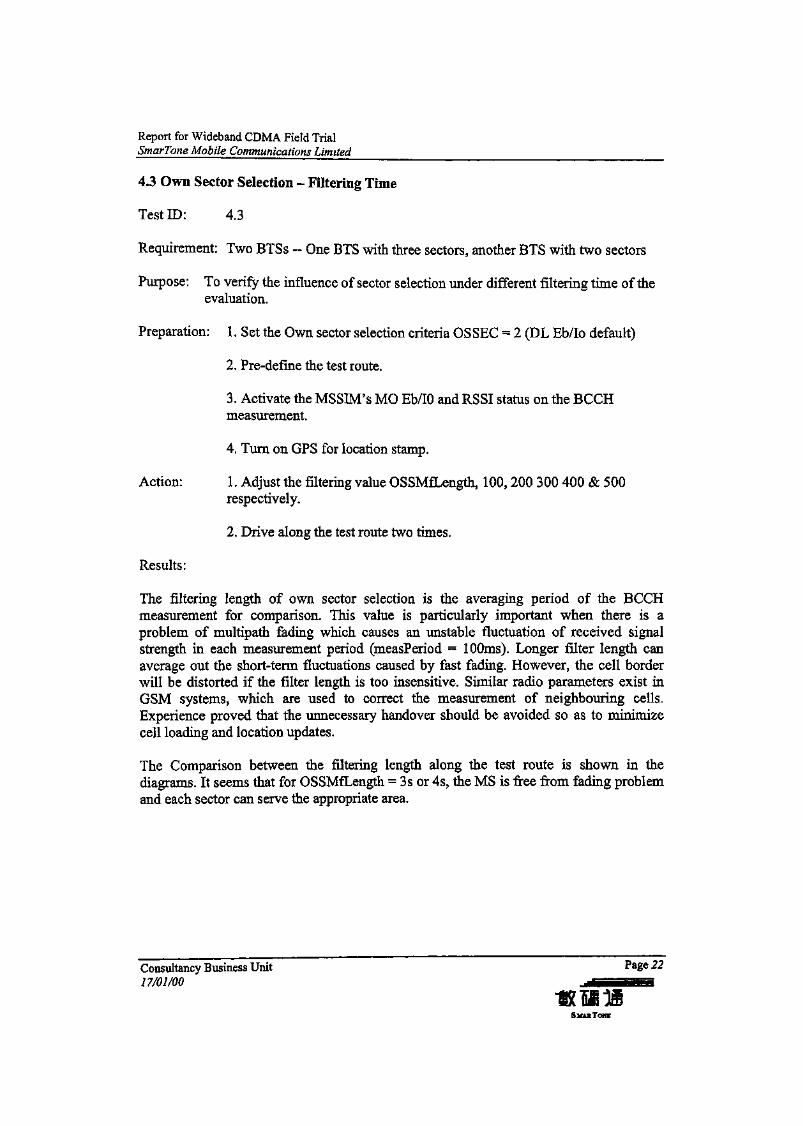
Figure 11 Own Sector Selection Path, Downlink RSSI (OSSEC = 3)
The own sector will be evaluated according to one of above criterions. For each of theabove criterion, the MS-SIM will return its measurement value of the selected sector andneighboring sectors for comparison. If there exists a sector which has a returned valuelarger than the current own sector by OSCTrsh = 3dB(default) for a period ofOSSEvalPeriod = 1 sec(default), the new sector will be selected as own sector.
Different evaluation criterions define totally different multi-cell coverage in idle mode. Itis necessary to select a suitable and effective evaluation criteria. An appropriateevaluation criteria is able to limit the cell coverage to minimise interference, hence,ensuring BCCHsyncronisation and radio access.
In the TDMA mobile system, pathloss and RSSI are usually used as the cell selectioncriterions. In the CDMA system, interference plays an important role. Moreover, uplinkand downlink traffic are asymmetric, giving rise to asymmetric interference on the twodirections as well. Therefore, downlink Eb/Io and "pathloss 4- uplink interference" areadded for evaluation criterions.
Consultancy Business Unit17/01/00
Page 21
S MAE Tome
Report for Wideband CDMA Field TrialSmarTone Mobile Communications Limited
4.3 OWE Sector Selection - Filtering Time
Test ID: 4.3
Requirement: Two BTSs -- One BTS with three sectors, another BTS with two sectors
Purpose: To verify the influence of sector selection under different filtering time of theevaluation.
Preparation: 1. Set the Own sector selection criteria OS SEC = 2 (DL Eb/Io default)
2. Pre-define the test route.
3. Activate the MSSIM's MO Eb/IO and RSSI status on the BCCHmeasurement.
4. Turn on GPS for location stamp.
Action: 1. Adjust the filtering value OSSMfLength, 1009 200 300 400 & 500respectively.
2. Drive along the test route two times.
Results:
The filtering length of own sector selection is the averaging period of the BCCHmeasurement for comparison. This value is particularly important when there is aproblem of multipath fading which causes an unstable fluctuation of received signalstrength in each measurement period (measPeriod = 100ms). Longer filter length canaverage out the short-term fluctuations caused by fast fading. However, the cell borderwill be distorted if the filter length is too insensitive. Similar radio parameters exist inGSM systems, which are used to correct the measurement of neighbouring cells.Experience proved that the unnecessary handover should be avoided so as to minimizecell loading and location updates.
The Comparison between the filtering length along the test route is shown in thediagrams. It seems that for OSSMfLength = 3s or 4s, the MS is free from fading problemand each sector can serve the appropriate area.
Consultancy Business Unit17/01/00
SMART ONE
Report for Wideband CDMA Field TrialSmarTone Mobile Communications Limited
BTS1 sector 2
BTS 1 sector 3
BTS 2 sector 1
BTS 2 sector 3
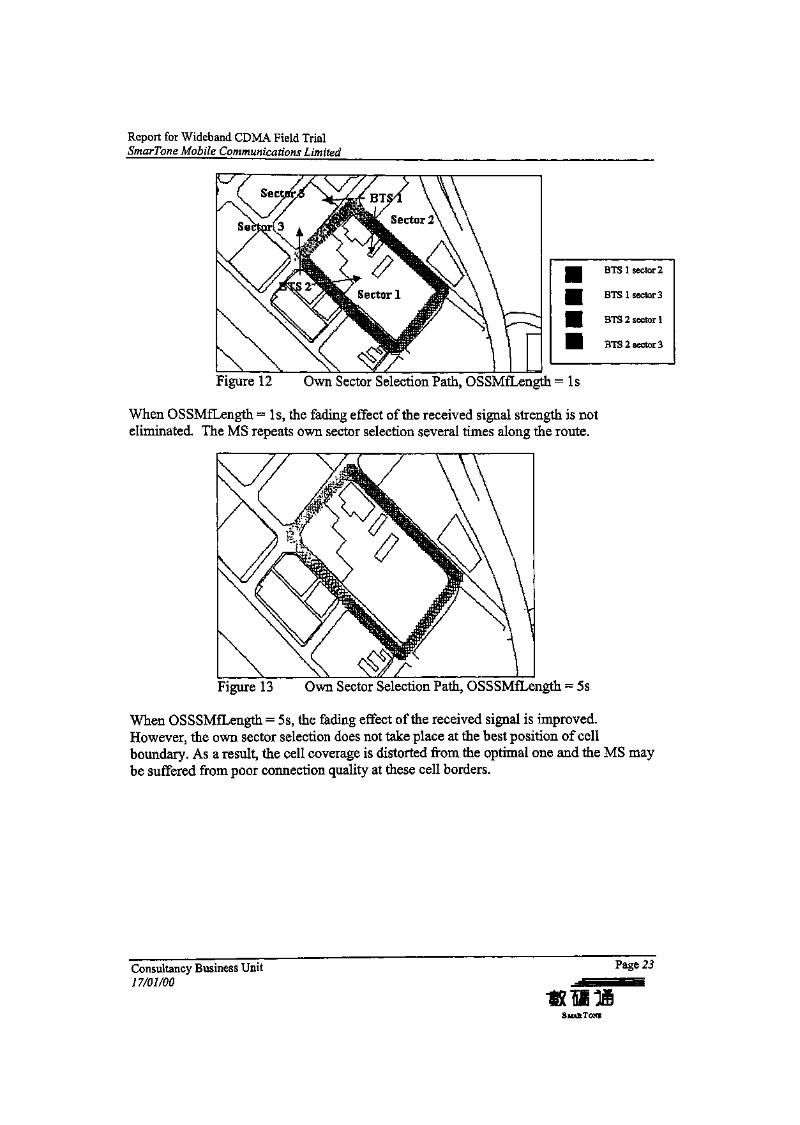
Figure 12 Own Sector Selection Path, OSSMfLength = 1 s
When OSSMfLength = Is, the fading effect of the received signal strength is noteliminated. The MS repeats own sector selection several times along the route.
Figure 13 Own Sector Selection Path, OSSSMfLength = 5s
When OSSSMfLength = 5s, the fading effect of the received signal is improved.However, the own sector selection does not take place at the best position of cellboundary. As a result, the cell coverage is distorted from the optimal one and the MS maybe suffered from poor connection quality at these cell borders.
Consultancy Business Unit17/01/00
Page 23
SMARTONE
Report for Wideband CDMA Field TrialSmarTone Mobile Communications Limited
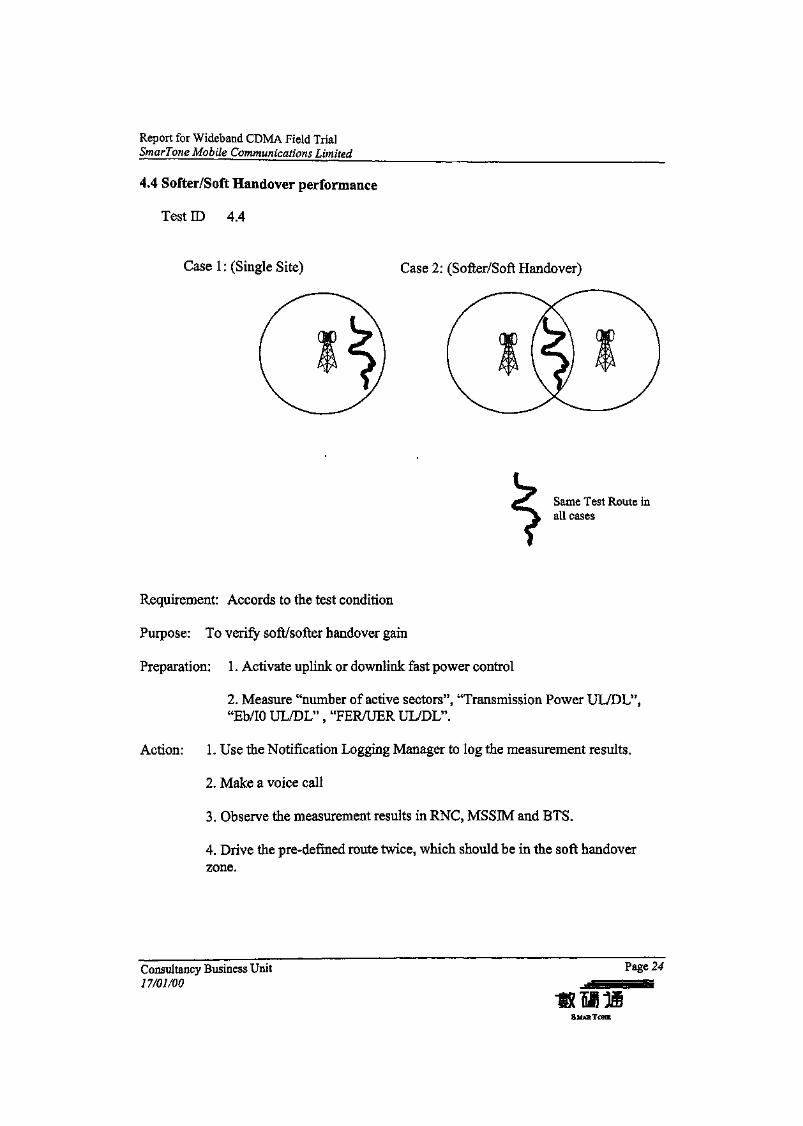
4.4 Softer/Soft Handover performance
Test ID 4.4
Case 1: (Single Site) Case 2: (Softer/Soft Handover)
Same Test Route inall cases
Requirement: Accords to the test condition
Purpose: To verify soft/softer handover gain
Preparation: 1. Activate uplink or downlink fast power control
2. Measure "number of active sectors", "Transmission Power UL/DL","Eb/IO UL/DL" , "FER/UER UL/DL".
Action: 1. Use the Notification Logging Manager to log the measurement results.
2. Make a voice call
3. Observe the measurement results in RNC, MSSM and BTS.
4. Drive the pre-defined route twice, which should be in the soft handoverzone.
Consultancy Business Unit17/01/00
Page 24
SMARTONE
Report for Wideband CDMA Field TrialSmarTone Mobile Communications Limited
Results:
Soft handover can improve the link quality by combining the signals between the mobileand two or more sectors, which reduces the effects of long-term fading caused byshadowing objects. Highest gain occurs when the long-term fading is uncorrelated amongthe different links.
MS-SIM measures the surrounding sectors and sends the measurements on the dedicatedsignalling connection (ACCH) to BTS & RNC node. Based on MS suppliedmeasurement data, RNC/BTS will decide when to add or delete a sector in soft/softerhandover mode.
By measuring the reduction in MS transmission power and BTS transmission powerwhen soft handover (Case 2) is used, the advantage of having power control inminimizing transmission power is acquired. This evaluation of soft handover gain isaffected by the power control function, and by comparing the long-term fading from onelink with the minimum long-term fading of all the links in the active set. A soft handovergain unaffected by power control is required.
The change in received signal strength, Eb/Io and UER are plot along the time line.is defined in two terms: Inner Coding UER and Diversity Handover UER. Both canexpress the unit error along the connection. Inner Coding UER is defined beforemultipath signal stream addition, while the sum of the diversity signal paths are beingconsidered in the second case.
In the case where the test route is served by a single cell, the measured UER does notdeteriorate much even when the received signal strength drops in the poor coverage area.It is because the radio environment is free from other interference source such as otherco-channel BTS etc. The interference source due to fading is much reduced by multipathreceiver and is compensated by power control. Therefore, the MS can operate well if thereceived signal strength is above its sensitivity. Beyond this limit, the call will drop withpoor UER in very short term.
Consultancy Business Unit Pa£e 2517/01/00
Report for Wideband CDMA Field TrialSmarTone Mobile Communications Limited
Unit error recorded without handover
014
012
008
006
004
002
time(sec)
Figure 14 Measured UER along the test route without soft handover
When the test route is served by 2 BTS, it is expected that the connection will be sharedby plenty of radio resources. The number of connections depends on the number ofactive sectors. From MS downlink point of view, several connections are linking multi-points to one point. For MS uplink, one to multipoint connection is established,simultaneous links are connected between BTS and MS without stepping up thetransmission power. It is an advantage to provide macro diversity of the received signal.The different radio paths can compensate any data loss due to fading, hence supporting alow bit error rate even at low MS transmission power. Also, power control could reducethe power consumption of MS and the uplink interference, benefiting the mobile users.
Note: Soft HO can always provide positive result on uplink. However, it may getnegative effects on the downlink because of the limit number of RAKE fingers. If there isnot enough fingers, the receiver can't capture all useful multipaths. Then the receiver will"determine" this useful signal as interference. The number of connections is set by thesoft handover parameter (no. of active sectors). Normally, two or three sectors is reallygood enough
Consultancy Business Unit17/01/00
Page 26
SMARTONE
Report for Wideband CDMA Field TrialSmarTone Mobile Communications Limited
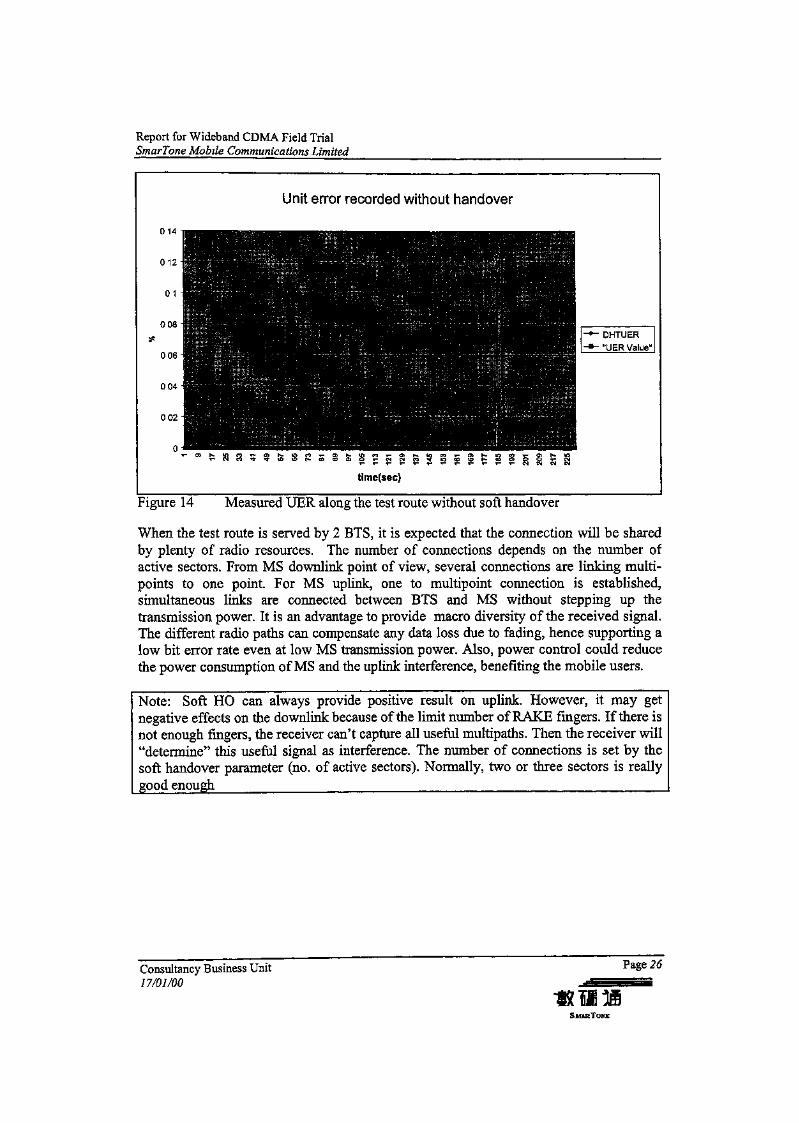
Unit Error recorded with soft handover
time (sec)
DHTUER "UER Value" "No. of Active sectors \
Figure 15 Measured UER in the region of soft handover
The number of sectors involved in the connection is recorded by Managed Object"ActiveSetRec". It returns the update information on active sectors along the test route.When the MS detects a new sector perch channel, it will keep track of its signal strength.The system will compare the measured value with the active main sector. The new sectorwill then be added to the active set of the call when the measured signal strength is largeenough compared with the active main sector. An additional connection is establishedbetween the MS and the new sector. The threshold value for the comparison is calledDHOAddTrsh.
Similarly, if the measured signal strength of an active sector falls below the thresholdvalue DHODelTrsh compared with active main sector. The sector will be deleted fromthe active set and the connection is ended.
The handover chart shows that un-predicted Unit Error Rate Inner Coding (UERIC) andDiversity Handover Truck Unit Error Rate (DHTUER) appear in the regions where morethan one sector is included in the active set. The peaks of DHTUER are similar to thecorresponding UERIC but it comes out in a leading phase. Since then, the UERmeasurement turns to zero for the rest of the time.
One of the possible reasons is due to the reduction of downlink transmission power ofBTS during soft handover. When the MS is moving closer to a new sector, the new sectoris added to the active set. The increase of measured signal strength / Eb/Io will trigger theMS to send TPC (Transmit Power Control) bit and order both BTS to decrease thedownlink power. It was found that during the power control process, the Eb/Io droppedstepwise, hence the UER increased.Consultancy Business Unit17/01/00
Page 27
SMARTONE

Report for Wideband CDMA Field TrialSmarTone Mobile Communications Limited
Another cause of poor UER during soft handover is possibly the handling of path delaydifference of the multipath fingers. Normally, MS will re-track the signal when MS justenters into handover status. It will track the best connection and follow this sector! Itseems that the tracking function is not working properly or running too slow. Thechoosing of correct searching window size, position and finger allocation threshold andsignal tracking becomes critical to the combined outcome of the RX information.
4.5 Softer/Soft Handover Evalation Criterions
Test ID 4.5
Requirement: Two BTSs - One BTS with three sectors, another BTS with two sectors
Purpose: The purpose of this test is to evaluate the different soft handover criteria, withrespect to size of the soft/softer handover regions, rate of soft/softer handover updates,rate of dropped calls, soft/softer handover quality. It is also interesting to measure thetransmitted BTS and MS power.
Preparation: 1. Enable soft and softer handover for two testing BTSs. For each test case,set the handover evaluation criteria equal to 0 .. 3.
2. Activate uplink or downlink fast power control
3. Measure "active sector update", "Transmission Power MS/BTS","Combined UER in RNC and MS", "Soft/Softer Handover Area" and"Drop call rate".
Action: 1. Use the Notification Logging Manager to log the measurement results.
2. Make a voice call
3. Observe the measurement results in RNC, MSSM and BTS.
4. Drive the pre-defined route two times
Results:
The handover evaluation algorithm uses a quality measure when comparing differentsectors. The quality measure, or evaluation criteria, is configurable in the MS and the MOattribute is called Diversity HO Evaluation Criteria (DHOEC). The attribute is set to oneof the four values: pathloss, UL interference, downlink E^ and downlink RSSLAlgorithm could target to connect the BTS with lowest pathloss, or to minimise ULinterference is by limiting the output power of the MS. Alternatively, criteria could aim toconnect to the sector with the strongest received perch channel
Consultancy Business Unit Page 2&17/01/00
SMARTONE

Report for Wideband CDMA Field TrialSmarTone Mobile Communications Limited
Path loss (DHOEC=0):Quality = - (Pperch_comp - RSSI) + HO_OFFSET
Path loss + UL interference (DHOEC=1):Quality = - (Pperch_„„,„ - RSSI + IUL) + HO_OFFSET
DL RSSI (DHOEC=2):Quality = RSSI + HO_OFFSET
Downlink EblO (DHOEC=3):Quality = Eb/I0 + HO_OFFSET
With different evaluation criteria, the MS would return measured values of surroundingsectors with different meanings. These values are put to branch addition and deletioncalculation. The outcomes are plotted on the following graphs.
Consultancy Business Unit PaSe 29
17/01/00
SMARTONE
Report for Wideband CDMA Field TrialSmarTone Mobile Communications Limited
BTS 1 sector 2
BTS 1 sector 3
BTS 2 sector 1
BTS 2 sector 3
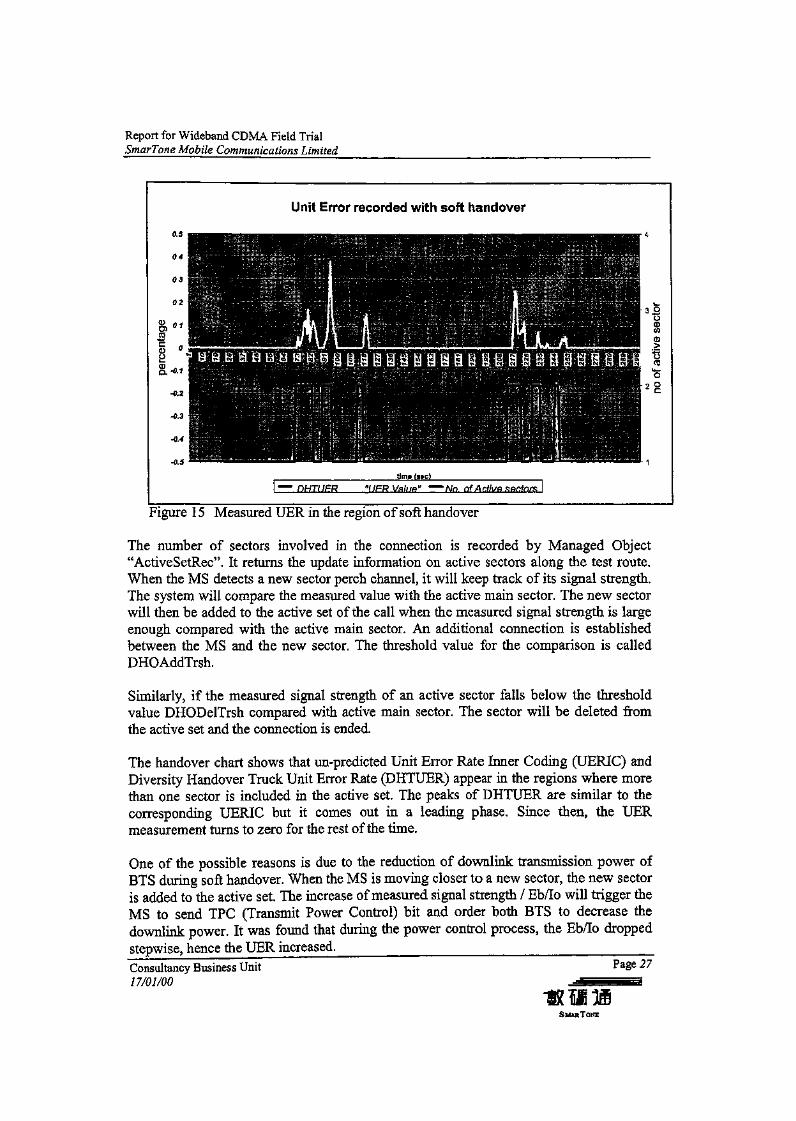
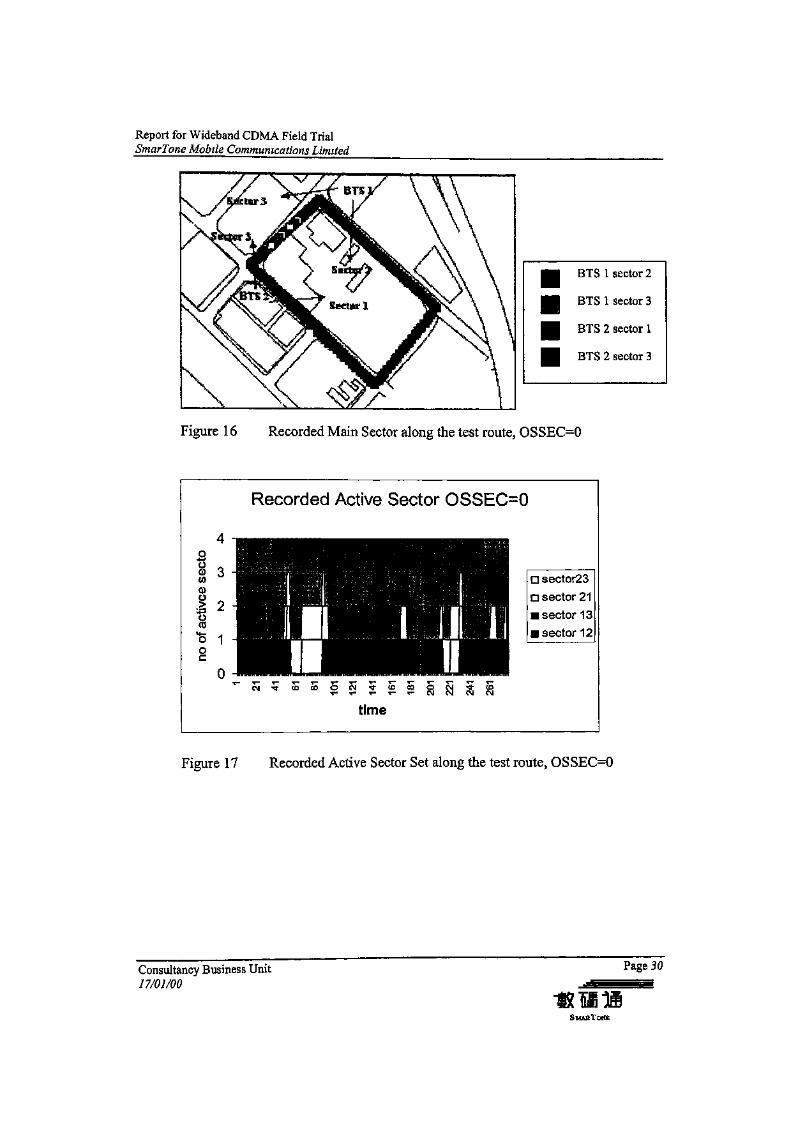
Figure 16 Recorded Main Sector along the test route, OSSEC=0
Recorded Active Sector OSSEC=0
time
Figure 17 Recorded Active Sector Set along the test route,, OSSEC=0
Consultancy Business Unit17/01/00
Page 30
SMAKTOKE

Report for Wideband CDMA Field TrialSmarTone Mobile Communications Limited
BTS 1 sector 2
BTS 1 sector 3
BTS 2 sector 1
BTS 2 sector 3
Figure 18 Recorded Main Sector along the test route, OSSEC=1
Recorded Active Set OSSEC=1
" 8
Figure 19 Recorded Active Sector Set along the test route, OSSEC=1
Consultancy Business Unit17/01/00
Page 31
SMARTONE
Report for Wideband CDMA Field TrialSmarTone Mobile Communications Limited
BTS 1 sector 2
BTS 1 sector 3
BTS 2 sector 1
BTS 2 sector 3
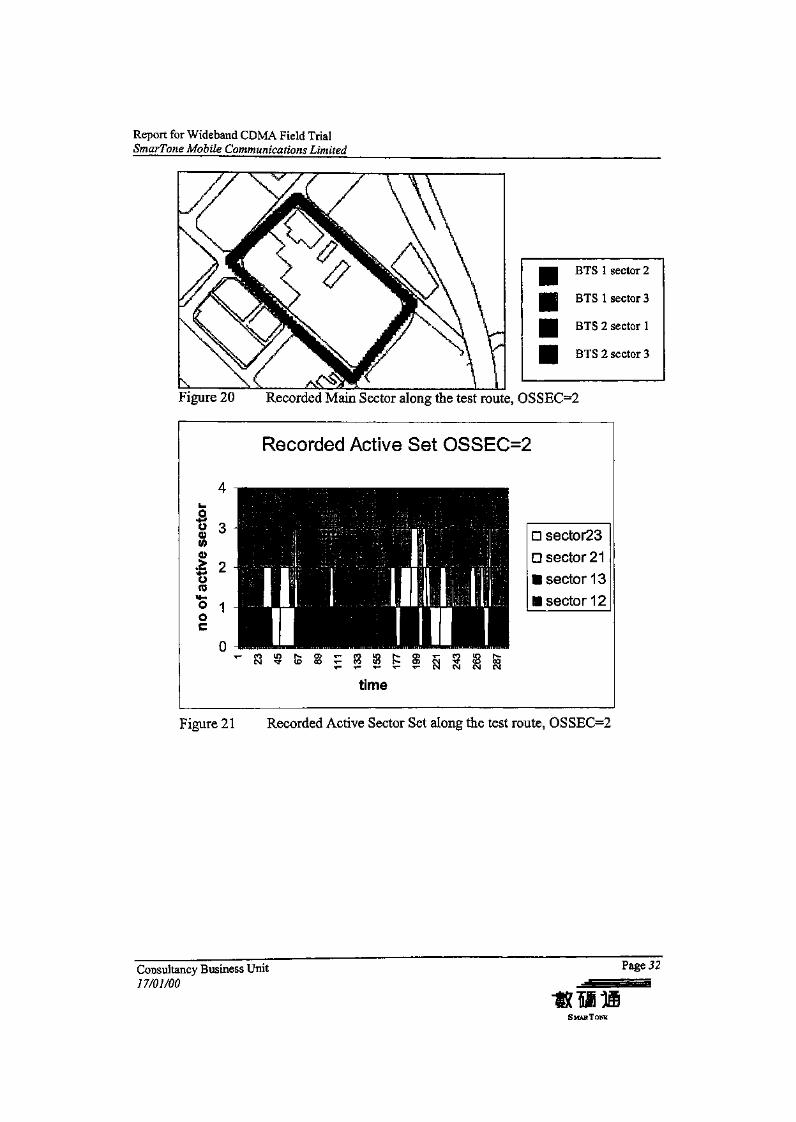
Figure 20 Recorded Main Sector along the test route, OSSEC=2
Recorded Active Set OSSEC=2
CM CM CM
Figure 21 Recorded Active Sector Set along the test route, OSSEC=2
Consultancy Business Unit17/01/00
Page 32
Report for Wideband CDMA Field TrialSmarTone Mobile Communications Limited
BTS 1 sector 2
BTS 1 sector 3
BTS 2 sector 1
BTS 2 sector 3
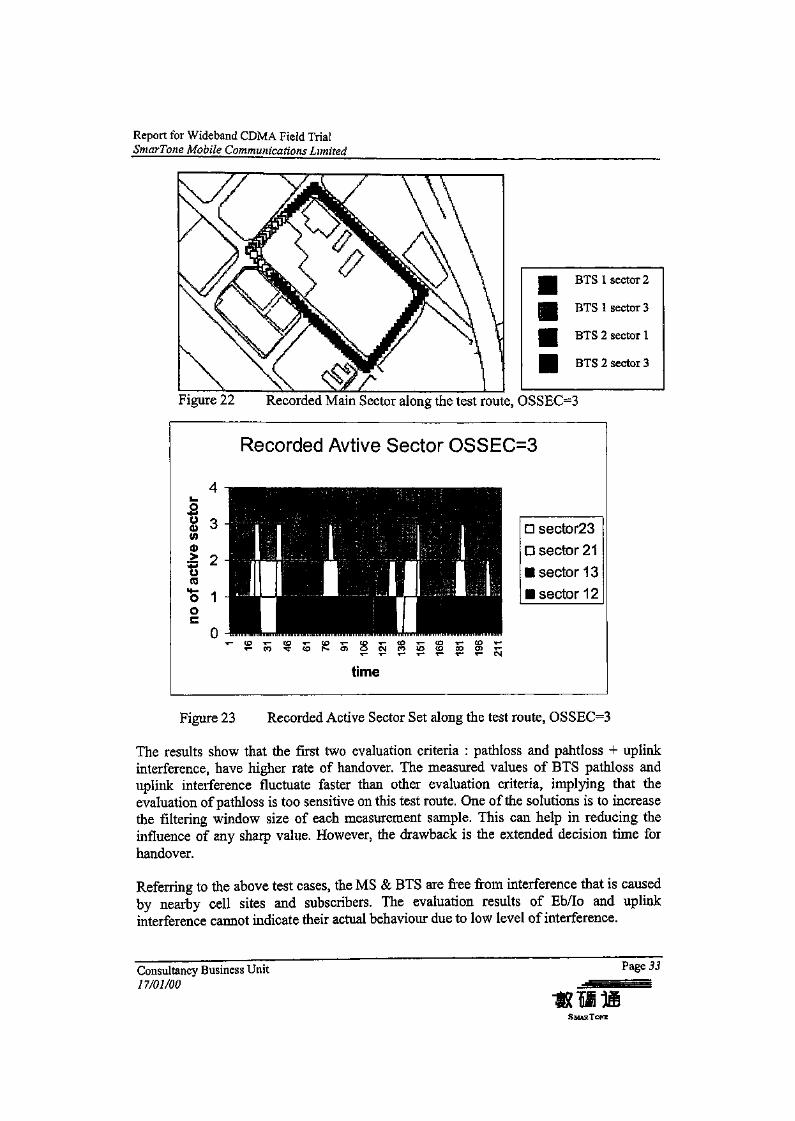
Figure 22 Recorded Main Sector along the test route, OSSEC=3
Recorded Avtive Sector OSSEC=3
time
Figure 23 Recorded Active Sector Set along the test route, OSSEC=3
The results show that the first two evaluation criteria : pathloss and pahtloss + uplinkinterference, have higher rate of handover. The measured values of BTS pathloss anduplink interference fluctuate faster than other evaluation criteria, implying that theevaluation of pathloss is too sensitive on this test route. One of the solutions is to increasethe filtering window size of each measurement sample. This can help in reducing theinfluence of any sharp value. However, the drawback is the extended decision time forhandover.
Referring to the above test cases, the MS & BTS are free from interference that is causedby nearby cell sites and subscribers. The evaluation results of Eb/Io and uplinkinterference cannot indicate their actual behaviour due to low level of interference.
Consultancy Business Unit/ 7/01/00
Page 33
SMARTONE
Report for Wideband CDMA Field TrialSmarTone Mobile Communications Limited
The best evaluation criteria for handover should be able to allow handover thresholds tobe designed to operate with stability to any sudden changes of environment: handover"Ping P°ng" and short term active sector should be avoided.
Further, the number of active sector should be minimized due to the following reasons:« To save radio resources.• Too many handovers could create higher probability of transition error.• Reduce downlink interference to other users.« The interference is formed due to limited number of RAKE fingers so that the extra
multipath signal in the searching window can't be captured and are considered asinterference. Therefore it is necessary to keep the effective number of active sectorsin the active set.
The right choice of evaluation criteria should be based on how the cell border is defined:
• Pathloss Criteria is chosen if the cells are further apart and uplink signal strength isthe limiting factor. In this sense, shortest MS to BTS distance is the first priority.
• Pathloss & uplink interference Criteria is chosen if there are several subscribersnearby and uplink interference is severe. It is because the uplink traffic loading isalso considered as the HO factor and the MS will transmit minimum power. Forinstance, there are two BTSs, called BTS1 and BTS2. BTS1 is the closest BTS to theMS but have high uplink traffic loading. On the other hand, BTS2 is at slightly longerdistance to MS but carries lower traffic. MS will HO to BTS2 if the pathloss & uplinkinterference Criteria is chosen.
• Downlink Eb/Io Criteria is chosen if cells are closely packed and interference occurat cell border. If the Perch powers are equal, the purpose is to connect to the sectorwhere the BTS needs the lowest power. If the Perch powers are different on the twosectors, the sector with the highest EJIq is selected.
• Downlink RSSI Criteria is chosen if the cells are transmitting same power andoccupying same coverage size. The MS is connected to the sector with the strongestreceived perch channel.
4.6 Handover - Filtering Length
Test ID: 4.6
Requirement: Two BTSs — One BTS with three sectors, another BTS with two sectors
Purpose: To verify the influence of handover under different filtering time of theevaluation.
Preparation: 1. In each test case, set the filtering length of handover DHOMfLength =1 .. 5 seconds.
2. Measure "rate of lost synchronization", "active sector update", "afterand before UER in DL and UL" and "dropped call rate".
Consultancy Business Unit Page 3417/01/00
SMARTONE
Report for Wideband CDMA Field TrialSmarTone Mobile Communications Limited
Action: 1. Turn on the Notification Logging Manager to log the measurementresults.
2. Connect a voice call and drive along the test route two times.
3. Turn off and save the log after completing the measurements.
Results:
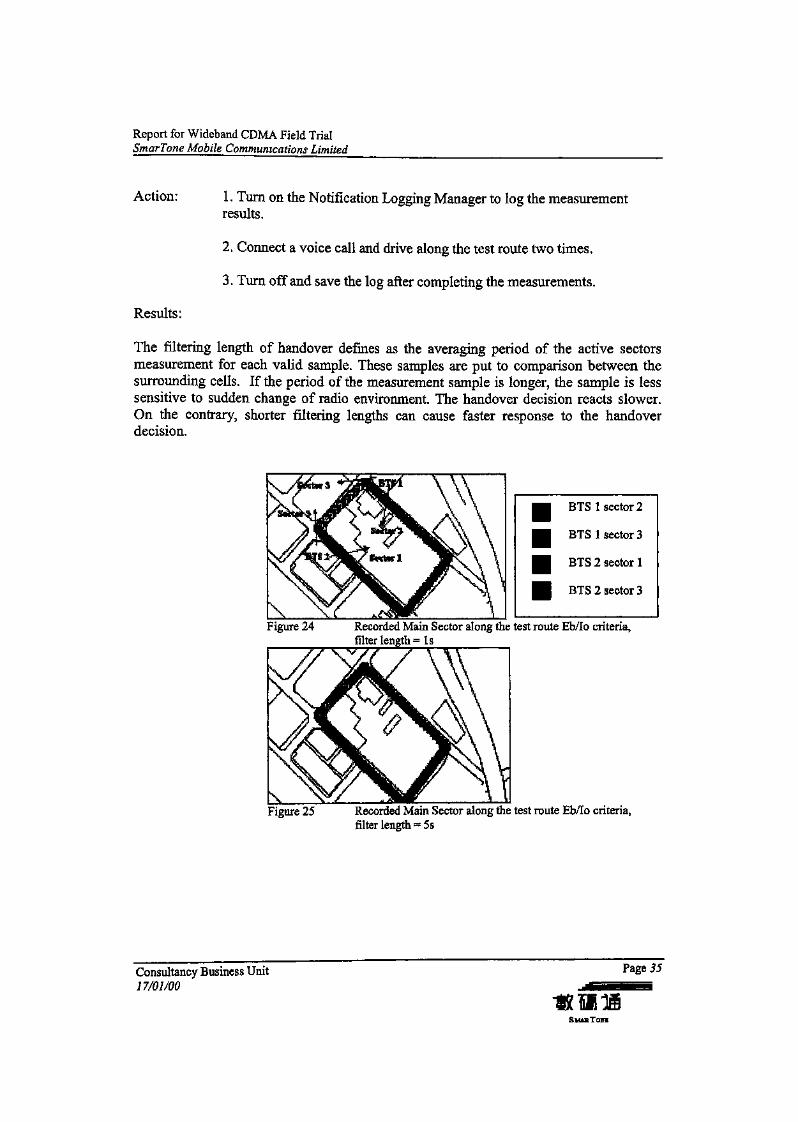
The filtering length of handover defines as the averaging period of the active sectorsmeasurement for each valid sample. These samples are put to comparison between thesurrounding cells. If the period of the measurement sample is longer, the sample is lesssensitive to sudden change of radio environment. The handover decision reacts slower.On the contrary, shorter filtering lengths can cause faster response to the handoverdecision.
BTS 1 sector 2
BTS 1 sector 3
BTS 2 sector 1
BTS 2 sector 3
Figure 24 Recorded Main Sector along the test route Eb/Io criteria,filter length = Is
Figure 25 Recorded Main Sector along the test route Eb/Io criteria,filter length = 5s
Consultancy Business Unit17/01/00
Page 35
Report for Wideband CDMA Field TrialSmarTone Mobile Communications Limited
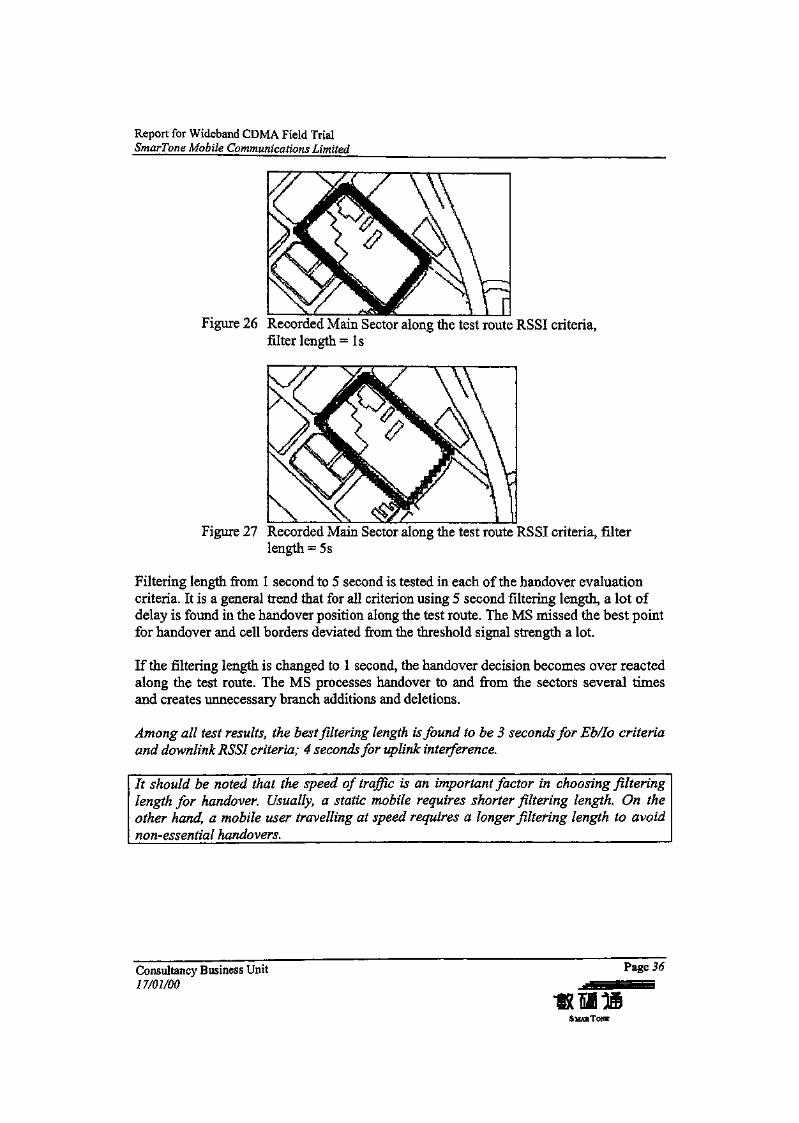
Figure 26 Recorded Main Sector along the test route RSSI criteria,filter length = Is
Figure 27 Recorded Main Sector along the test route RSSI criteria, filterlength = 5s
Filtering length from 1 second to 5 second is tested in each of the handover evaluationcriteria. It is a general trend that for all criterion using 5 second filtering length, a lot ofdelay is found in the handover position along the test route. The MS missed the best pointfor handover and cell borders deviated from the threshold signal strength a lot.
If the filtering length is changed to 1 second, the handover decision becomes over reactedalong the test route. The MS processes handover to and from the sectors several timesand creates unnecessary branch additions and deletions.
Among all test results, the best filtering length is found to be 3 seconds for Eb/Io criteriaand downlink RSSI criteria; 4 seconds for uplink interference.
It should be noted that the speed of traffic is an important factor in choosing filteringlength for handover. Usually, a static mobile requires shorter filtering length. On theother hand, a mobile user travelling at speed requires a longer filtering length to avoidnon-essential handovers. ___^___
Consultancy Business Unit17/01/00
Page 36
SMARTONE

Report for Wideband CDMA Field TrialSmarTone Mobile Communications Limited
4.7 Inter-frequency Handover Evaluation Criterions
Test ID.: 4.7
Requirements: One BTS with one sector, which carries two frequencies. The primaryfrequency DTCH has a maximum power of -f26dBm and the secondaryfrequency BCCH has a transmission power of+35dBm.
Purpose: The purpose of this test is to experience inter-frequency handover
Preparation: 1. Activate uplink or downlink fast power control
2. Measure "rate of lost synchronization", "after and before UER in DLand UL", "EblO UL and DL", "active sector update" and " handoversequence".
Action: 1. Start all measurement
2. Set up a voice call and drive the predefined route two times.
3. Note when and where addition and deletion of handover branches aremade. Note also when synch is lost and the call is dropped.
Results:
For WCDMA experimental system, each sector can support two frequency channels.These two channels can have their own logical channel and radio settings. The onlydifference is that the secondary channel does not support call set up channels of MS. Nocall setup can be established through secondary channel. Secondary channel acts as a sub-layer for handover, which can share the traffic by certain means of layer design. Byadjusting the second frequency power, like traditional underlay and overlay system, it ispossible to configure two cases for study:
Consultancy Business Unit17/01/00
Page 3 7
RTONE
Report for Wideband CDMA Field TrialSmarTone Mobile Communications Limited
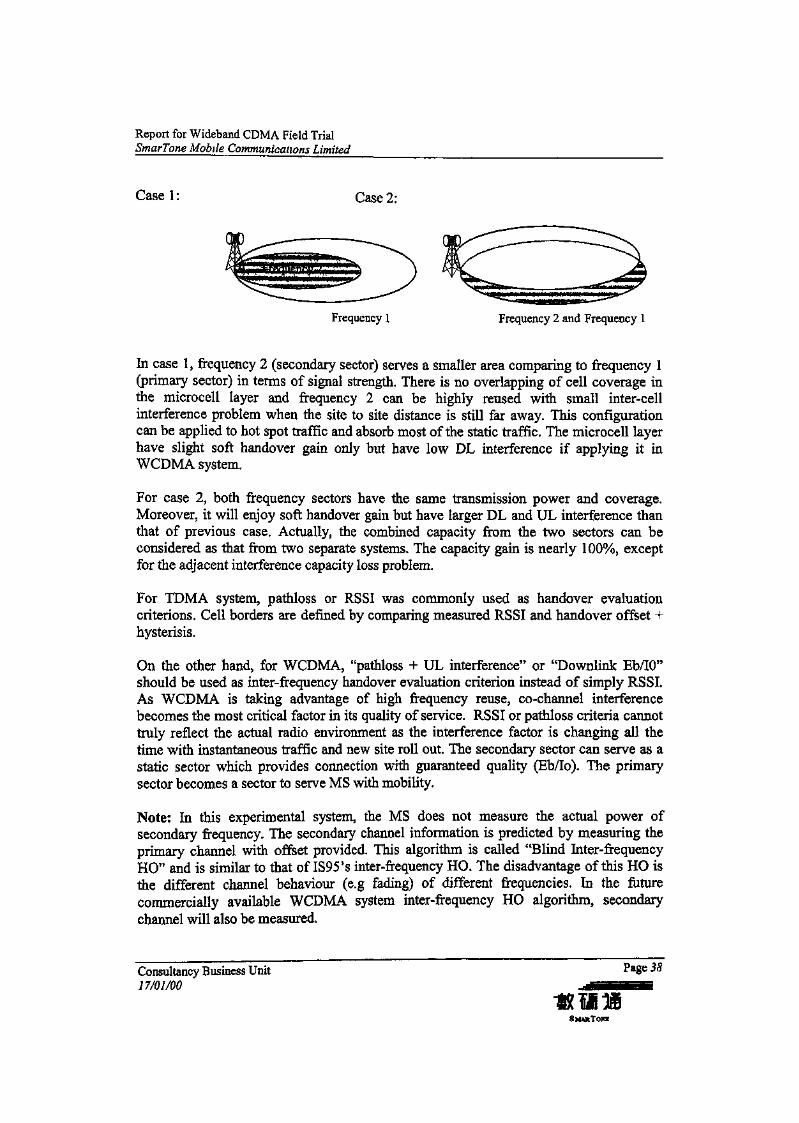
Casel: Case 2:
Frequency 1 Frequency 2 and Frequency 1
In case 1, frequency 2 (secondary sector) serves a smaller area comparing to frequency 1(primary sector) in terms of signal strength. There is no overlapping of cell coverage inthe microcell layer and frequency 2 can be highly reused with small inter-cellinterference problem when the site to site distance is still far away. This configurationcan be applied to hot spot traffic and absorb most of the static traffic. The microcell layerhave slight soft handover gain only but have low DL interference if applying it inWCDMA system.
For case 2, both frequency sectors have the same transmission power and coverage.Moreover, it will enjoy soft handover gain but have larger DL and UL interference thanthat of previous case. Actually, the combined capacity from the two sectors can beconsidered as that from two separate systems. The capacity gain is nearly 100%, exceptfor the adjacent interference capacity loss problem.
For TDM A system, pathloss or RSSI was commonly used as handover evaluationcriterions. Cell borders are defined by comparing measured RSSI and handover offset +hysterisis.
On the other hand, for WCDMA, "pathloss + UL interference" or "Downlink Eb/IO"should be used as inter-frequency handover evaluation criterion instead of simply RSSI.As WCDMA is taking advantage of high frequency reuse, co-channel interferencebecomes the most critical factor in its quality of service. RSSI or pathloss criteria cannottruly reflect the actual radio environment as the interference factor is changing all thetime with instantaneous traffic and new site roll out. The secondary sector can serve as astatic sector which provides connection with guaranteed quality (Eb/Io). The primarysector becomes a sector to serve MS with mobility.
Note: In this experimental system, the MS does not measure the actual power ofsecondary frequency. The secondary channel information is predicted by measuring theprimary channel with offset provided. This algorithm is called "Blind Inter-frequencyHO" and is similar to that of IS95's inter-frequency HO. The disadvantage of this HO isthe different channel behaviour (e.g fading) of different frequencies. In the futurecommercially available WCDMA system inter-frequency HO algorithm, secondarychannel will also be measured.
Consultancy Business Unit Pa§e 3877/07/00
-SMARTONE
Report for Wideband CDMA Field TrialSmarTone Mobile Communications Limited
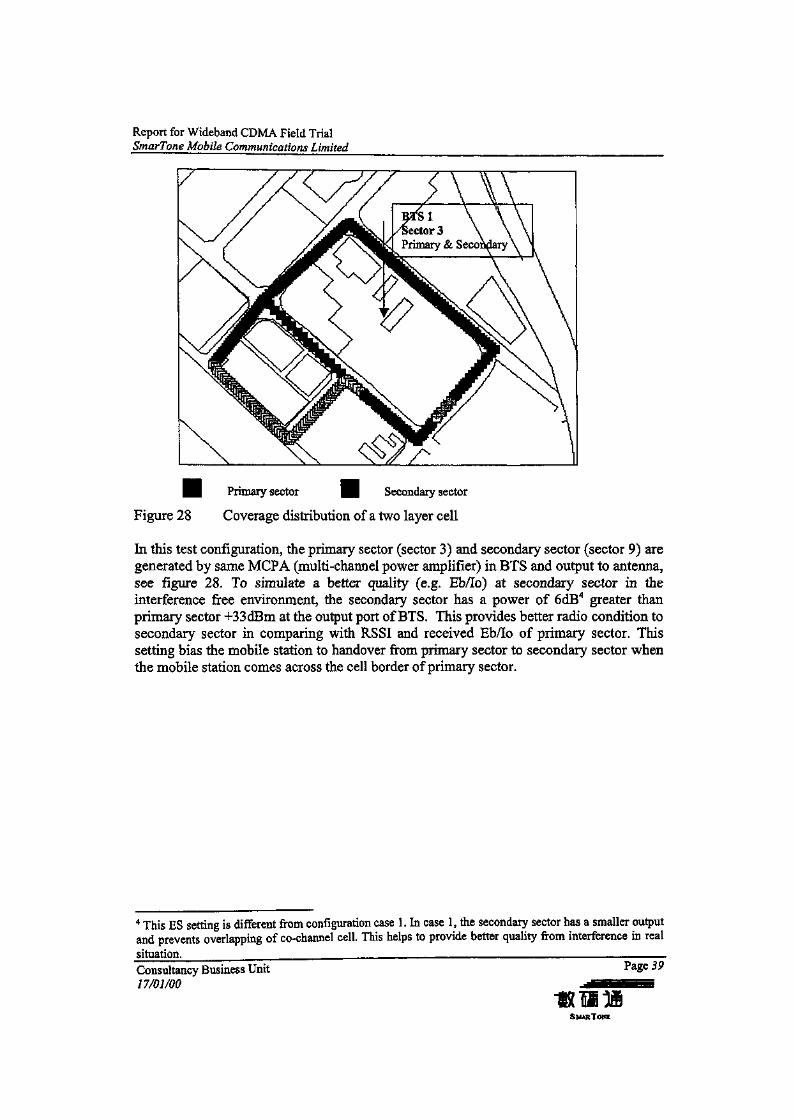
Figure 28
Primary sector Secondary sector
Coverage distribution of a two layer cell
In this test configuration, the primary sector (sector 3) and secondary sector (sector 9) aregenerated by same MCPA (multi-channel power amplifier) in BTS and output to antenna,see figure 28. To simulate a better quality (e.g. Eb/Io) at secondary sector in theinterference free environment, the secondary sector has a power of 6dB4 greater thanprimary sector +33dBm at the output port of BTS. This provides better radio condition tosecondary sector in comparing with RSSI and received Eb/Io of primary sector. Thissetting bias the mobile station to handover from primary sector to secondary sector whenthe mobile station comes across the cell border of primary sector.
4 This ES setting is different from configuration case 1. In case 1, the secondary sector has a smaller outputand prevents overlapping of co-channel cell. This helps to provide better quality from interference in realsituation. _^____ —Consultancy Business Unit17/01/00
Page 39
SMART ONE
Report for Wideband CDMA Field TrialSmarTone Mobile Communications Limited
Variation of Eb/IO along the route
traveSling route
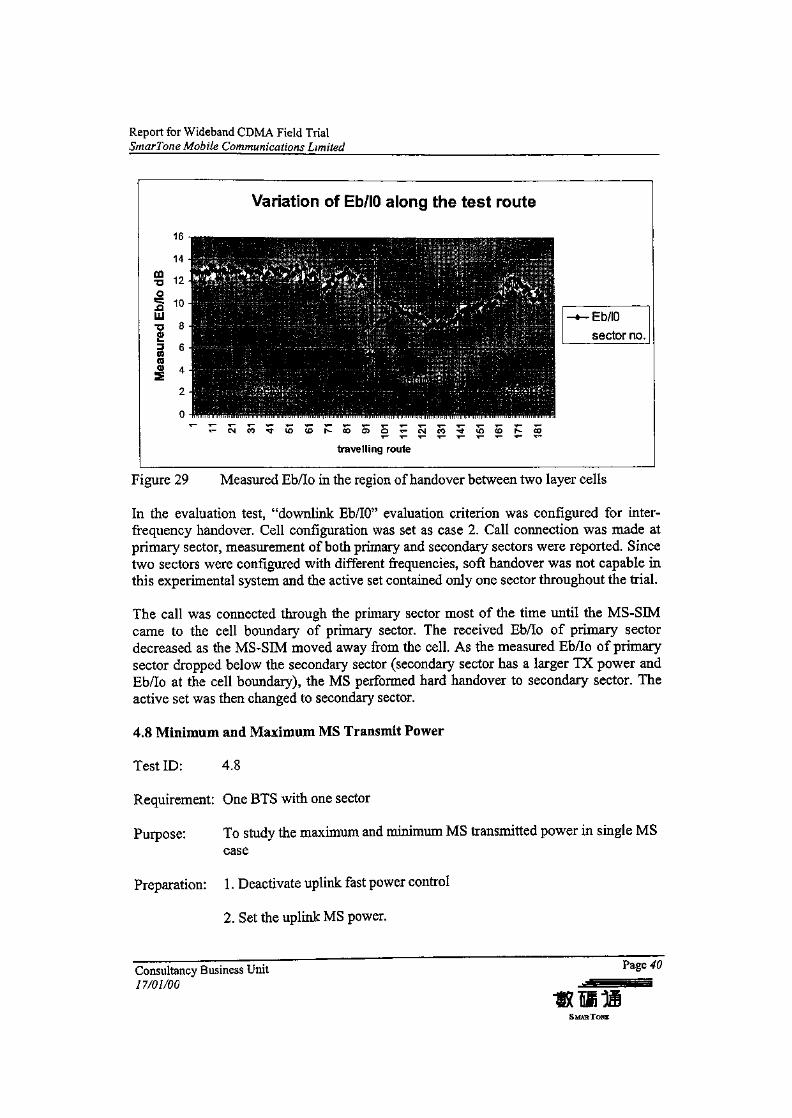
Figure 29 Measured Eb/Io in the region of handover between two layer cells
In the evaluation test, "downlink Eb/IO" evaluation criterion was configured for inter-frequency handover. Cell configuration was set as case 2. Call connection was made atprimary sector, measurement of both primary and secondary sectors were reported. Sincetwo sectors were configured with different frequencies, soft handover was not capable inthis experimental system and the active set contained only one sector throughout the trial,
The call was connected through the primary sector most of the time until the MS-SIMcame to the cell boundary of primary sector. The received Eb/Io of primary sectordecreased as the MS-SIM moved away from the cell. As the measured Eb/Io of primarysector dropped below the secondary sector (secondary sector has a larger TX power andEb/Io at the cell boundary), the MS performed hard handover to secondary sector. Theactive set was then changed to secondary sector.
4.8 Minimum and Maximum MS Transmit Power
Test ID: 4.8
Requirement: One BTS with one sector
Purpose: To study the maximum and minimum MS transmitted power in single MScase
Preparation: 1. Deactivate uplink fast power control
2. Set the uplink MS power.
Consultancy Business Unit17/01/00
Page 40
SMARTONE
Report for Wideband CDMA Field TrialSmarTone Mobile Communications Limited
3. Activate the MSSM and BTS's MO EblO, Tx power, Sent TPCcommand and RSSI status on the DTCHACCH measurement. (Remark: Ifthe new version WOS can support above measurements e.g loggingmanager program, WOS should be used instead of MO.)
4. Turn on GPS for location stamp.
Action: 1. Turn on the Notification Logging Manager to log the measurement results.
2. Make a voice call
3. Drive along the test route two to three times.
Results:
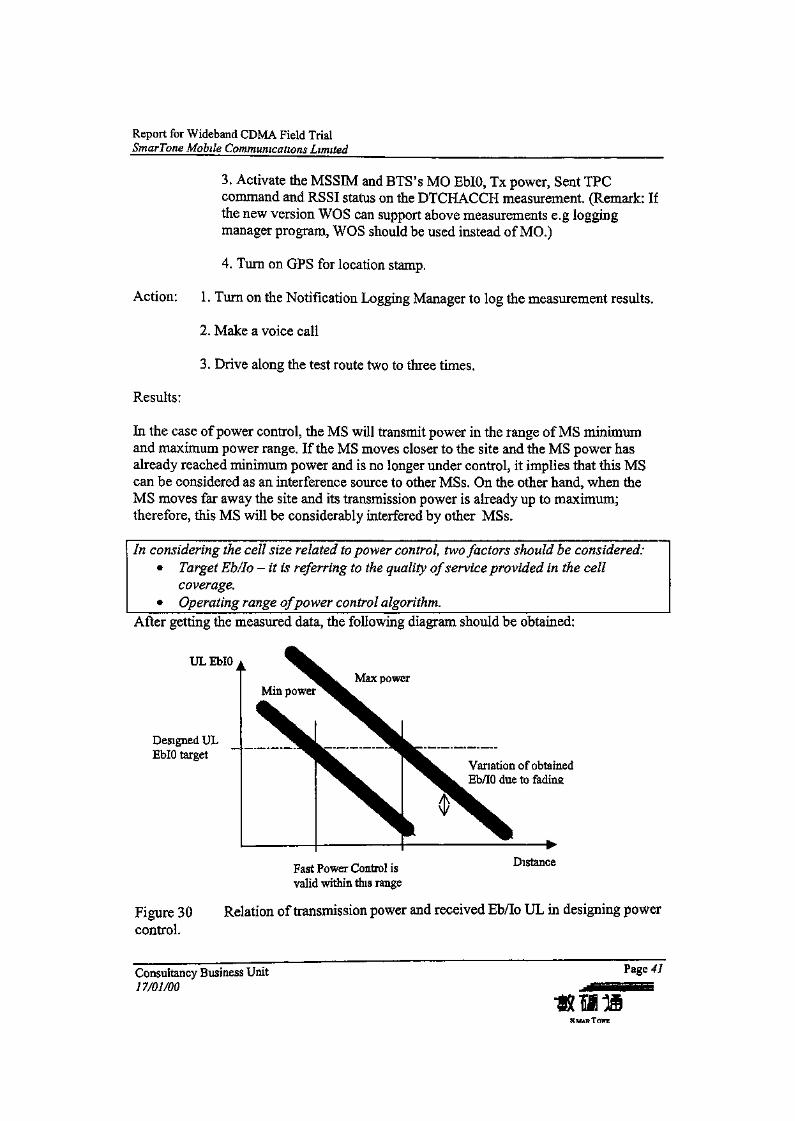
In the case of power control, the MS will transmit power in the range of MS minimumand maximum power range. If the MS moves closer to the site and the MS power hasalready reached minimum power and is no longer under control, it implies that this MScan be considered as an interference source to other MSs. On the other hand, when theMS moves far away the site and its transmission power is already up to maximum;therefore, this MS will be considerably interfered by other MSs.
In considering the cell size related to power control two factors should be considered:• Target Eb/Io - it is referring to the quality of service provided in the cell
coverage.® Operating range of power control algorithm.
After getting the measured data, the following diagram should be obtained:
UL EblO AMax power
Designed ULEblO target
Variation of obtainedEb/IO due to fading
Fast Power Control isvalid within this range
Distance
Figure 30control.
Relation of transmission power and received Eb/Io UL in designing power
Consultancy Business Unit17/01/00
Page 41
Report for Wideband CDMA Field TrialSmarTone Mobile Communications Limited
This test is only valid for investigating the uplink power control range. For downlink, therange cannot be as large, since transmissions for different mobile stations come from asingle source. Change of downlink transmission power will affect the actual cell size.Therefore, the stability of handover border and traffic distribution may be affected. In thedownlink direction, the range is recommended in the order of 10 to 20dB.
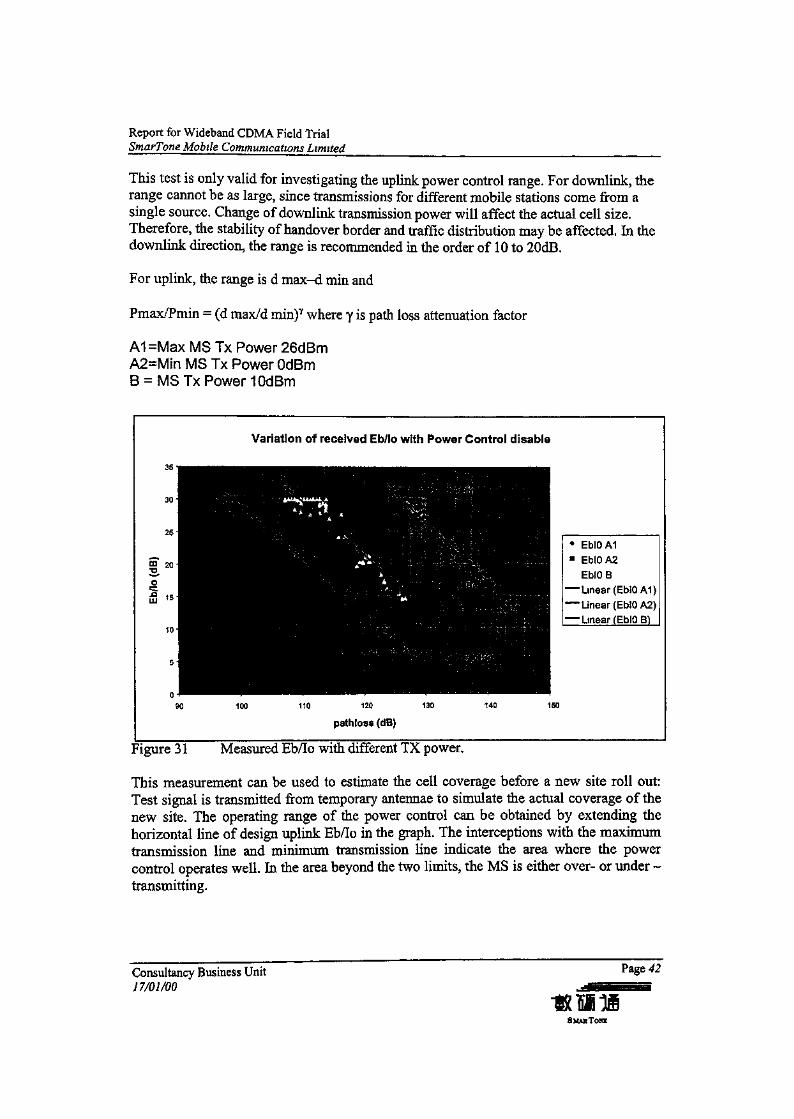
For uplink, the range is d max-d min and
Pmax/Pmin = (d max/d min)Y where y is path loss attenuation factor
A1 =Max MS Tx Power 26dBmA2=Min MS Tx Power OdBmB = MS Tx Power 10dBm
90
Variation of received Eb/So with Power Control disable
* EblOAl« EblOA2
EblOB— Linear (EblOAl)— Linear (EblO A2)— Linear (EblO B)
110 120
pathioss (dB)
Figure 31 Measured Eb/Io with different TX power.
This measurement can be used to estimate the cell coverage before a new site roll out:Test signal is transmitted from temporary antennae to simulate the actual coverage of thenew site. The operating range of the power control can be obtained by extending thehorizontal line of design uplink Eb/Io in the graph. The interceptions with the maximumtransmission line and minimum transmission line indicate the area where the powercontrol operates well In the area beyond the two limits, the MS is either over- or under -transmitting.
Consultancy Business Unit17/01/00
Page 42
SMARTOWK
Report for Wideband CDMA Field TrialSmarTone Mobile Communications Limited
Cell size prediction before site rollout
In the test environment, there is no interference source (neighbouring sectors + self sectorinterference). Thus, the above measured result is not suitable for system dimensioning.However, this measurement method can be used to predict the coverage and capacitywhen expanding the system in the future by just modifying the Eb/IO value.
Measured Eb/IO = Eb/(neighbouring interference)
Own interference = (1/F) * (neighbouring interference),where F is dependent on the antenna configuration. For 3 sectors site, it is assumed 0.96.
Predicted Eb/IO = Eb/((Own interference) + (neighbouring interference))
Predicted Eb/IO = Eb/((l + 1/F)( neighbouring interference))Predicted Eb/IO = Measured Eb/IO/(l + 1/F)
Assuming that the F is 0.96, so
Predicted Eb/IO = Measured Eb/IO 12
4.9 Fast Power Control Performance
Test ID. 4.9
Requirement: According to the test condition
Purpose: By checking the received Eb/IO, received mean Eb/IO and receivedstandard deviation Eb/IO, the fast power control performance can beinvestigated.
Preparation: 1. Activate uplink or downlink fast power control
2. Activate the MSSM and BTS's MO Eb/IO, Tx power, Sent TPCcommand and RSSI status on the DTCHACCH measurement. (Remark: Ifthe new version WOS can support above measurements e.g loggingmanager program, handover monitor and power control monitor should beused instead of MO.)
Action: 1. Use the Notification Logging Manager and Power Control Monitor/ to logthe measurement results.
2. Make a voice call
Consultancy Business Unit17/01/00
S MAR TONE
Report for Wideband CDMA Field TrialSmarTone Mobile Communications Limited
3. Observe the power control variation/any drop/coverage variation in BTSandMSSM.
4. Drive the pre-defined route two times
Results:
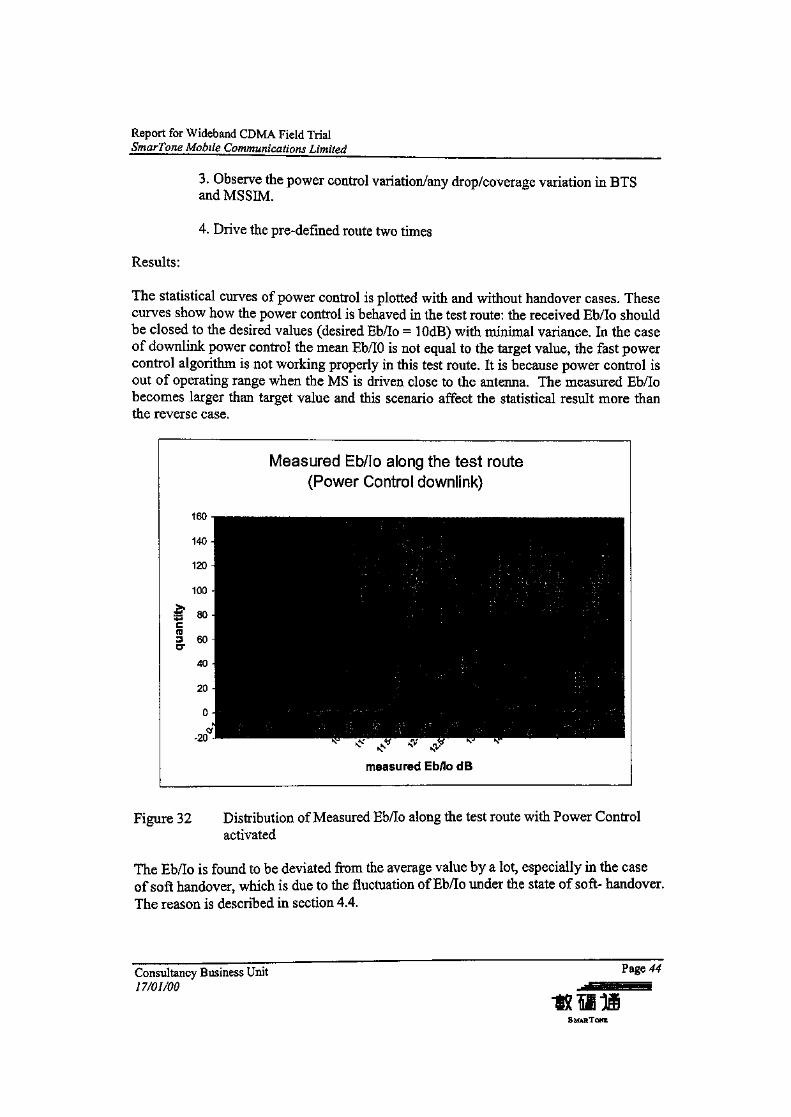
The statistical curves of power control is plotted with and without handover cases. Thesecurves show how the power control is behaved in the test route: the received Eb/Io shouldbe closed to the desired values (desired Eb/Io = lOdB) with minimal variance. In the caseof downlink power control the mean Eb/IO is not equal to the target value, the fast powercontrol algorithm is not working properly in this test route. It is because power control isout of operating range when the MS is driven close to the antenna. The measured Eb/Iobecomes larger than target value and this scenario affect the statistical result more thanthe reverse case.
Measured Eb/Io along the test route(Power Control downlink)
measured Eb/Io dB
Figure 32 Distribution of Measured Eb/Io along the test route with Power Controlactivated
The Eb/Io is found to be deviated from the average value by a lot, especially in the caseof soft handover, which is due to the fluctuation of Eb/Io under the state of soft- handover.The reason is described in section 4.4.
Consultancy Business Unit Pa§e 44
17/01/00
SMARTONE
Report for Wideband CDMA Field TrialSmarTone Mobile Communications Limited
120
Measured Eb/Io along test route(Power control downlink with Soft handover)
Measured Eb/Io dB
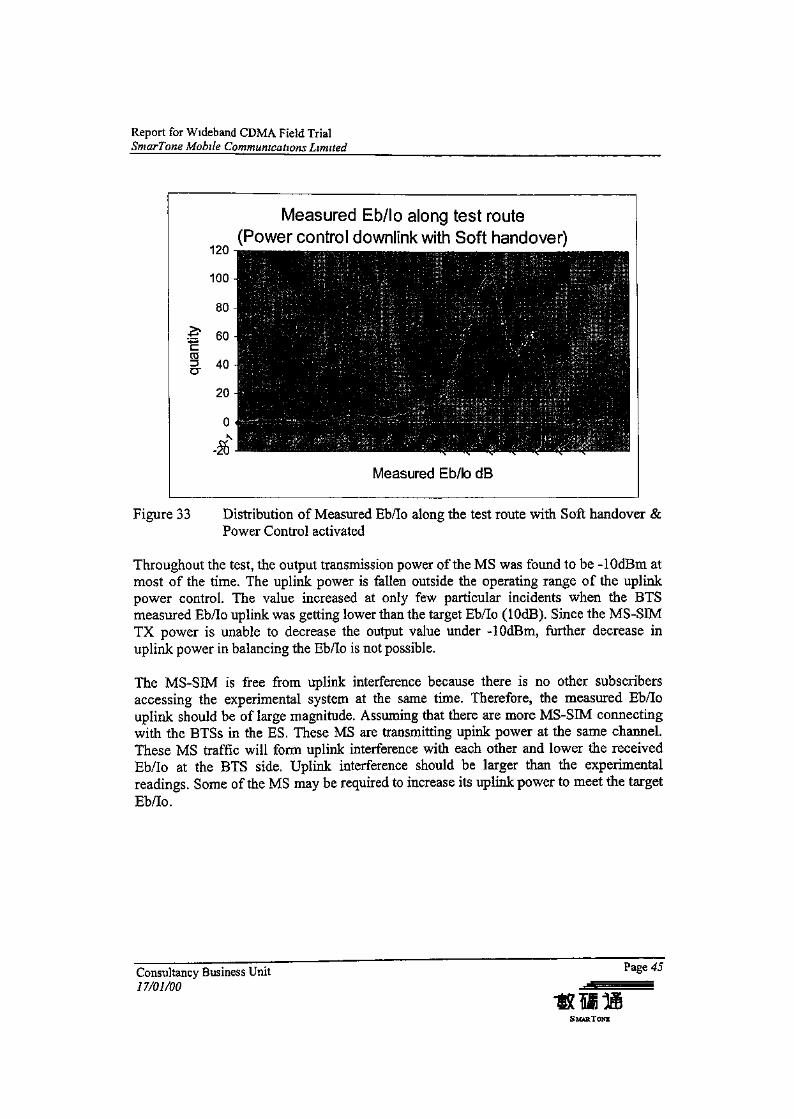
Figure 33 Distribution of Measured Eb/Io along the test route with Soft handover &Power Control activated
Throughout the test, the output transmission power of the MS was found to be -lOdBin atmost of the time. The uplink power is fallen outside the operating range of the uplinkpower control. The value increased at only few particular incidents when the BTSmeasured Eb/Io uplink was getting lower than the target Eb/Io (lOdB). Since the MS-SIMTX power is unable to decrease the output value under -lOdBm, further decrease inuplink power in balancing the Eb/Io is not possible.
The MS-SIM is free from uplink interference because there is no other subscribersaccessing the experimental system at the same time. Therefore, the measured Eb/Iouplink should be of large magnitude. Assuming that there are more MS-SIM connectingwith the BTSs in the ES. These MS are transmitting upink power at the same channel.These MS traffic will form uplink interference with each other and lower the receivedEb/Io at the BTS side. Uplink interference should be larger than the experimentalreadings. Some of the MS may be required to increase its uplink power to meet the targetEb/Io.
Consultancy Business Unit Pa&e 45
17/01/00
SMARTONE
Report for Wideband CDMA Field TrialSmarTone Mobile Communications Limited
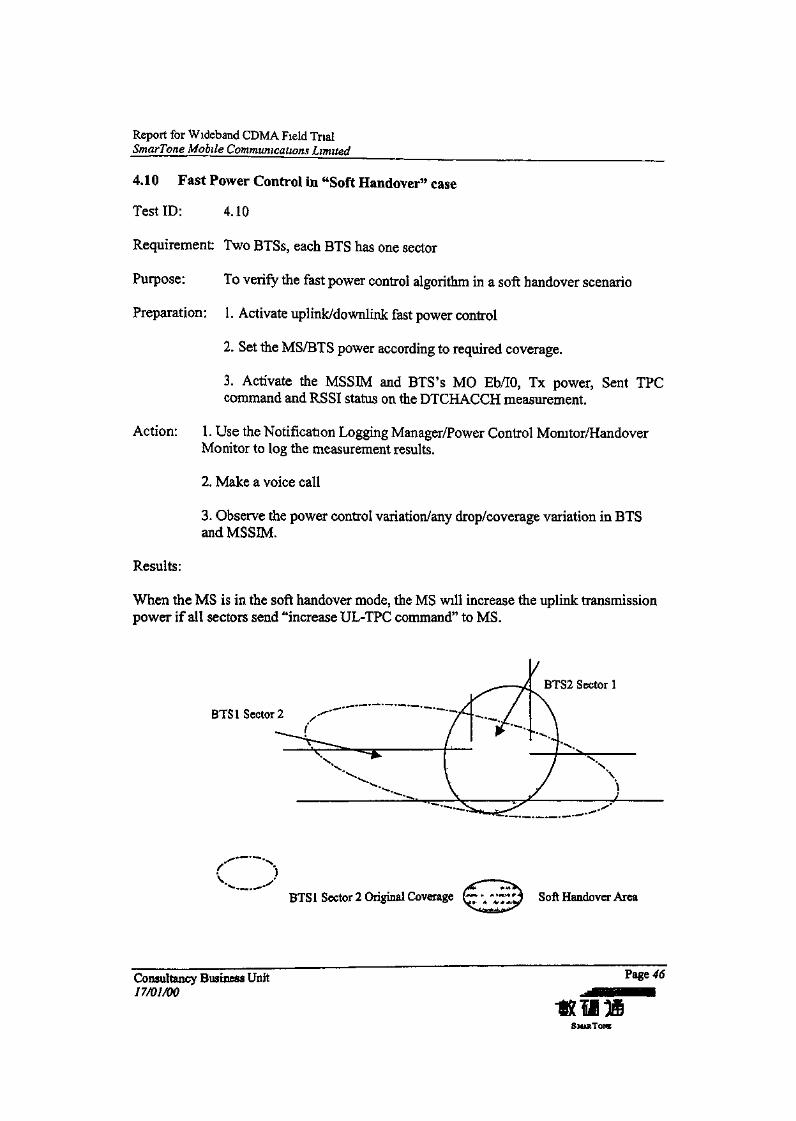
4.10 Fast Power Control in "Soft Handover" case
Test ID: 4.10
Requirement: Two BTSs, each BTS has one sector
Purpose: To verify the fast power control algorithm in a soft handover scenario
Preparation: 1. Activate uplink/downlink fast power control
2. Set the MS/BTS power according to required coverage.
3. Activate the MSSIM and BTS's MO Eb/IO, Tx power, Sent TPCcommand and RSSI status on the DTCHACCH measurement.
Action: 1. Use the Notification Logging Manager/Power Control Monitor/HandoverMonitor to log the measurement results.
2, Make a voice call
3. Observe the power control variation/any drop/coverage variation in BTSand MSSIM.
Results:
When the MS is in the soft handover mode, the MS will increase the uplink transmissionpower if all sectors send "increase UL-TPC command" to MS.
BTS2 Sector 1
BTS I Sector 2
BTS 1 Sector 2 Original Coverage f Soft Handover Area
Consultancy Business Unit17/01/00
Page 4<5
SMARTOWE
Report for Wideband CDMA Field TrialSmarTone Mobile Communications Limited
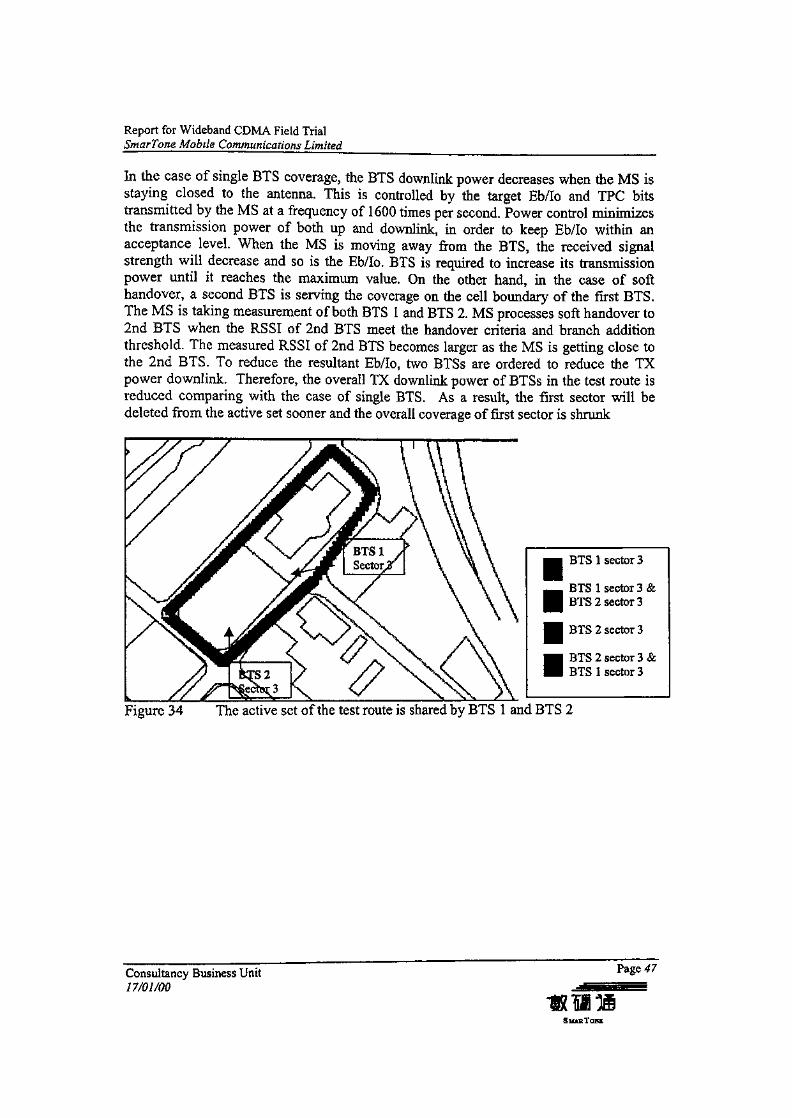
In the case of single BTS coverage, the BTS downlink power decreases when the MS isstaying closed to the antenna. This is controlled by the target Eb/Io and TPC bitstransmitted by the MS at a frequency of 1600 times per second. Power control minimizesthe transmission power of both up and downlink, in order to keep Eb/Io within anacceptance level. When the MS is moving away from the BTS, the received signalstrength will decrease and so is the Eb/Io. BTS is required to increase its transmissionpower until it reaches the maximum value. On the other hand, in the case of softhandover, a second BTS is serving the coverage on the cell boundary of the first BTS.The MS is taking measurement of both BTS 1 and BTS 2. MS processes soft handover to2nd BTS when the RSSI of 2nd BTS meet the handover criteria and branch additionthreshold. The measured RSSI of 2nd BTS becomes larger as the MS is getting close tothe 2nd BTS. To reduce the resultant Eb/Io, two BTSs are ordered to reduce the TXpower downlink. Therefore, the overall TX downlink power of BTSs in the test route isreduced comparing with the case of single BTS. As a result, the first sector will bedeleted from the active set sooner and the overall coverage of first sector is shrunk
BTS 1 sector 3
BTS 1 sector 3 &BTS 2 sector 3
BTS 2 sector 3
BTS 2 sector 3 &BTS 1 sector 3
Figure 34 The active set of the test route is shared by BTS 1 and BTS 2
Consultancy Business Unit17/01/00
Page 47
1*1! 31
Report for Wideband CDMA Field TrialSmarTone Mobile Communications Limited
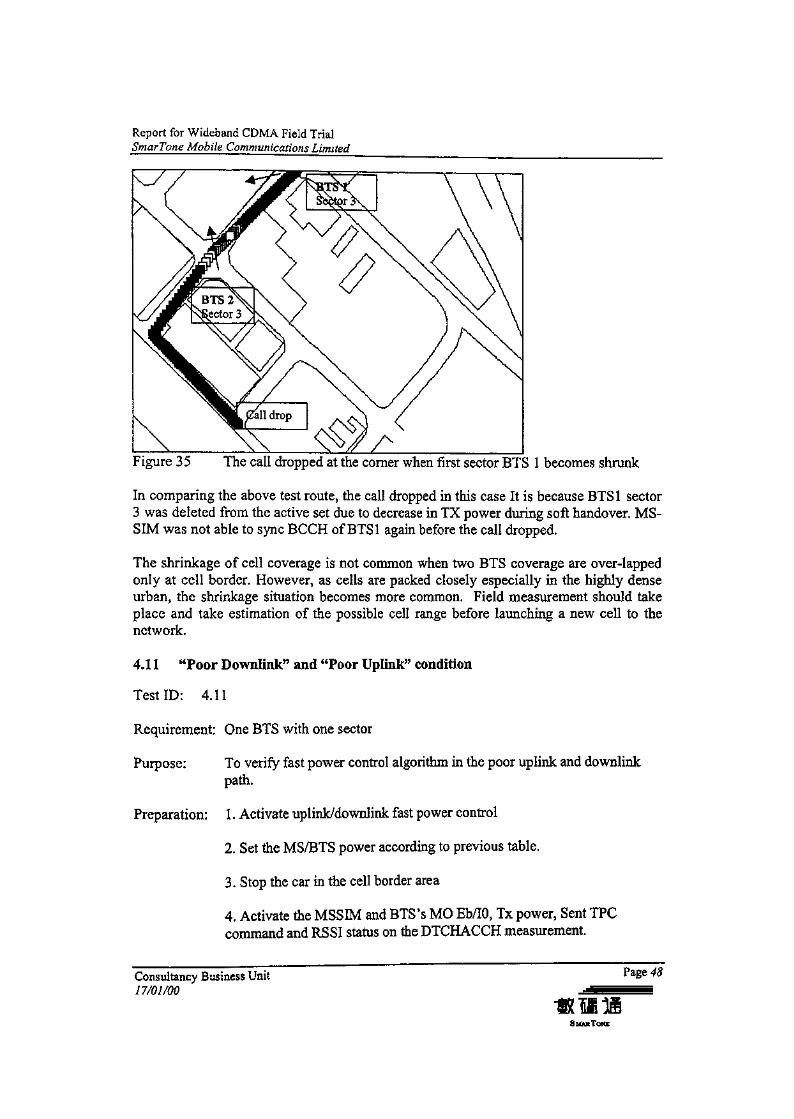
Figure 35 The call dropped at the corner when first sector BTS 1 becomes shrunk
In comparing the above test route, the call dropped in this case It is because BTS1 sector3 was deleted from the active set due to decrease in TX power during soft handover. MS-SIM was not able to sync BCCH of BTS 1 again before the call dropped.
The shrinkage of cell coverage is not common when two BTS coverage are over-lappedonly at cell border. However, as cells are packed closely especially in the highly denseurban, the shrinkage situation becomes more common. Field measurement should takeplace and take estimation of the possible cell range before launching a new cell to thenetwork.
4,11 aPoor Downlink" and "Poor Uplink" condition
Test ID: 411
Requirement: One BTS with one sector
Puipose: To verify fast power control algorithm in the poor uplink and downlinkpath.
Preparation: 1. Activate uplink/downlink fast power control
2, Set the MS/BTS power according to previous table.
3, Stop the car in the cell border area
4, Activate the MSSM and BTS's MO Eh/10, Tx power, Sent TPCcommand and RSSI status on the DTCHACCH measurement.
Consultancy Business Unit17/01/00
Page 48
S MAR TONE
Report for Wideband CDMA Field TrialSmarTone Mobile Communications Limited
Action: 1. Use the Notification Logging Manager/Power Control Monitor to log themeasurement results.
2. Make a voice call
3. Observe the power control variation in BTS and MSSIM.
Results:
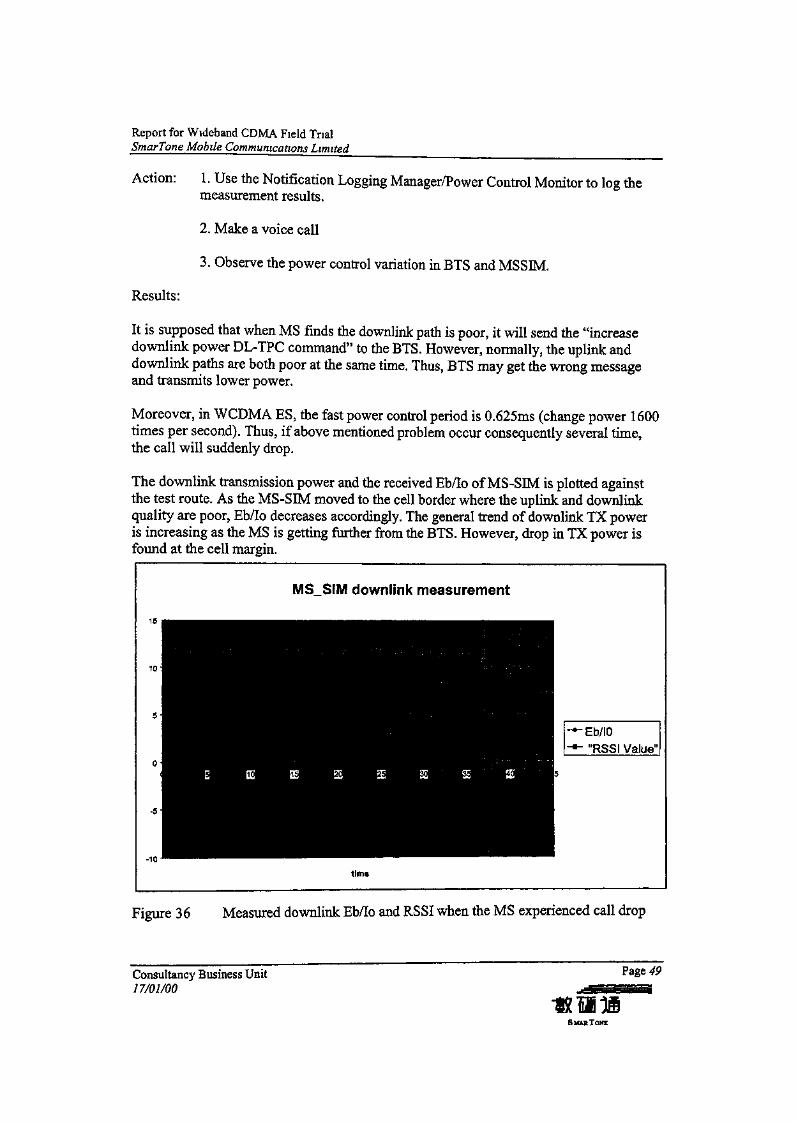
It is supposed that when MS finds the downlink path is poor, it will send the "increasedownlink power DL-TPC command" to the BTS. However, normally, the uplink anddownlink paths are both poor at the same time. Thus, BTS may get the wrong messageand transmits lower power.
Moreover, in WCDMA ES, the fast power control period is 0.625ms (change power 1600times per second). Thus, if above mentioned problem occur consequently several time,the call will suddenly drop.
The downlink transmission power and the received Eb/Io of MS-SIM is plotted againstthe test route. As the MS-SIM moved to the cell border where the uplink and downlinkquality are poor, Eb/Io decreases accordingly. The general trend of downlink TX poweris increasing as the MS is getting further from the BTS. However, drop in TX power isfound at the cell margin.
MS SIM downlink measurement
- Eb/IO• "RSSI Value"
time
Figure 36 Measured downlink Eb/Io and RSSI when the MS experienced call drop
Consultancy Business Unit Pa£e 4917/01/00
SMARTONE
Report for Wideband CDMA Field TrialSmarTone Mobile Communications Limited
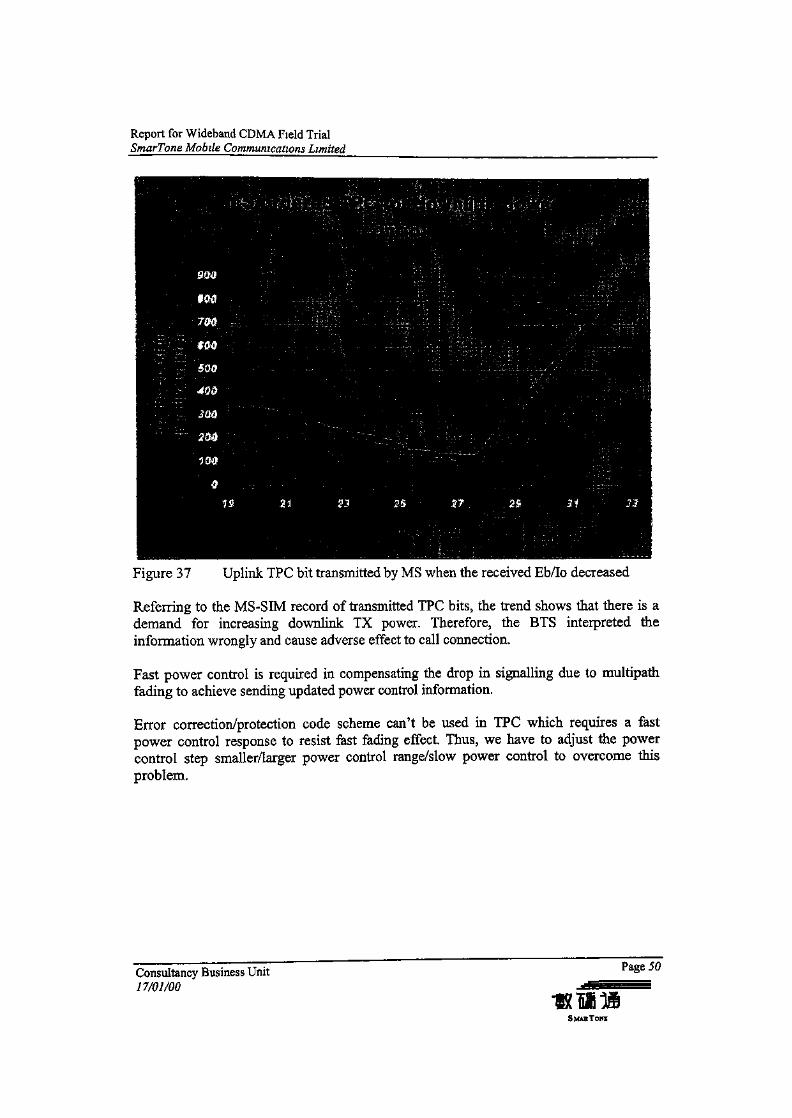
Figure 37 Uplink TPC bit transmitted by MS when the received Eb/Io decreased
Referring to the MS-SIM record of transmitted TPC bits, the trend shows that there is ademand for increasing downlink TX power. Therefore, the BTS interpreted theinformation wrongly and cause adverse effect to call connection.
Fast power control is required in compensating the drop in signalling due to multipathfading to achieve sending updated power control information.
Error correction/protection code scheme can't be used in TPC which requires a fastpower control response to resist fast fading effect. Thus, we have to adjust the powercontrol step smaller/larger power control range/slow power control to overcome thisproblem.
Consultancy Business Unit17/01/00
Page 50
SMARTONE
Report for Wideband CDMA Field TrialSmarTone Mobile Communications Limited
4.12 Multiple Path Characteristics
Test ID.: 6.12
Requirement: Two BTSs - One BTS with three sectors, another BTS with two sectors
Purpose: The purpose of this test is to evaluate the call quality when the MS suffersfading problem, eg. corners effect...
Preparation: 1. Activate uplink or downlink fast power control
2. Measure "rate of lost synchronization", "after and before UER in DLand UL", "Delay Power Spectrum", "EblO UL and DL" and "RSSIULand DL".
Action: 1. Start all measurement
2. Set up a voice call and drive the predefined route two times.
3. Observe all measured results
Results:
WCDMA system has two diversity characteristics:
* Frequency diversity — The bandwidth of a carrier in WCDMA is 5MHzt which islarger than that of the coherent bandwidth; thus, it can overcome fading problem.
» Multipath diversity - There is a rake receiver in the WCDMA system. In eachrake receiver, it can capture and combine maximum eight different multipathsignal to a useful signal
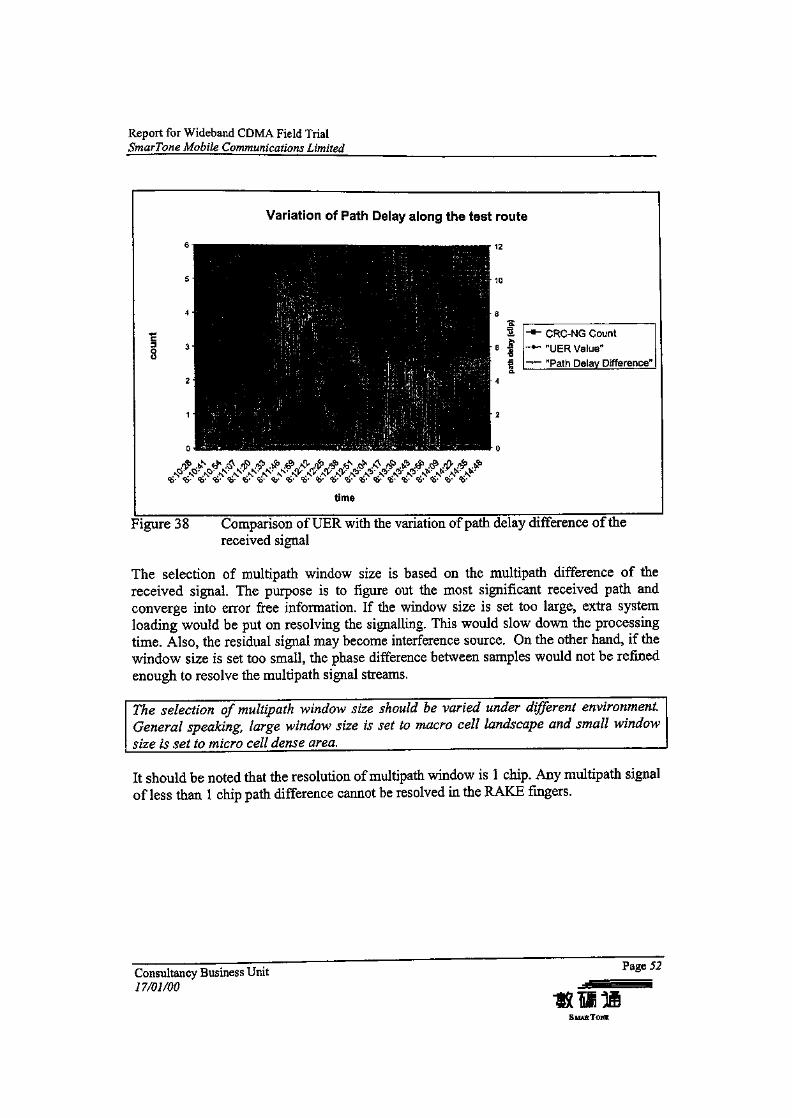
Among the eight different multipaths, maximum path delay difference are extracted andplotted against the UER. The difference is smaller in the line of sight conditioncomparing with the blocking situation.
There is no direct influence between UER and the multipath difference. However, if thesearching window of multipath is set too small, the valid signal may be missed out.According to the graph, the captured samples have the path difference within 12 chips byobservation. Therefore, in order to select the most useful signal, the minimum windowsize should be able to accommodate a delay of 12 chips in this case.
On the other hand, the rake receiver does not work effectively if the window size is settoo large and pick up dummy signal.
Consultancy Business Unit PaSe 17/01/00 w f
*> — ^k
Report for Wideband CDMA Field TrialSmarTone Mobile Communications Limited
Variation of Path Delay along the test route
c
8
CRC-NG Count
"UER Value""Path Delay Difference"
time
Figure 38 Comparison of UER with the variation of path delay difference of thereceived signal
The selection of multipath window size is based on the multipath difference of thereceived signal. The purpose is to figure out the most significant received path andconverge into error free information. If the window size is set too large, extra systemloading would be put on resolving the signalling. This would slow down the processingtime. Also, the residual signal may become interference source. On the other hand, if thewindow size is set too small, the phase difference between samples would not be refinedenough to resolve the multipath signal streams.
The selection of multipath window size should be varied under different environment.General speaking, large window size is set to macro cell landscape and small windowsize is set to micro cell dense area.
It should be noted that the resolution of multipath window is 1 chip. Any multipath signalof less than 1 chip path difference cannot be resolved in the RAKE fingers.
Consultancy Business Unit17/01/00
Page 52
S MAR TONE
Report for Wideband CDMA Field TrialSmarTone Mobile Communications Limited
5 CONCLUSION
In the technical evaluation of the WCDMA experimental system, radio characteristicshave been studied in terms of coverage, mobility and robustness to Hong Kongenvironment.
High frequency reuse is one of the main characteristics of WCDMA: all cells areconfigured with the same channel Interference becomes an important indication of cellcoverage instead of just received signal strength. It is necessary to re-define cell borderaccording to interference in cell planning: Uplink cell border is defined according to theuplink interference generated by other MS. Downlink cell border is defined by targetEb/Io of the downlink signal. It is possible that the idle mode serving area of a cell sectorneed not be equal to that for the active mode coverage. Thus, power assignment plan foreach control and traffic channel becomes one of the future cell planning tasks
Data service requires higher transmission power in order to obtain the same coveragewith voice service. This is related to number of physical channels involved in data linkand the sensitivity of hardware towards data rate. Sensitivity has a relation with logarithmof data rate in this ES. There is a 9 dB decrement in sensitivity, comparing a 256ksps tothat of a 32ksps physical channel.
Closed loop fast power control is designated to minimize the (near to far problem)interference toward other MS connection. The operating range should be consideredbefore site roll out, target Eb/Io and pathloss should be estimated. Since there is noprotect on the transmit power control (TPC) bit, there exists a potential hazard onundetermined TPC in case of poor signal quality. Power control filtering window issuggested in association with fast power control.
Soft handover builds marco diversity to improve received signal from fading effect.However, too many active sectors are undesirable in using radio resources and creation ofdownlink interference. Downlink Eb/Io is suggested as the handover criteria in this radioenvironment Further evaluation is suggested when more traffic (interference) is injectedto the system.
Consultancy Business Unit Pa£e 5$17/01/00
SMART ONE
Report for Wideband CDMA Field TrialSmarTone Mobile Communications Limited
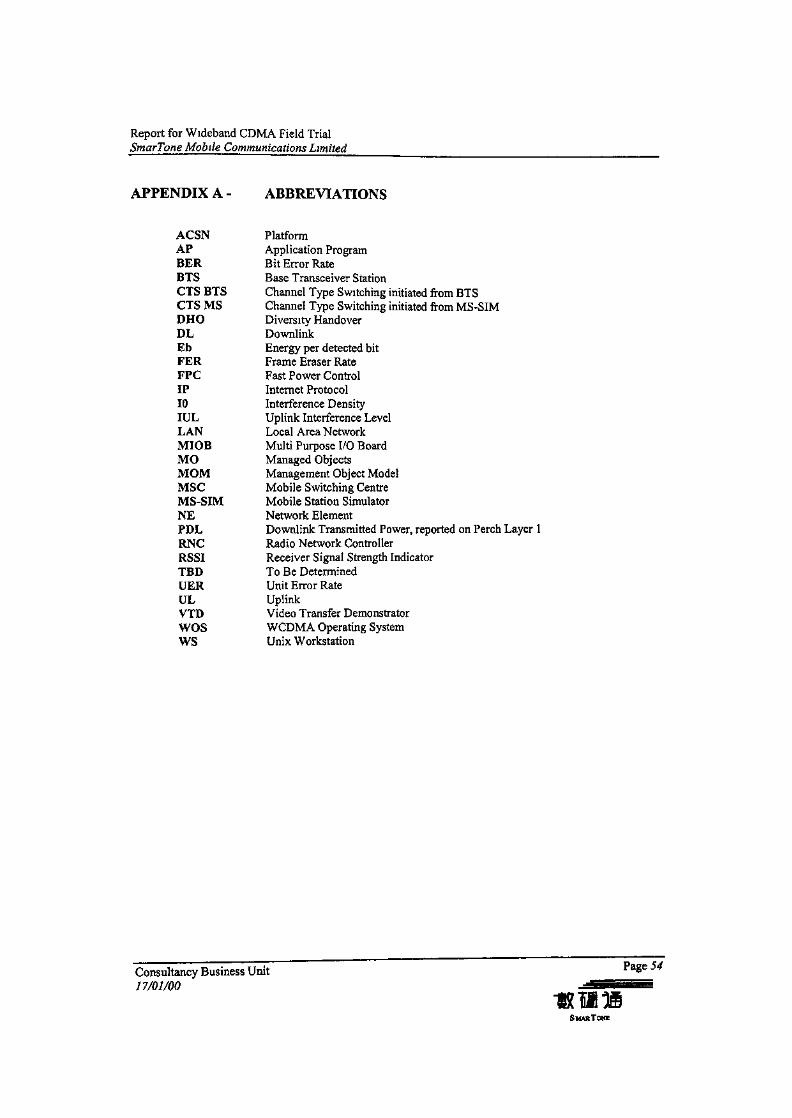
APPENDIX A - ABBREVIATIONS
ACSN PlatformAP Application ProgramBER Bit Error RateBTS Base Transceiver StationCTS BTS Channel Type Switching initiated from BTSCTS MS Channel Type Switching initiated from MS-SIMDHO Diversity HandoverDL DownlinkEb Energy per detected bitFER Frame Eraser RateFPC Fast Power ControlIP Internet Protocol10 Interference DensityIUL Uplink Interference LevelLAN Local Area NetworkMIOB Multi Purpose I/O BoardMO Managed ObjectsMOM Management Object ModelMSC Mobile Switching CentreMS-SIM Mobile Station SimulatorNE Network ElementPDL Downlink Transmitted Power, reported on Perch Layer 1RNC Radio Network ControllerRSSI Receiver Signal Strength IndicatorTBD To Be DeterminedUER Unit Error RateUL UplinkVXD Video Transfer DemonstratorWOS WCDMA Operating SystemWS Unix Workstation
Consultancy Business Unit17/01/00
Page 54
SMARTONE

Report for Wideband CDMA Field TrialSmarTone Mobile Communications Limited
APPENDIX B - WCDMA BTS ANTENNA
ELECTRICAL DATA
Frequency Band
PolarizationGainVertical beamAzimuth beamFront-to-back ratioVSWRIsolation between polarizationIntermodulationElectrical downtiltConnectorsPower rating
Rx: 1920-1980 MHZTx: 21 10-2 170 MHzDual (+/-450)17+/-0,5dBi8 +/-0,5°65 +/-3°<-20dBmax 1,7:1>26dB-150+dBc, two carriers, 10 W2°7/1 6 DIN female socket200W
MECHANICAL DATA
WidthDepthLengthWeightColor
205mm70mm1055mm5,3kgGrey
ENVIRONMENT CONDITIONS
TemperatureSolar radiationHumidityWind
Air pressure
-55°C to +65°C (incl. solar radiation)1120W/(m2)<100%RHOperation: 30 m/sSurvival: 50 m/smin 70 kPa
Consultancy Business Unit17/01/00
Page 55
SMARTONE
Report for Wideband CDMA Field TrialSmarTone Mobile Communications Limited
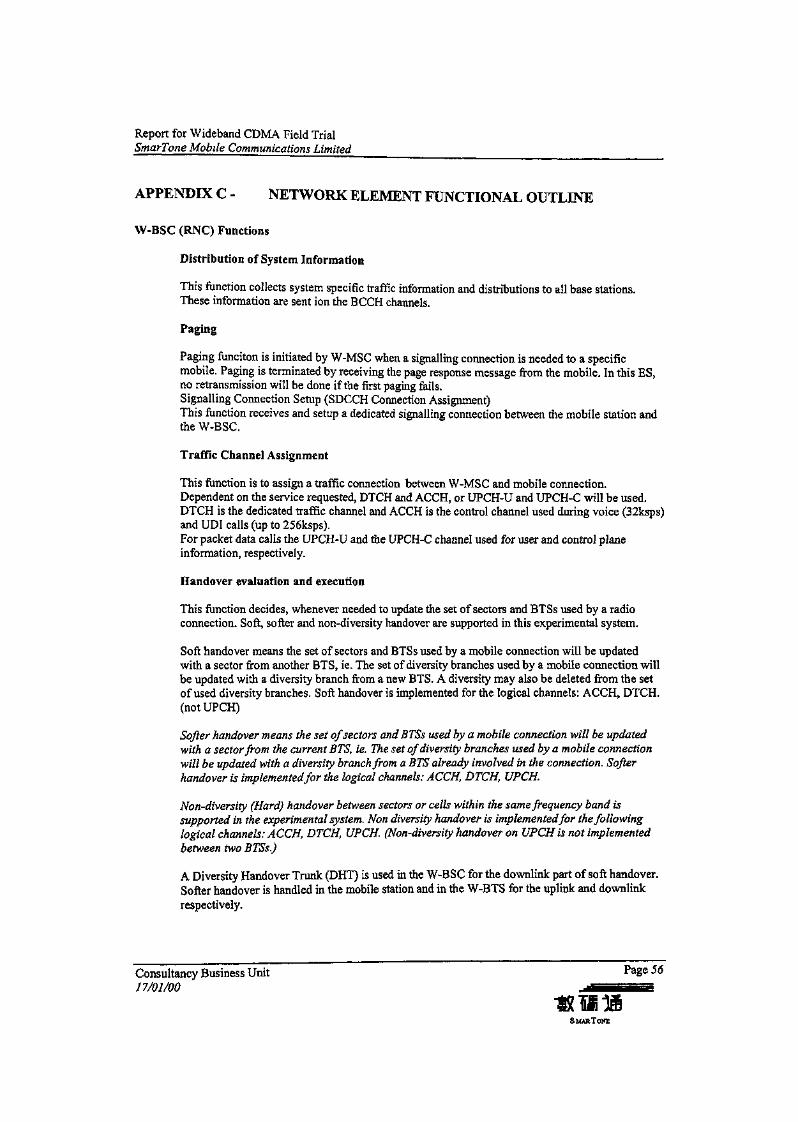
APPENDIX C - NETWORK ELEMENT FUNCTIONAL OUTLINE
W-BSC (RNC) Functions
Distribution of System Information
This function collects system specific traffic information and distributions to all base stations.These information are sent ion the BCCH channels.
Paging
Paging funciton is initiated by W-MSC when a signalling connection is needed to a specificmobile. Paging is terminated by receiving the page response message from the mobile. In this ES,no retransmission will be done if the first paging fails.Signalling Connection Setup (SDCCH Connection Assignment)This function receives and setup a dedicated signalling connection between the mobile station andthe W-BSC.
Traffic Channel Assignment
This function is to assign a traffic connection between W-MSC and mobile connection.Dependent on the service requested, DTCH and ACCH, or UPCH-U and UPCH-C will be used.DTCH is the dedicated traffic channel and ACCH is the control channel used during voice (32ksps)and UDI calls (up to 256ksps).For packet data calls the UPCH-U and the UPCH-C channel used for user and control planeinformation, respectively.
Handover evaluation and execution
This function decides, whenever needed to update the set of sectors and BTSs used by a radioconnection. Soft, softer and non-diversity handover are supported in this experimental system.
Soft handover means the set of sectors and BTSs used by a mobile connection will be updatedwith a sector from another BTS, ie. The set of diversity branches used by a mobile connection willbe updated with a diversity branch from a new BTS. A diversity may also be deleted from the setof used diversity branches. Soft handover is implemented for the logical channels: ACCH, DTCH.(notUPCH)
Softer handover means the set of sectors and BTSs used by a mobile connection mil be updated-with a sector from the current BTS, ie. The set of diversity branches used by a mobile connectionwill be updated with a diversity branch from a BTS already involved in the connection. Softerhandover is implemented for the logical channels: ACCH, DTCH, UPCH.
Non-diversity (Hard) handover between sectors or cells within the same frequency band issupported in the experimental system. Non diversity handover is implemented for the followinglogical channels: ACCH, DTCH, UPCH. (Non-diversity handover on UPCH is not implementedbetween two BTSs.)
A Diversity Handover Trunk (DHT) is used in the W-BSC for the downlink part of soft handover.Softer handover is handled in the mobile station and in the W-BTS for the uplink and downlinkrespectively.
Consultancy Business Unit Page 5617/01/00
SMART ONE
Report for Wideband CDMA Field TrialSmarTone Mobile Communications Limited
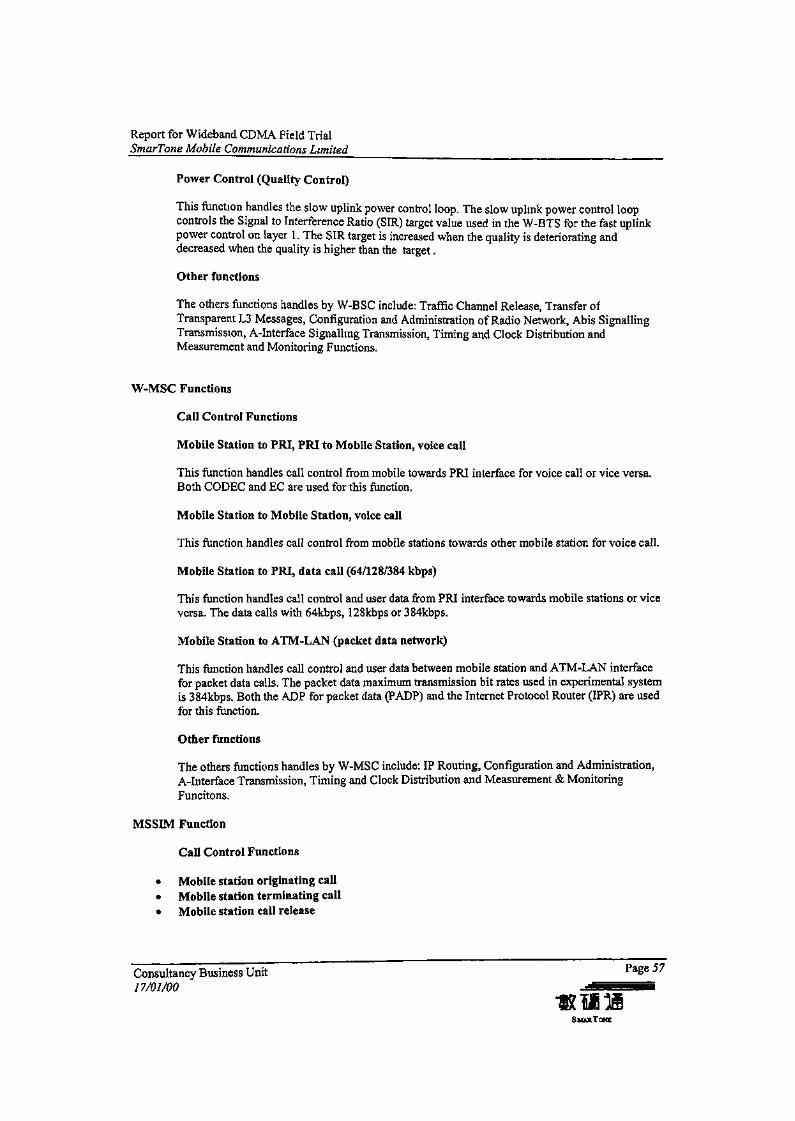
Power Control (Quality Control)
This function handles the slow uplink power control loop. The slow uplink power control loopcontrols the Signal to Interference Ratio (SIR) target value used in the W-BTS for the fast uplinkpower control on layer 1. The SIR target is increased when the quality is deteriorating anddecreased when the quality is higher than the target.
Other functions
The others functions handles by W-BSC include: Traffic Channel Release, Transfer ofTransparent L3 Messages, Configuration and Administration of Radio Network, Abis SignallingTransmission, A-Interface Signalling Transmission, Timing and Clock Distribution andMeasurement and Monitoring Functions.
W-MSC Functions
Call Control Functions
Mobile Station to PRI, PRI to Mobile Station, voice call
This function handles call control from mobile towards PRI interface for voice call or vice versa.Both CODEC and EC are used for this function.
Mobile Station to Mobile Station, voice call
This function handles call control from mobile stations towards other mobile station for voice call.
Mobile Station to PRI, data call (64/128/384 kbps)
This function handles call control and user data from PRI interface towards mobile stations or viceversa. The data calls with 64kbps, 128kbps or 384kbps.
Mobile Station to ATM-LAN (packet data network)
This function handles call control and user data between mobile station and ATM-LAN interfacefor packet data calls. The packet data maximum transmission bit rates used in experimental systemis 384kbps. Both the ADP for packet data (PADP) and the Internet Protocol Router (IPR) are usedfor this function.
Other functions
The others functions handles by W-MSC include: IP Routing, Configuration and Administration,A-Interface Transmission, Timing and Clock Distribution and Measurement & MonitoringFuncitons,
MSSIM Function
Call Control Functions
« Mobile station originating call» Mobile station terminating call• Mobile station call release
Consultancy Business Unit Pa£e 57
17/01/00
•S MAR TONE
Report for Wideband CDMA Field TrialSmarTone Mobile Communications Limited
Radio Network Control Functions
• Idle mode controlMS-SIM reads system information and control channel structure from the BCCH on the perchchannel with the strongest received level. After this stage, the MS listens to the PCH.
« Paging• Signaling connection setup• Connection release• Bearer setup
Both open loop control vis RACK and fast closed loop vis DTCH is supported. In open looppower control the MSSIM calculates the path loss from the BTS perch TX power available onBCCH and sets the TX power for the RACH. Fast closed loop is implemented via the TPCregulation working in both uplink and downlink, applicable for bidirectional dedicated channels.
• Hard handover• Soft handover• Softer handover
User Plane Function (Data processing)
» Speech processing» UDI data processing® User packet data processing
BTS functions
Network Level Functions• Multicall• Soft handover
This function handles diversity handover between two or three cells. In the downlink, a new BTSstarts to send to the MS. In the uplink, two BTS re receiving the same signal and combination ismade in RNC.
• Softer handoverIt handles the diversity handoverbetween sectors in a cell. In the downlink, a new sector is addedto the existing radiolink and the MS receives signals from up to three sectors with different longand short codes. In the uplink, up to three sectors are receiving the same signal and combines themin rake receiver.
• Resynchroinization hard handover
Radio Link Control• Radio Link Setup/ release» Resource allocation and parameter setting» Add/Remove sector to/from Radio Link« DTX control• Fast Power control
The Eb/Io for uplink / downlink signal on the radio link is measured and the transmit powercommands for the BTS / Ms are calculated according to the measurement and target Eb/Io value.The adjustment order is sent through the TPC bit in both up and downlink directions.
• Uplink quality reporting
Consultancy Business Unit Pa8e
17/01/00
S MAR TONE

Report for Wideband CDMA Field TrialSmarTone Mobile Communications Limited
APPENDIX D - RELEVENT MEASUREMENT OBJECT & COMMAND
6.4.1 Idle Mode against Active Mode Coverage
moset MS-SIM/BCCHmeas measStatus = ON RSSIStatus = ON
moset MS-SIM/DTCH_ACCHmeas measStatus = ON EblOStatus = ON RSSIStatus = ONrnoset MS-SIM/DTCHmeasl measStatus = ON UERICStatus = ON UERDHTStatusl = ONmoset MS-SIM/DTCH_ACCH syncStatSup = ON
moset MS-SIM/UPCHmeas measStatus=ON RSSIStatus = ONmoset MS-SIM/UPCHmeas measStatus=ON RSSIStatus = ON EblOStatus = ONrnoset MS-SIM/UPCHUmeas UERICStatus = ON UERDHTStarus = ON
6.1.5 Own Sector Selection - Evaluation Criterion
moset MS-SIM/IMC OSSEC = 0moset MS-SIM/IMC OSSEC = 1moset MS-SIM/IMC OSSEC = 2moset MS-SIM/IMC OSSEC = 3
moset MS-SIM/resourceTrace traceState = ONmoset MS-SIM/BCCHmeas measStatus = ON EblOStatus = ON RSSIStatus = ONLllnfoStatus = ON
6.1.7 Own Sector Selection - Filtering Time
moset MS-SIM/IMC OSSMfLength = 100moset MS-SIM/IMC OSSMfLength = 200moset MS-SIM/IMC OSSMfLength = 300moset MS-SIM/IMC OSSMfLength = 400
moset MS-SIM/resourceTrace traceState = ONmoset MS-SIM/BCCHmeas measStatus = ON EblOStatus = ON RSSIStatus = ONL2InfoStatus = ON
6.3.1 Softer/Soft Handover performance
moset MS-SIM/HO activeSetRec = ON DHOERecordmg = ONmoset MS~SIM/DTCH_ACCHmeas measStatus = ON EblOStatus = ON RSSIStatus = ONmoset MS-SIM/DTCHmeasl measStatus = ON UERICStatus = ON UERDHTStatusl = ON
moset MS-SIM/HO sectorEvalCriteria = 0moset MS-SIM/BTSl/Sector3 softZoneld = 2moset MS-SIM/HO activeSetRec = ON DHOERecordmg = ONmoset MS-SIM/DTCHjVCCHmeas measStatus = ON EblOStatus = ON RSSIStatus = ONmoset MS-SIM/DTCHmeasl measStatus = ON UERICStatus = ON UERDHTStatusl = ON
Consultancy Business Unit17/01/00
SMAHTONE
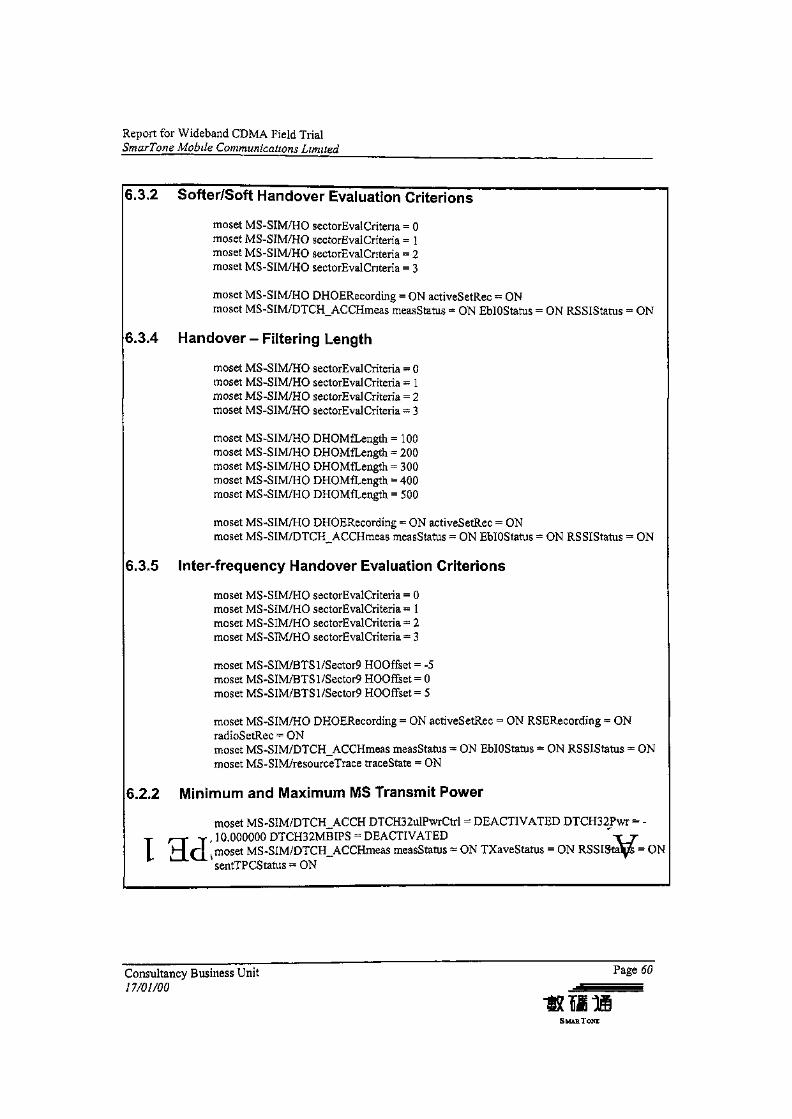
Report for Wideband CDMA Field TrialSmarTone Mobile Communications Limited
3.3.2 Softer/Soft Handover Evaluation Criterions
moset MS-SIM/HO sectorEvalCriteria = 0moset MS-SIM/HO sectorEval Criteria = 1moset MS-SIM/HO sectorEval Criteria = 2moset MS-SIM/HO sectorEval Criteria = 3
rnoset MS-SIM/HO DHOERecording = ON activeSetRec = ONmoset MS-SIM/DTCH_ACCHmeas measStatus = ON EblOStatus = ON RSSIStatus = ON
6.3.4 Handover - Filtering Length
moset MS-SIM/HO sectorEval Criteria = 0moset MS-SIM/HO sectorEval Criteria = 1moset MS-SIM/HO sectorEval Criteria = 2moset MS-SIM/HO sectorEvalCriteria = 3
moset MS-SIM/HO DHOMfLength = 100moset MS-SIM/HO DHOMfLength = 200moset MS-SIM/HO DHOMfLength = 300moset MS-SIM/HO DHOMfLength = 400moset MS-SIM/HO DHOMfLength == 500
moset MS-SIM/HO DHOERecording = ON activeSetRec = ONmoset MS-SIM/DTCH__ACCHmeas measStatus = ON EblOStatus = ON RSSIStatus = ON
6.3.5 Inter-frequency Handover Evaluation Criterions
moset MS-SIM/HO sectorEvalCriteria = 0rnoset MS-SIM/HO sectorEvalCriteria = 1moset MS-SIM/HO sectorEvalCriteria = 2moset MS-SIM/HO sectorEvalCriteria = 3
moset MS~SIM/BTSl/Sector9 HOOffset = -5moset MS-SIM/BTSl/Sector9 HOOffset = 0moset MS-SIM/BTSl/Sector9 HOOffset = 5
moset MS-SIM/HO DHOERecording = ON activeSetRec = ON RSERecording = ONradioSetRec = ONmoset MS-SIM/DTCH_ACCHmeas measStatus = ON EblOStatus = ON RSSIStatus = ONmoset MS-SIM/resourceTrace traceState - ON
6.2.2 Minimum and Maximum MS Transmit Power
moset MS-SIM/DTCH_ACCH DTCH32ulPwrCtrl = DEACTIVATED DTCH32Pwr = -10.000000 DTCH32MBIPS = DEACTIVATED "-^7-
I hJ A moset MS-SIM/DTCH_ACCHmeas measStatus = ON TXaveStatus = ON RSSI^talpj = ONsentTPCStatus = ON
Consultancy Business Unit Page
17/01/00
S MAE TONE
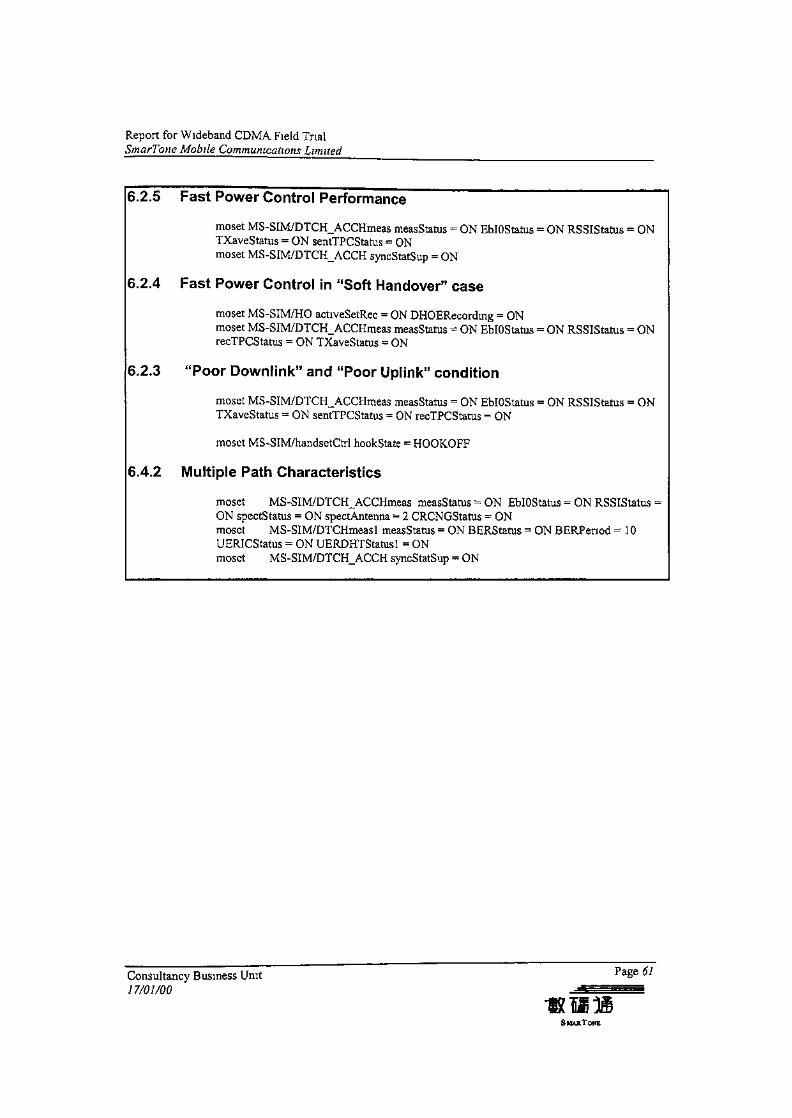
Report for Wideband CDMA Field TrialSmarTone Mobile Communications Limited
6.2.5 Fast Power Control Performance
moset MS~SIM/DTCH_ACCHmeas measStatus = ON EblOStatus = ON RSSIStatus = ONTXaveStatus = ON sentTPCStatus = ONmoset MS-SIM/DTCH_ACCH syncStatSup = ON
6.2.4 Fast Power Control in "Soft Handover" case
rnoset MS-SIM/HO activeSetRec = ON DHOERecordmg = ONmoset MS-SIM/DTCH_ACCHmeas measStatus = ON EblOStatus = ON RSSIStatus = ONrecTPCStatus = ON TXaveStatus = ON
6.2.3 "Poor Downlink" and "Poor Uplink" condition
moset MS-SIM/DTCH_ACCHmeas measStatus = ON EblOStatus = ON RSSIStatus = ONTXaveStatus = ON sentTPCStatus = ON recTPCStatus = ON
moset MS-SIM/handsetCtrl hookState = HOOKOFF
6.4.2 Multiple Path Characteristics
moset MS-SIM/DTCH_ACCHmeas measStatus = ON EblOStatus = ON RSSIStatus =ON spectStatus = ON spectAntenna = 2 CRCNGStatus = ONmoset MS-SIM/DTCHmeasl measStatus = ON BERStatus = ON BERPenod = 10UERICStatus = ON UERDHTStatusl = ONmoset MS-SIM/DTCH__ACCH syncStatSup = ON
Consultancy Business Unit Pa£e
17/01/00
SMARTONE
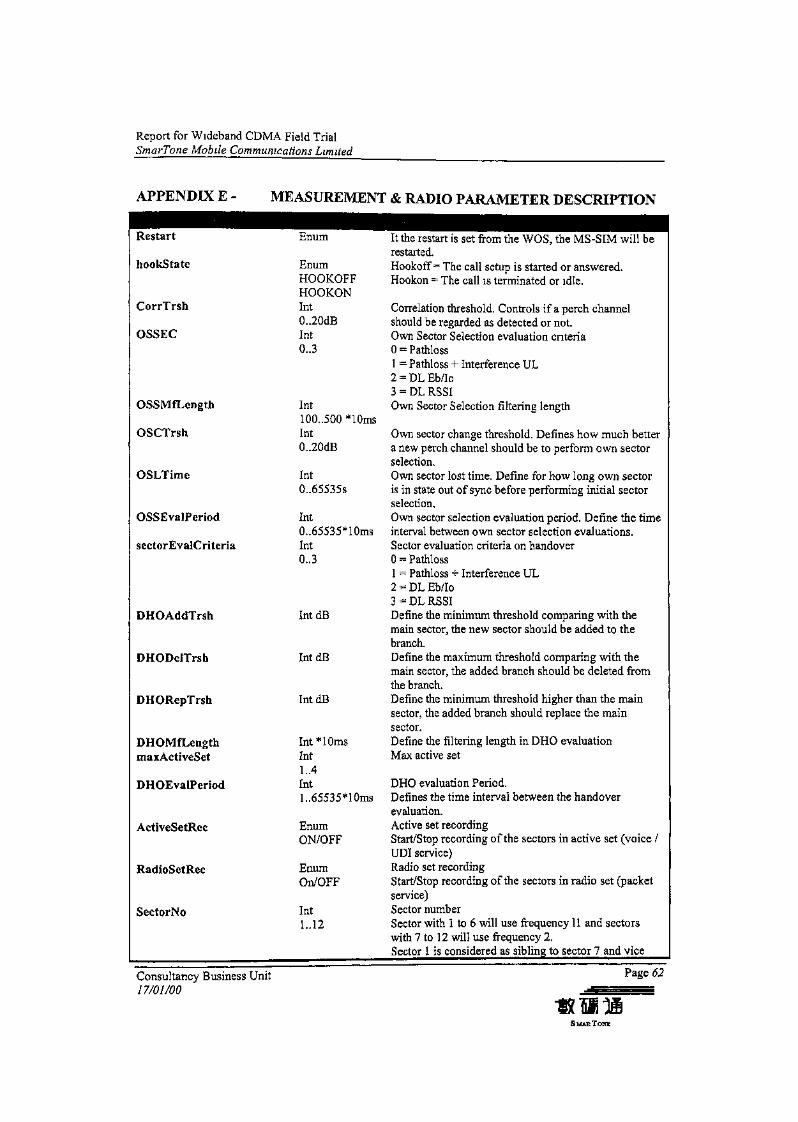
Report for Wideband CDMA Field TrialSmarTone Mobile Communications Limited
APPENDIX E - MEASUREMENT & RADIO PARAMETER DESCRIPTION
Restart
hookState
CorrTrsh
OSSEC
OSSMfLength
OSCTrsh
OSLTime
OSSEvalPcriod
sectorEvalCriteria
DHOAddTrsh
DHODeJTrsh
DHORepTrsh
DHOMfLengthmaxActiveSet
DHOEvalFeriod
ActiveSetRec
RadioSetRec
SectorNo
Enum
EnumHOOKOFFHOOKONInt0..20dBInt0..3
Int100..500 *10msInt0..20dB
IntO..65535s
IntO..65535*10msInt0..3
IntdB
IntdB
IntdB
Int* 10msInt1..4IntL. 65535*1 Oms
EnumON/OFF
EnumOn/OFF
Int1..12
It the restart is set from the WOS, the MS-SIM will berestarted.Hookoff = The call setup is started or answered.Hookon = The call is terminated or idle.
Correlation threshold. Controls if a perch channelshould be regarded as detected or not.Own Sector Selection evaluation criteria0 = Pathless1 = Pathloss + Interference UL2 = DL Eb/Io3 = DL RSSIOwn Sector Selection filtering length
Own sector change threshold. Defines how much bettera new perch channel should be to perform own sectorselection.Own sector lost time. Define for how long own sectoris in state out of sync before performing initial sectorselection.Own sector selection evaluation period. Define the timeinterval between own sector selection evaluations.Sector evaluation criteria on handover0 = Pathloss1 = Pathloss + Interference UL2 = DL Eb/Io3 = DL RSSIDefine the minimum threshold comparing with themain sector, the new sector should be added to thebranch.Define the maximum threshold comparing with themain sector, the added branch should be deleted fromthe branch.Define the minimum threshold higher than the mainsector, the added branch should replace the mainsector.Define the filtering length in DHO evaluationMax active set
DHO evaluation Period.Defines the time interval between the handoverevaluation.Active set recordingStart/Stop recording of the sectors in active set (voice /UDI service)Radio set recordingStart/Stop recording of the sectors in radio set (packetservice)Sector numberSector with 1 to 6 will use frequency 11 and sectorswith 7 to 12 will use frequency 2.Sector 1 is considered as sibling to sector 7 and vice
Consultancy Business Unit17/01/00
Page 62
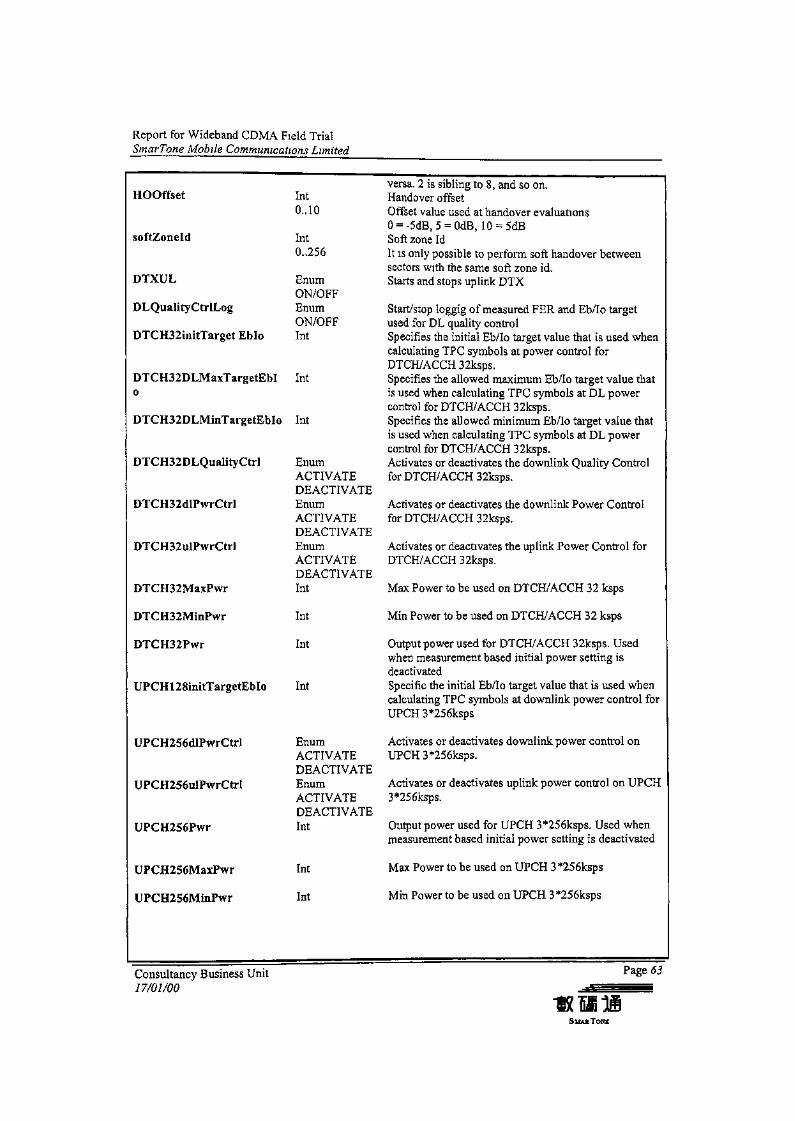
Report for Wideband CDMA Field TrialSmarTone Mobile Communications Limited
HOOffset
softZoneld
DTXUL
DLQualityCtrlLog
DTCH32initTarget Eblo
DTCH32DLQualityCtrl
DTCH32dlPwrCtrl
DTCH32ulPwrCtri
DTCH32MaxPwr
DTCH32MinPwr
DTCH32Pwr
UPCH128initTargetEbIo
UPCH256d!PwrCtr!
UPCH256uIPwrCtrI
UPCH256Pwr
UPCH256MaxPwr
UPCH256MinPwr
Int0..10
Int0..256
EnumON/OFFEnumON/OFFInt
DTCH32DLMaxTargetEbI Into
DTCH32DLMinTargetEbIo Int
EnumACTIVATEDEACTIVATEEnumACTIVATEDEACTIVATEEnumACTIVATEDEACTIVATEInt
Int
Int
Int
EnumACTIVATEDEACTIVATEEnumACTIVATEDEACTIVATEInt
Int
Int
versa. 2 is sibling to 8, and so on.Handover offsetOffset value used at handover evaluations0 = -5dB, 5 = OdB, 10 = 5dBSoft zone IdIt is only possible to perform soft handover betweensectors with the same soft zone id.Starts and stops uplink DTX
Start/stop loggig of measured FER and Eb/Io targetused for DL quality controlSpecifies the initial Eb/Io target value that is used whencalculating TPC symbols at power control forDTCH/ACCH 32ksps.Specifies the allowed maximum Eb/Io target value thatis used when calculating TPC symbols at DL powercontrol for DTCH/ACCH 32ksps.Specifies the allowed minimum Eb/Io target value thatis used when calculating TPC symbols at DL powercontrol for DTCH/ACCH 32ksps.Activates or deactivates the downlink Quality Controlfor DTCH/ACCH 32ksps.
Activates or deactivates the downlink Power Controlfor DTCH/ACCH 32ksps.
Activates or deactivates the uplink Power Control forDTCH/ACCH 32ksps.
Max Power to be used on DTCH/ACCH 32 ksps
Min Power to be used on DTCH/ACCH 32 ksps
Output power used for DTCH/ACCH 32ksps. Usedwhen measurement based initial power setting isdeactivatedSpecific the initial Eb/Io target value that is used whencalculating TPC symbols at downlink power control forUPCH 3*256ksps
Activates or deactivates downlink power control onUPCH 3*256ksps.
Activates or deactivates uplink power control on UPCH3*256ksps.
Output power used for UPCH 3*256ksps. Used whenmeasurement based initial power setting is deactivated
Max Power to be used on UPCH 3*256ksps
Min Power to be used on UPCH 3*256ksps
Consultancy Business Unit17/01/00
Page 63
IKlflttS MAR TO
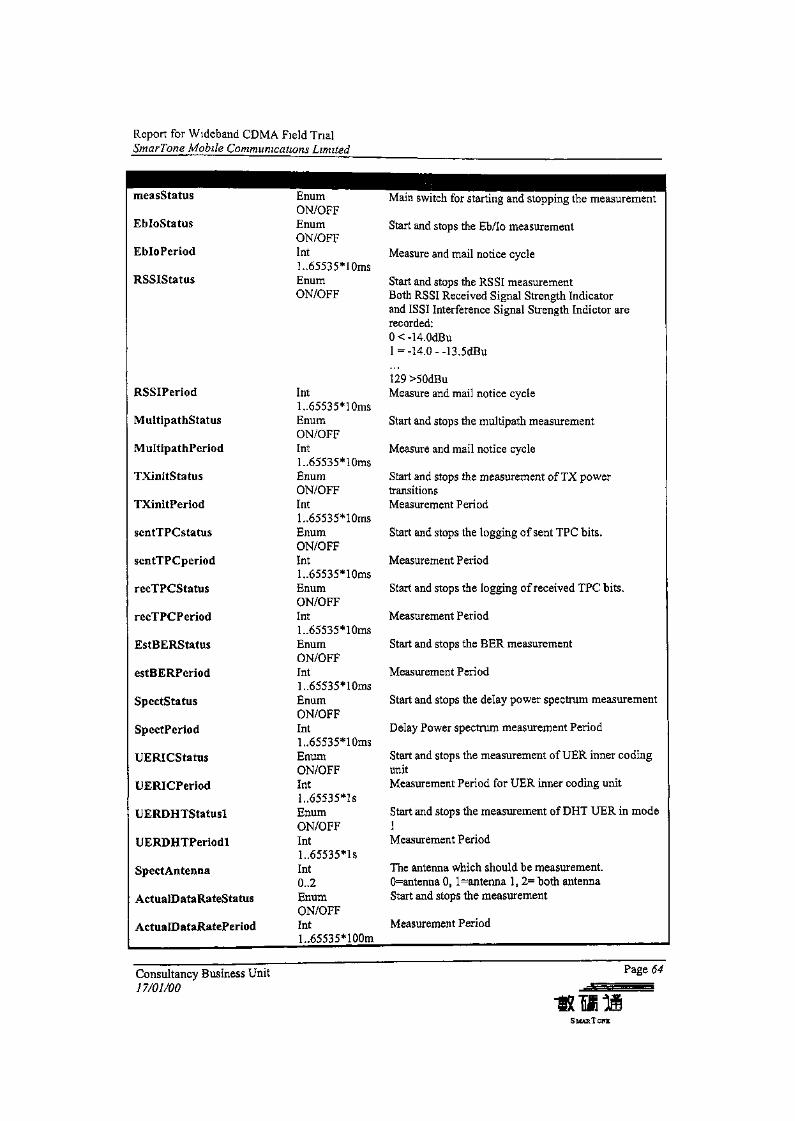
Report for Wideband CDMA Field TrialSmarTone Mobile Communications Limited
measStatus
EbloStatus
EbloPeriod
RSSIStatus
RSSIPeriod
MultipathStatus
MoltipathPeriod
TXinitStatus
TXinitPeriod
sentTPCstatus
sentTPCperiod
recTPCStatus
recTPCPeriod
EstBERStatus
estBERPeriod
SpectStatus
SpectPeriod
UERICStatus
UERICPeriod
UERDHTStatusl
UERDHTPeriodl
SpectAntenna
ActualDataRateStatus
ActualDataRatePeriod
EnumON/OFFEnumON/OFFInt1..65535*10msEnumON/OFF
IntL.65535*10msEnumON/OFFInt1..65535*10msEnurnON/OFFInt1..65535*10msEnumON/OFFInt1..65535*10msEnumON/OFFInt1..65535*10msEnumON/OFFInt1..65535*10msEnumON/OFFInt1..65535*10msEnumON/OFFIntl.,65535*lsEnumON/OFFInt1..65535*lsInt0..2EnumON/OFFInt1..65535*100m
""" ' ' • i "•" ' • i 1Main switch for starting and stopping the measurement
Start and stops the Eb/Io measurement
Measure and mail notice cycle
Start and stops the RSSI measurementBoth RSSI Received Signal Strength Indicatorand IS SI Interference Signal Strength Indictor arerecorded;0<-14.0dBul=-14.0--13.5dBu
129>50dBuMeasure and mail notice cycle
Start and stops the multipath measurement
Measure and mail notice cycle
Start and stops the measurement of TX powertransitionsMeasurement Period
Start and stops the logging of sent TPC bits.
Measurement Period
Start and stops the logging of received TPC bits.
Measurement Period
Start and stops the BER measurement
Measurement Period
Start and stops the delay power spectrum measurement
Delay Power spectrum measurement Period
Start and stops the measurement of UER inner codingunitMeasurement Period for UER inner coding unit
Start and stops the measurement of DHT UER in mode1Measurement Period
The antenna which should be measurement.0=antenna 0, l=antenna 1, 2= both antennaStart and stops the measurement
Measurement Period
Consultancy Business Unit17/01/00
Page 64
SMAJEtTONE
HKNet-Teligent Co., Limited
Demonstration of a Local WirelessFixed Telecommunication System in
Hong Kong - Report to OFTA

TABLE OF CONTENTS
Table of Contents 1
1 Executive Summary 2
2 Content Overview 3
3 HKNet-Teligent Co. Ltd 4
4 Demonstration Network Architecture 5
4.1 Radio Network Architecture 5
4.2 Radio Frequency 6
4.3 Physical Network Diagram 6
5 Network Equipment and Configuration 7
5.1 Site Surveys 7
5.2 Equipment 8
5.3 Network Equipment Configuration 13
6 Tests and Test Results 17
6.1 Tests 17
6.2 RF Tests 17
6.3 Broadband Application Test 40
7 Test Equipment 4<5
8 Summary of test results • 47
9 Participants
10 Appendices 50
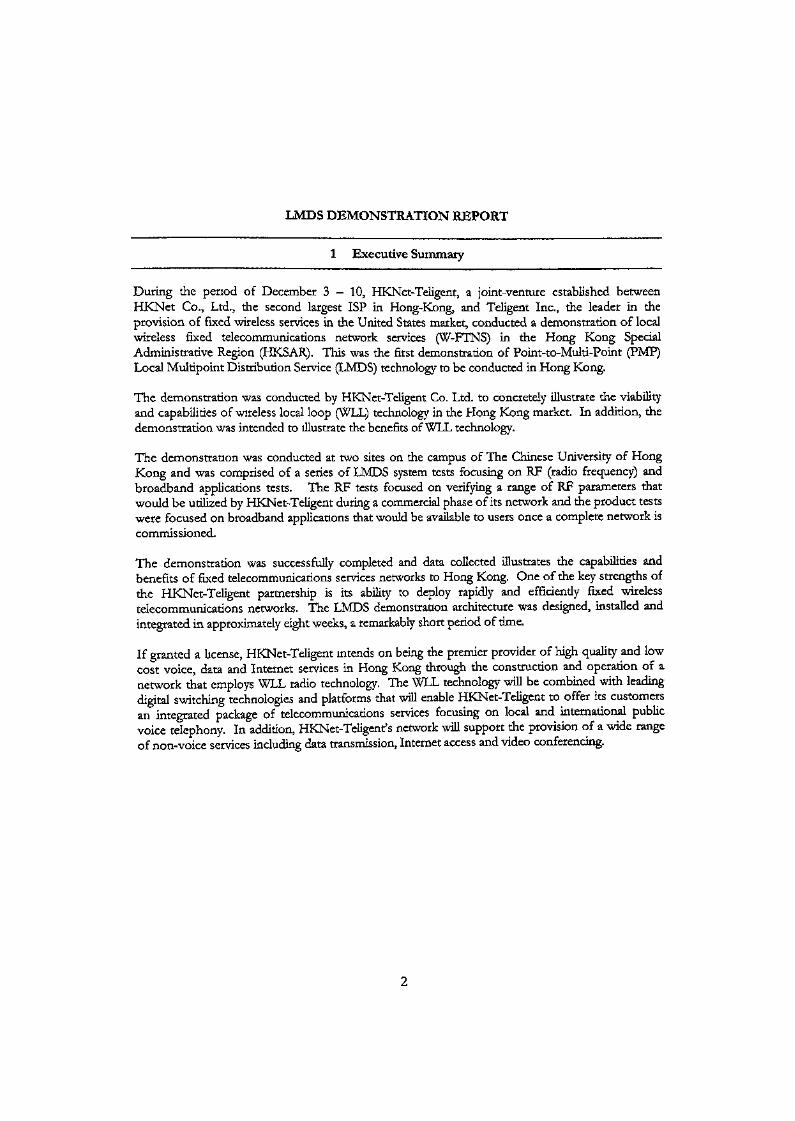
LMDS DEMONSTRATION REPORT
1 Executive Summary
During the period of December 3 - 10, HKNet-Teligent, a joint-venture established betweenHKNet Co., Ltd., the second largest ISP in Hong-Kong, and Teligent Inc., the leader in theprovision of fixed wireless services in the United States market, conducted a demonstration of localwireless fixed telecommunications network services (W-FTNS) in the Hong Kong SpecialAdministrative Region (HKSAR). This was the first demonstration of Point-to-Multi-Point (PMP)Local Multipoint Distribution Service (LMDS) technology to be conducted in Hong Kong.
The demonstration was conducted by HKNet-Teligent Co. Ltd. to concretely illustrate the viabilityand capabilities of wireless local loop (WLL) technology in the Hong Kong market. In addition, thedemonstration was intended to illustrate the benefits of WLL technology.
The demonstration was conducted at two sites on the campus of The Chinese University of HongKong and was comprised of a series of LMDS system tests focusing on RF (radio frequency) andbroadband applications tests. The RF tests focused on verifying a range of RF parameters thatwould be utilized by HKNet-Teligent during a commercial phase of its network and the product testswere focused on broadband applications that would be available to users once a complete network iscommissioned.
The demonstration was successfully completed and data collected illustrates the capabilities andbenefits of fixed telecommunications services networks to Hong Kong. One of the key strengths ofthe HKNet-Teligent partnership is its ability to deploy rapidly and efficiently fixed wirelesstelecommunications networks. The LMDS demonstration architecture was designed, installed andintegrated in approximately eight weeks, a remarkably short period of time.
If granted a license, HKNet-Teligent intends on being the premier provider of high quality and lowcost voice, data and Internet services in Hong Kong through the construction and operation of anetwork that employs WLL radio technology. The WLL technology will be combined with leadingdigital switching technologies and platforms that will enable HKNet-Teligent to offer its customersan integrated package of telecommunications services focusing on local and international publicvoice telephony. In addition, HKNet-Teligent's network will support the provision of a wide rangeof non-voice services including data transmission, Internet access and video conferencing.

2 CONTENT OVERVIEW
This report provides an overview of the HKNet-Teligent demonstration of local wireless fixedtelecommunications network services in Hong Kong. The report introduces the technology used byHKNet-Teligent and demonstrates the viability of the system. Tests were conducted on the campusof The Chinese University of Hong Kong focusing on RF and broadband applications tests. Thereport details the numerous tests, test procedures and test results gathered from the demonstrations.
This report is structured into eight sections. The Section 4, Demonstration Network Architecture^provides an outline and diagram of the radio network design that HKNet-Teligent deployed for thedemonstration. Section 5, Network Equipment and Configuration., details the equipment and radionetwork configuration that was utilized for the demonstration. This section also includes a briefdescription of the network equipment. Section 6, Tests and Test Results, describes the two sets of teststhat were performed for the demonstration, namely, network performance tests and broadbandapplication tests. This section also includes the detailed test procedures as well as the test results. Todemonstrate proper network performance, the following radio frequency tests were conducted:
• Link Budget Validation for the Downstream• Link Budget Validation for the Upstream• Fade Margin Test for the Downstream« Fade Margin Test for the Upstream• Bit Error Rate Test• Network Element Connectivity (Pinging)
To demonstrate broadband capabilities, the following broadband applications tests were completed:
® Web Page Browsing• E-Mail Access• News Reading and Posting• ICQ (I Seek You) Software Application• Throughput Test (File Transfer Protocol)• NetMeeting• RealPlayer
Section 79 Test Equipment, details the equipment used for the broadband application tests. AndSection 8, Summary of Test Results summarizes the overall results of the demonstration.
3 HKNET-TELIGENT CO. LTD.
HKNet-Teligent Co., Ltd. is a joint venture established between HKNet Co., Ltd., the second largestISP in Hong-Kong and Teligent Inc., the leader in the provision of fixed wireless services in the U.S.market, to participate in the licensing process for the operation of local wireless fixedtelecommunication network services (W-FTNS) in Hong-Kong. HKNet, based at China MerchantsTower, 32nd floor, Shun Tak Centre, 168-200 Connaught Road Central Hong Kong, was establishedin 1994 and currently has about 150,000 residential customers and 4,000 corporate customers.Teligent Inc., a corporation formed under the laws of Delaware, U.S.A., is one of the pioneers of thefixed wireless telecommunication services and has currently rolled out its network in 36 U.S. markets.Teligent Inc. is headquartered at 8065 Leesburg Pike, Suite 400, Vienna Virginia, USA.
HKNet is owned by CCT Holdings Ltd., which provides a diversified range of telecommunicationservices in Hong-Kong, mainland China, and the Asia Pacific region, and Nippon Telegraph andTelephone Corporation (NTT), which is the predominant domestic telecommunications operator inJapan. NTT is also a shareholder in Teligent, Inc.
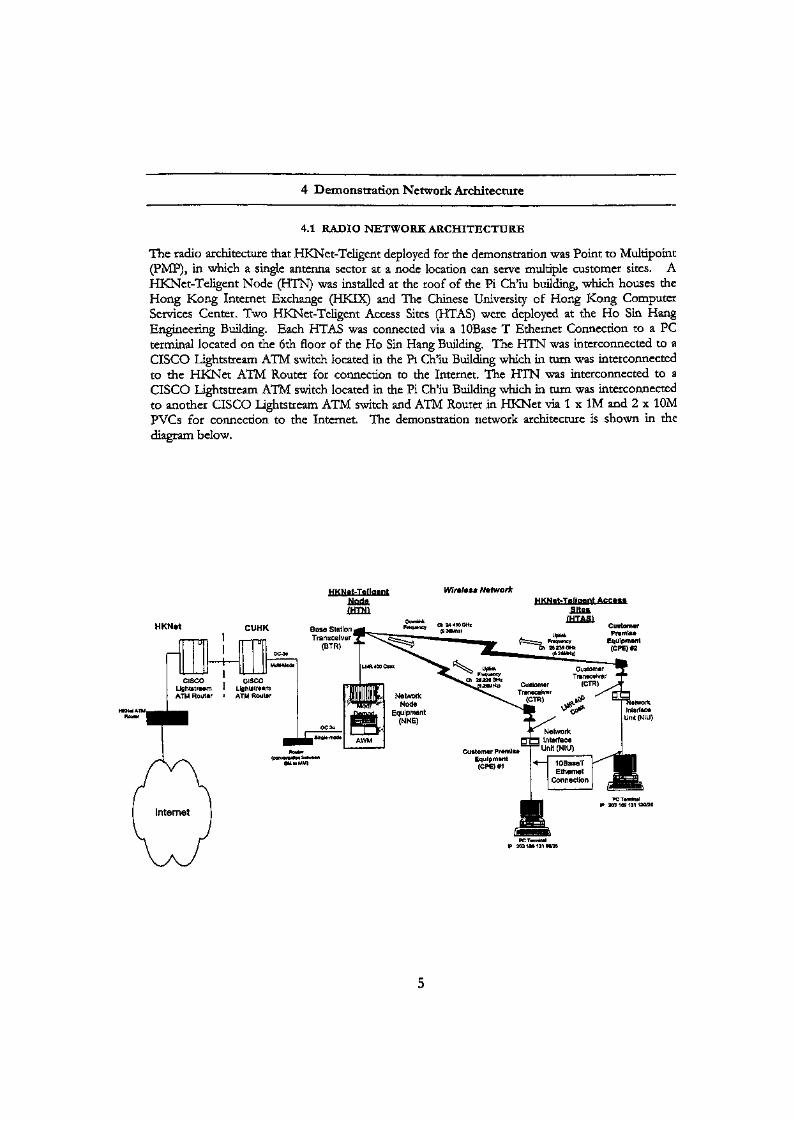
4 Demonstration Network Architecture
4.1 RADIO NETWORK ARCHITECTURE
The radio architecture that HKNet-Teligent deployed for the demonstration was Point to Multipoint(PMP), in which a single antenna sector at a node location can serve multiple customer sites. AHKNet-Teligent Node (HTN) was installed at the roof of the Pi Ch'iu building, which houses theHong Kong Internet Exchange (HKIX) and The Chinese University of Hong Kong ComputerServices Center. Two HKNet-Teligent Access Sites (HTAS) were deployed at the Ho Sin HangEngineering Building. Each HTAS was connected via a lOBase T Ethernet Connection to a PCterminal located on the 6th floor of the Ho Sin Hang Building. The HTN was interconnected to aCISCO Lightstream ATM switch located in the Pi Ch'iu Building which in turn was interconnectedto the HKNet ATM Router for connection to the Internet. The HTN was interconnected to aCISCO Lightstream ATM switch located in the Pi Ch'iu Building which in turn was interconnectedto another CISCO Lightstream ATM switch and ATM Router in HKNet via 1 x 1M and 2 x 10MPVCs for connection to the Internet. The demonstration network architecture is shown in thediagram below.
HKNet-TelfaentNode(HTN)
Wireless Network
HKNot CUHK
HKNet-Tellycnt Access£Ufi£
fHTASl
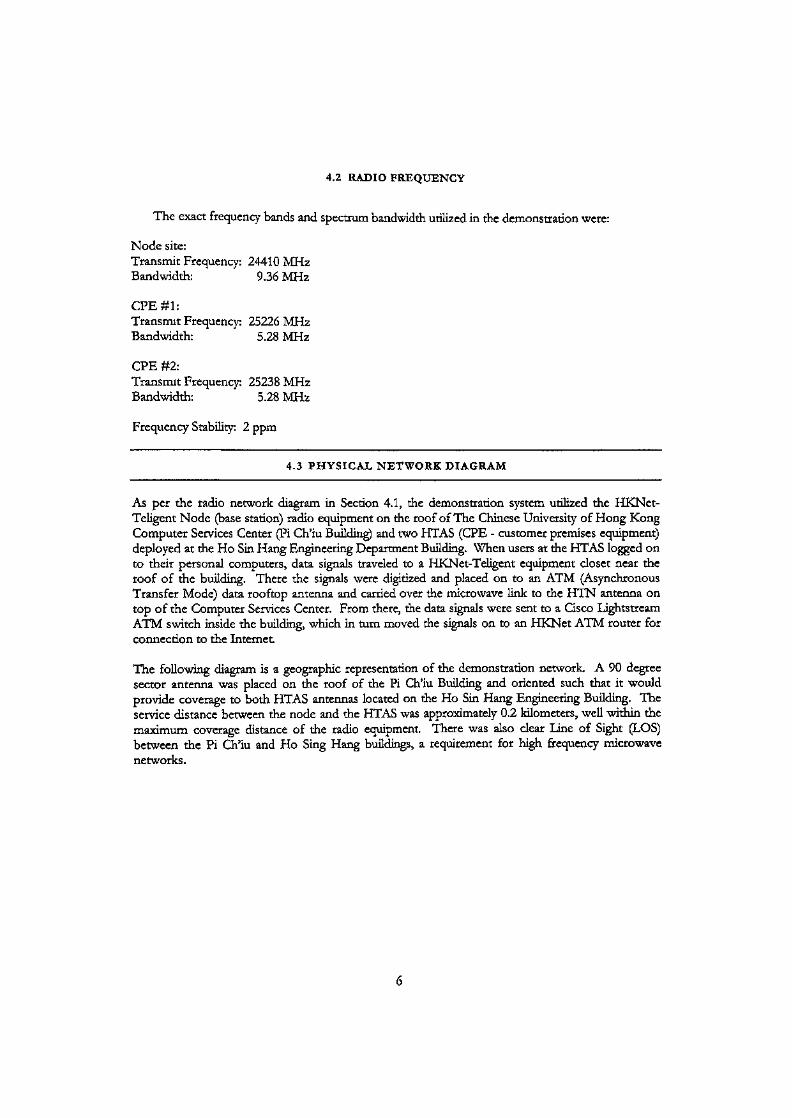
4.2 RADIO FREQUENCY
The exact frequency bands and spectrum bandwidth utilized in the demonstration were:
Node site:Transmit Frequency: 24410 MHzBandwidth: 9.36 MHz
CPE#1:Transmit Frequency: 25226 MHzBandwidth: 5.28 MHz
CPE #2:Transmit Frequency: 25238 MHzBandwidth: 5.28 MHz
Frequency Stability: 2 ppm
4.3 PHYSICAL NETWORK DIAGRAM
As per the radio network diagram in Section 4.1, the demonstration system utilized the HKNet-TeHgent Node (base station) radio equipment on the roof of The Chinese University of Hong KongComputer Services Center (Pi Ch'iu Building) and two HTAS (CPE - customer premises equipment)deployed at the Ho Sin Hang Engineering Department Building. When users at the HTAS logged onto their personal computers, data signals traveled to a HKNet-Teligent equipment closet near theroof of the building. There the signals were digitized and placed on to an ATM (AsynchronousTransfer Mode) data rooftop antenna and carried over the microwave link to the HTN antenna ontop of the Computer Services Center. From there, the data signals were sent to a Cisco LightstreamATM switch inside the building, which in turn moved the signals on to an HKNet ATM router forconnection to the Internet.
The following diagram is a geographic representation of the demonstration network. A 90 degreesector antenna was placed on die roof of the Pi Ch'iu Building and oriented such that it wouldprovide coverage to both HTAS antennas located on the Ho Sin Hang Engineering Building. Theservice distance between the node and the HTAS was approximately 0.2 kilometers, well within themaximum coverage distance of the radio equipment. There was also clear Line of Sight (LOS)between the Pi Ch'iu and Ho Sing Hang buildings, a requirement for high frequency microwavenetworks.
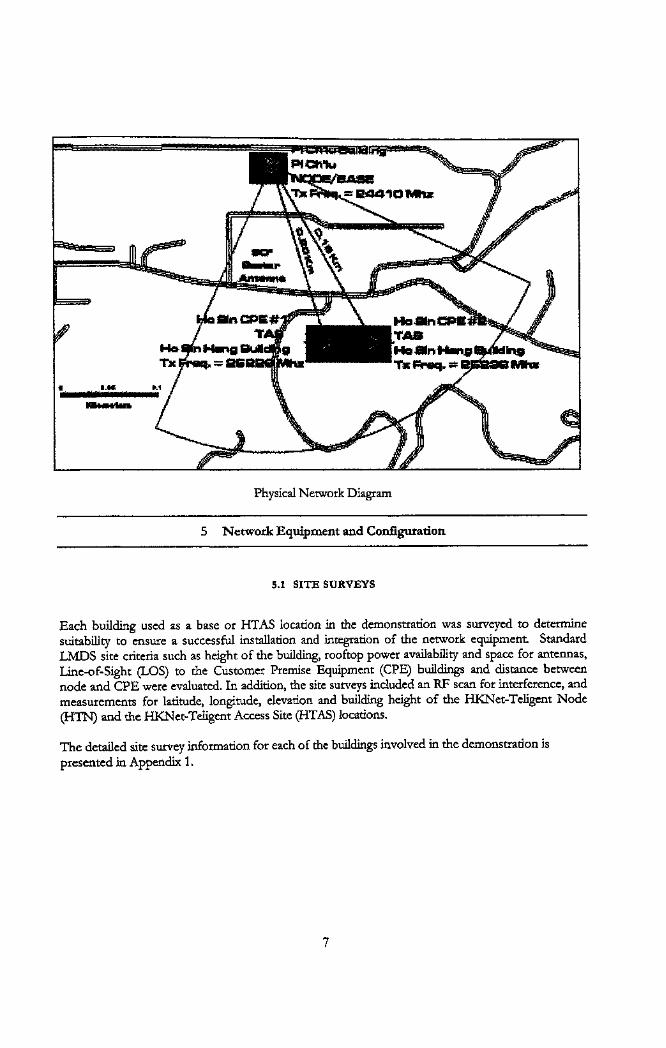
Physical Network Diagram
5 Network Equipment and Configuration
5.1 SITE SURVEYS
Each building used as a base or HTAS location in the demonstration was surveyed to determinesuitability to ensure a successful installation and integration of the network equipment StandardLMDS site criteria such as height of the building, rooftop power availability and space for antennas,Line~of~Sight (LOS) to the Customer Premise Equipment (CPE) buildings and distance betweennode and CPE were evaluated. In addition, the site surveys included an RF scan for interference, andmeasurements for latitude, longitude, elevation and building height of the HKNet-Teligent Node(HTM) and the HKNet-Teligent Access Site (HTAS) locations.
The detailed site survey information for each of the buildings involved in the demonstration ispresented in Appendix 1.
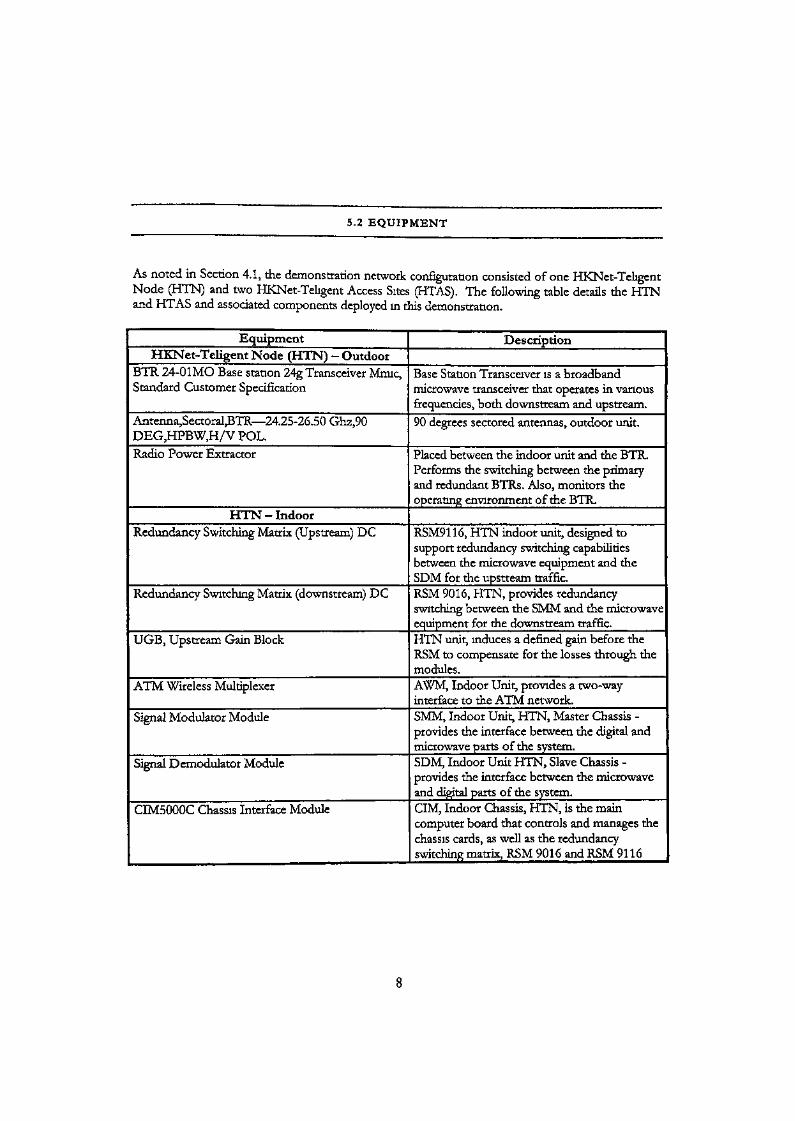
5.2 EQUIPMENT
As noted in Section 4.1, the demonstration network configuration consisted of one HKNet-TeligentNode (HTM) and two HKNet-Teligent Access Sites (HTAS). The following table details the HTNand HTAS and associated components deployed in this demonstration.
EquipmentHKNet-Teligent Node (HTN) - Outdoor
BTR 24-01MO Base station 24g Transceiver Mrmc,Standard Customer Specification
Antenna,Sectoral,BTR— 24.25-26.50 Ghz,90DEG,HPBW,H/V POL.Radio Power Extractor
HTN - IndoorRedundancy Switching Matrix (Upstream) DC
Redundancy Switching Matrix (downstream) DC
UGB, Upstream Gain Block
ATM Wireless Multiplexer
Signal Modulator Module
Signal Demodulator Module
CIM5000C Chassis Interface Module
Description
Base Station Transceiver is a broadbandmicrowave transceiver that operates in variousfrequencies, both downstream and upstream.90 degrees sectored antennas, outdoor unit.
Placed between the indoor unit and the BTR.Performs the switching between the primaryand redundant BTRs. Also, monitors theoperating environment of the BTR.
RSM9116, HTN indoor unit, designed tosupport redundancy switching capabilitiesbetween the microwave equipment and theSDM for the upstream traffic.RSM 9016, HTN, provides redundancyswitching between the SMM and the microwaveequipment for the downstream traffic.HTN unit, induces a defined gain before theRSM to compensate for the losses through themodules.AWM, Indoor Unit, provides a two-wayinterface to the ATM network.SMM, Indoor Unit, HTN, Master Chassis -provides the interface between the digital andmicrowave parts of the system.SDM, Indoor Unit HTN, Slave Chassis -provides the interface between the microwaveand digital parts of the system.CIM, Indoor Chassis, HTN, is the maincomputer board that controls and manages thechassis cards, as well as the redundancyswitching matrix, RSM 9016 and RSM 91 16
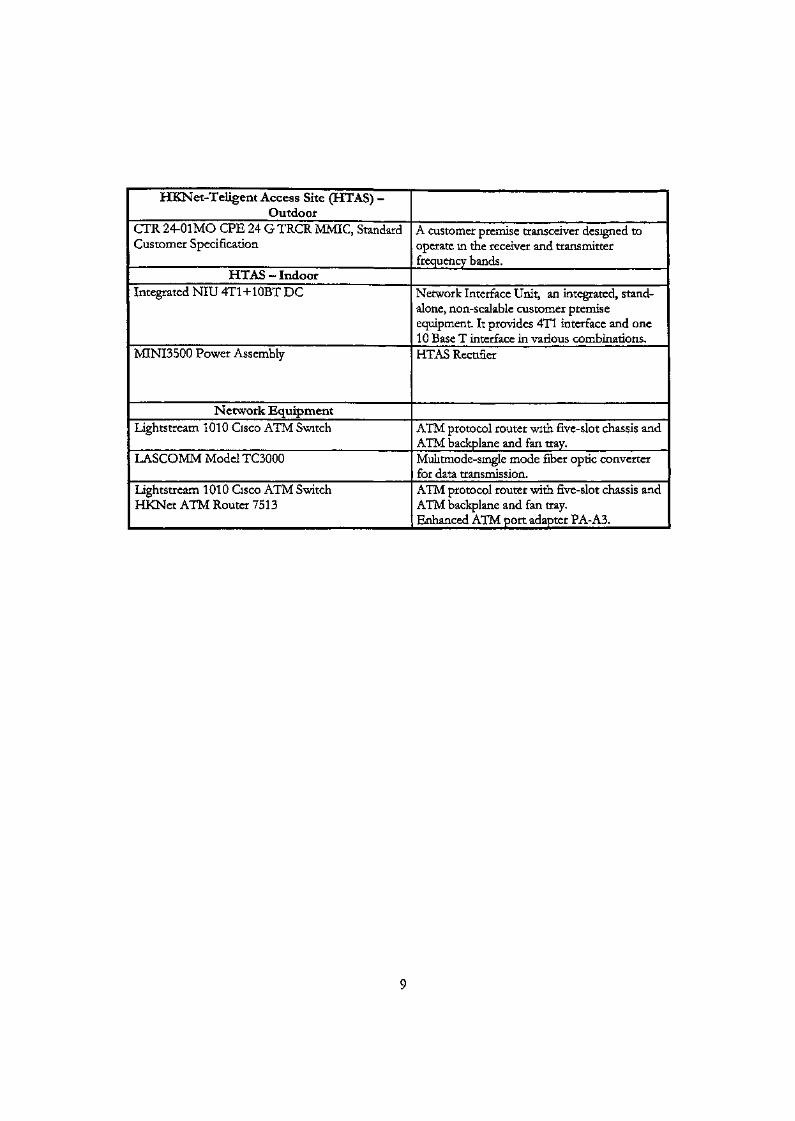
HKNet-Teligent Access Site (HTAS) -Outdoor
CTR 24-01 MO CPE 24 G TRCR MMIC, StandardCustomer Specification
HTAS -IndoorIntegrated NIU 4T1+10BT DC
MINI3500 Power Assembly
Network EquipmentLightstream 1010 Cisco ATM Switch
LASCOMM Model TC3000
Lightstream 1010 Cisco ATM SwitchHKNet ATM Router 7513
A customer premise transceiver designed tooperate in the receiver and transmitterfrequency bands.
Network Interface Unit, an integrated, stand-alone, non-scalable customer premiseequipment. It provides 4T1 interface and one10 Base T interface in various combinations.HTAS Rectifier
ATM protocol router with five- slot chassis andATM backplane and fan tray.Muhtmode-single mode fiber optic converterfor data transmission.ATM protocol router with five-slot chassis andATM backplane and fan tray.Enhanced ATM port adapter PA- A3.
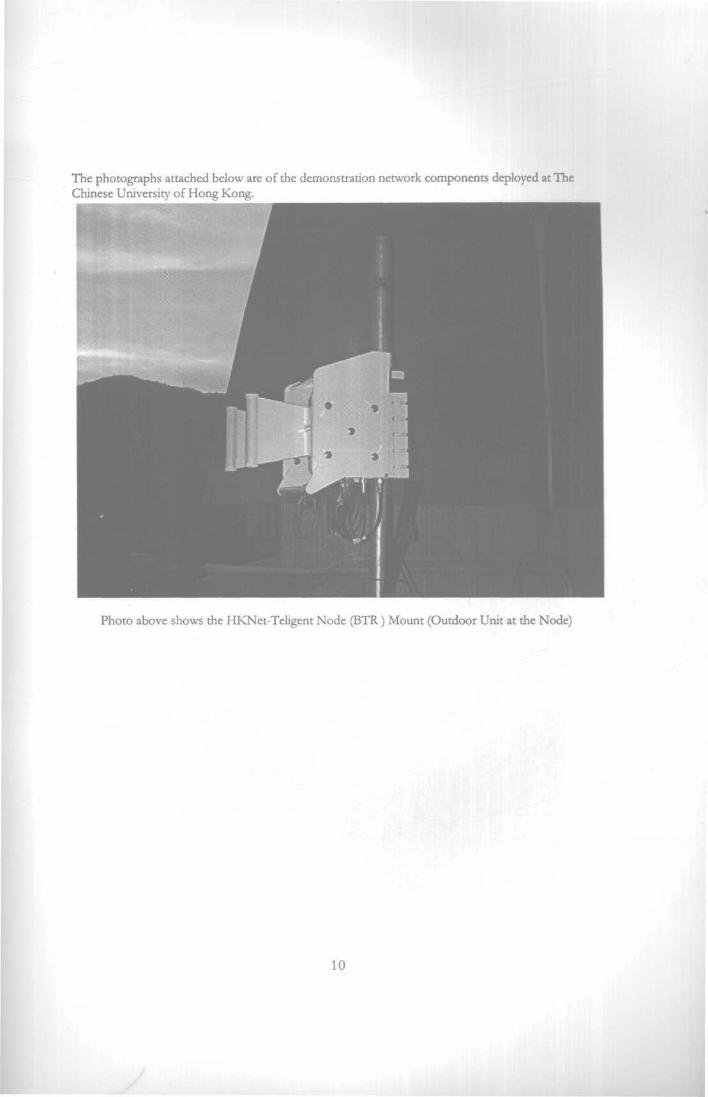
The photographs attached below are of the demonstration network components deployed at TheChinese University of Hong Kong.
Photo above shows the HKNet-Teligent Node (BTR) Mount (Outdoor Unit at the Node)
I
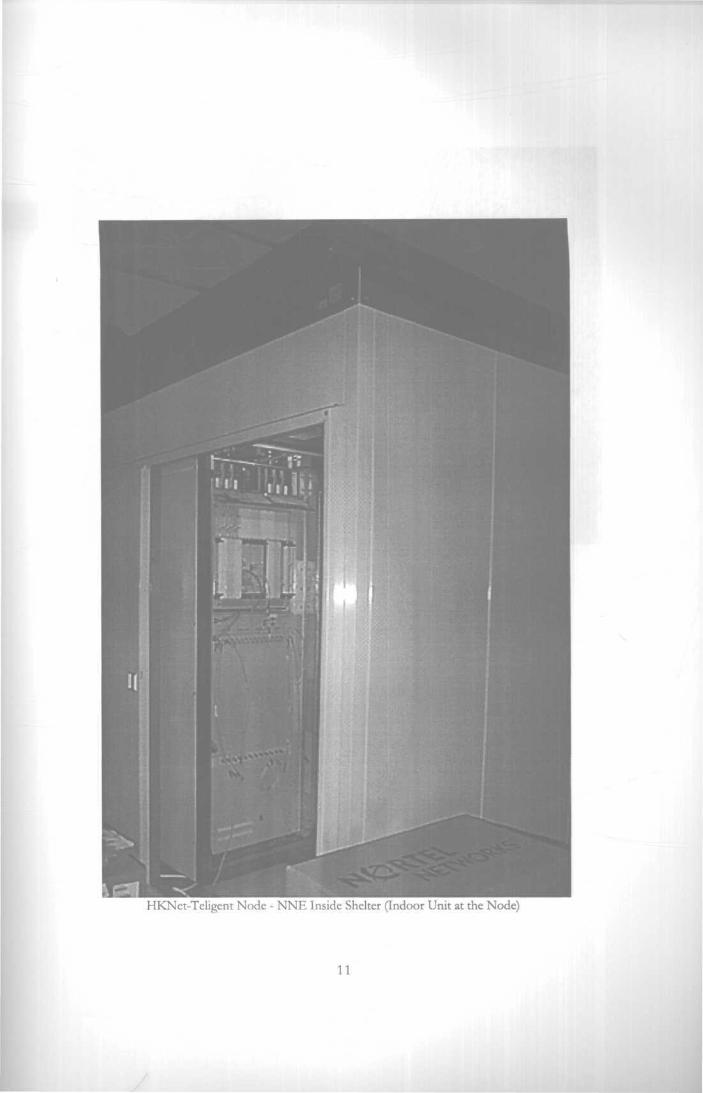
HKNet-Teligent Node - NNE Inside Shelter (Indoor Unit at the Node)
i i
NIU (Customer Premise Equipment, Indoor Units)
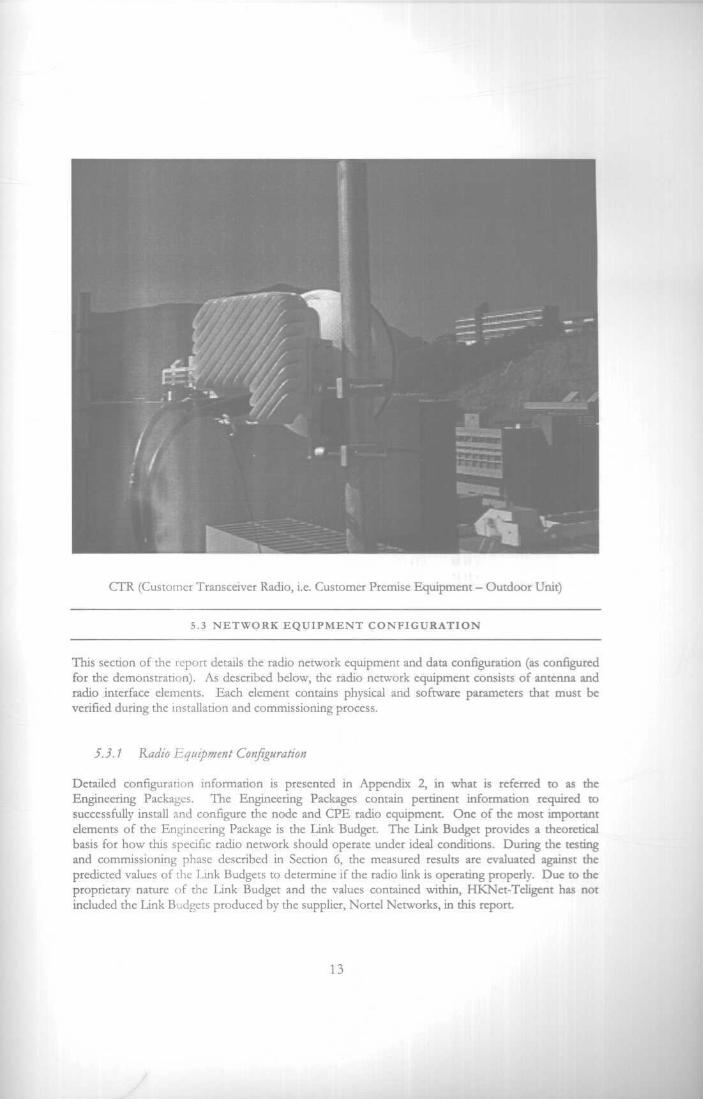
CTR (Customer Transceiver Radio, i.e. Customer Premise Equipment - Outdoor Unit)
5.3 NETWORK EQUIPMENT CONFIGURATION
This section of the report details the radio network equipment and data configuration (as configuredfor the demonstration). As described below, the radio network equipment consists of antenna andradio interface elements. Each element contains physical and software parameters that must beverified during the installation and commissioning process.
5.3.1 Radio Equipment Configuration
Detailed configuration information is presented in Appendix 2, in what is referred to as theEngineering Packages. The Engineering Packages contain pertinent information required tosuccessfully install and configure the node and CPE radio equipment. One of the most importantelements of the Engineering Package is the Link Budget. The Link Budget provides a theoreticalbasis for how this specific radio network should operate under ideal conditions. During the testingand commissioning phase described in Section 6, the measured results are evaluated against thepredicted values of the Link Budgets to determine if the radio link is operating properly. Due to theproprietary nature of the Link Budget and the values contained within, HKNet-Teligent has notincluded the Link Budgets produced by the supplier, Nortel Networks, in this report.
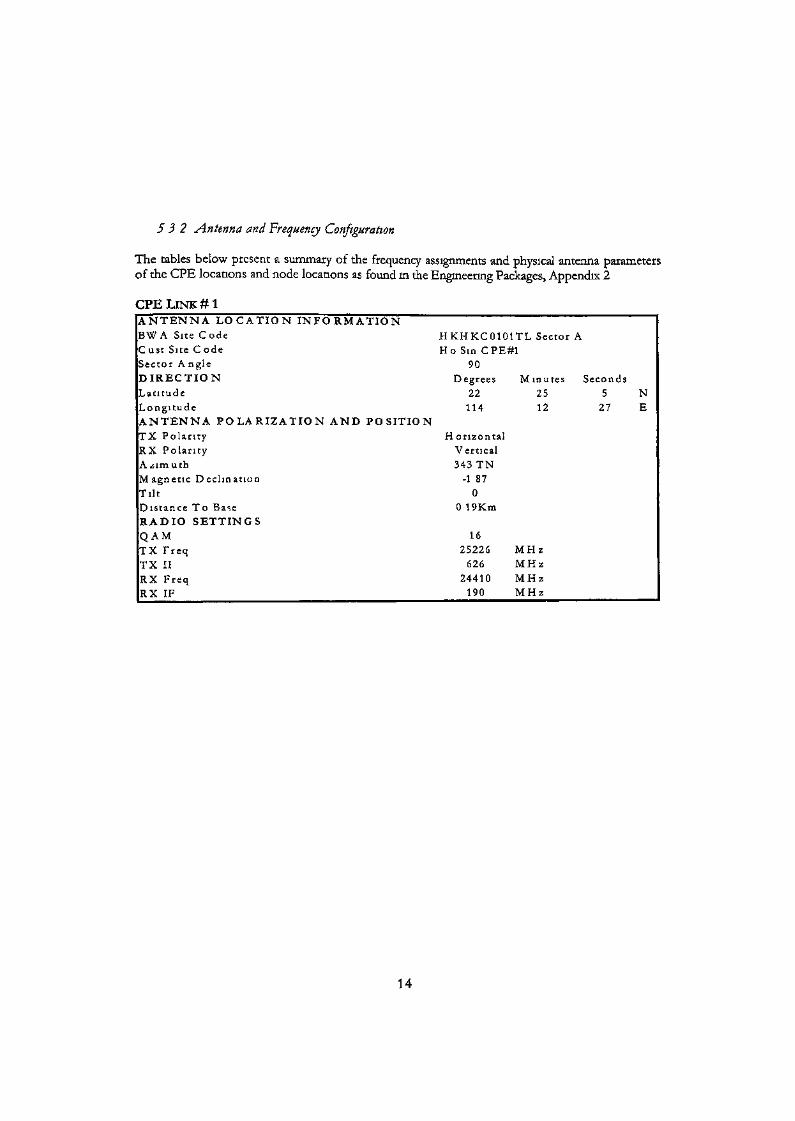
532 Antenna and Frequency Configuration
The tables below present a summary of the frequency assignments and physical antenna parametersof the CPE locations and node locations as found in the Engineering Packages, Appendix 2
CPE LINK #1A N T E N N A L O C A T I O N I N F O R M A T I O NBW A Site C o d e H K H K C 0 1 0 1 T L Sector AC u s t Site C o d e Ho Sin CPE#1Sector A ngle 90
D I R E C T I O N Degrees M i n u t e s SecondsL a t i t u d e 22 25 5 NL o n g i t u d e 114 12 27 EA N T E N N A P O L A R I Z A T I O N A N D P O S I T I O NTX P o l a r i t y H o r i z o n t a lRX P o l a r i t y VerticalA z i m u t h 343 TNMagne t i c D e c l i n a t i o n -1 87Tilt 0Dis tance To Base 0 19KmR A D I O SETTINGSQ A M 16TX Freq 25226 MHzTX II 626 MHzRX Freq 24410 MHzRX IF 190 MHz
14
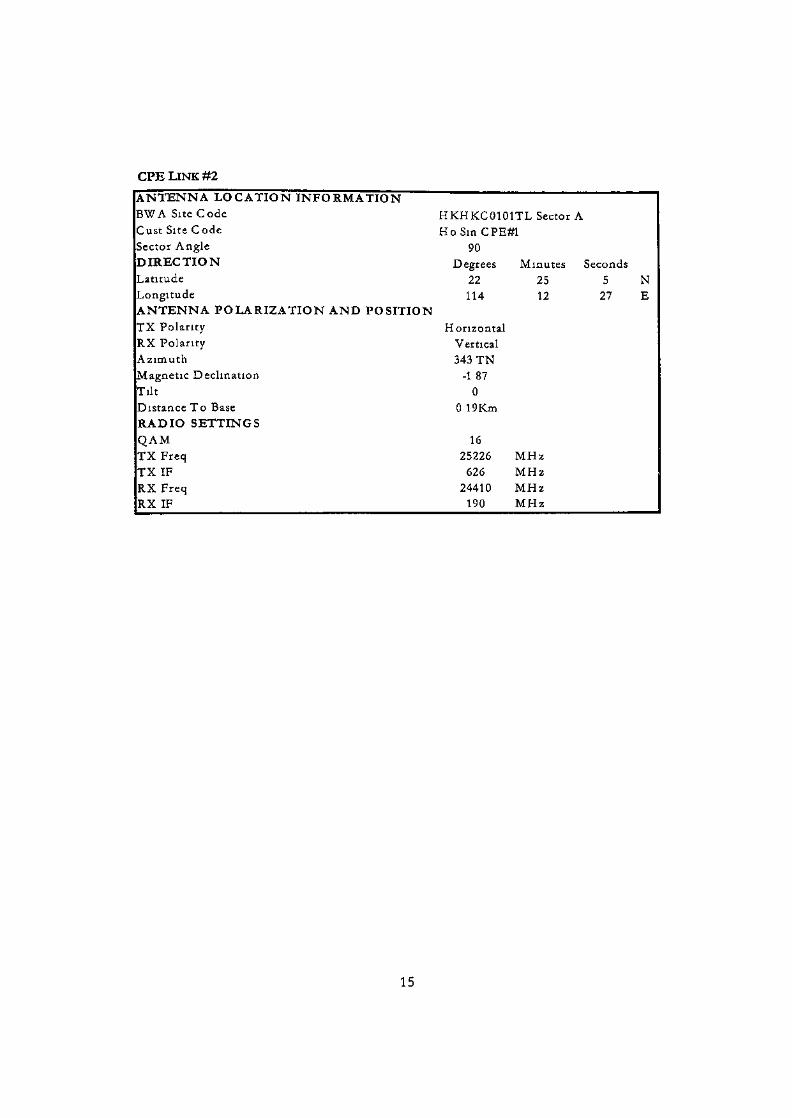
CPE LINK #2ANTENNA LOCATION INFORMATIONBWA Site Code HKHKC0101TL Sector ACust Site Code Ho Sin CPE#1Sector Angle 90DIRECTION Degrees Minutes SecondsLatitude 22 25 5 NLongitude 114 12 27 EANTENNA POLARIZATION AND POSITIONTX Polari ty HorizontalRX Polarity VerticalAz imuth 343 TNMagnetic Declination -1 87Tilt 0Distance To Base 0 19KmRADIO SETTINGSQAM 16TX Freq 25226 MHzTX IF 626 MHzRX Freq 24410 MHzRX IF 190 MHz
15
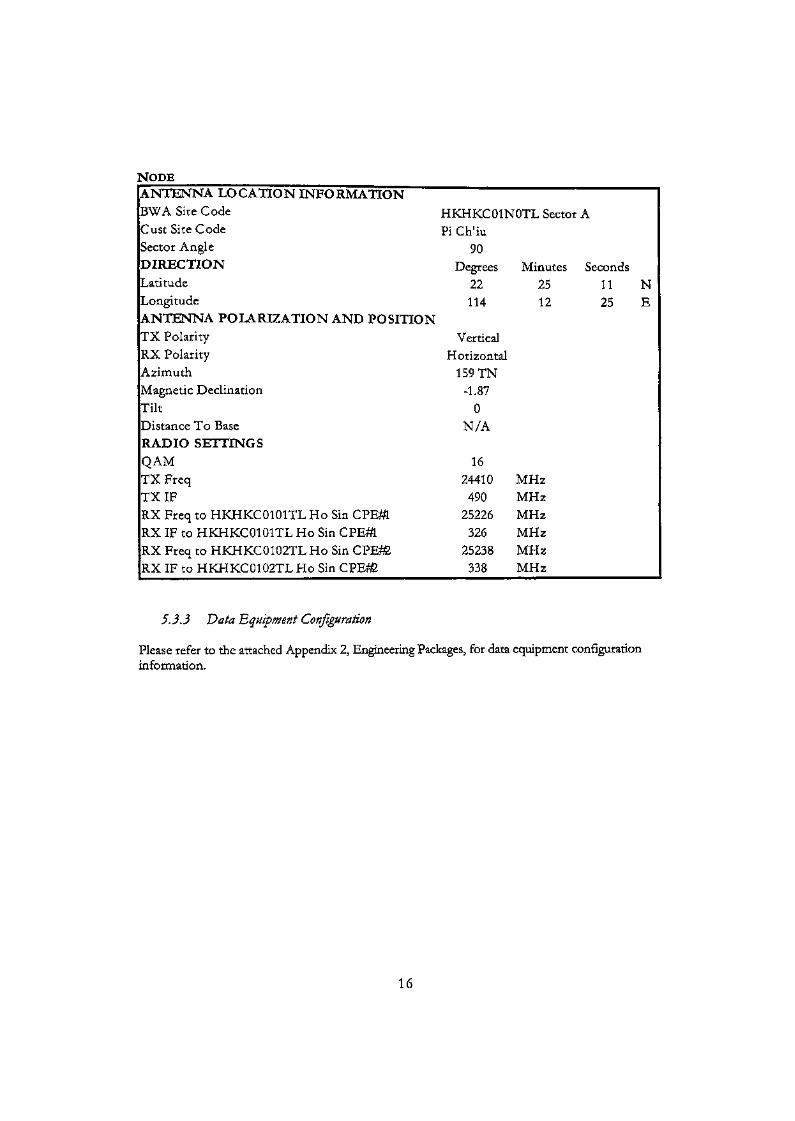
NODEANTENNA LOCATION INFORMATIONBWA Site CodeGust Site CodeSector AngleDIRECTIONLatitudeLongitudeANTENNA POLARIZATION AND POSITIONTX PolarityRX PolarityAzimuthMagnetic DeclinationTiltDistance To BaseRADIO SETTINGSQAMTX FreqTXIFRX Freq to HKHKC0101TL Ho Sin CPEttRX IF to HKHKC0101TL Ho Sin CPE*RX Freq to HKHKC0102TL Ho Sin CPEffiRX IF to HKHKC0102TL Ho Sin CPE&2
HKHKC01NOTL Sector APi Ch'iu
90Degrees
22114
VerticalHorizontal
159TN-1.87
0N/A
1624410490
25226326
25238338
Minutes Seconds25 11 N12 25 E
MHzMHzMHzMHzMHzMHz
533 Data Equipment Configuration
Please refer to the attached Appendix 2, Engineering Packages, for data equipment configurationinformation.
16
6 TESTS AND TEST RESULTS
The following section provides details on the test methodology and procedures. Test results are alsosummarized. Detailed test data is available for each test in Section 10 - Appendices.
6.1 TESTS
HKNet-Tekgent conducted a series of tests to demonstrate the:
« Throughput (data rate) capability of the RF link for broadband Internet applications; and« Robustness of the RF link through Bit Error Rate (BER) testing.
The first set of tests involved a standard Nortel Acceptance Test Plan (ATP) to ensure properperformance and connectivity of each network element. The standard Nortel ATP tests (hereafterknown as RF tests) focused on verifying different RF parameters that will be used by HKNet-Teligent Co. Ltd., during the commercial rollout of its network assuming spectrum is awarded. Thesecond set of tests demonstrated broadband Internet applications on the demonstration network.The broadband test focused on testing basic end-user functionality that would be available tocommercial users once a complete network is commissioned
6.2 RF TESTS
The following section details the various RF tests required to commission a radio link as well asverify the quality of the radio network. Each test section begins with a short description of the testfollowed by the detailed test procedures, an analysis of the results and concludes with a commentsection. The actual test data is included in the Appendices section of this report. The RF testsconducted were:
• Link Budget Validation for the Downstream• Link Budget Validation for the Upstream• Fade Margin (Downstream)« Fade Margin (Upstream)• Bit Error Rate Test (BERT)• Network Node Equipment (NNE) Pinging Process• Network Interface Unit (NIU) Pinging Process
6.2.1 Link "budget Validation for the Downstream
Test Description
This test validates the operational parameters used in the initial Link Budget in the downstreamdirection and verifies that the system is operating as designed. Measurements include received signallevel (RSL), Fade Margin, Transmit (TX) Power, etc. Actual measurement points and measurementresults are shown in the Section 10 - Appendices further below.
17
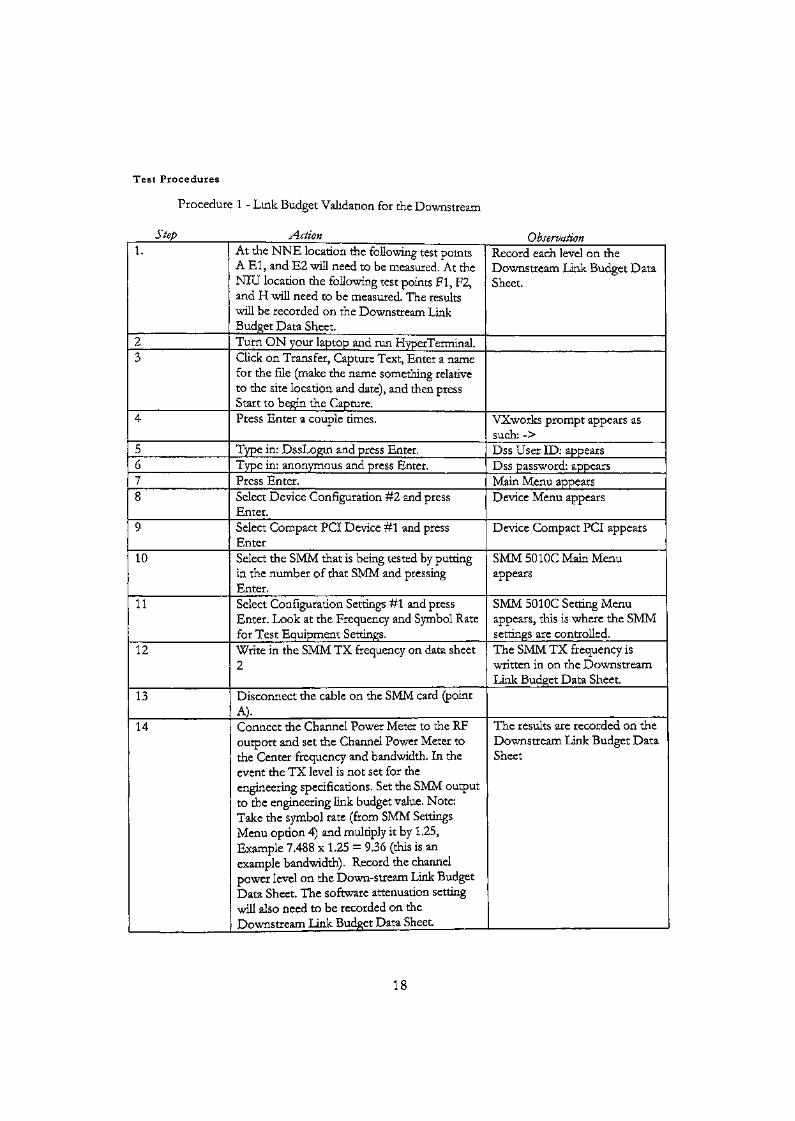
Test Procedures
Procedure 1 - Link Budget Validation for the Downstream
Step Action Observation1.
23
4
5678
9
10
11
12
13
14
At the NNE location the following test pointsA El, and E2 will need to be measured. At theNIU location the following test points Fl, F2,and H will need to be measured. The resultswill be recorded on the Downstream LinkBudget Data Sheet.Turn ON your laptop and run HyperTerminal.Click on Transfer, Capture Text, Enter a namefor the file (make the name something relativeto the site location and date), and then pressStart to begin the Capture.Press Enter a couple times.
Type in: DssLogin and press Enter.Type in: anonymous and press Enter.Press Enter.Select Device Configuration #2 and pressEnter.Select Compact PCI Device #1 and pressEnterSelect the SMM that is being tested by puttingin the number of that SMM and pressingEnter.Select Configuration Settings #1 and pressEnter. Look at the Frequency and Symbol Ratefor Test Equipment Settings.Write in the SMM TX frequency on data sheet2
Disconnect the cable on the SMM card (pointA).Connect the Channel Power Meter to the RFoutport and set the Channel Power Meter tothe Center frequency and bandwidth. In theevent the TX level is not set for theengineering specifications. Set the SMM outputto the engineering link budget value. Note:Take the symbol rate (from SMM SettingsMenu option 4) and multiply it by 1.25,Example 7.488 x 1.25 = 9.36 (this is anexample bandwidth). Record the channelpower level on the Down-stream Link BudgetData Sheet. The software attenuation settingwill also need to be recorded on theDownstream Link Budget Data Sheet
Record each level on theDownstream Link Budget DataSheet.
VXworks prompt appears assuch: ->Dss User ID: appearsDss password: appearsMain Menu appearsDevice Menu appears
Device Compact PCI appears
SMM 50 IOC Main Menuappears
SMM 5010C Setting Menuappears, this is where the SMMsettings are controlled.The SMM TX frequency iswritten in on the DownstreamLink Budget Data Sheet.
The results are recorded on theDownstream Link Budget DataSheet
18
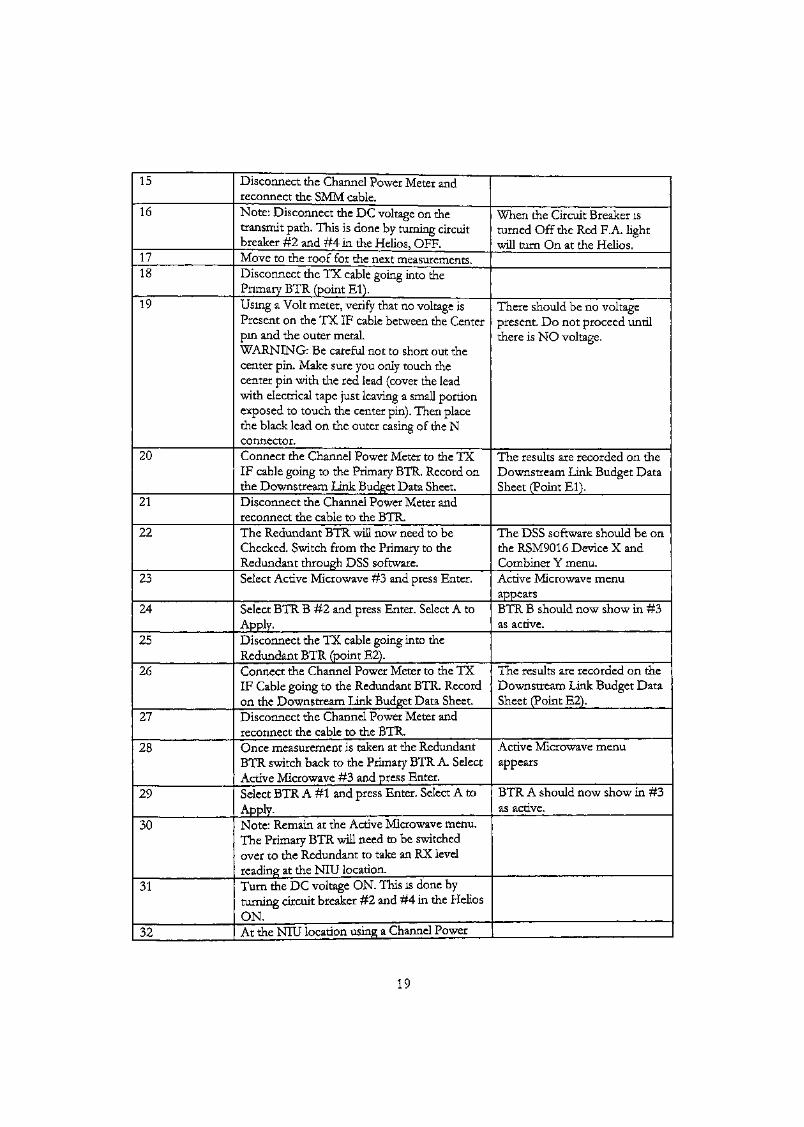
15
16
1718
19
20
21
22
23
24
25
26
27
28
29
30
31
32
Disconnect the Channel Power Meter andreconnect the SMM cable.Note: Disconnect the DC voltage on thetransmit path. This is done by turning circuitbreaker #2 and #4 in the Helios, OFF.Move to the roof for the next measurements.Disconnect the TX cable going into thePrimary BTR (point El).Using a Volt meter, verify that no voltage isPresent on the TX IF cable between the Centerpin and the outer metal.WARNING: Be careful not to short out thecenter pin. Make sure you only touch thecenter pin with the red lead (cover the leadwith electrical tape just leaving a small portionexposed to touch the center pin). Then placethe black lead on the outer casing of the Nconnector.Connect the Channel Power Meter to the TXIF cable going to the Primary BTR. Record onthe Downstream Link Budget Data Sheet.Disconnect the Channel Power Meter andreconnect the cable to the BTR.The Redundant BTR will now need to beChecked. Switch from the Primary to theRedundant through DSS software.Select Active Microwave #3 and press Enter.
Select BTR B #2 and press Enter. Select A toApply.Disconnect the TX cable going into theRedundant BTR (point E2).Connect the Channel Power Meter to the TXIF Cable going to the Redundant BTR. Recordon the Downstream Link Budget Data Sheet.Disconnect the Channel Power Meter andreconnect the cable to the BTR.Once measurement is taken at the RedundantBTR switch back to the Primary BTR A. SelectActive Microwave #3 and press Enter.Select BTR A #1 and press Enter. Select A toApply.Note: Remain at the Active Microwave menu.The Primary BTR will need to be switchedover to the Redundant to take an RX levelreading at the NIU location.Turn the DC voltage ON. This is done byturning ckcuit breaker #2 and #4 in the HeliosON.At the NIU location using a Channel Power
When the Circuit Breaker isturned Off the Red F.A. lightwill turn On at the Helios.
There should be no voltagepresent. Do not proceed untilthere is NO voltage.
The results are recorded on theDownstream Link Budget DataSheet (Point El).
The DSS software should be onthe RSM9016 Device X andCombiner Y menu.Active Microwave menuappearsBTR B should now show in #3as active.
The results are recorded on theDownstream Link Budget DataSheet (Point E2).
Active Microwave menuappears
BTR A should now show in #3as active.
19
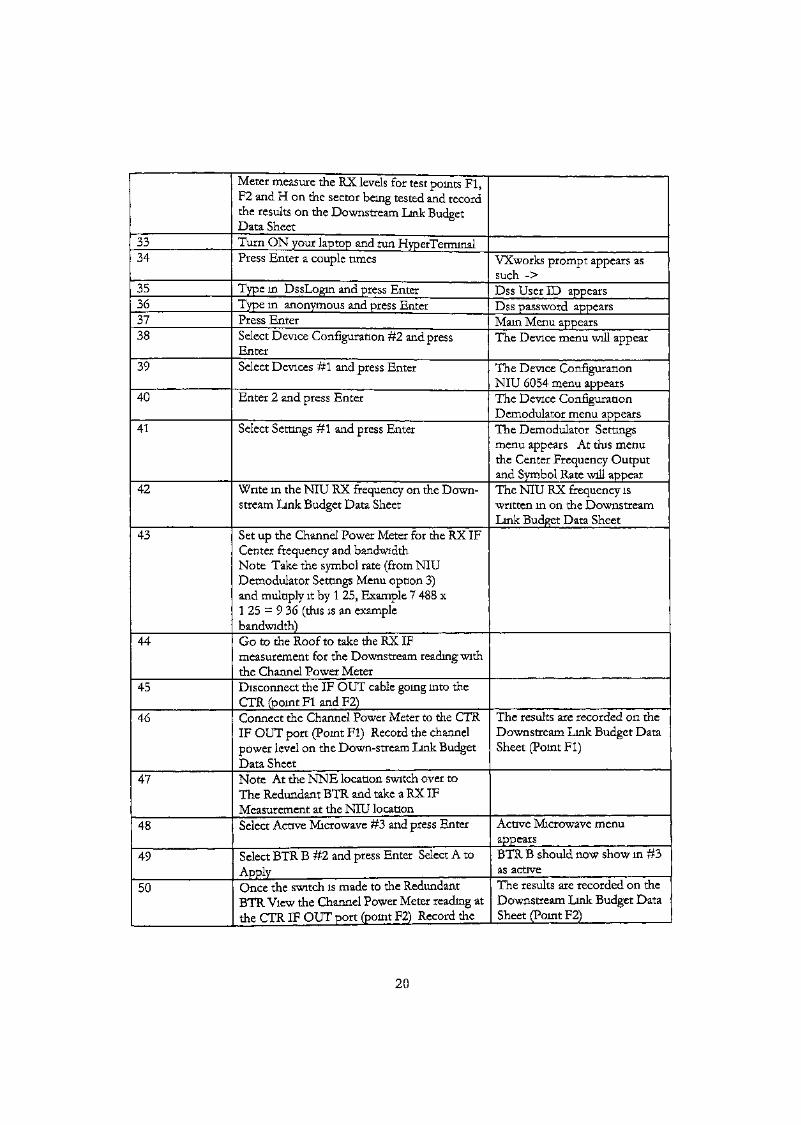
3334
35363738
39
40
41
42
43
44
45
46
47
48
49
50
Meter measure the RX levels for test points Fl,F2 and H on the sector being tested and recordthe results on the Downstream Link BudgetData SheetTurn ON your laptop and run HyperTerrmnalPress Enter a couple times
Type in DssLogin and press EnterType in anonymous and press EnterPress EnterSelect Device Configuration #2 and pressEnterSelect Devices #1 and press Enter
Enter 2 and press Enter
Select Settings #1 and press Enter
Write in the NIU RX frequency on the Down-stream Link Budget Data Sheet
Set up the Channel Power Meter for the RX IFCenter frequency and bandwidthNote Take the symbol rate (from NIUDemodulator Settings Menu option 3)and multiply it by 1 25, Example 7 488 x1 25 = 9 36 (this is an examplebandwidth)Go to the Roof to take the RX IFmeasurement for the Downstream reading withthe Channel Power MeterDisconnect the IF OUT cable going into theCTR (point Fl and F2)Connect the Channel Power Meter to the CTRIF OUT port (Point Fl) Record the channelpower level on the Down-stream Link BudgetData SheetNote At the NNE location switch over toThe Redundant BTR and take a RX IFMeasurement at the NIU locationSelect Active Microwave #3 and press Enter
Select BTR B #2 and press Enter Select A toApplyOnce the switch is made to the RedundantBTR View the Channel Power Meter reading atthe CTR IF OUT port (point F2) Record the
VXworks prompt appears assuch ->Dss User ID appearsDss password appearsMain Menu appearsThe Device menu will appear
The Device ConfigurationNIU 6054 menu appearsThe Device ConfigurationDemodulator menu appearsThe Demodulator Settingsmenu appears At this menuthe Center Frequency Outputand Symbol Rate will appearThe NIU RX frequency iswritten in on the DownstreamLink Budget Data Sheet
The results are recorded on theDownstream Link Budget DataSheet (Point Fl)
Active Microwave menuappearsBTR B should now show in #3as activeThe results are recorded on theDownstream Link Budget DataSheet (Point F2)
20
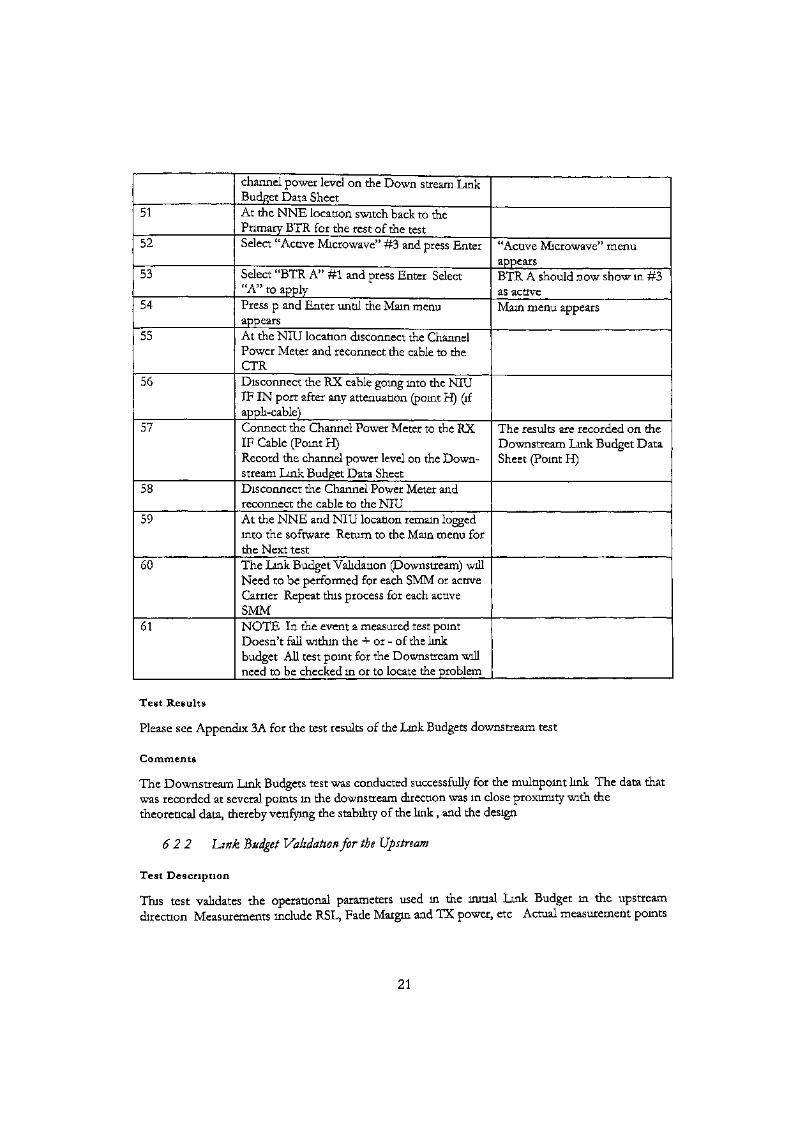
51
52
53
54
55
56
57
58
59
60
61
channel power level on the Down stream LinkBudget Data SheetAt the NNE location switch back to thePrimary BTR for the rest of the testSelect "Active Microwave" #3 and press Enter
Select "BTR A" #1 and press Enter Select"A" to applyPress p and Enter until the Main menuappearsAt the NIU location disconnect the ChannelPower Meter and reconnect the cable to theCTRDisconnect the RX cable going into the NIUIF IN port after any attenuation (point H) (ifappli-cable)Connect the Channel Power Meter to the RXIF Cable (Point H)Record the channel power level on the Down-stream Link Budget Data SheetDisconnect the Channel Power Meter andreconnect the cable to the NIUAt the NNE and NIU location remain loggedinto the software Return to the Main menu forthe Next testThe Link Budget Validation (Downstream) willNeed to be performed for each SMM or activeCarrier Repeat this process for each activeSMMNOTE In the event a measured test pointDoesn't fall within the + or - of the linkbudget All test point for the Downstream willneed to be checked in or to locate the problem
"Active Microwave" menuappearsBTR A should now show in #3as activeMain menu appears
The results are recorded on theDownstream Link Budget DataSheet (Point H)
Test Results
Please see Appendix 3A for the test results of the Link Budgets downstream test
Comments
The Downstream Link Budgets test was conducted successfully for the multipoint link The data thatwas recorded at several points in the downstream direction was in close proximity with thetheoretical data, thereby verifying the stability of the link, and the design
622 Lznlk Budget Validation for the Upstream
Test Description
This test validates the operational parameters used in the initial Link Budget in the upstreamdirection Measurements include RSL, Fade Margin and TX power, etc Actual measurement points
21
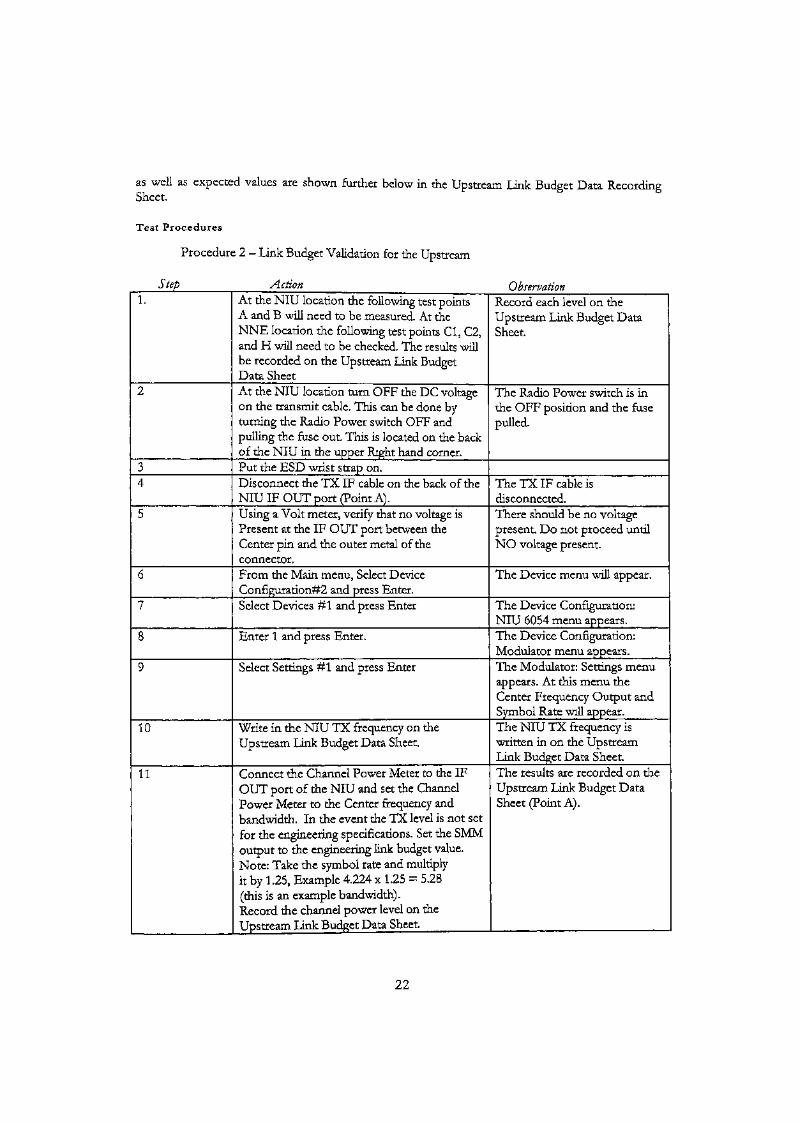
as well as expected values are shown further below in the Upstream Link Budget Data RecordingSheet.
Test Procedures
Procedure 2 - Link Budget Validation for the Upstream
Step Action Observation1.
2
34
5
6
7
8
9
10
11
At the NIU location the following test pointsA and B will need to be measured. At theNNE location the following test points Cl, C2,and H will need to be checked. The results willbe recorded on the Upstream Link BudgetData SheetAt the NIU location turn OFF the DC voltageon the transmit cable. This can be done byturning the Radio Power switch OFF andpulling the fuse out. This is located on the backof the NIU in the upper Right hand corner.Put the BSD wrist strap on.Disconnect the TX IF cable on the back of theNIU IF OUT port (Point A).Using a Volt meter, verify that no voltage isPresent at the IF OUT port between theCenter pin and the outer metal of theconnector.From the Main menu, Select DeviceConfiguration#2 and press Enter.Select Devices #1 and press Enter
Enter 1 and press Enter.
Select Settings #1 and press Enter
Write in the NIU TX frequency on theUpstream Link Budget Data Sheet.
Connect the Channel Power Meter to the IFOUT port of the NIU and set the ChannelPower Meter to the Center frequency andbandwidth. In the event the TX level is not setfor the engineering specifications. Set the SMMoutput to the engineering link budget value.Note: Take the symbol rate and multiplyit by 1.25, Example 4.224 x 1.25 = 5.28(this is an example bandwidth).Record the channel power level on theUpstream Link Budget Data Sheet.
Record each level on theUpstream Link Budget DataSheet.
The Radio Power switch is inthe OFF position and the fusepulled.
The TX IF cable isdisconnected.There should be no voltagepresent. Do not proceed untilNO voltage present.
The Device menu will appear.
The Device Configuration:NIU 6054 menu appears.The Device Configuration:Modulator menu appears.The Modulator: Settings menuappears. At this menu theCenter Frequency Output andSymbol Rate will appear.The NIU TX frequency iswritten in on the UpstreamLink Budget Data Sheet.The results are recorded on theUpstream Link Budget DataSheet (Point A).
22
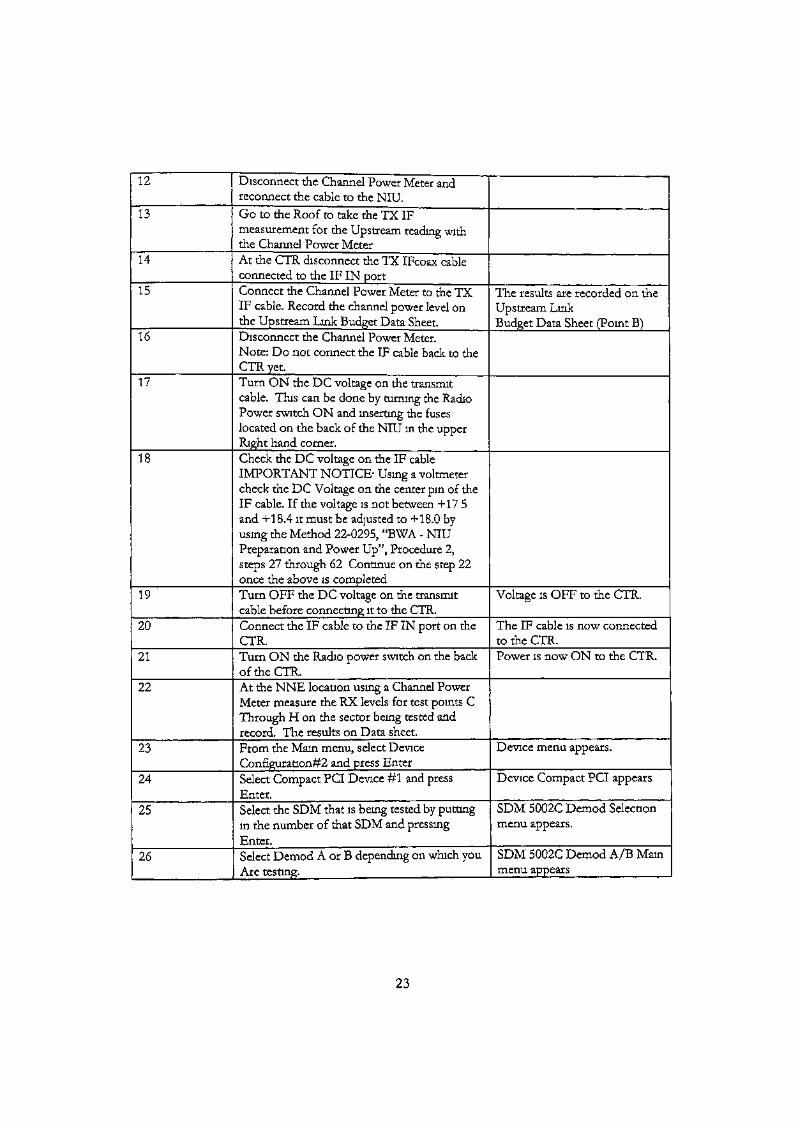
12
13
14
15
16
17
18
19
20
21
22
23
24
25
26
Disconnect the Channel Power Meter andreconnect the cable to the NIU.Go to the Roof to take the TX IFmeasurement for the Upstream reading withthe Channel Power MeterAt the CTR disconnect the TX IFcoax cableconnected to the IF IN portConnect the Channel Power Meter to the TXIF cable. Record the channel power level onthe Upstream Link Budget Data Sheet.Disconnect the Channel Power Meter.Note: Do not connect the IF cable back to theCTR yet.Turn ON the DC voltage on the transmitcable. This can be done by turning the RadioPower switch ON and inserting the fuseslocated on the back of the NIU in the upperRight hand corner.Check the DC voltage on the IF cableIMPORTANT NOTICE- Using a voltmetercheck the DC Voltage on the center pin of theIF cable. If the voltage is not between +175and +18.4 it must be adjusted to +18.0 byusing the Method 22-0295, "BWA - NIUPreparation and Power Up", Procedure 2,steps 27 through 62 Continue on the step 22once the above is completedTurn OFF the DC voltage on the transmitcable before connecting it to the CTR.Connect the IF cable to the IF IN port on theCTR.Turn ON the Radio power switch on the backof the CTR.At the NNE location using a Channel PowerMeter measure the RX levels for test points CThrough H on the sector being tested andrecord. The results on Data sheet.From the Mam menu, select DeviceConfiguration#2 and press EnterSelect Compact PCI Device #1 and pressEnter.Select the SDM that is being tested by puttingin the number of that SDM and pressingEnter.Select Demod A or B depending on which youAre testing.
The results are recorded on theUpstream LinkBudget Data Sheet (Point B)
Voltage is OFF to the CTR.
The IF cable is now connectedto the CTR.Power is now ON to the CTR.
Device menu appears.
Device Compact PCI appears
SDM 5002C Demod Selectionmenu appears.
SDM 5002C Demod A/B Mainmenu appears
23
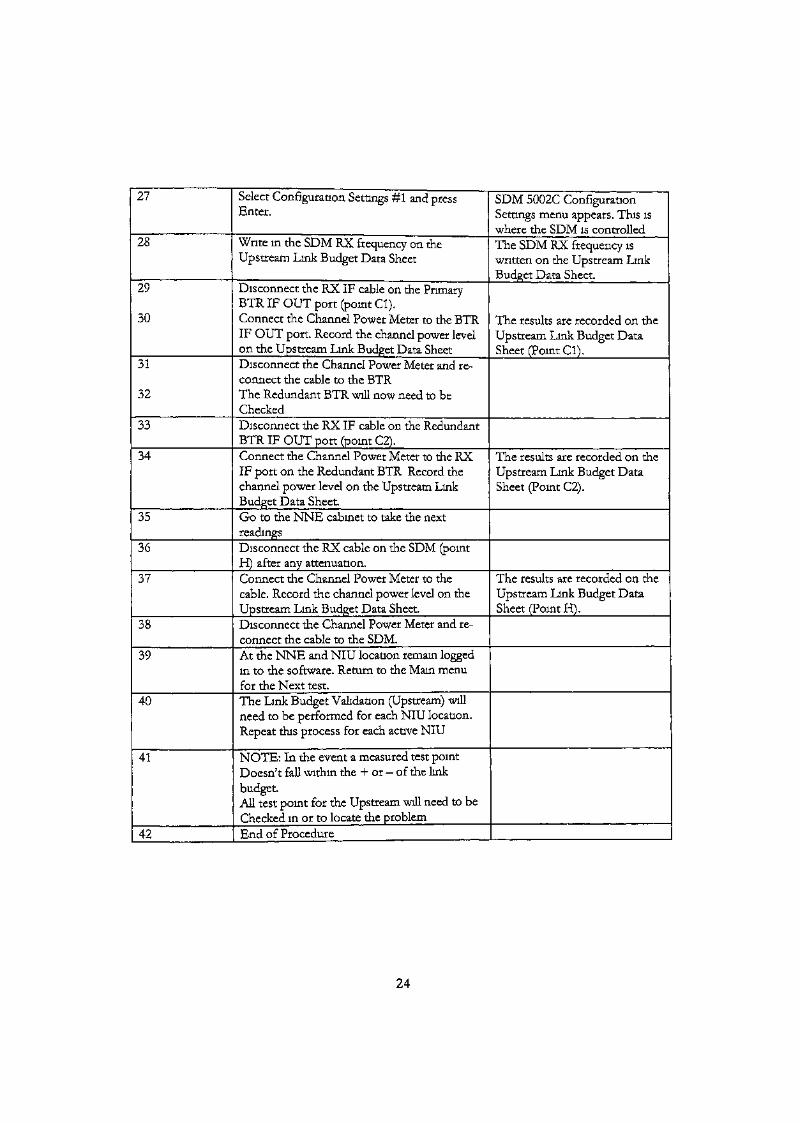
27
28
29
30
31
32
33
34
35
36
37
38
39
40
41
42
Select Configuration Settings #1 and pressEnter.
Write in the SDM RX frequency on theUpstream Link Budget Data Sheet
Disconnect the RX IF cable on the PrimaryBTR IF OUT port (point Cl).Connect the Channel Power Meter to the BTRIF OUT port. Record the channel power levelon the Upstream Link Budget Data SheetDisconnect the Channel Power Meter and re-connect the cable to the BTRThe Redundant BTR will now need to beCheckedDisconnect the RX IF cable on the RedundantBTR IF OUT port (point C2).Connect the Channel Power Meter to the RXIF port on the Redundant BTR Record thechannel power level on the Upstream LinkBudget Data Sheet.Go to the NNE cabinet to take the nextreadingsDisconnect the RX cable on the SDM (pointH) after any attenuation.Connect the Channel Power Meter to thecable. Record the channel power level on theUpstream Link Budget Data Sheet.Disconnect the Channel Power Meter and re-connect the cable to the SDM.At the NNE and NIU location remain loggedin to the software. Return to the Main menufor the Next test.The Link Budget Validation (Upstream) willneed to be performed for each NIU location.Repeat this process for each active NIU
NOTE: In the event a measured test pointDoesn't fall within the + or - of the linkbudget.All test point for the Upstream will need to beChecked in or to locate the problemEnd of Procedure
SDM 5002C ConfigurationSettings menu appears. This iswhere the SDM is controlledThe SDM RX frequency iswritten on the Upstream LinkBudget Data Sheet.
The results are recorded on theUpstream Link Budget DataSheet (Point Cl).
The results are recorded on theUpstream Link Budget DataSheet (Point C2).
The results are recorded on theUpstream Link Budget DataSheet (Point H).
24
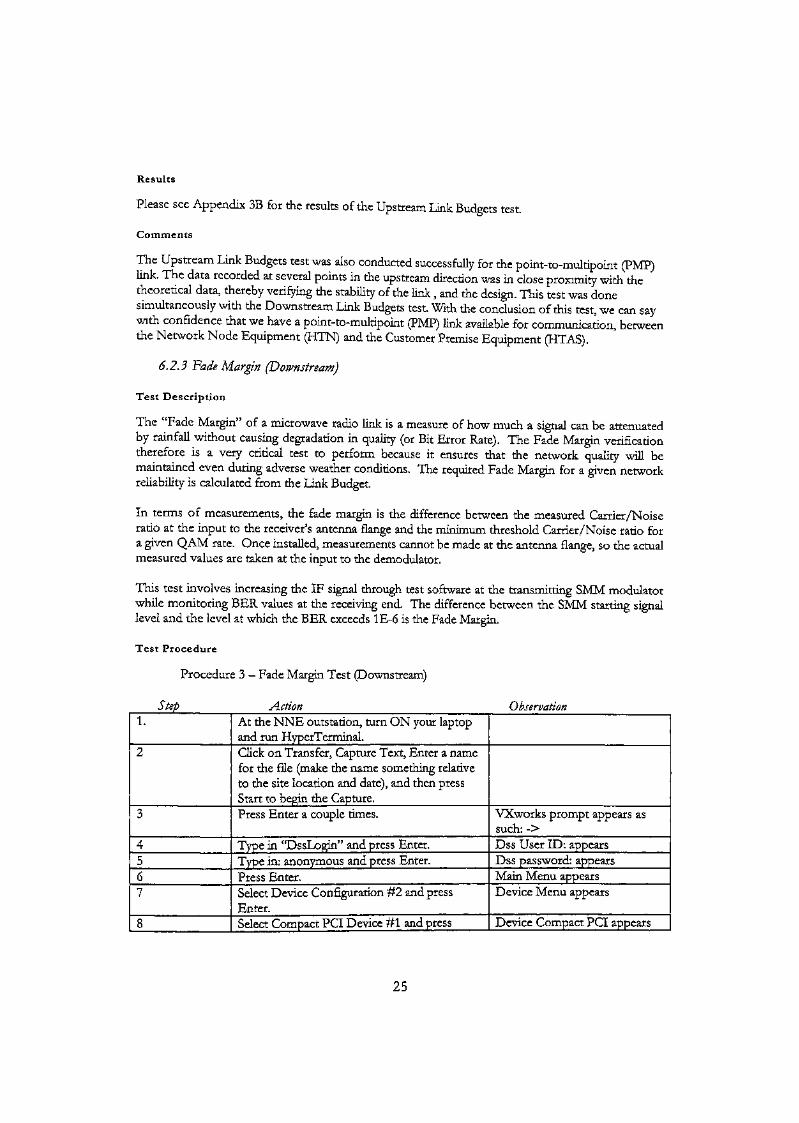
Results
Please see Appendix 3B for the results of the Upstream Link Budgets test
Comments
The Upstream Link Budgets test was also conducted successfully for the point-to-multipoint (PMP)link. The data recorded at several points in the upstream direction was in close proximity with thetheoretical data, thereby verifying the stability of the link, and the design. This test was donesimultaneously with the Downstream Link Budgets test. With the conclusion of this test, we can saywith confidence that we have a point-to-multipoint (PMP) link available for communication, betweenthe Network Node Equipment (HTN) and the Customer Premise Equipment (HTAS).
6.2.3 Fade Margin (Downstream)
Test Description
The "Fade Margin" of a microwave radio link is a measure of how much a signal can be attenuatedby rainfall without causing degradation in quality (or Bit Error Rate). The Fade Margin verificationtherefore is a very critical test to perform because it ensures that the network quality will bemaintained even during adverse weather conditions. The required Fade Margin for a given networkreliability is calculated from the link Budget.
In terms of measurements, the fade margin is the difference between the measured Carrier/Noiseratio at the input to the receiver's antenna flange and the minimum threshold Carrier/Noise ratio fora given QAM rate. Once installed, measurements cannot be made at the antenna flange, so the actualmeasured values are taken at the input to the demodulator.
This test involves increasing the IF signal through test software at the transmitting SMM modulatorwhile monitoring BER values at the receiving end. The difference between the SMM starting signallevel and the level at which the BER exceeds 1E-6 is the Fade Margin.
Test Procedure
Procedure 3 - Fade Margin Test (Downstream)
Step Action ObservationI.
2
3
4567
8
At the NNE outstation, turn ON your laptopand run HyperTerminal.Click on Transfer, Capture Text, Enter a namefor the file (make the name something relativeto the site location and date), and then pressStart to begin the Capture.Press Enter a couple times.
Type in "DssLogin" and press Enter.Type in: anonymous and press Enter.Press Enter.Select Device Configuration #2 and pressEnter.Select Compact PCI Device #1 and press
VXworks prompt appears assuch: ->Dss User ID: appearsDss password: appearsMain Menu appearsDevice Menu appears
Device Compact PCI appears
25
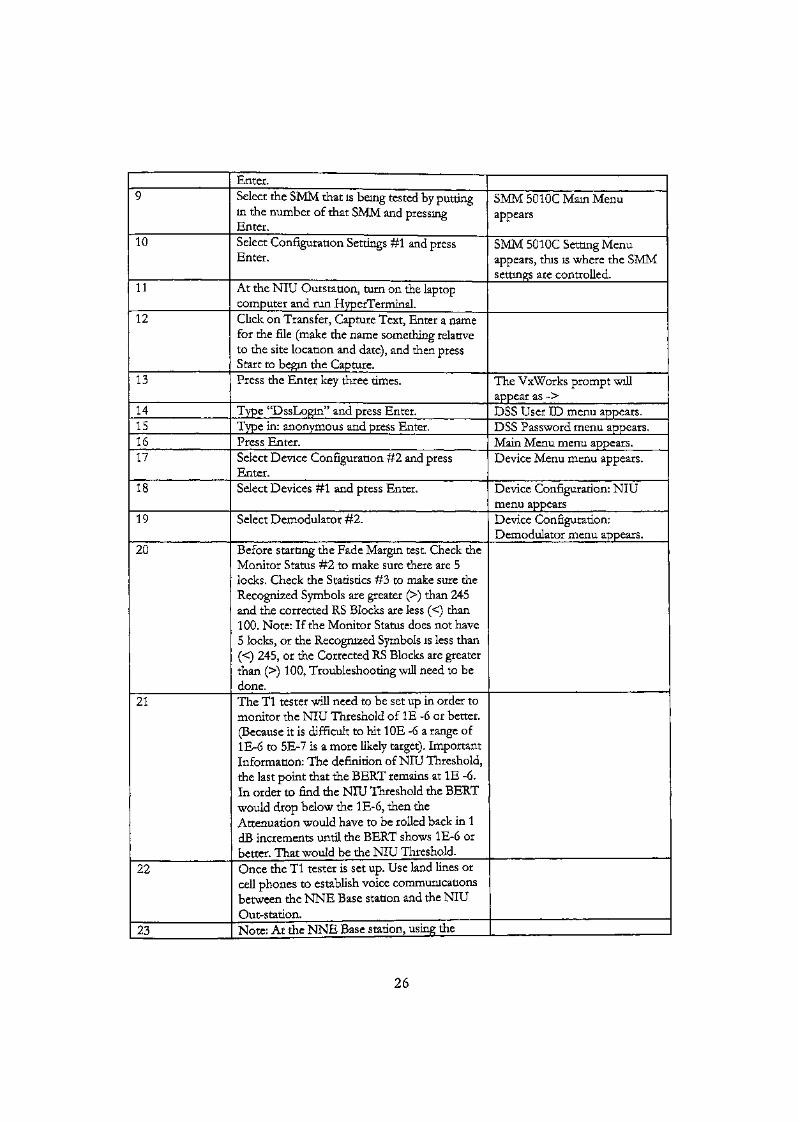
9
10
11
12
13
14151617
18
19
20
21
22
23
Enter.Select the SMM that is being tested by puttingin the number of that SMM and pressingEnter.Select Configuration Settings #1 and pressEnter.
At the NIU Outstatton, turn on the laptopcomputer and run HyperTerminal.Click on Transfer, Capture Text, Enter a namefor the file (make the name something relativeto the site location and date), and then pressStart to begin the Capture.Press the Enter key three times.
Type "DssLogin" and press Enter.Type in: anonymous and press Enter.Press Enter.Select Device Configuration #2 and pressEnter.Select Devices #1 and press Enter,
Select Demodulator #2.
Before starting the Fade Margin test. Check theMonitor Status #2 to make sure there are 5locks. Check the Statistics #3 to make sure theRecognized Symbols are greater (>) than 245and the corrected RS Blocks are less (<) than100. Note: If the Monitor Status does not have5 locks, or the Recognized Symbols is less than(<) 245, or the Corrected RS Blocks are greaterthan (>) 100, Troubleshooting will need to bedone.The Tl tester will need to be set up in order tomonitor the NIU Threshold of IE -6 or better.(Because it is difficult to hit 10E -6 a range of1E-6 to 5E-7 is a more likely target). ImportantInformation: The definition of NIU Threshold,the last point that the BERT remains at IE -6.In order to find the NIU Threshold the BERTwould drop below the 1E-6, then theAttenuation would have to be rolled back in 1dB increments until the BERT shows 1E-6 orbetter. That would be the NIU Threshold.Once the Tl tester is set up. Use land lines orcell phones to establish voice communicationsbetween the NNE Base station and the NIUOut-station.Note: At the NNE Base station, using the
SMM 501 OC Main Menuappears
SMM 5010C Setting Menuappears, this is where the SMMsettings are controlled.
The VxWorks prompt willappear as ->DSS User ID menu appears.DSS Password menu appears.Main Menu menu appears.Device Menu menu appears.
Device Configuration: NIUmenu appearsDevice Configuration:Demodulator menu appears.
26

Link Budget Tool Data Sheet 6 look tosee what the value of the calculated NIUThreshold and calculated NIU RX Inputis. Take the calculated NIU Thresholdvalue (-54.4 dB) and subtract thecalculated NIU RX Input value (-38.2dB). Example: (54.4 - 38.2 = 16.2 dB ofexpected NIU Fade Margin).
24 At the NNE location in order to save sometime use the following Example: If you arelooking for 16.2 dB of Fade Margin. Add a 10dB hardware attenuator to the currentattenuation on the SMM output. This will leavearound 6.2 dB of Fading.
25 At the NIU location making sure that the Tltester has not dropped below the 1E-6requirement.Note: If the Tl tester does drop below therequirement than troubleshooting willNeed to be done.
26 At the NNE location, change the SMM PowerOutput attenuation #7 by adding one to thepresent value. Notify the NIU location afterthe change is applied to the SMM.
27 At the NIU location reset the Tl tester andmonitor the BER until you receive the results.If the results are 1E-6 or better go back to step26. If the results drops below 1E-6 go to step28.
28 At this point the SMM attenuation will need tobe rolled back in 1 dB increments until theBERT shows 1E-6 or better.
29 Reset the Tl tester and let it run for 5 minutes.Making sure the 1E-6 or better threshold isstable.
30 At the NIU Outstation, disconnect the RX IFcable going into IF IN jack on the back of theNIU.
31 Connect the RX IF cable to the ChannelPower Meter (using the attenuator pad, ifapplicable). Record the NIU Threshold levelon the Down-stream Link Budget DataRecording Sheet 2.
The NIU Threshold level isnow recorded on theDownstream Link Budget DataRecordingSheet 2.
32 Disconnect the Channel Power Meter andreconnect the RX IF cable (and attenuator pad,if applicable) to the IF IN jack on the back ofthe NIU.
33 Change all the SMM attenuation (software andhardware) back to the original value. Notify theNIU location after the change is applied to the
27

34
3536
37
SMM.The Fade Margin test will now need to be doneon the Redundant BTR. Switch over to theRedundant BTR and perform steps 23 through33. Record the Fade Margin results on theRedundant BTR on Data Sheet 7. Oncecompleted with the Redundant go to step 35.Note: Testing the Redundant BTR will be onthe engineered QAM rate only.Switch back to the Primary BTR.Note: As a Reminder the Fade Margintest will need to be performed for thelower QAM modes. Record the Fade Marginresults on Data Sheet 8.End of Procedure.
Test Results
Please refer to Appendix 3C for the results of the Downstream Fade Margin tests.
Comments
The Downstream Fade Margin tests were conducted for both sets of customer premise equipment(CPE1 and CPE2). The measured Downstream Fade Margin for CPE1 was 26.2 dB, while thecalculated Fade Margin was 19 dB. The measured Downstream Fade Margin for CPE2 was 25.7 dB,while the calculated Fade Margin was 17.8 dB. Thereby identifying that should the signal qualitydeteriorate (due to various factors such as rain, or other weather conditions) by a certain amount, thelink will still be fully available for communication.
6.2.4 Fade Margin (Upstream)
Test Description
The Fade Margin (Upstream) mimics the Fade Margin (Downstream) tests with the exception of thedirection of the radio path tested. Please refer to section 6.2.2 for more detail.
Test Procedures
Procedure 4 - Fade Margin Test Procedure (Upstream).
Step Action Observation
1.
2
3
45
At the NIU outstation, turn ON your laptopand run HvperTerminal.Click on Transfer, Capture Text, Enter a namefor the file (make the name something relativeto the site location and date), and then pressStart to begin the Capture.Press Enter a couple times.
Type in "DssLogin" andj»ress Enter.Type in: anonymous and press Enter.
VXworks prompt appears assuch: ->Dss User ID: appearsDss password: appears
28
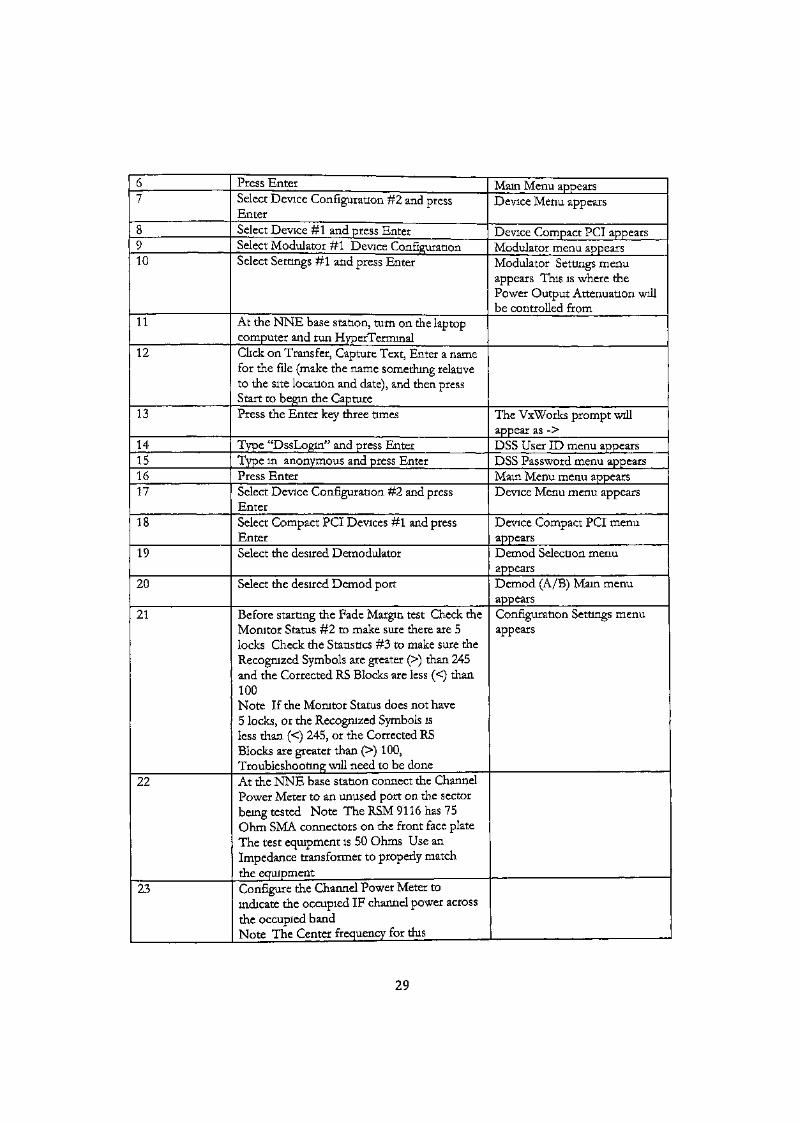
67
8910
11
12
13
14151617
18
19
20
21
22
23
Press EnterSelect Device Configuration #2 and pressEnterSelect Device #1 and press EnterSelect Modulator #1 Device ConfigurationSelect Settings #1 and press Enter
At the NNE base station, turn on the laptopcomputer and run HyperTerrmnalClick on Transfer, Capture Text, Enter a namefor the file (make the name something relativeto the site location and date), and then pressStart to begin the CapturePress the Enter key three times
Type "DssLogin" and press EnterType in anonymous and press EnterPress EnterSelect Device Configuration #2 and pressEnterSelect Compact PCI Devices #1 and pressEnterSelect the desired Demodulator
Select the desired Demod port
Before starting the Fade Margin test Check theMonitor Status #2 to make sure there are 5locks Check the Statistics #3 to make sure theRecognized Symbols are greater (>) than 245and the Corrected RS Blocks are less (<) than100Note If the Monitor Status does not have5 locks, or the Recognized Symbols isless than (<) 245, or the Corrected RSBlocks are greater than (>) 100,Troubleshooting will need to be doneAt the NNE base station connect the ChannelPower Meter to an unused port on the sectorbeing tested Note The RSM 9116 has 75Ohm SMA connectors on the front face plateThe test equipment is 50 Ohms Use anImpedance transformer to properly matchthe equipmentConfigure the Channel Power Meter toindicate the occupied IF channel power acrossthe occupied bandNote The Center frequency for this
Main Menu appearsDevice Menu appears
Device Compact PCI appearsModulator menu appearsModulator Settings menuappears This is where thePower Output Attenuation willbe controlled from
The VxWorks prompt willappear as ->DSS User ID menu appearsDSS Password menu appearsMain Menu menu appearsDevice Menu menu appears
Device Compact PCI menuappearsDemod Selection menuappearsDemod (A/B) Main menuappearsConfiguration Settings menuappears
29
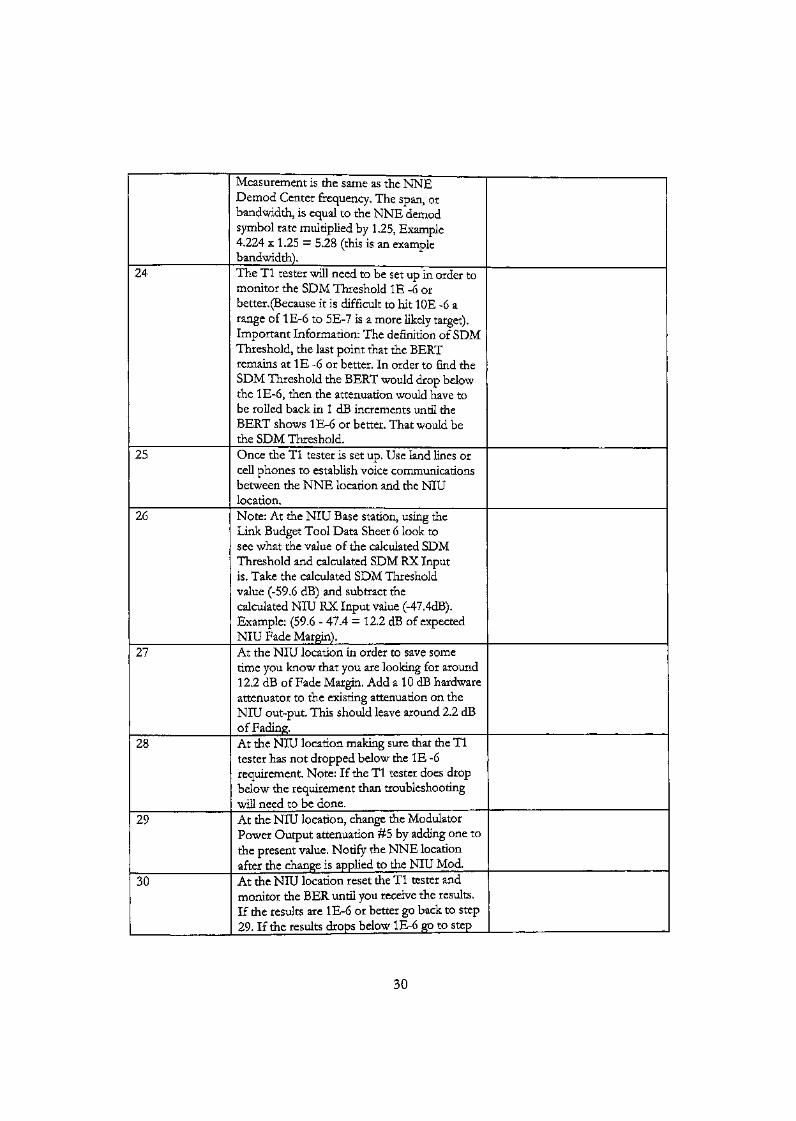
Measurement is the same as the NNEDemod Center frequency. The span, orbandwidth, is equal to the NNE demodsymbol rate multiplied by 1.25, Example4.224 x 1.25 = 5.28 (this is an examplebandwidth).
24 The Tl tester will need to be set up in order tomonitor the SDM Threshold IE -6 orbetter.(Because it is difficult to hit 10E -6 arange of 1E-6 to 5E-7 is a more likely target).Important Information: The definition of SDMThreshold, the last point that the BERTremains at IE -6 or better. In order to find theSDM Threshold the BERT would drop belowthe 1E-6, then the attenuation would have tobe rolled back in 1 dB increments until theBERT shows 1E-6 or better. That would bethe SDM Threshold.
25 Once the Tl tester is set up. Use land lines orcell phones to establish voice communicationsbetween the NNE location and the NIUlocation.
26 Note: At the NIU Base station, using theLink Budget Tool Data Sheet 6 look tosee what the value of the calculated SDMThreshold and calculated SDM RX Inputis. Take the calculated SDM Thresholdvalue (-59.6 dB) and subtract thecalculated NIU RX Input value (-47.4dB).Example: (59.6 - 47.4 = 12.2 dB of expectedNIU Fade Margin).
27 At the NIU location in order to save sometime you know that you are looking for around12.2 dB of Fade Margin. Add a 10 dB hardwareattenuator to the existing attenuation on theNIU out-put. This should leave around 2.2 dBof Fading.
28 At the NIU location making sure that the Tltester has not dropped below the IE -6requirement. Note: If the Tl tester does dropbelow the requirement than troubleshootingwill need to be done.
29 At the NIU location, change the ModulatorPower Output attenuation #5 by adding one tothe present value. Notify the NNE locationafter the change is applied to the NIU Mod.
30 At the NIU location reset the Tl tester andmonitor the BER until you receive the results.If the results are 1E-6 or better go back to step29. If the results drops below 1E-6 go to step
30
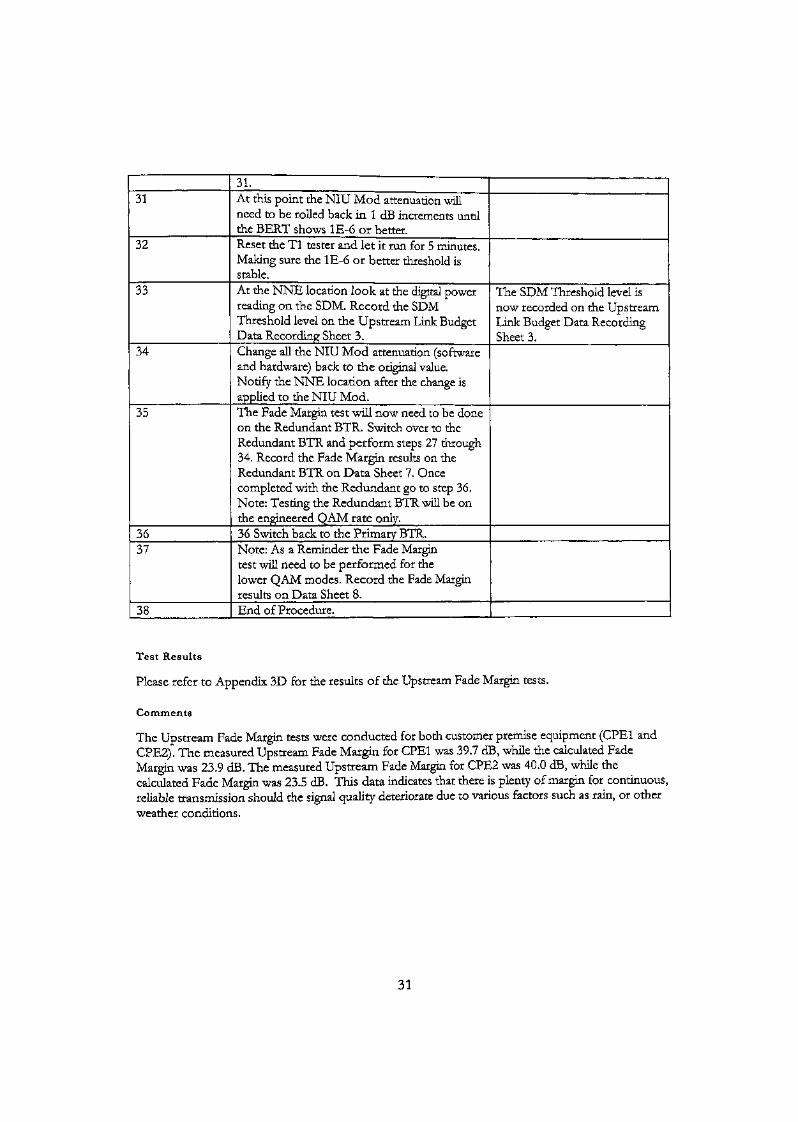
31
32
33
34
35
3637
38
31.At this point the NIU Mod attenuation willneed to be rolled back in 1 dB increments untilthe BERT shows 1E-6 or better.Reset the Tl tester and let it run for 5 minutes.Making sure the 1E-6 or better threshold isstable.At the NNE location look at the digital powerreading on the SDM. Record the SDMThreshold level on the Upstream Link BudgetData Recording Sheet 3.Change all the NIU Mod attenuation (softwareand hardware) back to the original value.Notify the NNE location after the change isapplied to the NIU Mod.The Fade Margin test will now need to be doneon the Redundant BTR. Switch over to theRedundant BTR and perform steps 27 through34. Record the Fade Margin results on theRedundant BTR on Data Sheet 7. Oncecompleted with the Redundant go to step 36.Note: Testing the Redundant BTR will be onthe engineered QAM rate only.36 Switch back to the Primary BTR,Note: As a Reminder the Fade Margintest will need to be performed for thelower QAM modes. Record the Fade Marginresults on Data Sheet 8.End of Procedure.
The SDM Threshold level isnow recorded on the UpstreamLink Budget Data RecordingSheet 3.
Test Results
Please refer to Appendix 3D for the results of the Upstream Fade Margin tests.
Comments
The Upstream Fade Margin tests were conducted for both customer premise equipment (CPE1 andCPE2). The measured Upstream Fade Margin for CPE1 was 39.7 dB, while the calculated FadeMargin was 23.9 dB. The measured Upstream Fade Margin for CPE2 was 40.0 dB, while thecalculated Fade Margin was 23.5 dB. This data indicates that there is plenty of margin for continuous,reliable transmission should the signal quality deteriorate due to various factors such as rain, or otherweather conditions.
31
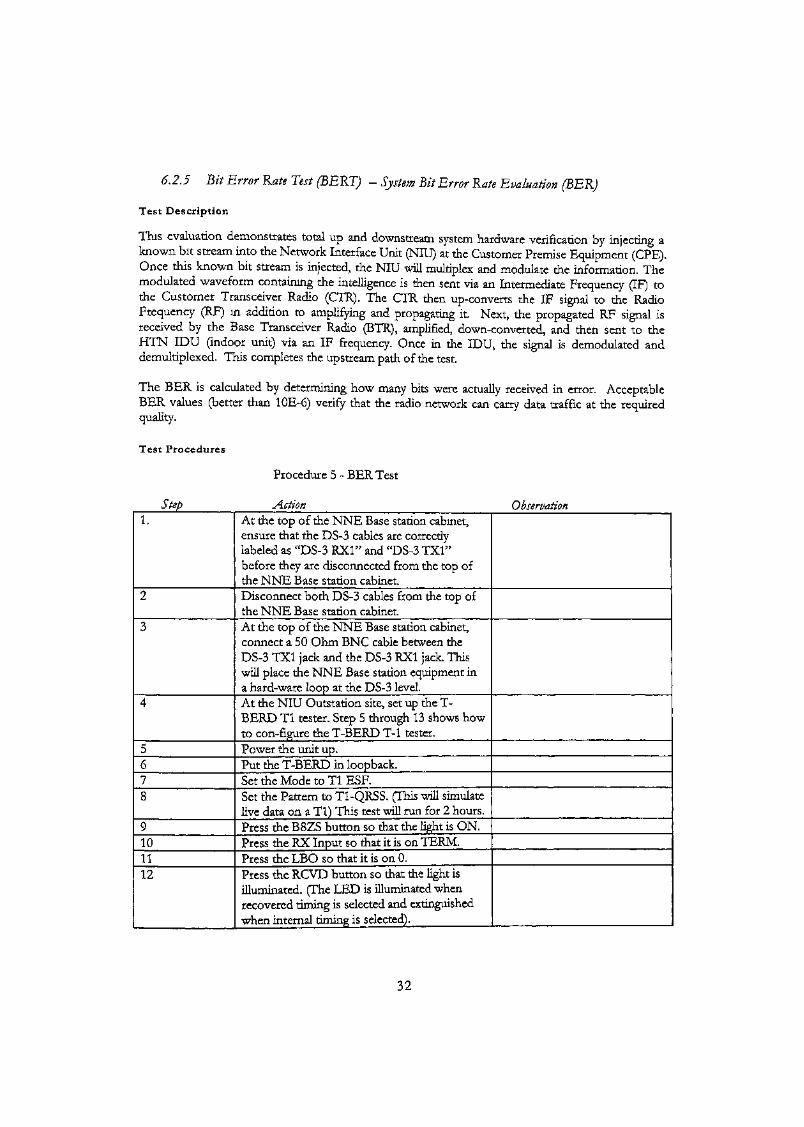
6.2.5 Bit Error Rate Test (BERT) - System Bit Error Rate Evaluation (BER)
Test Description
This evaluation demonstrates total up and downstream system hardware verification by injecting aknown bit stream into the Network Interface Unit (NIU) at the Customer Premise Equipment (CPE).Once this known bit stream is injected, the NIU will multiplex and modulate the information. Themodulated waveform containing the intelligence is then sent via an Intermediate Frequency (IF) tothe Customer Transceiver Radio (CTR). The CTR then up-converts the IF signal to the RadioFrequency (RF) in addition to amplifying and propagating it. Next, the propagated RF signal isreceived by the Base Transceiver Radio (BTR), amplified, down-converted, and then sent to theHTN IDU (indoor unit) via an IF frequency. Once in the IDU, the signal is demodulated anddemultiplexed. This completes the upstream path of the test.
The BER is calculated by determining how many bits were actually received in error. AcceptableBER values (better than 10E-6) verify that the radio network can carry data traffic at the requiredquality.
Test Procedures
Step
Procedure 5-BERTest
Action Observation1.
2
3
4
5678
9101112
At the top of the NNE Base station cabinet,ensure that the DS-3 cables are correctlylabeled as "DS-3 RX1" and "DS-3 1X1"before they are disconnected from the top ofthe NNE Base station cabinet.Disconnect both DS-3 cables from the top ofthe NNE Base station cabinet.At the top of the NNE Base station cabinet,connect a 50 Ohm BNC cable between theDS-3 TX1 jack and the DS-3 RX1 jack. Thiswill place the NNE Base station equipment ina hard-ware loop at the DS-3 level.At the NIU Outstation site, set up the T-BERD Tl tester. Step 5 through 13 shows howto con-figure the T-BERD T-l tester.Power the unit up.Put the T-BERD in loopback.Set the Mode to Tl ESF.Set the Pattern to Tl-QRSS. (This will simulateHve data on a Tl) This test will run for 2 hours.Press the B8ZS button so that the light is ON.Press the RX Input so that it is on TERM.Press the LBO so that it is on 0.Press the RCVD button so that the light isilluminated. (The LED is illuminated whenrecovered timing is selected and extinguishedwhen internal timing is selected).
32
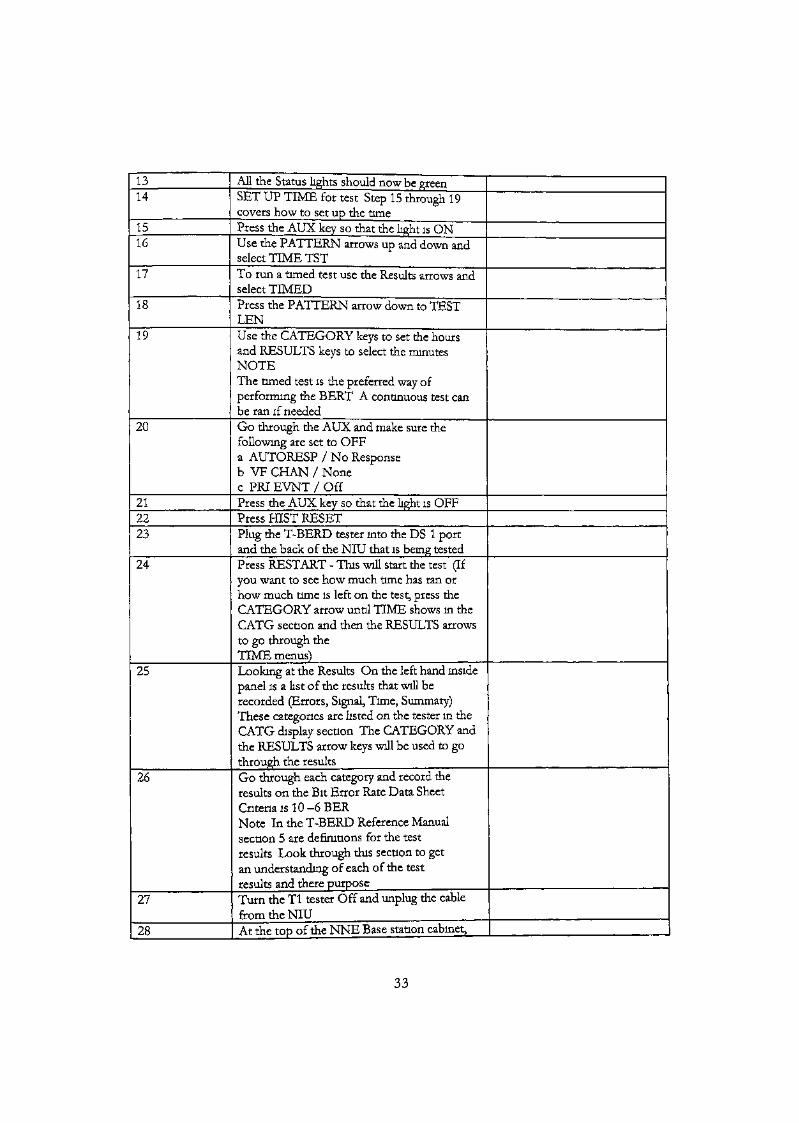
1314
1516
17
18
19
20
212223
24
25
26
27
28
All the Status lights should now be greenSET UP TIME for test Step 15 through 19covers how to set up the timePress the AUX key so that the light is ONUse the PATTERN arrows up and down andselect TIME TSTTo run a timed test use the Results arrows andselect TIMEDPress the PATTERN arrow down to TESTLENUse the CATEGORY keys to set the hoursand RESULTS keys to select the minutesNOTEThe timed test is the preferred way ofperforming the BERT A continuous test canbe ran if neededGo through the AUX and make sure thefollowing are set to OFFa AUTORESP / No Responseb VF CHAN / Nonec PRI EVNT / OffPress the AUX key so that the light is OFFPress HIST RESETPlug the T-BERD tester into the DS 1 portand the back of the NIU that is being testedPress RESTART - This will start the test (Ifyou want to see how much time has ran orhow much time is left on the test, press theCATEGORY arrow until TIME shows in theCATG section and then the RESULTS arrowsto go through theTIME menus)Looking at the Results On the left hand insidepanel is a list of the results that will berecorded (Errors, Signal, Time, Summary)These categories are listed on the tester in theCATG display section The CATEGORY andthe RESULTS arrow keys will be used to gothrough the resultsGo through each category and record theresults on the Bit Error Rate Data SheetCriteria is 10 -6 BERNote In the T-BERD Reference Manualsection 5 are definitions for the testresults Look through this section to getan understanding of each of the testresults and there purposeTurn the Tl tester Off and unplug the cablefrom the NIUAt the top of the NNE Base station cabinet,
33
29
30
disconnect the 50 Ohm BNC cable betweenthe DS-3 TX1 jack and the DS-3 RX1 jack.Reconnect both DS-3 cables as they werebefore this test at the top of the NNE Basestation cabinet.End of Procedure.
Test Results
Please refer to Appendix 3E and 3F for the results of the BER tests.
Comments
The Bit Error Rate test was run on both CPEs (i.e. NIU 1 and NIU 2). The test was run for 8 hourson each CPE. No errors were encountered in either of the tests, as shown in the test results sheets.These results indicate that the communication is clear and error free, and that the hardware isworking properly.
6.2.6 Network Element Connectivity (Pinging)
Test Description
A part of the RF testing includes verification of connectivity of all applicable network elementscontained in the Node and HTAS equipment racks. Connectivity is verified through "Pinging" aspecific network IP address. "Pinging" is a standard network command used for the process ofverifying connectivity through a software command followed by the IP Address of the specificnetwork element to be "Pinged".
« NNE (Network Node Equipment) Pinging Process
This test is to verify that the network has connectivity to the numerous Node Network Elementsinvolved in the demonstration. There are several NNE IP Addresses that were verified:
• ATM Switch (NMS PVC),• ATM Switch (10BT),• ADC AAC2 lOBaseT Port,• AWM (NMS PVC to ATM Switch),• Upper CIM,• Lower CIM,• Upper RSM 9016,• Upper RSM 9116,• Lower RSM 9016,• Lower RSM 9116 and NIU (ATM IPOA)
Note: Please refer to Appendix 2 (Engineering Packages) for the IP addresses.
34
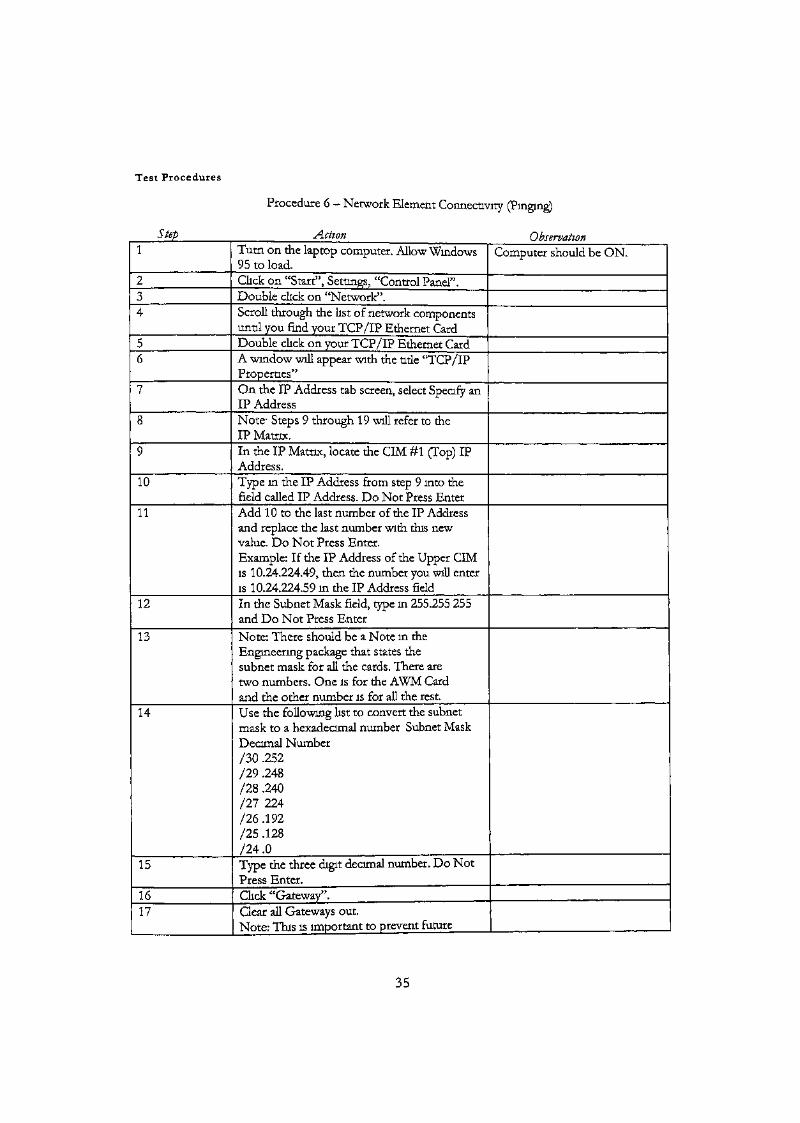
Test Procedures
Procedure 6 - Network Element Connectivity (Pinging)
Step Action Observation1
234
56
7
8
9
10
11
12
13
14
15
1617
Turn on the laptop computer. Allow Windows95 to load.Click on "Start", Settings, "Control Panel".Double click on "Network".Scroll through the list of network componentsuntil you find your TCP/IP Ethernet CardDouble click on your TCP/IP Ethernet CardA window will appear with the title "TCP/IPProperties"On the IP Address tab screen, select Specify anIP AddressNote- Steps 9 through 19 will refer to theIP Matrix.In the IP Matrix, locate the CIM #1 (Top) IPAddress.Type in the IP Address from step 9 into thefield called IP Address. Do Not Press EnterAdd 10 to the last number of the IP Addressand replace the last number with this newvalue. Do Not Press Enter.Example: If the IP Address of the Upper CIMis 10.24.224.49, then the number you will enteris 10.24.224.59 in the IP Address fieldIn the Subnet Mask field, type in 255.255 255and Do Not Press Enter
Note: There should be a Note in theEngineering package that states thesubnet mask for all the cards. There aretwo numbers. One is for the AWM Cardand the other number is for all the rest.Use the following list to convert the subnetmask to a hexadecimal number Subnet MaskDecimal Number/30 .252/29 .248/28 .240/27 224/26 .192/25 .128724 .0Type the three digit decimal number. Do NotPress Enter.Click "Gateway".Clear all Gateways out.Note: This is important to prevent future
Computer should be ON.
35
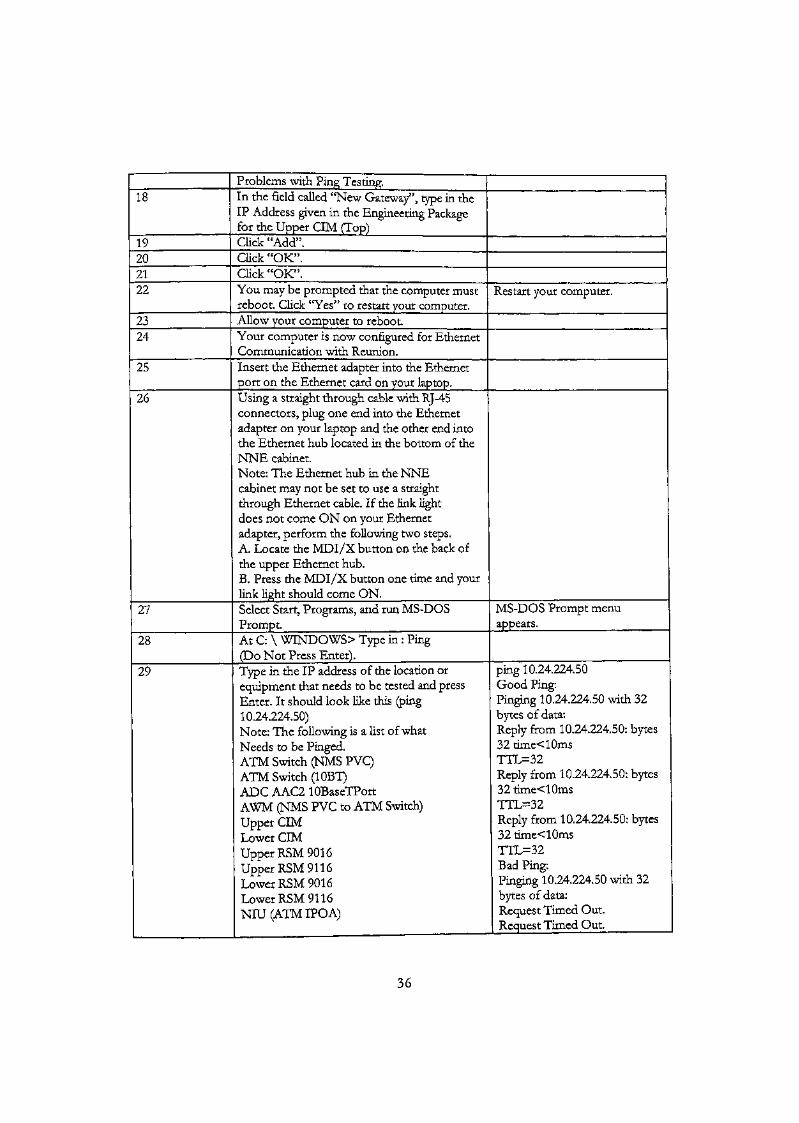
18
19202122
2324
25
26
27
28
29
Problems with Ping Testing.In the field called "New Gateway", type in theIP Address given in the Engineering Packagefor the Upper CIM (Top)Click "Add".Click "OK".Click "OK".You may be prompted that the computer mustreboot. Click "Yes" to restart your computer.Allow your computer to reboot.Your computer is now configured for EthernetCommunication with Reunion.Insert the Ethernet adapter into the Ethernetport on the Ethernet card on your laptop.Using a straight through cable with RJ-45connectors, plug one end into the Ethernetadapter on your laptop and the other end intothe Ethernet hub located in the bottom of theNNE cabinet.Note: The Ethernet hub in the NNEcabinet may not be set to use a straightthrough Ethernet cable. If the link lightdoes not come ON on your Ethernetadapter, perform the following two steps.A. Locate the MDI/X button on the back ofthe upper Ethernet hub.B. Press the MDI/X button one time and yourlink light should come ON.Select Start, Programs, and run MS-DOSPromptAt C: \ WINDOWS> Type in : Ping{Do Not Press Enter).Type in the IP address of the location orequipment that needs to be tested and pressEnter. It should look like this (ping10.24.224.50)Note; The following is a list of whatNeeds to be Pinged.ATM Switch (NMS PVC)ATM Switch (10BT)ADC AAC2 lOBaseTPortAWM (NMS PVC to ATM Switch)Upper CIMLower CIMUpper RSM 901 6Upper RSM 91 16Lower RSM 901 6Lower RSM 91 16NIU (ATM IPOA)
Restart your computer.
MS-DOS Prompt menuappears.
ping 10.24.22450Good Ping:Pinging 10.24.224.50 with 32bytes of data:Reply from 10.24.224.50: bytes32time<10msTTL=32Reply from 10.24.224.50: bytes32 time<10msTTL=32Reply from 10.24.224.50: bytes32 time<10msTTL=32Bad Ping:Pinging 10.24.224.50 with 32bytes of data:Request Timed Out.Request Timed Out.
36
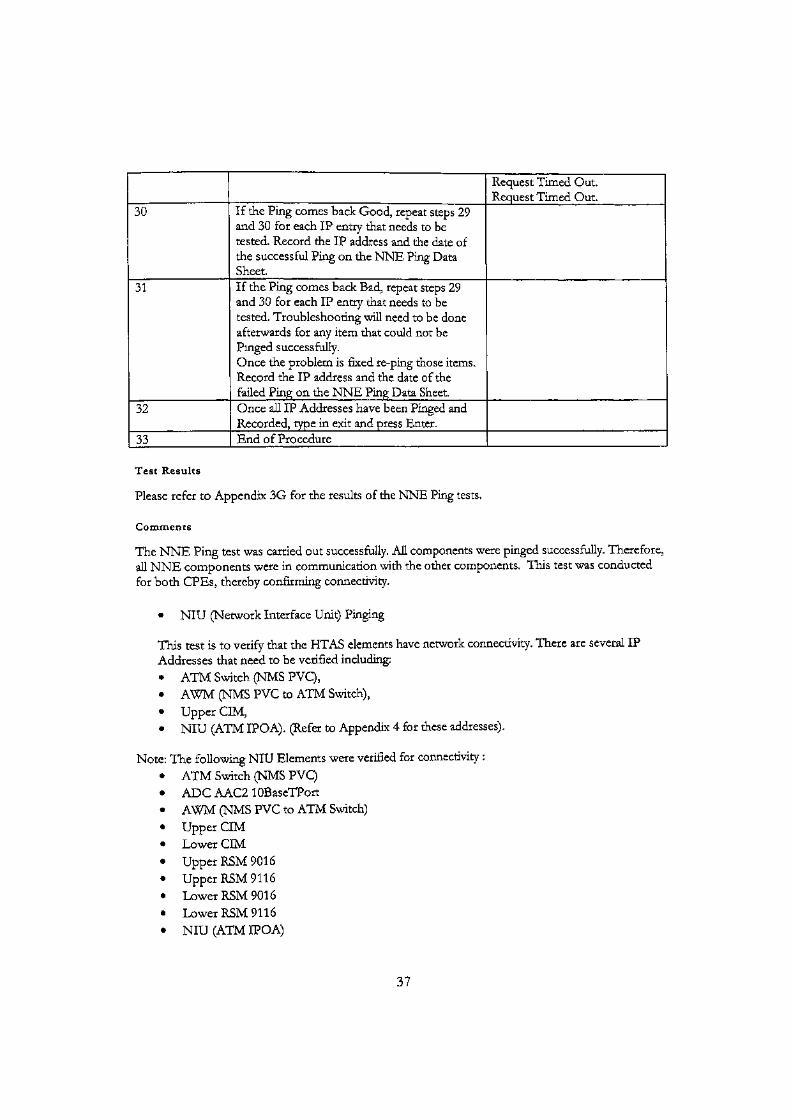
30
31
32
33
If the Ping comes back Good, repeat steps 29and 30 for each IP entry that needs to betested. Record the IP address and the date ofthe successful Ping on the NNE Ping DataSheet.If the Ping comes back Bad, repeat steps 29and 30 for each IP entry that needs to betested. Troubleshooting will need to be doneafterwards for any item that could not bePinged successfully.Once the problem is fixed re-ping those items.Record the IP address and the date of thefailed Ping on the NNE Ping Data Sheet.Once all IP Addresses have been Pinged andRecorded, type in exit and press Enter.End of Procedure
Request Timed Out.Request Timed Out.
Test Results
Please refer to Appendix 3G for the results of the NNE Ping tests.
Comments
The NNE Ping test was carried out successfully. All components were pinged successfully. Therefore,all NNE components were in communication with the other components. This test was conductedfor both CPEs, thereby confirming connectivity.
• NIU (Network Interface Unit) Pinging
This test is to verify that the HTAS elements have network connectivity. There are several IPAddresses that need to be verified including:• ATM Switch (NMS PVC),« AWM (NMS PVC to ATM Switch),• Upper CIM,• NIU (ATM IPO A). (Refer to Appendix 4 for these addresses).
Note: The following NIU Elements were verified for connectivity :
• ATM Switch (NMS PVC)• ADC AAC2 1 OBaseTPort• AWM (NMS PVC to ATM Switch)• Upper CIM• Lower CIM• Upper RSM 901 6• Upper RSM 91 16• Lower RSM 901 6• Lower RSM 91 16• NIU (ATM IPOA)
37
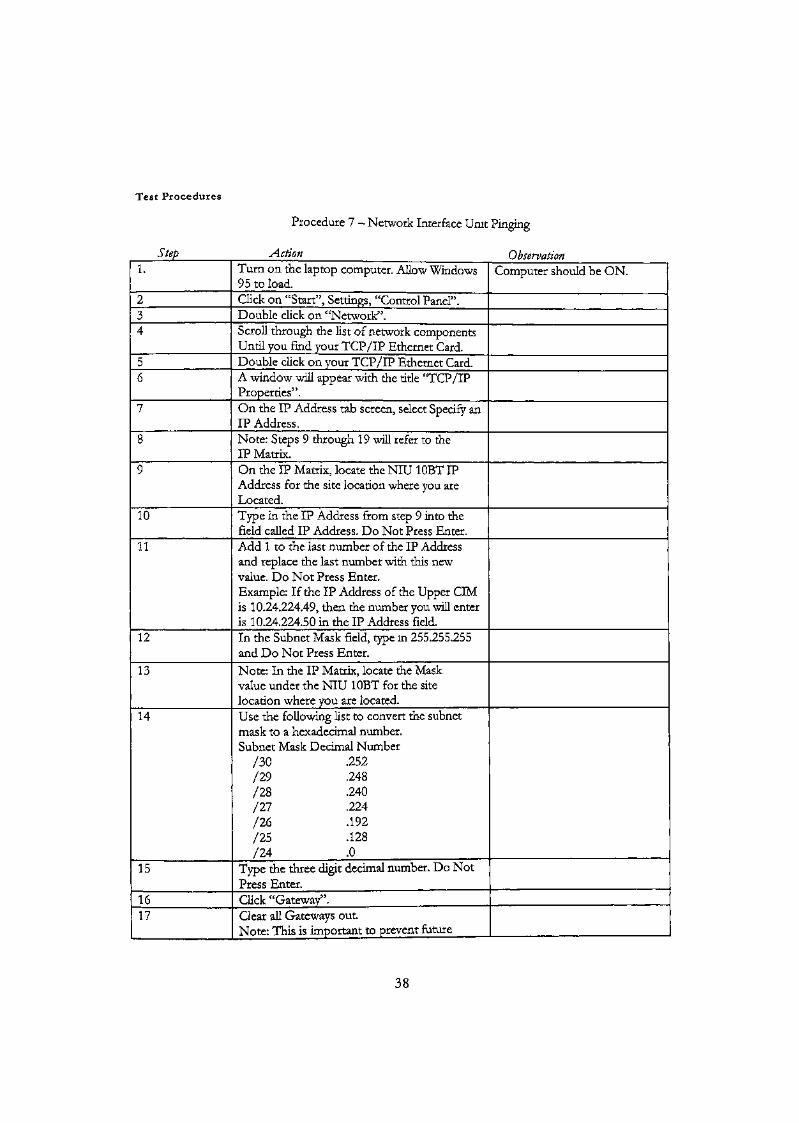
Test Procedures
Procedure 7 ~ Network Interface Unit Pinging
Step Action Observation1.
234
56
7
8
9
10
11
12
13
14
15
1617
Turn on the laptop computer. Allow Windows95 to load.Click on "Start", Settings, "Control Panel".Double click on "Network".Scroll through the list of network componentsUntil you find your TCP/IP Ethernet Card.Double click on your TCP/IP Ethernet Card.A window will appear with the title "TCP/IPProperties".On the IP Address tab screen, select Specify anIP Address.Note: Steps 9 through 1 9 will refer to theIP Matrix.On the IP Matrix, locate the NIU 10BT IPAddress for the site location where you areLocated.Type in the IP Address from step 9 into thefield called IP Address. Do Not Press Enter.Add 1 to the last number of the IP Addressand replace the last number with this newvalue. Do Not Press Enter.Example: If the IP Address of the Upper CIMis 10.24.224.49, then the number you will enteris 10.24.224.50 in the IP Address field.In the Subnet Mask field, type in 255.255.255and Do Not Press Enter.Note: In the IP Matrix, locate the Maskvalue under the NIU 10BT for the sitelocation where you are located.Use the following list to convert the subnetmask to a hexadecimal number.Subnet Mask Decimal Number
/30 .252/29 .248/28 .240/27 .224/26 .192/25 .128/24 .0
Type the three digit decimal number. Do NotPress Enter.Click "Gateway".Clear all Gateways out.Note: This is important to prevent future
Computer should be ON.
38
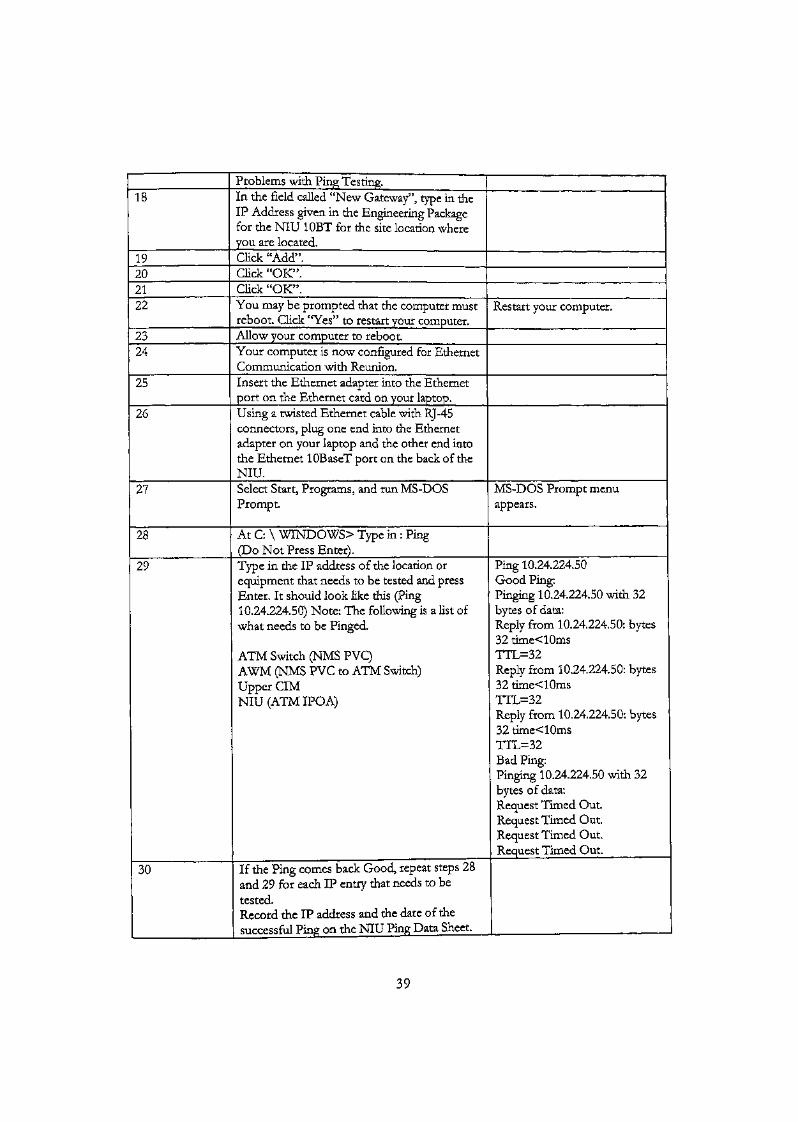
18
19202122
2324
25
26
27
28
29
30
Problems with Ping Testing.In the field called "New Gateway", type in theIP Address given in the Engineering Packagefor the NIU 10BT for the site location whereyou are located.Click "Add".Click "OK".Click "OK".You may be prompted that the computer mustreboot. Click tcYes" to restart your computer.Allow your computer to reboot.Your computer is now configured for EthernetCommunication with Reunion.Insert the Ethernet adapter into the Ethernetport on the Ethernet card on your laptop.Using a twisted Ethernet cable with RJ-45connectors, plug one end into the Ethernetadapter on your laptop and the other end intothe Ethernet lOBaseT port on the back of theNIU.Select Start, Programs, and run MS-DOSPrompt
At C: \ WINDOWS> Type in : Ping(Do Not Press Enter).Type in the IP address of the location orequipment that needs to be tested and pressEnter. It should look like this (Ping10.24.224.50) Note: The following is a list ofwhat needs to be Pinged.
ATM Switch (NMS PVC)AWM (NMS PVC to ATM Switch)Upper CIMNIU (ATM IPOA)
If the Ping comes back Good, repeat steps 28and 29 for each IP entry that needs to betested.Record the IP address and the date of thesuccessful Ping on the NIU Ping Data Sheet.
Restart your computer.
MS-DOS Prompt menuappears.
Ping 10.24.224.50Good Ping:Pinging 10.24.224.50 with 32bytes of data:Reply from 10.24.224.50: bytes32 time<10msTIL=32Reply from 10.24.224.50: bytes32 time<10msTTL^32Reply from 10.24.224.50: bytes32 time<10msTTL=32Bad Ping:Pinging 10.24.224.50 with 32bytes of data:Request Timed Out.Request Timed Out,Request Timed Out.Request Timed Out.
39
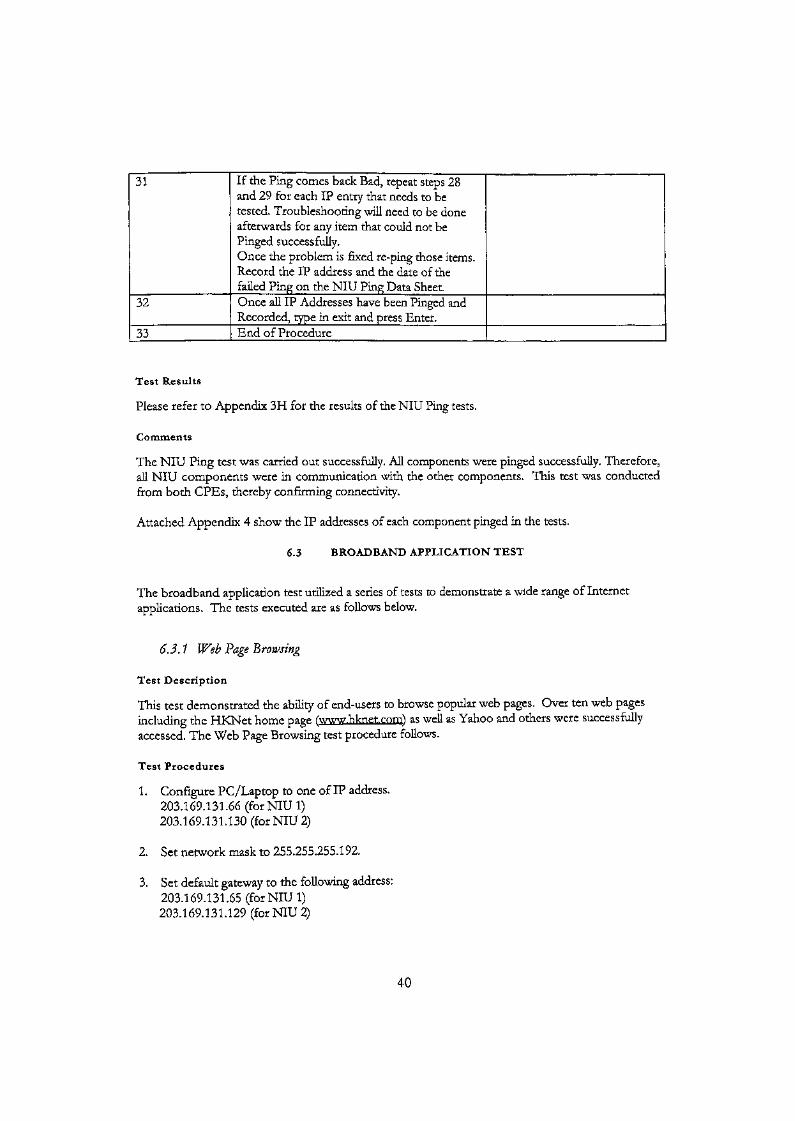
31
32
33
If the Ping comes back Bad, repeat steps 28and 29 for each IP entry that needs to betested. Troubleshooting wiU need to be doneafterwards for any item that could not bePinged successfully.Once the problem is fixed re-ping those items.Record the IP address and the date of thefailed Ping on the NIU Ping Data Sheet.Once all IP Addresses have been Pinged andRecorded, type in exit and press Enter.End of Procedure
Test Results
Please refer to Appendix 3H for the results of the NIU Ping tests.
Comments
The NIU Ping test was carried out successfully. All components were pinged successfully. Therefore,all NIU components were in communication with the other components. This test was conductedfrom both CPEs, thereby confirming connectivity.
Attached Appendix 4 show the IP addresses of each component pinged in the tests.
6.3 BROADBAND APPLICATION TEST
The broadband application test utilized a series of tests to demonstrate a wide range of Internetapplications. The tests executed are as follows below.
6.3.1 Web'Page browsing
Test Description
This test demonstrated the ability of end-users to browse popular web pages. Over ten web pagesincluding the HKNet home page (www.hknet.com) as well as Yahoo and others were successfullyaccessed. The Web Page Browsing test procedure follows.
Test Procedures
1. Configure PC/Laptop to one of IP address.203.169.131.66 (for NIU 1)203.169.131.130 (for NIU 2)
2. Set network mask to 255.255.255.192.
3. Set default gateway to the following address:203.169.131,65 (for NIU 1)203.169.131.129 (for NIU 2)
40
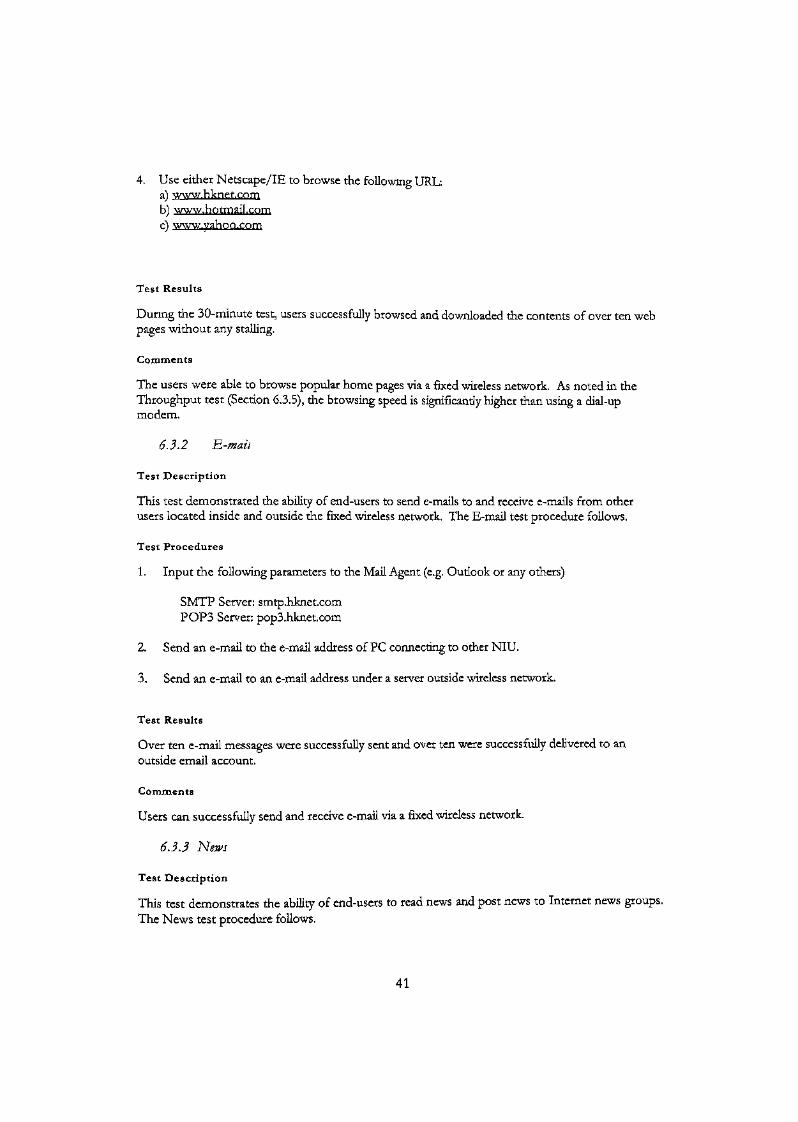
4. Use either Netscape/IE to browse the following URL:a) www.hknet.comb) www.hotmail.comc) www.yahoo.corn
Test Results
During the 30-minute test, users successfully browsed and downloaded the contents of over ten webpages without any stalling.
Comments
The users were able to browse popular home pages via a fixed wireless network. As noted in theThroughput test (Section 6.3.5), the browsing speed is significantly higher than using a dial-upmodem.
6.3.2 E-mail
Test Description
This test demonstrated the ability of end-users to send e-mails to and receive e-mails from otherusers located inside and outside the fixed wireless network. The E-mail test procedure follows.
Test Procedures
1. Input the following parameters to the Mail Agent (e.g. Outlook or any others)
SMTP Server: smtp.hknet.comPOPS Server: pop3.hknet.com
2. Send an e-mail to the e-mail address of PC connecting to other NIU.
3. Send an e-mail to an e-mail address under a server outside wireless network.
Test Results
Over ten e-mail messages were successfully sent and over ten were successfully delivered to anoutside email account.
Comments
Users can successfully send and receive e-mail via a fixed wireless network.
6.3.3 News
Test Description
This test demonstrates the ability of end-users to read news and post news to Internet news groups.The News test procedure follows.
41
Test Procedures
1 Connect to news server news.hknet.com.2 Read news from a sample news group3. Post news to a sample news group.
Test Results
News can be read and posted to sample news groups
Comments
Users can successfully post and read news via a fixed wireless network.
6.3.4 ICQ-I Seek You
Test Description
This test demonstrated the ability of users to communicate with Internet end-users via ICQ (I SeekYou) client software. ICQ software enables real-time online message exchange between emailaccounts. The ICQ test procedure follows.
Prerequisites:
D Any ICQ client program. ICQ UIN required. Several known ICQ UIN.
Test Procedures
1. Log on to mirabilis.com 4000
2. Choose a known UIN for chat. Send a chat request.
3. Choose a known UIN for sending message. Send message.
4. Select INVISIBLE instead of ONLINE.
5. Select AWAY instead of ONLINE.
Test Results
Users were able to connect to the ICQ server and open chat windows to exchange messages.Messages were successfully sent and replied to and users could change their status among Invisible','Away' and 'On Line'.
Comments
Users can successfully use ICQ to communicate with others via a fixed wireless network.
63.5 Throughput Test
Test Description
The Throughput test utilizes the following items to demonstrate Internet data throughput:
42

* FTP - File Transfer Protocol
The purpose of this test is to test the average file transfer speed on the wireless network measuredterms of bit rate.
in
Test Procedures
1. Upload and download a 1M files from HKNet Co. Ltd., Unix hosts (intranet.hknet.com) by usingthe following command in dos prompt
C: > ftp ftp server location
Enter user name and password
Ftp>bin
Ftp>hash
Ftp>get filename (for download file)
Or
tvp>put filename (for upload file).
2. Repeats upload and download files for at least 20 times.
3. Record the upload & download speed in Kbytes/s.
4. Take the average speed.
Repeat the above procedures using 10M file.
Test Results
1M File: Average Download/Upload speed for 1M file is 5.2 Mega bit/second and 4.4 Megabit/second
10M File: Average Download/Upload speed for 10M files is 5.1 Mega bit/second and 4.9 Megabit/second
Comments
Comparison with Dial Up ModemFTP via a fixed wireless network (interface - lOBaseT) permits file transfers of a wide range of filesizes at a much higher speed than 56k dial up modem.
For 1M fileWireless NetworkAverage DownloadSpeed (Mbit/s)
5.2Mbit/s
Average Upload Speed(Mbit/s)
4.4Mbit/s
Dial Up ModemAverage DownloadSpeed (kbits /s)
44 kbits/s
Average UploadSpeed (kbits/s)
20 kbits/s
43
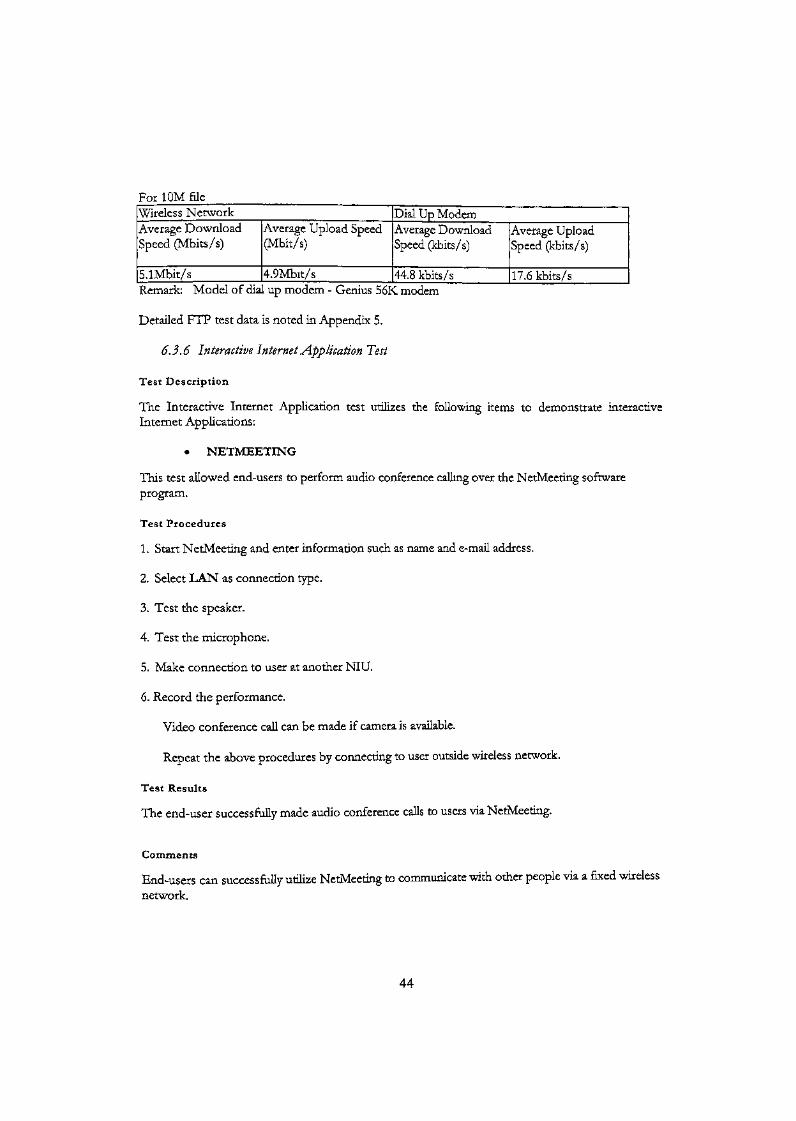
For 10M fileWireless NetworkAverage DownloadSpeed (Mbits/s)
5.1Mbit/s
Average Upload Speed(Mbit/s)
4.9Mbit/s
Dial Up ModemAverage DownloadSpeed (kbits/s)
44.8 kbits/s
Average UploadSpeed (kbits/s)
17.6 kbits/sRemark: Model of dial up modem - Genius 56K modem
Detailed FTP test data is noted in Appendix 5.
63.6 Interactive Internet Application Test
Test Description
The Interactive Internet Application test utilizes the following items to demonstrate interactiveInternet Applications:
• NETMEETING
This test allowed end-users to perform audio conference calling over the NetMeeting softwareprogram.
Test Procedures
1. Start NetMeeting and enter information such as name and e-mail address.
2. Select LAN as connection type.
3. Test the speaker.
4. Test the microphone.
5. Make connection to user at another NIU.
6. Record the performance.
Video conference caU can be made if camera is available.
Repeat the above procedures by connecting to user outside wireless network.
Test Results
The end-user successfully made audio conference calls to users via NetMeeting.
Comments
End-users can successfully utilize NetMeeting to communicate with other people via a fixed wireless
network.
44
• REALPLAYER
This test allows users to test real-time broadcasting of video, music and media over a fixed wirelessnetwork.
Prerequisites: RealServer and sample video files should be already installed in HKNET server.
Test Procedures
1. Start RealPlayer and press Ctrl+L to enter the following rtsp address.
Rtsp://origin200.hknet.com/encoder/demo.
2. Start playing the video files.
3. Recording the statistics by Alt+V and then c in the main menu.
Test Results
During the 30 minutes of testing, video files that encode 15 frames per second were played back atan average of 14 frames per second.
Please be noted that it is common for number of played back frame is less than the number ofencode frame due to the fact that the checksum error occurs in transmission of video frame over thecommunication link. The video playback will lose track of frame sequence because of real timenature and there is no mechanism to re-synchronize the video streams, so the receiver end has to besimply dropped the frame when received with checksum errors. That is why there is a slightlydifference in number of frames during the video encode and decode process.
Comments
Video files can successfully be streamed through a fixed wireless network.
45

7 TEST EQUIPMENT
Tftst Equipment and Software Test Units
The following equipment and software test units are required to complete the RF and Dataperformance trials
• (2)HP2010BCaLan• (2) T-Berd Tl Test Set• (2) Laptop Computer• (2) Digital Volt/Ohm Meter• QAM Analyzer
Supplies and Test Interface Cables
The supplies and test interface cables listed below are required to perform performance testing onthe trial equipment
« Tools• Field Technician's Installation Toolkit• Cold Shrink- ButalTape• 6 foot Ethernet 10 Base T cable (straight through) with RJ-45 connectors• 6 foot Ethernet 10 Base T cable (Twisted/Cross-over) with RJ-45 connectors
46

8 SUMMARY OF TEST RESULTS
The results from the extensive series of test performed during the HKNet-Teligent Point-to-Multipoint (PMP) W-FTNS demonstration indicate that the service and equipment met or exceededall expected quality metrics.
The Upstream and Downstream link Budget tests showed a high correlation (3dB) betweenmeasured and predicted values, indicating not only that the equipment performed to specification,but also that the network was correctly installed and engineered. The Fade Margin testsdemonstrated that an ample margin can be engineered in the radio network to overcome signalfading due to excessive rainfall., a particular concern in Hong Kong. In fact, the measured fademargins for the two radio links exceeded the minimum required value by over 25 dB. In other wordsthe broadband applications users in the demonstration experienced a quality of service far greaterthan the 99.99% quality of service availability target. As the broadband applications Throughput testdemonstrated, FTP via the demonstration configuration permitted file transfers of a wide range offile sizes at speeds ranging from 4.6 - 5.45 Mbits/second, significantly higher speeds than a 56k dialup modem. In addition, the Bit Error Rate (BER) tests showed that there were no bit errors over aneight hour test period further emphasizing the quality of the demonstration network.
In summary, the data collected from the HKNet-Teligent PMP demonstration system proved thatHKNet-Teligent is capable of rapidly deploying a high-quality, high bandwidth W-FTNS network inHong Kong.
9 PARTICIPANTS
HKNet-Teligent and Nortel Networks Hong Kong and Nortel Networks United States were keyparticipants in the demonstration.
HKNet-Teligent - Hong KongCharles Mok — Director, Business DevelopmentJohnny Cheung - Director, CCT Telecommunications Group LtdStephen Chau - Project DirectorW. H. Tsang - Principal ConsultantDavid Wong - Project ManagerRay Chan - Technical ManagerSamson Luk - Network ConsultantThomas Fong - RF Consultant
HKNet-Teligent - United StatesRavi Potharlanka - Vice President, International Market DevelopmentJulie Coons — Director, Asia-Pacific, International Market DevelopmentSindy Yeh - Country Manager, Hong Kong, International Market DevelopmentEric Miller - Director, RF Planning, RF EngineeringKazi Ahmed — Senior RF Design Engineer, RF EngineeringSteve Holley — RF Project Manager, RF EngineeringSuro Sengupta — Senior RF Design Engineer, RF EngineeringMike Ferrari - Technical Director, Network Technology
Nortel Networks - Hong KongStephen Yap — Associate DirectorAllison Chu — Marketing SpecialistRigel Tang - Product Marketing ManagerWai Man Lo — Senior Project EngineerNelson Ko - Senior Systems EngineerClement Chan - Systems Engineer
48
Networks - United StatesMike Lambert — Global Vice President-TeligentIhor Nakoneczky — Reunion MarketingBrenda Koulis — Reunion MarketingJim Lipe — Senior Program ManagerVictoria Hager — Program CoordinatorKun Qian - Network EngineerJoey Sonoda — Network EngineerRon Nethery — RF EngineerMohammed Bah — Equipment EngineerR.J. Sandlin — Manager, Equipment EngineeringTracy Lecompte - Engineering CoordinatorWesley Cunningham - LogisticsRandi Lovell — Manufacturing PlannerKathryn Paramor - LogisticsLori Gogal — LogisticsOrin Staples - LogisticsJ.C. Miller — Installation and Commissioning Technician
49
10 APPENDICES
APPENDIX 1 - Site Surveys
APPENDIX 2 - Engineering Packages
APPENDIX 3 - ATP Test ResultsAPPENDIX 3A - Link Budgets DownstreamAPPENDIX 3B - Link Budgets UpstreamAPPENDIX 3C - Fade Margin CPE 1APPENDIX 3D - Fade margin CPE 2APPENDIX 3E - BERT CPE 1APPENDIX 3F - BERT CPE 2APPENDIX 3G - NNE Ping test (CPE 1 and 2)APPENDIX 3H - NIU Ping test (CPE 1 and 2)
APPENDIX 4 - Data routing and IP Address Diagram
APPENDIX 5 - Throughput (FTP) Test Results
50

Appendix 1 - Site Surveys

Broadband Wireless Access19111 N. Dallas Pkwy. Ste. 200Dallas, Texas 75287
Pagel of 11
NORTELNETWORKS
SITE SURVEY
SITE NAME: The Chinese University of Hong Kong DATE: 5-Nov-1999SITE CODE:SURVEYORS NAME: Matumoto, Nakagawa, KG LeeBASE CPECUSTOMER: HKNet Company Limited.CUSTOMER CONTACT: Mr. David Wong
PHONE # (852)2110-3388FAX# (852) 2110-0078CELL PHONE#
BUILDING NAME: Pi Ch'iu BuildingBUILDING MANAGEMENT CONTACT: Mr. Che-HlOO Cheng (Head, Data Communications & NetworkingSection)
PHONE # (852)26098848FAX# (852) 2603 5001CELL PHONE*
SITE ADDRESS: The Chinese University of Hong Kong, Shatin, N.T. Hong Kong.
ELEVATION: N/A
1.0 BUILDING INFORMATION(Can be determined by measurement with laser range finder.)
Tip of BTR antenna
ANTENNA HEIGHT(AGL):
2.81 m
Measurement 175.7m
point at which distances aremeasured with laser range finder
t Tip of CPE1 antenna
Measurement #1 175.7m
BUILDING NOTESBuilding houses the computer equipment room on the ground floor.
Doc:File:
BNDCE03fQSE Web Page, Customer
I Rev: 4Engineering
10/15/98 Prep:Appr:
I oddI. J.
PearsonLeCompte
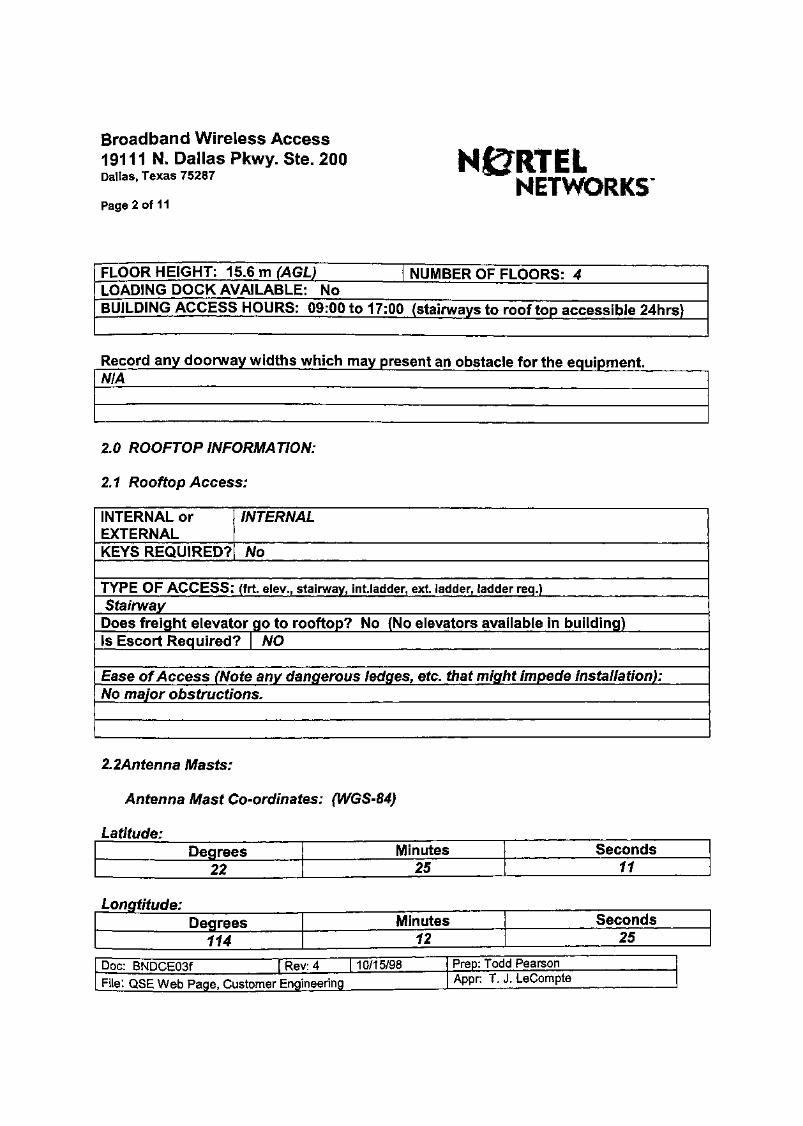
Broadband Wireless Access19111 N. Dallas Pkwy. Ste. 200Dallas, Texas 75287
Page 2 of 11
N&RTELNETWORKS
FLOOR HEIGHT: 15.6m(AGL) NUMBER OF FLOORS: 4LOADING DOCK AVAILABLE: NoBUILDING ACCESS HOURS: 09:00
Record any doorway widths whichNIA
to 17:00 (stairways to roof top accessible 24hrs)
may present an obstacle for the equipment.
2.0 ROOFTOP INFORMATION:
2.1 Rooftop Access:
INTERNAL orEXTERNALKEYS REQUIRED?
INTERNAL
No
TYPE OF ACCESS: (frt. elev., stairway, int.ladder, ext. ladder, ladder req.)StairwayDoes freight elevator go to rooftop? No (No elevators available in building)Is Escort Required? | NO
Ease of Access (Note any dangerous ledges, etc, that might impede installation):No major obstructions.
2.2Antenna Masts:
Antenna Mast Co-ordinates: (WGS-84)
Latitude:Degrees
22Minutes
25Seconds
11
ftC ,-
Degrees114
Minutes12
Seconds25
Doc: BNDCE03f I Rev: 4File: QSE Web Page, Customer Engineering
10/15/98 Prep: Todd PearsonAppr; T. J. LeCompte
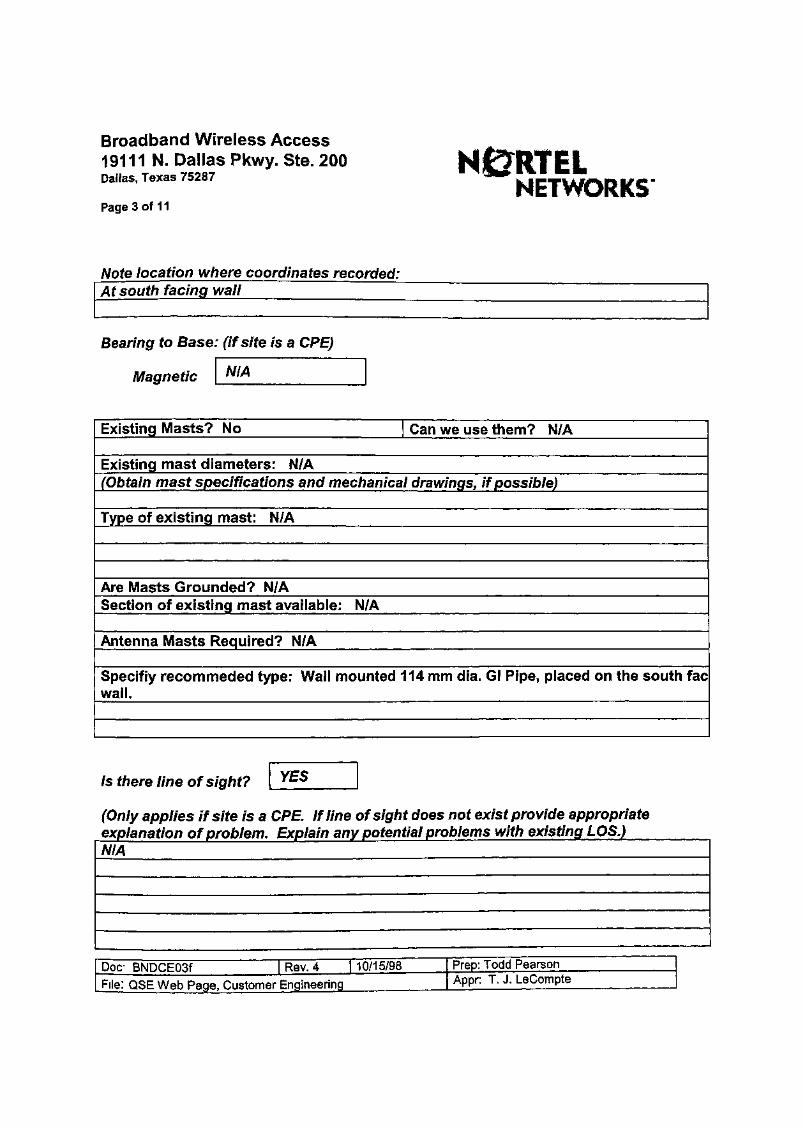
Broadband Wireless Access19111 N. Dallas Pkwy. Ste. 200 Ni31tTELDa,,as, Texas 75287 NETWORKS'
Page 3 of 11
Note location where coordinates recorded:At south facing wall
Bearing to Base: (if site is a CPE)
Magnetic NIA
Existing Masts? No Can we use them? N/A
Existing mast diameters: N/A(Obtain mast specifications and mechanical drawings, if possible)
Type of existing mast: N/A
Are Masts Grounded? N/ASection of existing mast available: N/A
Antenna Masts Required? N/A
Specifiy recommeded type: Wall mounted 114 mm dia. Gl Pipe, placed on the south facwall.
Is there line of sight?
(Only applies if site is a CPE. If line of sight does not exist provide appropriateexplanation of problem. Explain any potential problems with existing LOS.)NIA
Doc- BNDCEOSf Rev. 4 10/15File: QSE Web Page, Customer Engineering
5/98 Prep: Todd PearsonAppr: T, J. LeCompte
Broadband Wireless Access19111 N. Dallas Pkwy. Ste. 200Dallas, Texas 75287
Page 4 of 11
NORTELNETWORKS
Is any View Overlooking Water? NO(If site is a CPE this would be the LOS to basestation)
Are there any nearby metallic structures? (If yes describe)
NIA
2.3 Power:
Existing rooftop power available for use?
If no, note location of the closet power source available:At the stairways leading to the roof (on Level 4)
2.4 Existing Transmitters or Receivers? NO
If yes, does existing equipment pose an RF interferenceproblem to this installation? (YES, NO, OR UNABLE TO DETERMINE)
NIA
Does existing equipment pose a radiation hazard?NIA
(If possible, obtain relevant information of existing equipment that poses aninterference problem to this installation, e.g. frequencies, transmit power,purpose)
NIA
Doc:File:
BNDCEOSfQSE Web Page,
1Rev: 4
Customer Engineering
10/15/98 Pre^LAppr:
1 oddT.J.
PearsonLeCompte
Broadband Wireless Access19111 N. Dallas Pkwy. Ste. 200 NORTELHaSlaQ T>*fl«5 75287 * ^ % B l W ^ ® ™ ' * ® Wmmmoauas, NETWORKSPage 5 of 11
2.5 Roof Pictures: Take numerous pictures! Suggested photos:1 Existing RF equipment 5. Location of cable entry to roof2. Existing antennas 6. Any cable run barriers3. Roofprojectionslscreenslbarriers 7. Power source4. V7ew from eac/i CPE to Jbase 8. Roof Access
(Photos are not necessary if videotape is being used, indicate exposures taken)
Was video tape taken? YES
2.6 Roof Sketch:Sketch rooftop footprint on following page: Include location of:1. Cable entry at roof 7. Indicate mag.north direction2. Rooftop power location S.Dimensions as necessary3. All existing AIC units 9. Front of building4. All screens or barriers 10. Surrounding streets5. All existing antenna masts6. All existing vents, any equipment located or projecting from rooftop
Roof Top NotesfExplain any other relevant information about the rooftop necessary)NIA
Doc: BNDCE03fFile; QSE Web Page,
| Rev; 4 10/15/98Customer Engineering
Prep: Todd PearsonAppr: T. J. LeCompte
Broadband Wireless Access **.»•»•• •<••19111 N. Dallas Pkwy. Ste. 200 NORTELDallas, Texas 75287 NETWORKS"
Page 6 of 11
Rooftop Sketch:
Doc:File:
BNDCE03fQSE Web Page,
Rev: 4 1 10/15/98 I
Customer Engineering J
Prep:| Appr:
ToddT. J.
PearsonLeCompte
Broadband Wireless Access19111 N. Dallas Pkwy. Ste. 200Dallas, Texas 75287
Page 7 of 11
NORTELNETWORKS
3.0 Digital Equipment Room:
Location:Floor#:
Room#Location Description
CSC Room
Room has HVAC? YES
Room has raised computer floor ? YES
The room houses the computer equipment, routers, etc. and is adjacent to theInformation Technology Service Unit Office.
Type of room: (e.g. mechanicalfelectrical Janitor, elevator, telephone room)PC and Network Equipment room.
Keys Required? \ YES
Key Source Mr. Che-Hoo Cheng Phone Number (852) 2609-8848
Security Card required to get into digital room?(If card is required indicate source)
Indicate location where equipment is to be installed:(floor,table, wall mount, other)Floor
(Indicate any existing equipment whicha problem to the installation)
NO
installation needs to be aware of lor posses
Doc:
File:BNDCE03f
QSE Web Page, CustomerI Rev; 4Engineering
10/15/98 Prep-Appr:
I oddI.J.
PearsonLeCompte
Broadband Wireless Access19111 N. Dallas Pkwy. Ste. 200Dallas, Texas 75287
Page 8 of 11
NORTELNETWORKS
3. f Power.** Note: Each site requires a separate dedicated circuit
Base equipment location has dedicated circuit:
CPE equipment location has dedicated circuit:
UPS Power available:
Notes:
Required by Customer
NIA
3.2 Room Pictures
1. Any existing equipment2. General layout of room3. Cable entry to room
(Photos are not necessary if videotape is being used), Indicate exposures taken
Was video tape taken?
3.3 Room SketchSketch Footprint of digital equipment room on following page. Include:
1. Door locations & Swing2. Power outlet locations3. Any existing equipment on floor or walls4. Any gas, water, pipes5. Any obstructionsDoc: BNDCE03f Rev: 4 110/15/98
File; QSE Web Page, Customer Engineerincj
Prep: Todd PearsonAppr: T, J. LeCompte
Broadband Wireless Access19111 N. Dallas Pkwy. Ste. 200Dallas, Texas 75287
NETWORKSPage 9 of 11
Digital Room Sketch:
Doc; BNDCE03f \ Rev: 4 10/15/98
File: QSE Web Page, Customer Engineering
Prep: Todd PearsonAppr: T. J. LeCompte
Broadband Wireless Access19111 N. Dallas Pkwy. Ste. 200Dallas, Texas 75287
Page 10 of 11
N&RTILNETWORKS
4.0 Cabling: (List the length of each cable separately with proper identification ifbasestation)
Outdoor cable run from roof mast to cable bldg. entry:1. 16m2.3.4.
Inner building cable run from digital equipment room entry to outdoor cable exit1. 22m2. 14.5m3.4,
Indoor cable run from cable bldg. entry to digital equipment1. 32m2.3.4.
Total Cable Length 84.5 m
Cable length required to connect the digital equipment and the IF equipment This isCritical!! Be aware of any obstacles the cable must go around, requirements fromBuilding management-note, sketch or photograph these.
Cable runs already existing:Explain:
Plenum cable required indoor
Lightning arrestor existing:
Other cable type required indoorIndicate type:
YES
>r NIA
Doc:File:
BNDCEOSfQSE Web Page,
Rev: 4Customer Engineering
I 10/15/98 Prep:Appr:
ToddT.J.
PearsonLeCompte

Broadband Wireless Access19111 N. Dallas Pkwy. Ste. 200Dallas, Texas 75287
Page 11 of 11
N&RTELNETWORKS
4.1 Cable Routing Sketch:If necessary, sketch the routing of the IF cable
4.2 Existing Cable Riser: Identify any existing cable risers or other cable penetrations onthe rooftop.
A. Are there existing cable risers or trays?
vpcB. Can it be used I riro
C. Record the contents of any existing risers that are to be used for this installation.Appropriate video should be taken of the risers.
Existing cable trunking in cable risers are full. Will need to install a PVC pipe to housethe IF & telemetry cables.
D, Record the dimensions of any existing cable risers.3.4 mX 2.75m
E. Are there any new cable risers, cable trays or rooftop penetrations needed? If yes,describe below.
NO apart from the additional PVC pipe in the riser.
Doc: BNDCE03fFile: QSE Web Page,
| Rev: 4 10/15/98
Customer Engineering
Prep:Appr:
Todd PearsonT, J. LeCompte

Broadband Wireless Access19111 N. Dallas Pkwy. Ste. 200Dallas, Texas 75287
Pagel of 11NETWORKS
SITE SURVEY
SITE NAME: The Chinese University of Hong Kong [DATE: 5-NOV-1999
SITE CODE:SURVEYORS NAME: Matumoto, Nakagawa, KG LeeBASE CPECUSTOMER: HKNet Company Limited.CUSTOMER CONTACT: Mr. David Wong
PHONE # (852)2110-3388FAX# (852) 2110-0078CELL PHONE#
BUILDING NAME: Ho Sin Hang Engineering BuildingBUILDING MANAGEMENT CONTACT: Mr. Patrick Lee Wing Ka
PHONE # (852)26098218FAX# (852) 2603 7327CELL PHONE*
SITE ADDRESS: The Chinese University of Hong Kong, Shatin. N.T. Hong Kong.
ELEVATION: N/A
1.0 BUILDING INFORMATION(Can be determined by measurement with laser range finder.)
Tip of BTR antenna .
ANTENNA HEIGHT(AGL):
2.82m
Measurement#2 175.7m
- point at which distances aremeasured with laser range finder
tTip of CPE1 antenna
Measurement #1 175.7m
BUILDING NOTESNIA
Doc: BNDCE03f
File: QSE Web Page,
Rev: 4 10/15/98
Customer Engineering
Prep:Appr:
Todd PearsonT. J. LeCompte
Broadband Wireless Access19111 N. Dallas Pkwy. Ste. 200Dallas, Texas 75287
Page 2 of 11
NORTELNETWORKS
FLOOR HEIGHT: 48m (AGL) NUMBER OF FLOORS: 10 + RoofLOADING DOCK AVAILABLE: NoBUILDING ACCESS HOURS: 09:00 to 17:00
Record any doorway widths which may present an obstacle for the equipment.NIA
2.0 ROOFTOP INFORMATION:
2.1 Rooftop Access:
INTERNAL orEXTERNALKEYS REQUIRED?
INTERNAL
No
TYPE OF ACCESS: (frt. eiev., stairway, intiadder, ext. ladder, ladder req.)
StairwayDoes freight elevator go to rooftop? NoIs Escort Required? NO
Ease of Access (Note any dangerous ledges, etc, that might impede installation):No major obstructions.
2.2Antenna Masts:
Antenna Mast Co-ordinates: (WGS-84)
Latitude:Degrees
22Minutes
25Seconds
05 N
Degrees114
Minutes12
Seconds27 £
Doc:File:
BNDCEOSf
QSE Web Page, Customer
Rev: 4Engineering
| 10/15/98 Prep^Appr:
I oddr. j.
PearsonLeCompte
Broadband Wireless Access19111 N. Dallas Pkwy. Ste. 200 NI5RTELDa"as Te*"75287 NETWORKSPage 3 of 11
Note location where coordinates recorded:See rooftop layout
Bearing to Base: (if site is a CPE)
Magnetic 338 NNW
Existing Masts? No [ Can we use them? N/A
Existing mast diameters: N/A(Obtain mast specifications and mechanical drawings, if possible)
Type of existing mast: N/A
Are Masts Grounded? N/ASection of existing mast available: N/A
Antenna Masts Required? N/A
Specifiy recommeded type: Wall mounted (bracket support) 114 mm dia. Gl Pipe.
Is there line of sight?
(Only applies if site is a CPE. If line of sight does not exist provide appropriateexplanation of problem. Explain any potential problems with existing LOS.)No major problems or obstructions.
Is any View Overlooking Water? NO
Doc:File:
BNDCEOSfQSE Web Page,
Rev: 4 10/15/98
Customer Engineering
Prep^Appr:
I oddI. J.
PearsonLeCompte
Broadband Wireless Access19111 N. Dallas Pkwy. Ste. 200Dallas, Texas 75287
Page 4 of 11
N&RTELNETWORKS
f/f site is a CPE this would be the LOS to basestation)
Are there any nearby metallic structures? (If yes describe)
A satellite dish is located at the back (when facing the BTR) of the CPE antenna.
2.3 Power:
Existing rooftop power available for use?
/f no, note location of the closet power source available:Possible available from power utility room on the roof. (Was locked during the survey).
2.4 Existing Transmitters or Receivers? YES, A CS dish.
If yes, does existing equipment pose an RF interferenceproblem to this installation? (YES, NO, OR UNABLE TO DETERMINE)
NO
Does existing equipment pose a radiation hazard?NO
(If possible, obtain relevant information of existing equipment that poses aninterference problem to this installation, e.g. frequencies, transmit power,purpose)
NIA
2.5 Roof Pictures: Take numerous pictures! Suggested photos:
3Doc: BNDCE03f I Rev: 4 |10/15/98 Prep: Todd Pearson
File: QSE Web Page, Customer Engineering Appr: T. J. LeCompte
Broadband Wireless Access19111 N. Dallas Pkwy. Ste. 200 NORTELDa"asTexas75287 NETWORKSPage 5 of 11
1 Existing RF equipment 5. Location of cable entry to roof2. Existing antennas 6. Any cable run barriers3. Roof projectionslscreenslbarriers 7. Power source4. View from each CPE to base 8. Roof Access
(Photos are not necessary if videotape is being used, indicate exposures taken)
Was video tape taken? YES
2.6 Roof Sketch:Sketch rooftop footprint on following page: Include location of:1. Cable entry at roof 7. Indicate mag.north direction2. Rooftop power location S.Dimensions as necessary3. All existing AIC units 9. Front of building4. All screens or barriers 10. Surrounding streets5. All existing antenna masts6. All existing vents, any equipment located or projecting from rooftop
Roof Top NotesfExplain any other relevant information about the rooftop necessary)Due to the requrements of the building owner, any drillings or permanent changes tostructures should be avoided. Thus the maximum use of all existing cable runs andrisers was considered. The pipes to be provided on the roof top should not utilised anyDrilling or breaking of the walls or floor. Bracket-based solutions should be considered
Rooftop Sketch:
Doc: BNDCE03fFile: QSE Web Paqe,
| Rev; 4 10/15/98
Customer Engineering
Prep:Appr:
Todd PearsonT. J. LeCompte
Broadband Wireless Access19111 N. Dallas Pkwy. Ste. 200
"** NETWORKSPage 6 of 11
Rooftop Sketch:
J^oc: BNDCE03f | Rev; 4 | 10/15/98__File: QSE Web Page, Customer Engineering
PrepTTodd PearsonAppr: T. J. LeCompte
Broadband Wireless Access19111 N. Dallas Pkwy, Ste. 200Dallas, Texas 75287
Page 7 of 11
NORTELNETWORKS
3.0 Digital Equipment Room:
Location:Floortt:
Room#Location Description
725
Room has HVAC? YES
Room has raised computer floor ? YES
This room was selected as it has an existing cable trunking to the roof.
Type ofroom:(e.g. mechanical,electrical, janitor,Media World. (Multimedia apps room).
elevator, telephone room)
Keys Required? \ YES
Key Source Mr. Eric Lo Phone Number (852) 2609-8358
Security Card required to get into digital room?(If card is required indicate source)
Indicate location where equipment is to be installed:(floor,table, wall mount, other)Either on rack or table. Yet to be finalised by the persons responsible.
(Indicate any existing equipment which installation needs to be awarea problem to the installation)
NO
of/or posses
Doc: BNDCE03f
File: QSE Web Page,
I Rev: 4 10/15/98
Customer Engineering
Prep: Todd PearsonAppr: T. J. LeCompte
Broadband Wireless Access19111 N. Dallas Pkwy. Ste. 200Dallas, Texas 75287
Page 8 of 11
NORTELNETWORKS
3.1 Power:Note: Each site requires a separate dedicated circuit
Base equipment location has dedicated circuit:
CPE equipment location has dedicated circuit:
UPS Power available:
Notes:
Required by Customer
NIA
3.2 Room Pictures
1. Any existing equipment2. General layout of room3. Cable entry to room
(Photos are not necessary if videotape is being used), Indicate exposures taken
Was video tape taken?
3.3 Room SketchSketch Footprint of digital equipment room on following page. Include:
1. Door locations & Swing2. Power outlet locations3. Any existing equipment on floor or walls4. Any gas, water, pipes5. Any obstructions
Doc:File'
BNDCE03fQSE Web Page,
I Rev: 4Customer Engineering
10/15/98 Prep:Appr:
I oddT. J.
PearsonLeCornpte
Broadband Wireless Access19111 N. Dallas Pkwy. Ste. 200
~™ NETWORKSPage 9 of 11
Digital Room Sketch:
Doc:JFile:
BNDCE03fQSE Web Page, Customer
[Rev: 4 jEngineering
10/15/98 Prep:Appi.
ToddT J.
PearsonLeCompte
Broadband Wireless Access19111 N. Dallas Pkwy. Ste. 200Dallas, Texas 75287
Page 10 of 11
NORTELNETWORKS
4.0 Cabling: (List the length of each cable separately with proper identification ifbasestation)
Outdoor cable run from roof mast to cable bldg. entry:1 51m2.3.4.
Inner building cable run from digital equipment room entry to outdoor cable exit1 20m2.3.4.
Indoor cable run from cable bldg. entry to digital equipment1 22m2.3.4.
Total Cable Length 93 m
Cable length required to connect the digital equipment and the IF equipment This isCritical!! Be aware of any obstacles the cable must go around, requirements fromBuilding management-note, sketch or photograph these.
Cable runs already existing:Explain:
Plenum cable required indoor
Lightning arrestor existing:
Other cable type required indoorIndicate type:
NO
\r NIA
The digital equipment will be located on the sixth floor Room 606. The cable run fromthe NIU to the digital equipment will be using existing hub ports. Room 606 is the labfor Centre of Innovation and Technology.
Doc:File:
BNDCE03f
QSE Web Page,
Rev: 4
Customer Engineering
10/15/98 Prep:Appr.
I oddT.J.
PearsonLeCompte
Broadband Wireless Access19111 N. Dallas Pkwy. Ste. 200Dallas, Texas 75287
Page 11 of 11
NORTELNETWORKS
4.1 Cable Routing Sketch:If necessary, sketch the routing of the IF cable
4.2 Existing Cable Riser: Identify any existing cable risers or other cable penetrations onthe rooftop.
YESA. Are there existing cable risers or trays? Iypo
B. Can it be used I
C. Record the contents of any existing risers that are to be used for this installation.Appropriate video should be taken of the risers.
New cable pipes must be provided on the roof top to house the IF cables from CPE tothe cable riser.
D* Record the dimensions of any existing cable risers.0.95 m X 1.20m
E. Are there any new cable risers, cable trays or rooftop penetrations needed? If yes,describe below.
NO apart from the additional PVC pipe in the riser.
Doc-File'
BNDCE03fQSE Web Page,
Rev; 4Customer Engineering
10/15/98 Pre^Appr:
I oddT.J.
PearsonLeCompte

Broadband Wireless Access19111 N. Dallas Pkwy. Ste. 200Dallas, Texas 75287
Pagel of 11
NORTELNETWORKS
SITE SURVEY
SITE NAME: The Chinesa University of Hong Kong [DATE: 5-NOV-1999
SITE CODE:SURVEYORS NAME: Matumoto, Nakagawa, KG LeeBASE CPECUSTOMER: HKNet Company Limited.CUSTOMER CONTACT: Mr. David Wong
PHONE # (852)2110-3388FAX# (852) 2110-0078CELL PHONE#
BUILDING NAME: Ho Sin Hang Engineering BuildingBUILDING MANAGEMENT CONTACT: Mr. Patrick Lee Wing Ka
PHONE # (852) 2609 8218FAX# (852) 2603 7327CELL PHONE#
SITE ADDRESS: The Chinese University of Hong Kong, Shatin, N.T. Hong Kong.
ELEVATION: N/A
1.0 BUILDING INFORMATION(Can be determined by measurement with laser range finder.)
Tip of BTR antenna •
ANTENNA HEIGHT(AGL):
2.82m
Measurement#2 177.5 m
• point at which distances aremeasured with laser range finder
ITip of CPE2 antenna
Measurement #1 177.5m
BUILDING NOTESNIA
Doc-
Re'BNDCEOSf
QSE Web Page,
Rev: 4 10/15/98
Customer Engineering
Prep:Appr:
I oddI. J.
PearsonLeCompte
Broadband Wireless Access19111 N. Dallas Pkwy. Ste. 200Dallas, Texas 75287
Page 2 of 11NETWORKS
FLOOR HEIGHT: 48m (AGL) NUMBER OF FLOORS: 10 + RoofLOADING DOCK AVAILABLE: NoBUILDING ACCESS HOURS: 09:00 to 17:00
Record any doorway widths which may present an obstacle for the equipment.NIA
2.0 ROOFTOP INFORMATION:
2.1 Rooftop Access:
INTERNAL orEXTERNAL
INTERNAL
KEYS REQUIRED? No
TYPE OF ACCESS: (fit, elev., stairway, int-ladder, ext. ladder, ladder req.)StairwayDoes freight elevator go to rooftop? NoIs Escort Required? NO
Ease of Access (Note any dangerous ledges, etc, that might impede installation):No major obstructions.
2.2Antenna Masts:
Antenna Mast Co-ordinates: (WGS-84)
Latitude:Degrees
22Minutes
25Seconds
05 N
Degrees114
Minutes12
Seconds28 £
Doc:File:
BNDCE03fQSE Web Page, Customer
I Rev: 4Engineering
10/15/98 Prep:_Appr:
I oddI.J.
PearsonLeCompte
Broadband Wireless Access19111 N. Dallas Pkwy. Ste. 200 NORTELDallas, Texas 75287 ^ ** Ijc-rtA^n M€?"
NETWOItiCSPage 3 of 11
A/ofe location where coordinates recorded:See rooftop layout
Bearing to Base: (if site is a CPE)
Magnetic 327 NW
Existing Masts? No | Can we use them? N/A
Existing mast diameters: N/A(Obtain mast specifications and mechanical drawings, if possible)
Type of existing mast: N/A
Are Masts Grounded? N/ASection of existing mast available: N/A
Antenna Masts Required? N/A
Specifiy recommeded type: Wall mounted (bracket support) 114 mm dia. Gl Pipe.
Is there line of sight? \ YES
(Only applies if site is a CPE. If line of sight does not exist provide appropriateexplanation of problem. Explain any potential problems with existing LOS.)No major problems or obstructions.
Is any View Overlooking Water? NO
Doc:File:
BNDCE03fQSE Web Page,
Rev; 4 10/15/98
Customer Engineering
Prep:.Appr:
I oddT.J.
PearsonLeCompte

Broadband Wireless Access19111 N. Dallas Pkwy. Ste. 200Dallas, Texas 75287
Page 4 of 11
NORTELNETWORKS
(If site is a CPE this would be the LOS to basestation)
Are there any nearby metallic structures? (If yes describe)
A satellite dish is located at the back (when facing the BTR) of the CPE antenna.
2.3 Power:
Existing rooftop power available for use?
If no, note location of the closet power source available:Possible available from power utility room on the roof. (Was locked during the survey).
2.4 Existing Transmitters or Receivers? YES, A CS dish.
If yes, does existing equipment pose an RF interferenceproblem to this installation? (YES, NO, OR UNABLE TO DETERMINE)
NO
Does existing equipment pose a radiation hazard?NO
(If possible, obtain relevant information of existing equipment that poses aninterference problem to this installation, e.g. frequencies, transmit power,purpose)
NIA
2.5 Roof Pictures: Take numerous pictures! Suggested photos:Doc: BNDCEOSf | Rev: 4 | 10/15/98File; QSE Web Page, Customer Engineering 3 Prep: Todd Pearson
Appr: T. J. LeCompte

Broadband Wireless Access19111 N. Dallas Pkwy. Ste. 200 NORTEL03,-as, Texas 75287 NETWORKS'
Page 5 of 11
1 Existing RF equipment 5. Location of cable entry to roof2. Existing antennas 6. Any cable run barriers3. Roofprojectionslscreenslbarriers 7. Power source4. View from each CPE to base 8. Roof Access
(Photos are not necessary if videotape is being used, indicate exposures taken)
Was video tape taken? YES
2.6 Roof Sketch:Sketch rooftop footprint on following page: Include location of:1. Cable entry at roof 7. Indicate mag.north direction2. Rooftop power location S.Dimensions as necessary3. All existing AIC units 9. Front of building4. All screens or barriers 10. Surrounding streets5. All existing antenna masts6. All existing vents, any equipment located or projecting from rooftop
Roof Top NotesfExplain any other relevant information about the rooftop necessary)Due to the requrements of the building owner, any drillings or permanent changes tostructures should be avoided. Thus the maximum use of all existing cable runs andrisers was considered. The pipes to be provided on the roof top should not utilised anyDrilling or breaking of the walls or floor. Bracket-based solutions should be considered
Rooftop Sketch:
Doc: BNDCEOSf | Rev: 4 |1 0/1 5/98
File: QSE Web Page, Customer Engineering
Prep: Todd PearsonAppr: 1f. J. LeCompte
Broadband Wireless Access19111 N. Dallas Pkwy. Ste. 200Dallas, Texas 75287
Page 6 of 11
NORTELNETWORKS
Doc: BNDCEOSf \ Rev: 4 10/15/98
File". QSE Web Page, Customer Engineering
Prep: Todd PearsonAppr: T. J. LeCompte

Broadband Wireless Access19111 N. Dallas Pkwy. Ste. 200Dallas, Texas 75287
Page 7 of 11
NORTELNETWORKS
3.0 Digital Equipment Room:
Location:Floor#:
Room#Location Descri
7
725
ption
Room has HVAC? YES
Room has raised computer floor ? YIES
This room was selected as it has an existing cable trunking to the roof.
Type ofroom:(e.g. mechanical,electrical, janitor, elevator, telephone room)Media World. (Multimedia apps room).
Keys Required? \ YES
Key Source Mr. Eric Lo Phone Number (852) 2609-8358
Security Card required to get into digital room?(If card is required indicate source)
Indicate location where equipment is to be installed:(floor,table, wall mount, other)Either on rack or table. Yet to be finalised by the persons responsible.
(Indicate any existing equipment which installation needs to be awarea problem to the installation)
NO
of lor posses
Doc:File:
BNDCE03fQSE Web Page,
Rev: 4Customer Engineering
| 10/15/98 Prep:Appr:
I oddT. J
PearsonLeCompte
Broadband Wireless Access19111 N. Dallas Pkwy. Ste. 200Dallas, Texas 75287
Page 8 of 11
NORTELNETWORKS
3.1 Power:Note: Each site requires a separate dedicated circuit
Base equipment location has dedicated circuit:
CPE equipment location has dedicated circuit:
UPS Power available:
Notes:
Required by Customer
NIA
3.2 Room Pictures
1. Any existing equipment2. General layout of room3. Cable entry to room
(Photos are not necessary if videotape is being used), Indicate exposures taken
Was video tape taken?
3.3 Room SketchSketch Footprint of digital equipment room on following page. Include:
1. Door locations & Swing2. Power outlet locations3. Any existing equipment on floor or walls4. Any gas, water, pipes5. Any obstructions
Doc: BNDCEOSfFile: QSE Web Page,
I Rev: 4 10/15/98
Customer Engineering
Prep:Appr;
Todd PearsonT. J. LeCompte
Broadband Wireless Access19111 N. Dallas Pkwy. Ste. 200
"** NETWORKSPage 9 of 11
Digital Room Sketch:
Doc: BNDCE03fFile: QSE Web Page,
I Rev: 4 10/15/98
Customer Engineering
Prep: Todd PearsonAppr: T. J, LeCompte
Broadband Wireless Access19111 N. Dallas Pkwy. Ste. 200Dallas, Texas 75287
Page 10 of 11
NORTELNETWORKS
4.0 Cabling: (List the length of each cable separately with proper identification ifbasestation)
Outdoor cable run from roof mast to cable bldg. entry:1. 31m2.3.4.
Inner building cable run from digital equipment room entry to outdoor cable exit1. 20m2.3.4.
Indoor cable run from cable bldg. entry to digital equipment1 22m2.3.4.
Total Cable Length 73 m
Cable length required to connect the digital equipment and the IF equipment This isCritical!! Be aware of any obstacles the cable must go around, requirements fromBuilding management-note, sketch or photograph these.
Cable runs already existing:Explain:
Plenum cable required indoor
Lightning arrester existing:
Other cable type required indoorIndicate type:
NO
>r NIA
The digital equipment will be located on the sixth floor Room 606. The cable run fromthe NIU to the digital equipment will be using existing hub ports. Room 606 is the labfor Centre of Innovation and Technology.
Doc:
File:BNDCEOSf
QSE Web Page,
Rev: 4 10/15/98
Customer Engineering
Prep^Appr:
I oddI . J,
PearsonLeCompte
Broadband Wireless Access19111 N. Dallas Pkwy. Ste. 200Dallas, Texas 75287
Page 11 of 11
NORTELNETWORKS
4.1 Cable Routing Sketch:If necessary, sketch the routing of the IF cable
4.2 Existing Cable Riser: Identify any existing cable risers or other cable penetrations onthe rooftop.
A. Are there existing cable risers or trays?
VF^B. Can it be used \ ri=0
C. Record the contents of any existing risers that are to be used for this installation.Appropriate video should be taken of the risers.
New cable pipes must be provided on the roof top to house the IF cables from CPE tothe cable riser.
D. Record the dimensions of any existing cable risers.0.95m X 1.20 m
E. Are there any new cable risers, cable trays or rooftop penetrations needed? If yes,describe below.
NO apart from the additional PVC pipe in the riser.
Doc: BNDCEOSf Rev: 4 10/15/98
File: QSE Web Page, Customer Engineering
Prep: Todd PearsonAppr: T. J. LeCompte

Appendix 2 - Engineering Packages

Broadband Wireless Access19111 N Dallas Pkwy, Ste 200Dallas, TX 75287
ENGINEERING PACKAGE
EngPkgNo [HKHKCOINOTLOOQI
BWASitelD IHKHKC01NOTL
ENG PKG INFORMATION: 1-888-815-6819
CUSTOMER INFORMATION
Customer Name
Customer Site ID
Site Address
Site Address Line 2
Site City
Site State
Site ZIP
Country
Site Contact
Site Contact Ph No
Contact Pager No
[Teligent
|Pi Ch'iu
Pi Ch'iu Building
Ihong Kong
SHIPPING INFORMATION
Ship To Address
Ship To Address Line
City
State
ZIP
PROJECT INFORMATION
COEO Number INYQ96-00
Project Name |NNE installation
Project Description
This project installs one Reunion seismic cabinet withone Master chassis along with associated equipmentand hardware. Only one sector, A, supporting twoCPEs will be installed during this phase. Please seethe "Install Notes" for additional information.
BWA PROJECT TEAMS
Project Manager
Project RF Engineer
RF Eng Phone No
Project Application Engineer
App Engr Phone No
Victoria Hager
|Mohamed Bah
|(972) 362-8186"
Project Installation Supervisor
Data Engineer
Data Eng Phone No |(972)362-813?
|Kun Qian
11/15/991-38:48 PM BWA/CE-99:2150 Rev

Broadband Wireless Access19111 N Dallas Pkwy, Ste 200Dallas, TX 75287 NETWORKS
Eng Pkg Number
Installation Notes
HKHKC01NOTL0001
INSTALLATION NOTES
BWA Site ID HKHKC01NOTL
) This project installs one Reunion Cabinet along with one DSC 5020chassis for the Hong Kong Teligent trial project Only one 90 degreesector will be installed along with two CPE's at this time. BothCPEs are in the same building (Ho Sin Hang). Please see theantenna page, the 5020 DSC layout, SMM/SDM port assignments,the VPI/VCI report, and the enclosed wiring diagram for furtherinstallation details.
Complete serial numbers and cable loss information should besupplied to RF Engineering via email before specific RF calculationson required pads and attenuators can be provided to installation.See enclosed blank form for exact information required.
i Questions on this package can be addressed to Mohamed Bahat 972-362-8186, ESN 442-8186.
11/15/991.39:32 PM J3WA/CE-99-215q Rev | 1 0
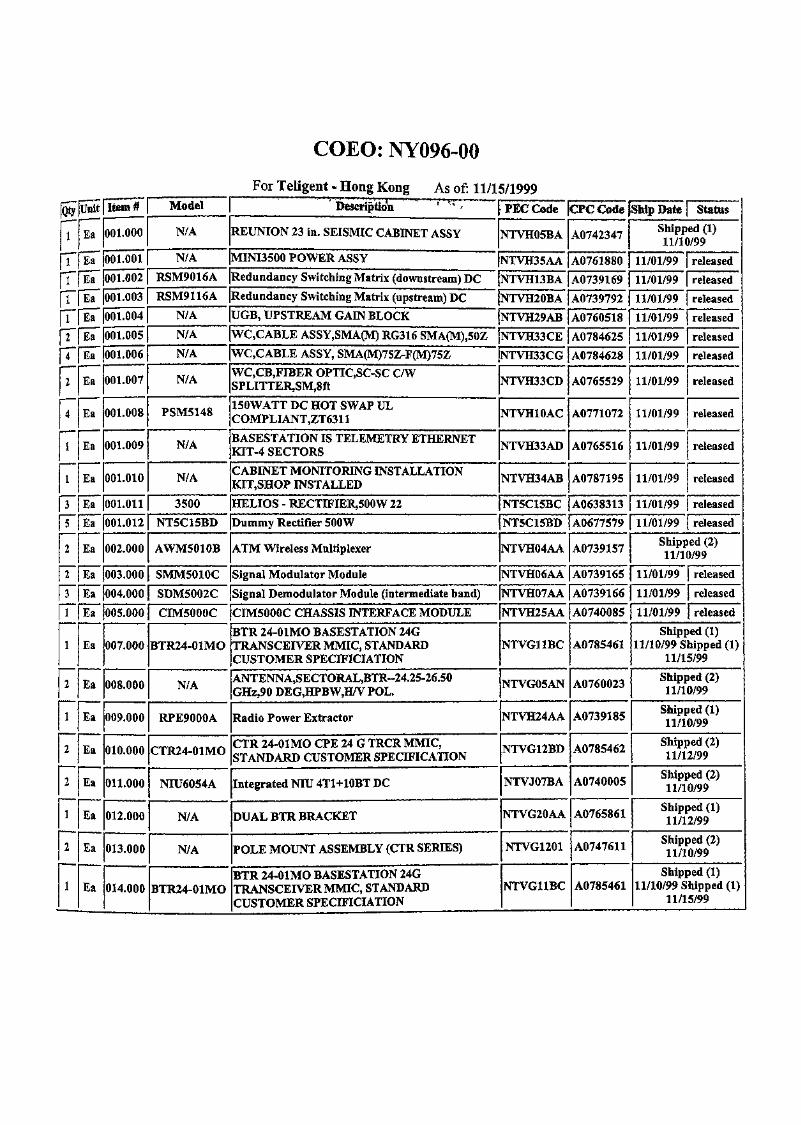
COEO: NY096-00
For Teligent - Hong Kong As of: 11/15/1999--WW.
Iw
Frr[T
F4
1
FFrr
1
2
1
2
2
1
2
1
Uait
Ea
Ea
Ea
Ea
Ea
Ea
Ea
Ea
Ea
Ea
Ea
Ea
Ea
Ea
Ea
Ea
Ea
Ea
Ea
Ea
Ea
Ea
Ea
Ea
Ea
fitoF001.000
001.001
001.002
001.003
001.004
001.005
001.006
001.007
001.008
001.009
001.010
001.011
001.012
002.000
003.000
Model
N/A
N/A
Befccrif Sola r ^ ' f PEC Code
REUNION 23 in. SEISMIC CABINET ASSY
MINI3500 POWER ASSY
RSM9016A [Redundancy Switching Matrix (downstream) DC
RSM9 1 1 6 A (Redundancy Switching Matrix (upstream) DC
N/A
N/A
UGB, UPSTREAM GAIN BLOCK
WQCABLE ASSY,SMA(M) RG316 SMA(M),50Z
NTVH05BA
NTVH35AA
NTVH13BA
€?C€0iie)s^'l>ate'
A0742347
A0761880
A0739169
NTVH20BA JA0739792
NTVH29AB
NTVH33CE
N/A |WC,CABLE ASSY, SMA(M)75Z-F(M)75Z JNTVH33CG
N/A
PSM5148
N/A
N/A
3500
WC,CB,FIBER OPTIQSC-SC C/WSPLITTER,SM,8ft
150WATT DC HOT SWAP ULCOMPLIANT,ZT631 1
BASESTATION IS TELEMETRY ETHERNETKIT-4 SECTORS
CABINET MONITORING INSTALLATIONKIT,SHOP INSTALLED
HELIOS - RECTIFIER,500W 22
NT5C 1 5BD (Dummy Rectifier 500 W
AWM5010B ATM Wireless Multiplexer
SMM5010C [Signal Modulator Module
004.000 | SDM5002C (Signal Demodulator Module (intermediate band)
005.000 j CIM5000C
007.000
008.000
009.000
010.000
011.000
012.000
013.000
014.000
BTR24-01MO
N/A
RPE9000A
CTR24-01MO
NIU6054A
N/A
N/A
BTR24-01MO
CIM5000C CHASSIS INTERFACE MODULE
BTR 24-01MO BASESTATION 24GTRANSCEIVER MMIC, STANDARDCUSTOMER SPECIFICATION
ANTENNA,SECTORAL,BTR--24.25-26.50GHz,90 DEG,HPBW,H/V POL.
Radio Power Extractor
CTR 24-01MO CPE 24 G TRCR MMIC,STANDARD CUSTOMER SPECIFICATION
Integrated NIU 4T1+10BT DC
DUAL BTR BRACKET
POLE MOUNT ASSEMBLY (CTR SERIES)
BTR 24-01MO BASESTATION 24GTRANSCEIVER MMIC, STANDARDCUSTOMER SPECIFICATION
NTVH33CD
NTVH10AC
NTVH33AD
NTVH34AB
NT5C15BC
NT5C15BD
NTVH04AA
NTVH06AA
NTVH07AA
NTVH25AA
NTVG11BC
NTVG05AN
NTVH24AA
NTVG12BD
NTVJ07BA
NTVG20AA
NTVG1201
NTVG11BC
Status
Shipped (1) j11/10/99
11/01/99
11/01/99
11/01/99
A0760518 | 11/01/99
A0784625
A0784628
A0765529
A0771072
A0765516
A0787195
A0638313
A0677579
A0739157
A0739165
A0739166
A0740085
A0785461
A0760023
A0739185
A0785462
A0740005
A0765861
A0747611
A0785461
11/01/99
11/01/99
11/01/99
11/01/99
11/01/99
11/01/99
11/01/99
11/01/99
released
released
released
released
released
released
released
released
released
released
released
released
Shipped (2)11/10/99
11/01/99
11/01/99
11/01/99
released
released
released
Shipped (1)11/10/99 Shipped (1)
11/15/99
Shipped (2)11/10/99
Shipped (1)11/10/99
Shipped (2)11/12/99
Shipped (2)11/10/99
Shipped (1)11/12/99
Shipped (2)11/10/99
Shipped (1)11/10/99 Shipped (1)
11/15/99
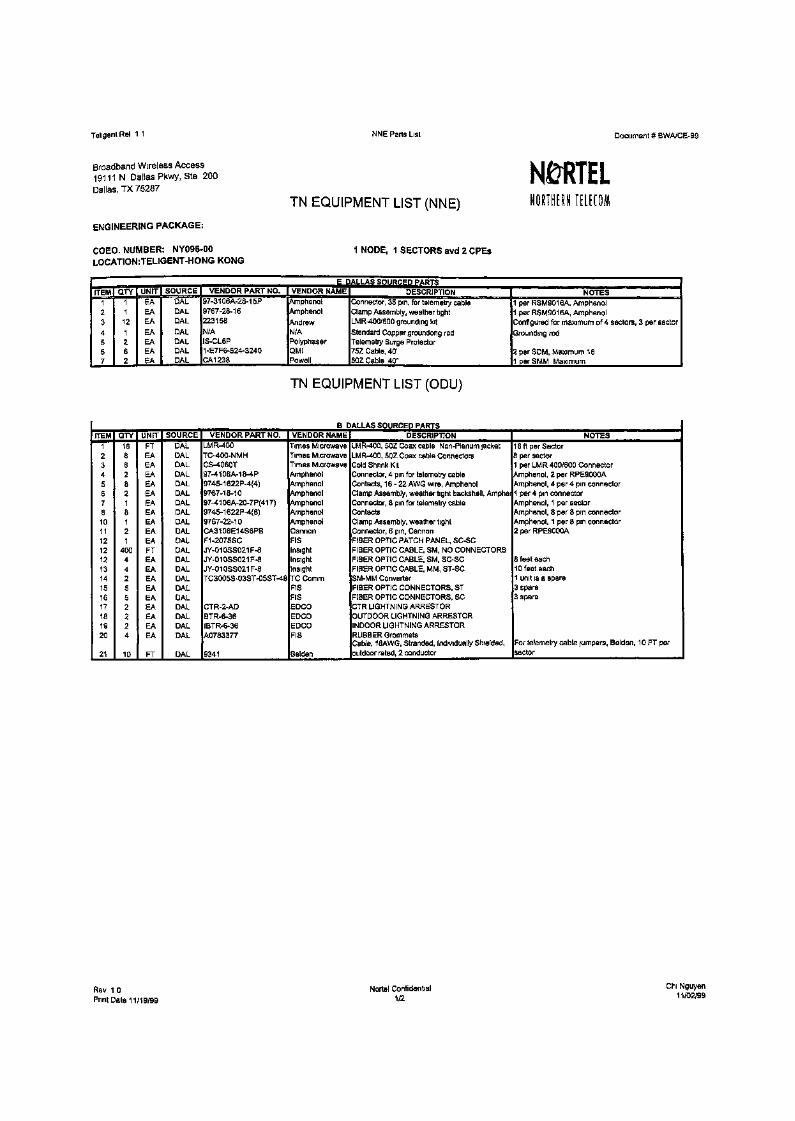
Teligent Rel 1 1 NNE Parts List Document # BWA/CE-99
Broadband Wireless Access19111 N Dallas Pkwy, Ste 200Dallas, TX 75287
ENGINEERING PACKAGE:
COEO. NUMBER: NY096-00LOCATION:TELIGENT-HONG KONG
TN EQUIPMENT LIST (NNE)
N&RTELN O R T H E m T E L E C O M
1 NODE, 1 SECTORS avd 2 CPEs
E DALLAS SOURCED PARTSITEM
1234567
QTY1112
1262
UNIT | SOURCE
EAEAEA
EAEAEAEA
DALDALDAL
DALDALDALDAL
VENDOR PART NO.97-31 06A-28-15P9767-28-16223158
N/AIS-CL6P1-E7F6-524-3240CA1238
VENDOR NAMEAmphenolAmphenol
AndrewN/APolyphaserQMIPowell
DESCRIPTIONConnector, 35 pin, for telemetry cableClamp Assembly, weather tightLMR-400/600 grounding kit
Standard Copper groundong rodTelemetry Surge Protector75Z Cable, 40'50Z Cable 40"
NOTES1 per RSM9016A, Amphenol1 per RSM9016A, AmphenolConfigured for maximum of 4 sectors, 3 per sector
Grounding rod
2 per SDM, Maximum 181 perSMM Maximum
TN EQUIPMENT LIST (ODU)
B DALLAS SOURCED PARTSITEM
1234
567810111212121314151617181920
21
QTY
168828218121
400442552224
10
UNITpT
EAEAEAEAEAEAEAEAEAEAFTEAEAEAEAEAEAEAEAEA
FT
SOURCE
DALDALDALDALDALDALDALDALDALDALDALDALDALDALDALDALDALDALDALDALDAL
DAL
VENDOR PART NO.LMR-400TC-400-NMHCS-4060T97-41 06A-18-4P9745-1 622P-4(4)9767-18-1097-4106A-20-7P(417)9745-1 622P-4(8)9767-22-10CA3106E14S6PBF1-2075SCJY-010SS021F-8JY-010SS021F-8JY-010SS021F-8TC3005S-03ST-05ST-48
CTR-2-ADBTR-6-36IBTR-6-36A0783377
9341
VENDOR NAME
Times MicrowaveTimes MicrowaveTimes MicrowaveAmphenolAmphenolAmphenolAmphenolAmphenolAmphenolCannonFISInsightInsightInsightTC CommFISFISEDCOEDCOEDCOFIS
Belden
DESCRIPTIONLMR-400, 50Z Coax cable Non-Plenum jacketLMR-400, 50Z Coax cable ConnectorsCold Shrink KitConnector, 4 pin for telemetry cableContacts, 16-22 AWG wire, AmphenolClamp Assembly, weather tight backshell, AmpheiConnector, 8 pin for telemetry cableContactsClamp Assembly, weather tightConnector, 6 pin, CannonFIBER OPTIC PATCH PANEL, SC-SCFIBER OPTIC CABLE, SM, NO CONNECTORSFIBER OPTIC CABLE, SM, SC-SCFIBER OPTIC CABLE, MM, ST-SCSM-MM ConverterFIBER OPTIC CONNECTORS, STFIBER OPTIC CONNECTORS, SCCTR LIGHTNING ARRESTOROUTDOOR LIGHTNING ARRESTORINDOOR LIGHTNING ARRESTORRUBBER GrommetsCable, 18AWG, Stranded, Individually Shielded,outdoor rated, 2 conductor
NOTES16 ft per Sector8 per sector1 per LMR 400/600 ConnectorAmphenol, 2 per RPE9000AAmphenol, 4 per 4 pin connector1 per 4 pin connectorAmphenol, 1 per sectorAmphenol, 8 per 8 pin connectorAmphenol, 1 per 8 pin connector2 per RPE9000A
8 feet each10 feet each1 unit is a spare3 spare3 spare
For telemetry cable jumpers, Belden, 10 FT persector
Rev 1 0
Pnnt Date 11/19/99
Nortel Confidential1/2
Chi Nguyen11/02/99
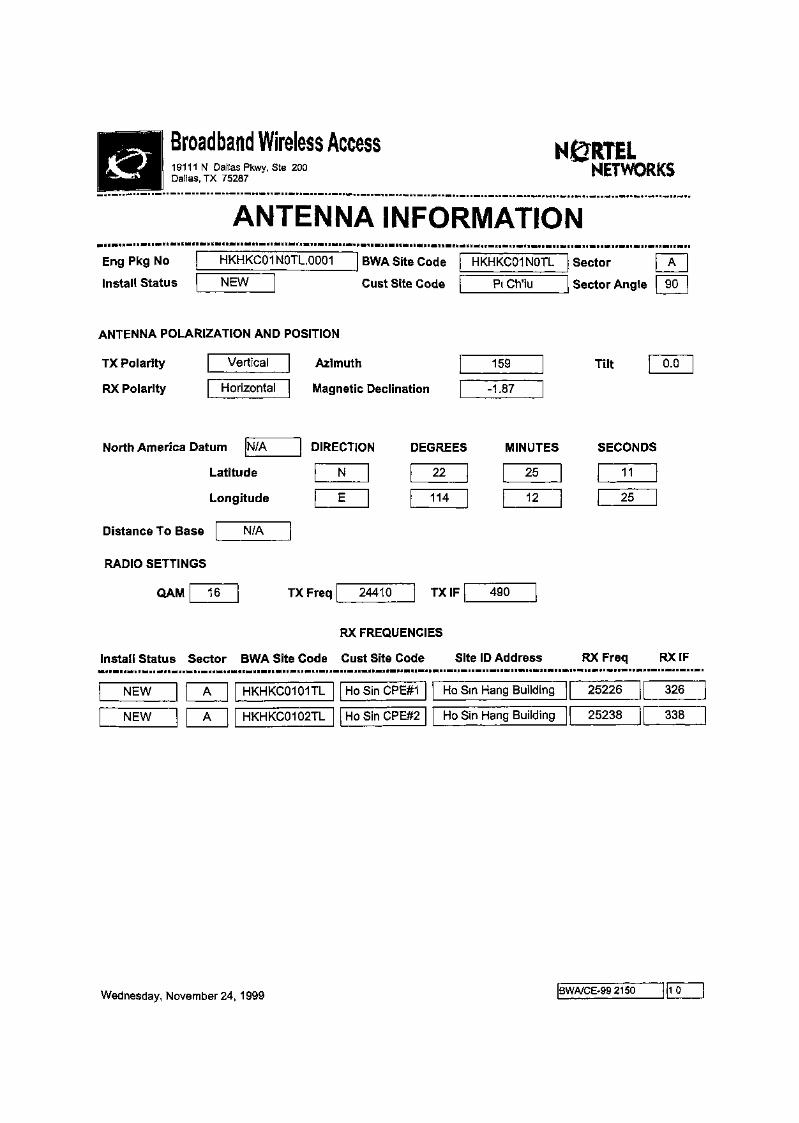
Broadband Wireless Access19111 N Dallas Pkwy, Ste 200Dallas, TX 75287
N&RTILNETWORKS
ANTENNA INFORMATIONEng Pkg No
Install Status
HKHKC01NQTL.0001 [ BWA Site Code | HKHKC01NOTL [ Sector
NEW | Gust Site Code | P\ Ch'iu | Sector Angle
ANTENNA POLARIZATION AND POSITION
TX Polarity
RX Polarity
Azimuth
Magnetic Declination
Tilt
North America Datum
Latitude
Longitude
Distance To Base
RADIO SETTINGS
QAM
DIRECTION
TX Freq
DEGREES
TXIF
MINUTES
RX FREQUENCIES
Install Status Sector BWA Site Code Cust Site Code Site ID Address
SECONDS
RX Freq RX IF
NEW
NEW
A
A
HKHKC0101TL
HKHKC0102TL
Ho Sin CPE#1
Ho Sin CPE#2
Ho Sin Hang Building
Ho Sin Hang Building
25226
25238
326
338
Wednesday, November 24,1999 BWA/CE-992150 JIlL
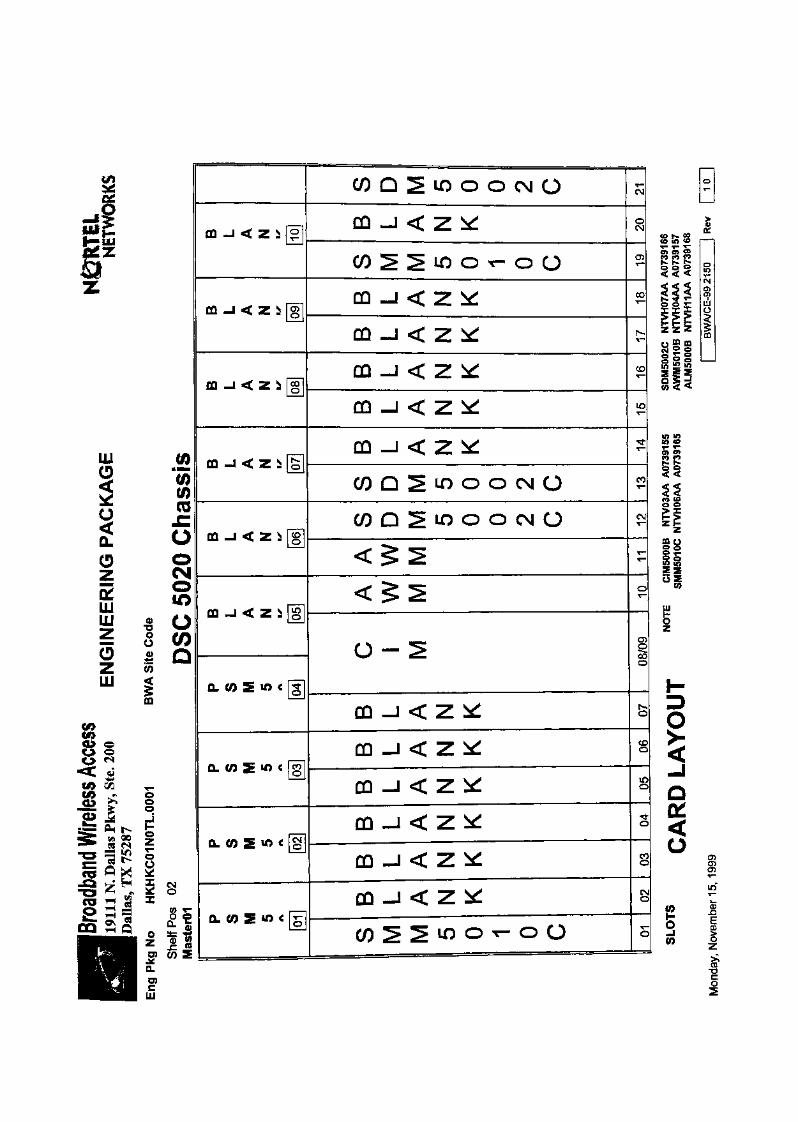
LJJO
oCL
OzLtLLJLLJ
zLLJ
•aoO
V)
ICO
V)"55t/>«JJ=O0CMOto0(0Q
S
CO -I < Z i[J[|
CO -1 < Z i [§]
00 -J < Z i[§]
00 -1 < Z i [j|]
00 -J < Z i [§]
CO -J< Z i[g]
Q. (0 S "0 < [g]
0. (0 5 «0 < [g]
CL CO 5 "> <[|[
Q. co s «o < [5"
t O Q ^ L O O O C M Q
CD -J < Z
C O ^ ^ L O O ^ O Q
CD -I < Z
CD -J < Z
CD -J < Z
CD -J < Z
CD — 1 < Z ^
C O O ^ i O O O C M O
C/5 r***i ^> Lf) ^5 CID c^ CJ)
<f * > ^ *
* I ^^ ^>
0-2
CD -J < Z
co -J < z *:CD -J < Z *
CD -J < Z
CO -J< Z
CD -i < Z
co^^ ioo-oo
c\i
SO5T—
00T-
tCD
LO
S
CO
CN
-
O
coc
feCD
LDO
O
CO
c\
o
£0 £0N. h-o o
O)
LLJ
1o85O S
S 2Jn
II55ro <oo o£ Z
s(0
HDO
o
1(0 i
CO"Dco
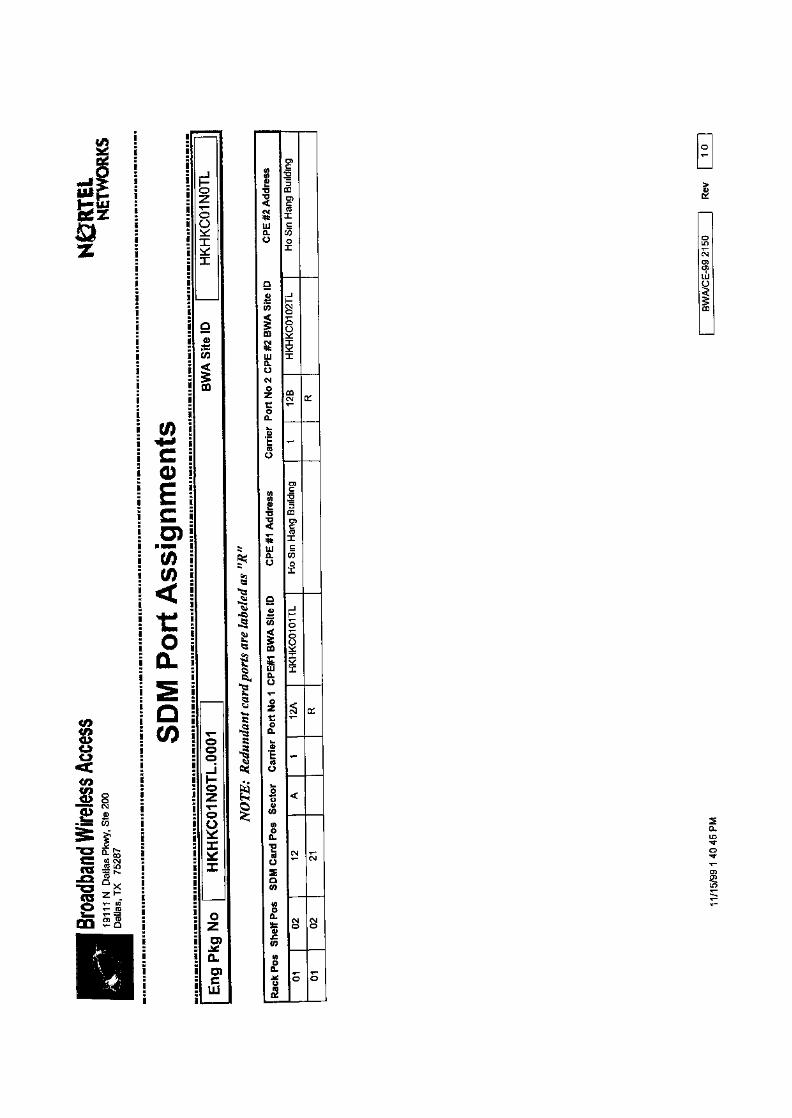
i j
COff«dl
cCD£ !C iO)!
amua
C/)
*COa.
Gtf\\& w
i
1_
0Z
D
*:X^
9
<J5^^5m
T-oooJG)
OijjCX^^X
ozD>
O.D)CLU
£
§
^
18<a
1E,"2
"R>§103r>jv^<
<
(A(0D5
ScUJLO
Q
2J0
iQ
UJQ.OCMOZt:0a.L.O
"Em
Addre
ss
^*,
LUCLO
aICO
1sQLO
O
-eoa.L.
(0O
Boo
CO
(AOQ."O<5O
Q(0
oa.
i(A
CL
"o
&
)
3)
_j
N
3
;=
3SJ
T-
»g B
uild
ing
5
zCOo
_j
3
8
X
S§
^
CM
8
T_
O
*•
«=
J^j
CMO
T-
o
oincsia>cr>UJ
I
CLIO*<fO
•
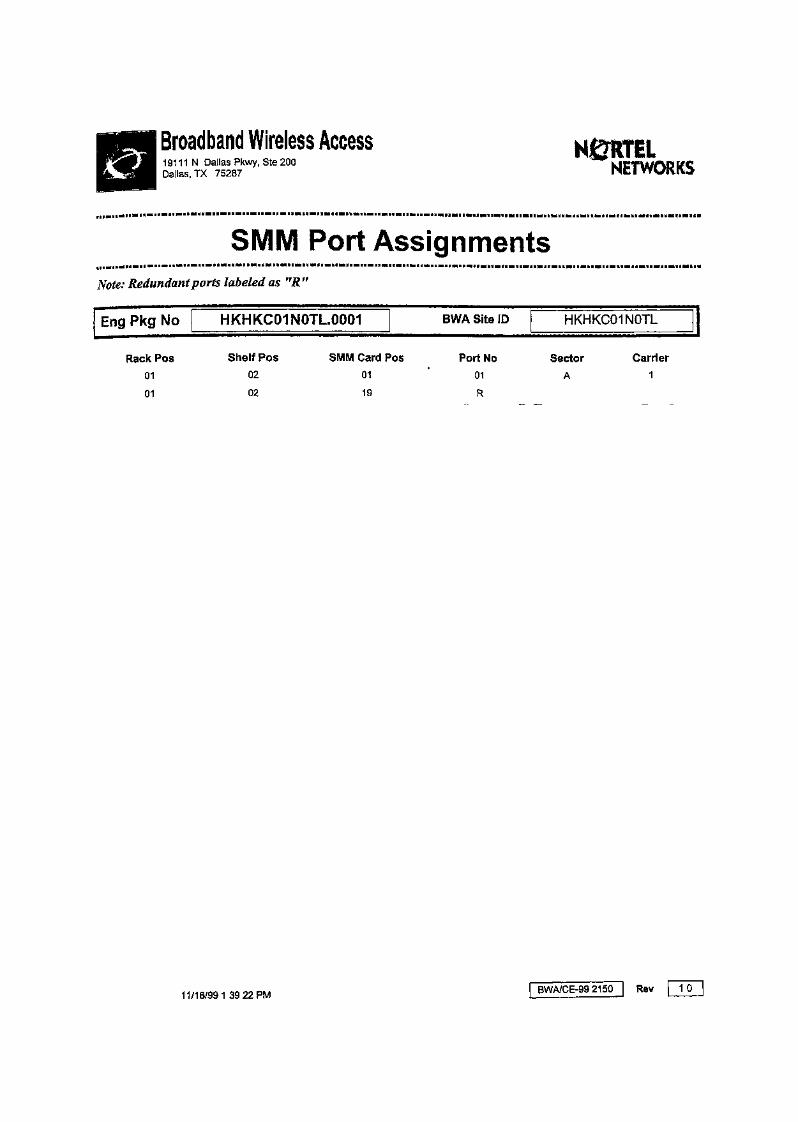
Broadband Wireless Access19111 N Dallas Pkwy, Ste 200Dallas, TX 75287
NORTELNETWORKS
SMM Port AssignmentsNote: Redundant ports labeled as "R "
Eng Pkg No HKHKC01NOTL0001 BWA Site ID HKHKC01NOTL
Rack Pos
01
01
Shelf Pos
02
02
SMM Card Pos
01
19
Port No
01
R
Sector
A
Carrier
1
11/16/991 3922PMBWA/CE-992150 Rev
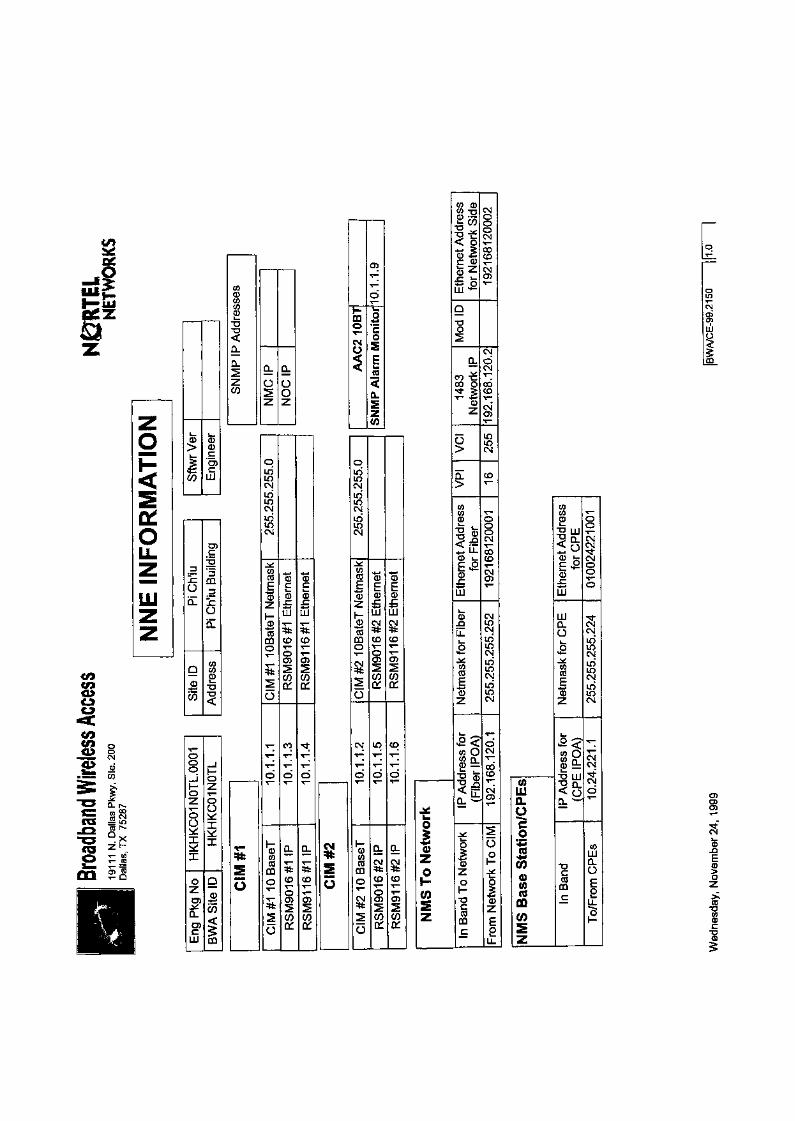
g501oLL
LU
v_
>CO
JZOQL
Q
W
§
O
o
X
X
o
5a.O)cLU
§"5)
O)cTD
m.26E
Add
ress
oZ
o0
X
Q
CO
GO
CO0CO
0
5
SN
MP
IP
5
o
CL
0
z
oLO"LOCN
LOCNLOLOCN
OB
ateT
Net
mas
k
x—
5o
C)
•5COCO
o
5
0
O0Z
"CD0JZLu
CD
%2COLT
CO
0
Q.
a*-
1 R
SM
9016?
"0
0
Lu
CD
CD
COa:
0*
a.
CD
5>
1
Ol
O
moV
CMO
OLOLOCN
^LOCN
OB
ateT
Net
mas
k
3
0
CN
CD
0
CO
o
£o
03
T—
CD
R
O
JSa.
U)
"0Ci_
0szLU
CDT-
^1
LO
CD
Q.
SCD
8COa:
16 #
2 E
ther
net
o>
1
CD
o"
Q.
$CD
5)
COa:
•£o
1®
0
CO
z
CO 0
£ a5"° j*T3 t *< O
"0 $
•?.c ^LU *-
Q
CL
io o
*" 0
o>
Et A
ddre
ssFi
ber
0 i-o **"
LLJ
0
Lu
vS
etm
ask
z
0^
*w O£9=
P
^§0
0
•oCO
CD
c
N5
DCN
D
CNO)T~
°4
N
COCD^__
N
LOLOCN
CDT—
8120001
CD
1
CNLOCNLOLOCNLOLOCNLOLOCN
OCN
00*CD
CNO)
2Oo
m N
etw
ork
T
2LL
(/)LUa.0
o"15
oas
COc/5
z
t Add
ress
CP
E0 kE-S0
6LU
LUQLo£J*:CO
"0z
0 —
0 9:T3 LU
< Q
T>
CO00
4221001
CM
8O
^CNLOLOCNLO*LOCN
sCN
CNCN
CNCDT-
COLU
To/F
rom
CP
LU
1
CDJD
CD
ICDC

LJJa.oc£*3
aCO0)(/)OS
CDCOs
9"8>
S3i)5
"5<55£
LUD
Z
DZs1_o - — .e/) /^C/3 jr0 QL•o5<Q_
O>
E
=1*DZ
-oCO00
-E
CO
D
CMCM
§
Z5
0
COT-
^^t
CMO
CMCO
0OCM
CN
T—
0
y:i^LI
\l^
CM
9
soo
CMT~
!^t-CMCD
COCO
8CM
h-
O
0O
IX.I
gOJ
gLLJO
I
O5O>05
0)>O
CDT3cno
I

gia:oLLZ
LU
O)
co ILLJ
SCJ oJSJ 8
O)cis
11Q- ,_
O
CL
O
si
O DoO) ±;
LU
(/}o>CL
1
PoZ
^fco
(D
9CDP1=CDQu>>
O
1£o
CL
CD
03Z
s?i
f&£
"O"0<C
Q
£CO
f£OQo
CDmCM
o
?2'3CDD)CCO
COoX
_jh-
o
| H
KH
KC
01
ftOQ0
0000CM
O
D)
1"5OQD>CCOX
COoX
_Jh-o
| H
KH
KC
01
a:03o
os0
O)
•a_.13
OQ
P
5
•1o
F!0
| H
KH
KC
O'
ftfODO
CMinCO
o
D)c2'5OQ
P
5C
COoX
F!0
| H
KH
KC
O'
a:OQo0coZ
8
CD
O)CT3n=3
OQ
r*Xc
CO0X
-J
o
| H
KH
KC
O'
o:OQ0
§"^
o
E5
2"3OQD)cCOX
COox
E!0
| H
KH
KC
O
rr:OQ0
800
o
?2._OQD)rCOX
CO0X
*0
| H
KH
KC
O
nrCO0
8
0
g2"3CDcncCOX.£COoX
_Jh-
| H
KH
KC
O
nrCD0
Io
D)C
I
CCO0X
Sio
| H
KH
KC
O
f±OQf)COcoz
fe
CD
s103
g
5
SOX
Sio
1 H
KH
KC
O
10
?4criO)
LU
I00
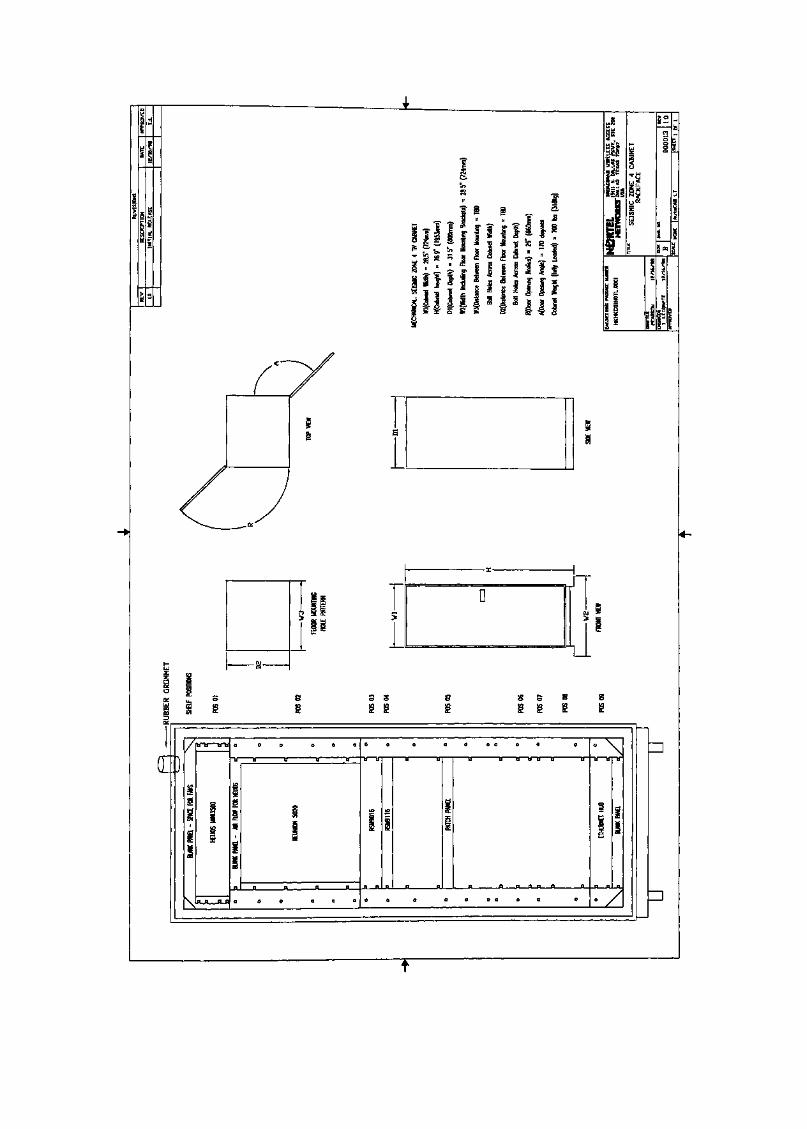
J 1
fe s 4
il
3 S
I1
_ZJ
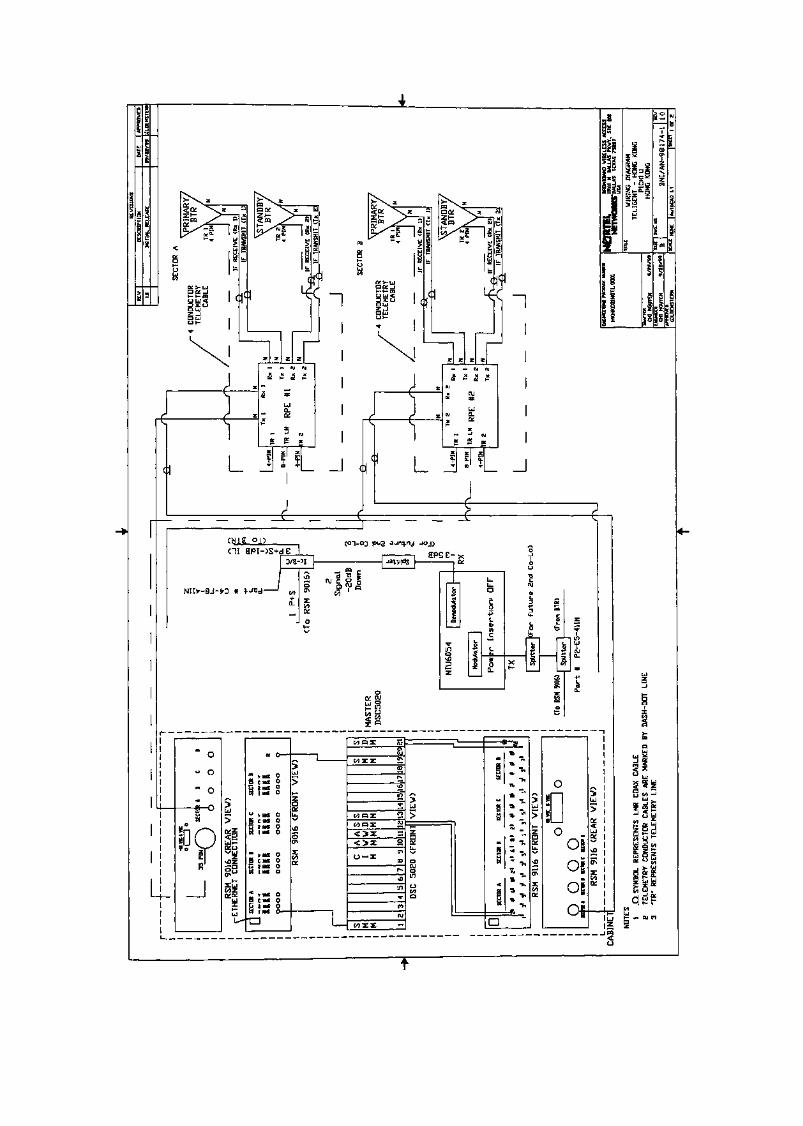
_l -2
a
§
su
H§
•>
W
BSG
•n
ae
MSMSMSMS
MSMSMSMS
MSMSMSMS
MSMSMS
]
0
O0OO
00O0
0OO0
000
3-d
^
zI^
vD
X
fconx S3S
C/JZZ £03
fv,
vD
in
S
Ox 2ON
(D
r-\0
in-ren
cVzz -
>u>
g
bO
O
ue»
-i 1
°
1H
Pb•8§
acu
a
LJU|
* ^-«Tl
« J"a K
* JT
* TU
•« ***~» **^> "% "**
-» "*"
O
oiofof
5"
a J° u
HE*> .
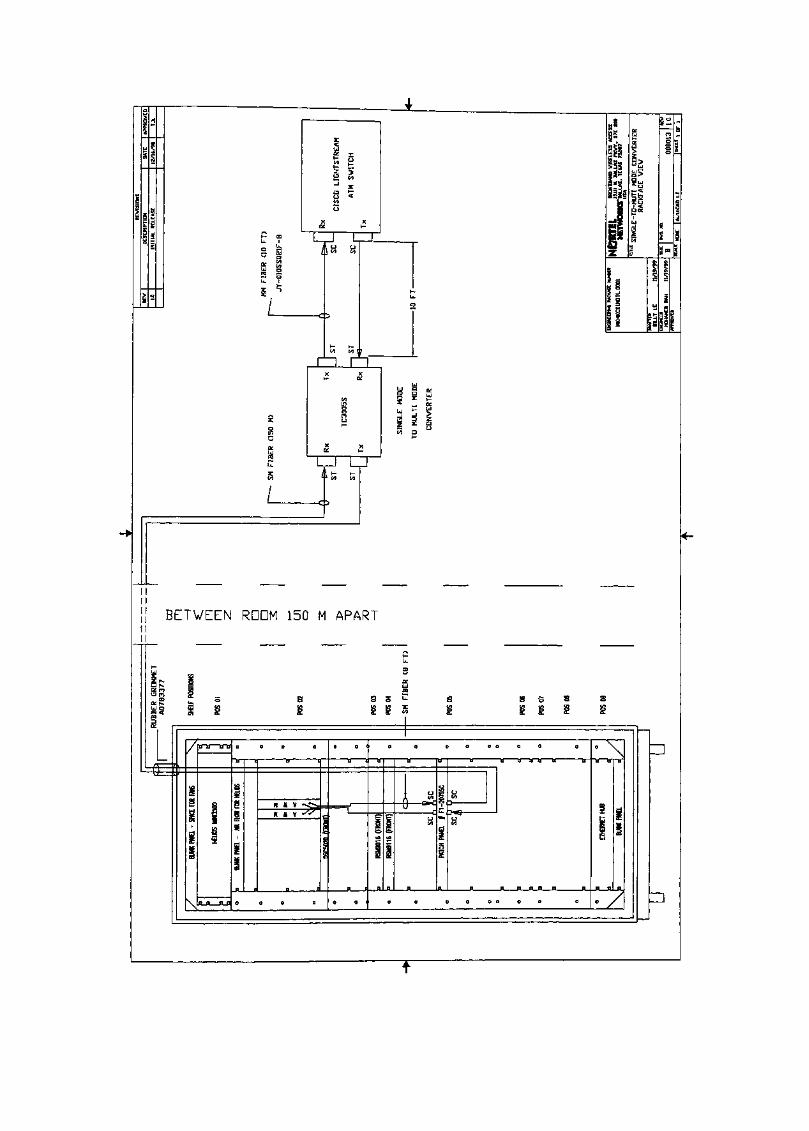
IIIIj j BETWEEN RDDM 150 M APARTiiM
8 3
ii
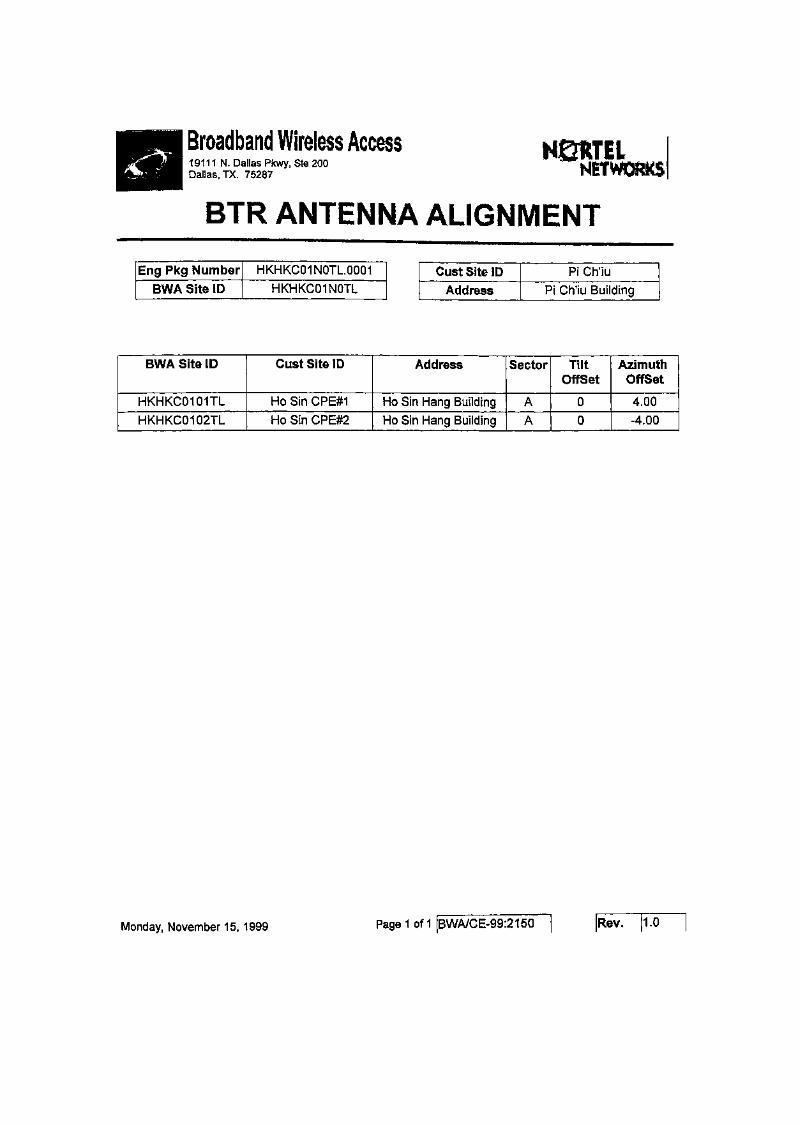
Broadband Wireless Access19111 N. Dallas Pkwy, Ste 200Dallas, TX. 75287
NBTRTILNETVtiQRKS
BTR ANTENNA ALIGNMENT
Eng Pkg Number
BWA Site ID
HKHKC01NOTL0001
HKHKC01NOTLGust Site ID
Address
Pi Ch'iu
Pi Ch'iu Building
BWA Site ID
HKHKC0101TL
HKHKC0102TL
Gust Site ID
Ho Sin CPE#1
Ho Sin CPE#2
Address
Ho Sin Hang Building
Ho Sin Hang Building
Sector
A
A
TiltOffSet
0
0
AzimuthOffSet
4.00
-4.00
Monday, November 15, 1999 Page 1 of 1 BWA/CE-99:2150 Rev. 1.0
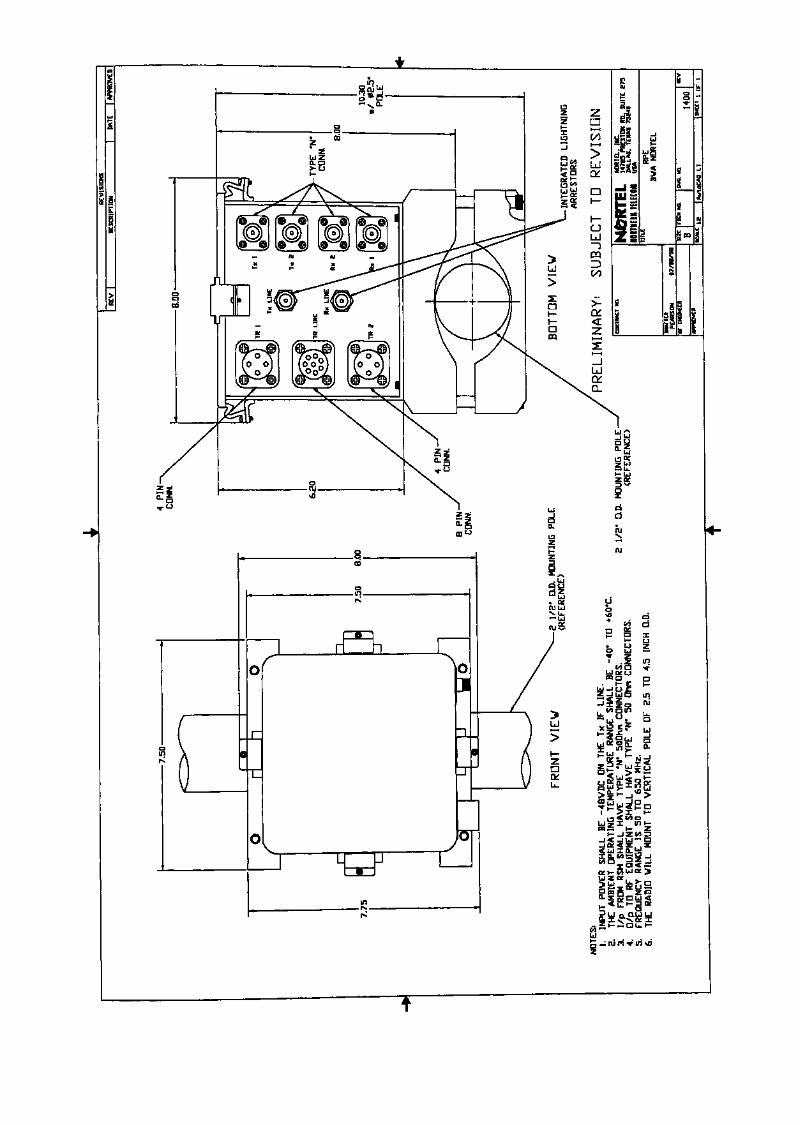

<t«onu ju .axzza .a^H.= ,»x>.Md j a u jc - 0 (uc* .o ) ^^
|u «£ & Wo fo x x
xO <; TJ-P g C P
rim
ary
S
ecto
r A —
3 P
rim
ary
S
ecto
r A
—S
tandby
Secto
r A
—3
Sta
ndby
Secto
r A
j -n
r>
_
ps
- <
;:3 1-
H<*
i "? Prim
ary
S
ecto
r B
—3
Prim
ary
S
ecto
r B
—S
tandby S
ecto
r B
—3
Sta
ndby
Se
cto
r B
u°
:||
^
j *~L. X
JD
3 d "° Prim
ary
S
ecto
r C
—9
Prim
ary
S
ecto
r C
—S
tandby
Secto
r C
—9
Sta
ndby
Secto
r C
:tor
D
Com
mon
—
"iary
T
X S
ecto
r D
—m
dby
TX S
ecto
r D
—
a
Prim
ary
S
ecto
r D
—9
Prim
ary
S
ecto
r D
-S
tandby
Secto
r D
—g
Sta
ndby
Secto
r D
4 -
rniip
PA
U IsCU C.
</) a.d O•p 2:
</» a ha c a
'» z 9- £) o i- a:E ^ § a?a
C E C O O L C ^ I D H O C H 1
a ->jc — e
§sis
His
-In
<r « u o u u.
^\
Ofh-
XL
1
^£0 o
S <c m o a £§s
^ S'
£ f S5 j $
y " = £<CLJ m>u S2u5° w^C30 _JUT «D
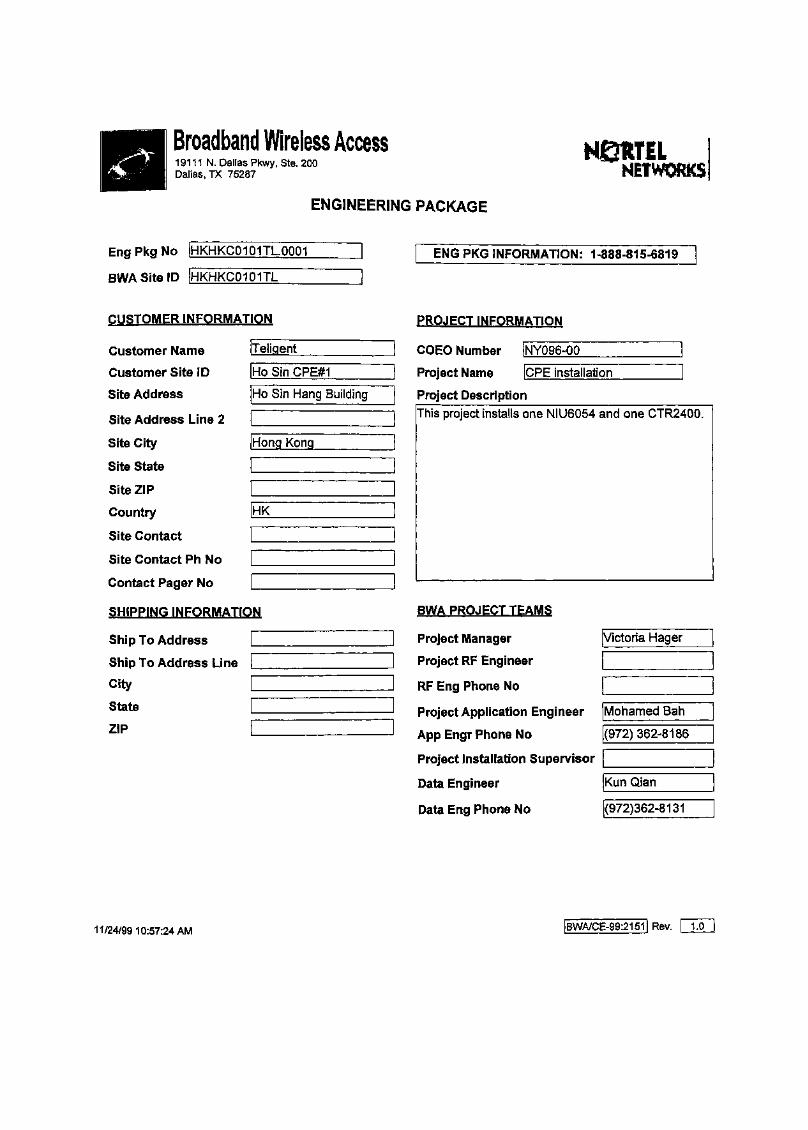
Broadband Wireless Access19111 N. Dallas Pkwy, Ste. 200Dallas, TX 75287
NBKTIL
ENGINEERING PACKAGE
EngPkgNo IHKHKC0101TL0001
No Sin CPEffT
BWASitelD IHKHKC0101TL
CUSTOMER INFORMATION
Customer Name [Teligent
Customer Site ID
Site Address
Site Address Line 2
Site City
Site State
Site ZIP
Country
Site Contact
Site Contact Ph No
Contact Pager No
Ho Sin Hang Building
|Hong Kong
HK
SHIPPING INFORMATION
Ship To Address
Ship To Address Line
City
State
ENG PKG INFORMATION: 1-888-815-6819
PROJECT INFORMATION
COEO Number
Project Name
INYQ96-QQ
CPE installation
Project DescriptionThis project installs one NIU6054 and one CTR2400.
BWA PROJECT TEAMS
Project Manager
Project RF Engineer
RF Eng Phone No
Project Application Engineer
App Engr Phone No
Victoria Hager
Mohamed Bah
(972)362-8186
Project Installation Supervisor
Data Engineer |Kun Qian
Data Eng Phone No [(972)362-813T
11/24/99 10:57:24 AM |BWA/CE-99:215l| Rev. [ l . O
Broadband Wireless Access19111 N. Dallas Pkwy, Ste. 200Dallas, TX 75287
N&ftTEL
Eng Pkg Number
Installation Notes
HKHKC0101TL0001
INSTALLATION NOTES
BWA Site ID HKHKC0101TL
) This project installs an NIU6054 and a CTR2400.
) Complete serial numbers and cable loss information should besupplied to RF Engineering via email before specific RF calculationson required pads and attenuators can be provided to installation.See enclosed blank form for exact information required.
) All equipment is being shipped from Calgary.
) Questions on this package can be addressed to Mohamed Bahat 972-362-8186, ESN 442-8186.
11716/99 3:22:05 PM feWA/CE-99:2151| Rev | 1 0

Broadband Wireless Access19111 N. Dallas Pkwy, Ste. 200Dallas, TX 75287
NORTELNETWORKS
ANTENNA INFORMATIONEng Pkg No
Install Status
HKHKCQ101TL0001 [ BWA Site Code [ HKHKC0101TL | Sector
Gust Site Code | Ho Sin CPE#1 | Sector AngleNEW
ANTENNA POLARIZATION AND POSITION
Azimuth
Magnetic Declination
TX Polarity
RX Polarity
Tilt
MINUTES SECONDSNorth America Datum [N/A DIRECTION DEGREES
Latitude
Longitude
Distance To Base
RADIO SETTINGS
QAM I 16 I TX Freq I 25226 | TX IF
RX FREQUENCIES
Install Status Sector BWA Site Code Cust Site Code Site ID Address RXFreq RXIF
NEW A HKHKC01NOTL Pi Ch'iu Pi Ch'iu Building 24410 190
Wednesday, November 24,1999BWA/CE-99:2151 1.0
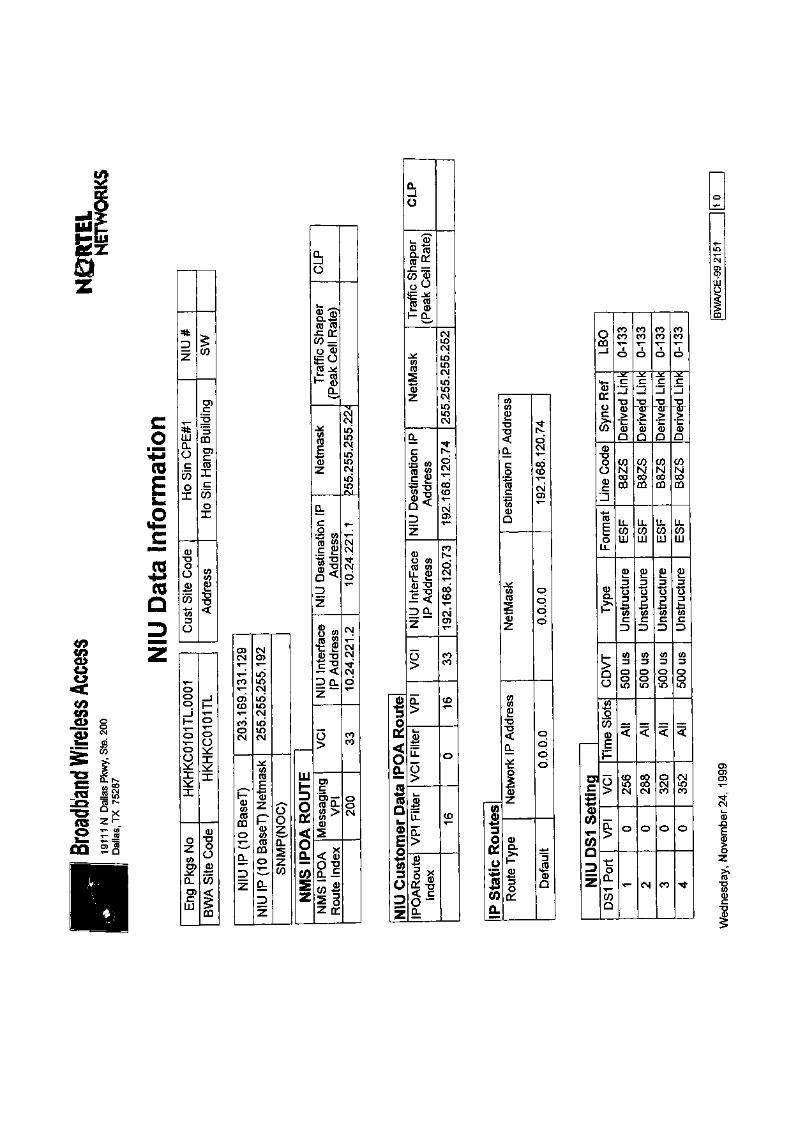
co
*mm
Form
a
..ly...
•BBH
(013o*"
z
IDZ
5LUCL0C
COoX
CDT3OO
CO
CO13O
5CO
CD
DQ
CD£^COXc
CO0
COCO
•fe
T—Ooo
Kooq:*:X
X
oZCO
CLCD
LU
-J1 —
ooO
X
X
T3OO
CO
1
C3>CM
VJ1'
COT~"
CJ)CD
COOCM
0COCO
CQ
o
Q.
z
CM0>
LOLOCMLOLOCNl
LOLOCM
COCO
•S3z
£CDCOCO
CD
O
2=IDZ
o"o7*
HTzCO
111H
O
OQL0]
z
0.— j
"— s~**
CO IS
CO =
iE OCO *- co
"' CDN^
COCO
JsCDZ
Q.
C
s«CO w
c ^
Q<DZ
CD /AO *"'
•§ 2
£ <;DO.Z
o^
essa
ging
VP
I
"d*£
<|
0^II
CMCMLOLOCMLOLOCMLOLO
T—
CMCM
8c>
CM
CMCM
CMo"T"~
COCO
ooCM
Q_
I co gjro <(> £!S| 5w S co
S< 5D o>z
o w
IICMLOCM
•* LOLOCMLO
^ 8LOLOCM
<D ^
% Z O™ "' CM
S? COE < <°=>S: <N2 °>
^ S
d) Q. CD
a
^^O'Ll O
o,03
il <op'•§o
O & „< c
Q.
ID
C\lCD9LU
CO COco co
CQ
co£T3TJ
CL
COCO
I 8!co
o
1S q« o
COCO
iiCD
o
J03
O cp
»1 S4-J o •-*
COa
ID
o«>»
CO CD 0
CO COO N Ns
CO
CO COO HI LU
.
Q >
0) 0)3 13<p
"oo "ooc cID ID
1CO _ _0 < <E
OCL
CMcoQ
CO COCO CO
s
CD <DQ Q
oo oo
8 8LO
CD 00LO COCM CM
0) CON NCO 00en CD
COLLJ
o oE E-•—> •+-•CO COc c
Z)
CO CO3 3
O OO OLO LO
O CMCM LOCO CO
3i—<D
JD
I
&T300CD
i
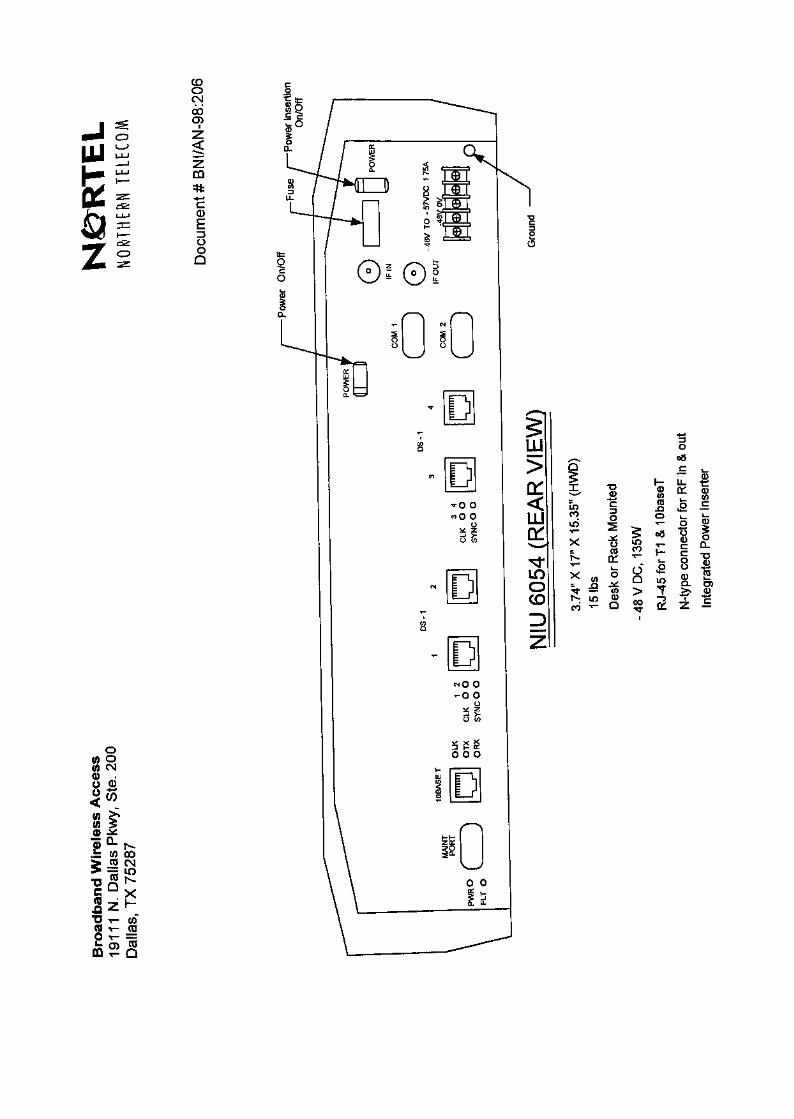
••• <=>UJ ir!
T.I
CDOCN166o>
zGO
0
OOQ
o</) q0) CM0O CD
±: c/> oo5 co CM
= LO• U ^S2"O T- CO

CDr-66
H- 13 ^a* O >^S O <D2 Q Q;
0C05OL
0
Cooj>CO
2o
Xo
COC.2"•*-•.0±3
b
\v"1"
D
zz
oC1503O
sQ.X
LU
(I)
0OO
O(/) O0) <N00 0)
LOOCD
D
,t (0 00^ J5 CNSgsS x5z^"2 x- CO5 v- 030 r~ =
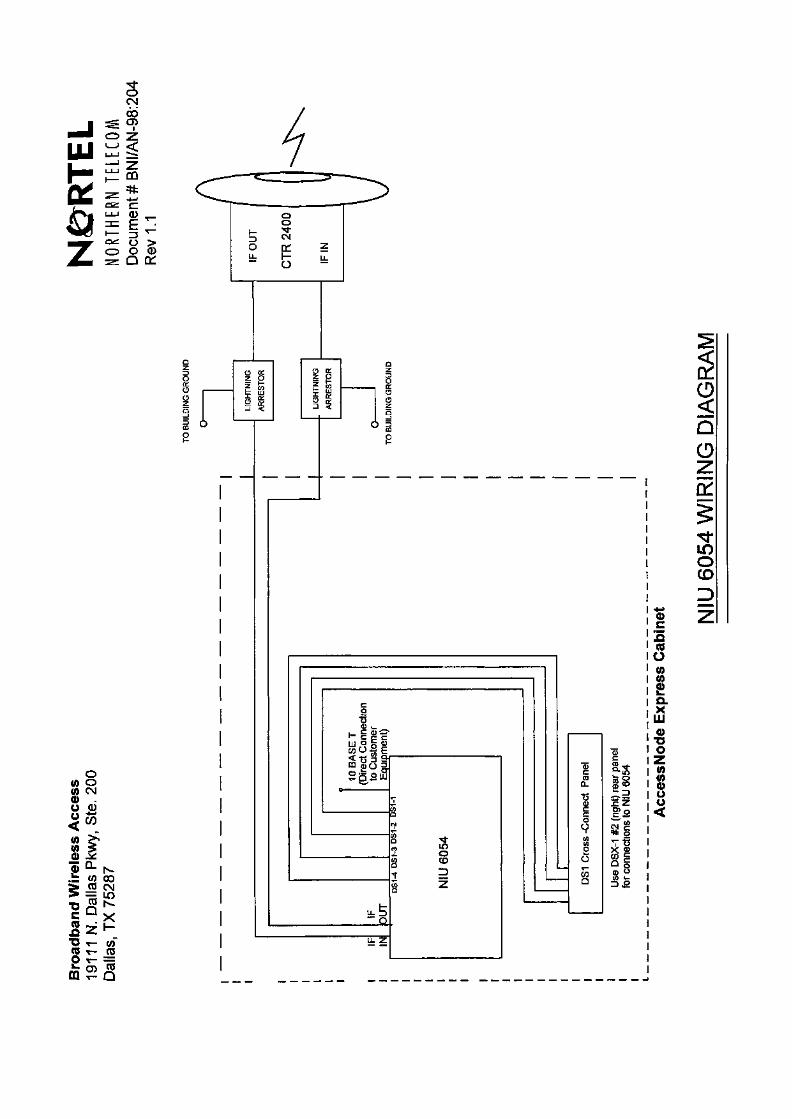
sOOO)
LUI-
ULJ <L)
= EO >o <uQ o:
O(0 OW CN0) .O 0)
10 >» 2°-^-i w oo> CO CM> = in•OQ S • ?<5z«-_T3 T- c/>OS x— CO
i-ci¥
II! I
o.E'JQ
O
a.x
LUO•oO
§
1
so(O
<DC(0
CL
SO
55Q
HSz
a§VT5
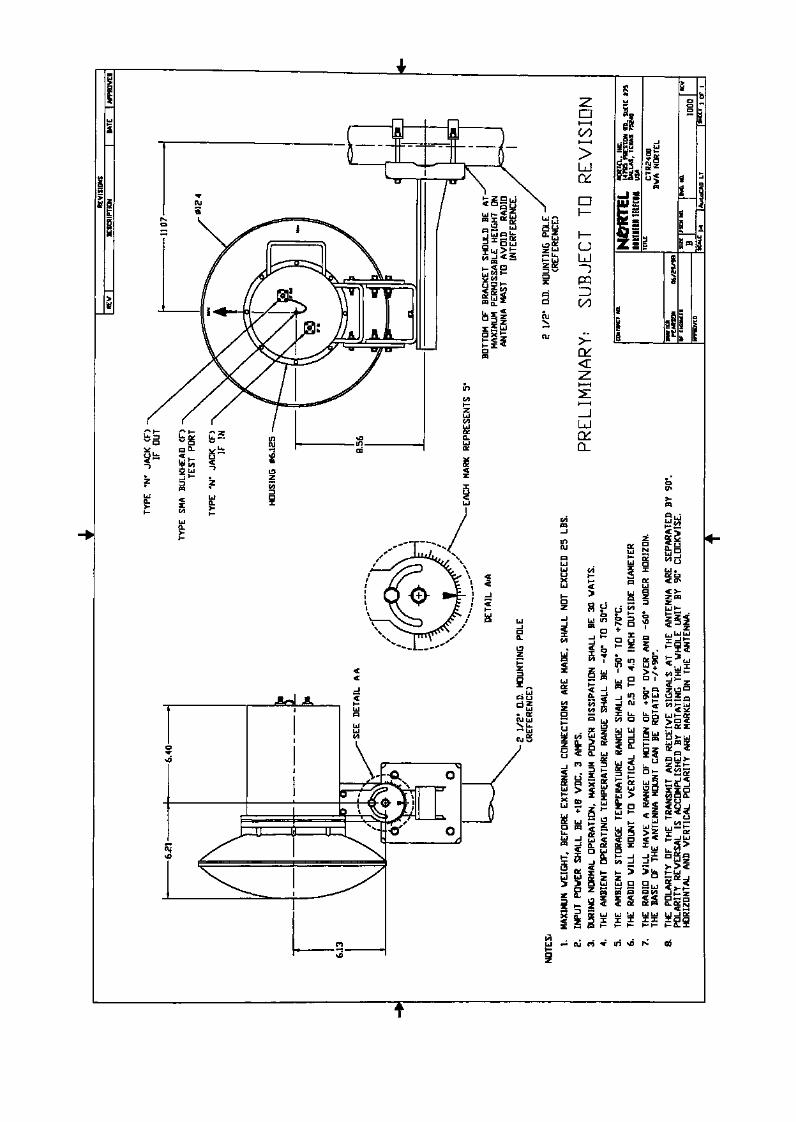

Appendix 3- ATP Test Results

Appendix 3 A - Link Budgets Downstream

Data Sheet 2 DOWNSTREAM LINK BUDGET Release Aug 6 1999DATA RECORDING SHEET Revision: C4
NNE Address: Pi Ch'iu Building RF Engineer. Ron Nethery
NNE Sector: A Phone: 972 362 8037 (442 ESN)
NIU Address: Ho Sin Hang Building CPE1 Oate. so-Nov-99
Primary BTR Serial # Redundant BTR Serial #
NNTM532H37VR NNTM532H38WU KM. 0.190QAM 16
BTR Sector Antenna Boamwidth # Carriers 1
=
C
f::^'m ®® degrees
iJI ^ , flvk X^ TX Gain (Labelled) " VIA"
\ I 33.7 1 1 32.93 I Calc: 33.7\ | Primary {Redundant
\ BTR TX input1 .32.3 1 1 -32.5 | Calc: -32.2
m ' [Primary | Redundant C
• RPE
C
c
C
prt
c
c
[ R
<l
c
HardvAttenu
C
L" RPE TX Input
) I -31.1 I Calc: -31. 2
) TX Cable Loss
input To Cable [-1.8 | Calc: -0.5 C
5 I -29.3 I Calc: -30.7
Past"! Combiner Input / RSM Outputd 1 *" I -8.5 I Gate: -10.7 c
.^^'^ J Primary
RSM TX Output '> I -8.5 | I -9 I Calc: -10.7 Hardwan
CTR Serial *
NNTM532GLFK8
Antenna Diameter
^~ — — ' 12 inchesCTR
f—^v RX Gain (Labelled)
28.58 Calc: 28.6
CTR RX Output
* -24.1 -24.6 Calc: -24.7From From
Primary BTR Redundant BTR
RX Cable Loss) -0.4 Caic: -0.3
Attenuator Input RX IF Frequency-24.5 I Gate: -25 190 I
From MHzPrimary BTR
» RXPad1 1 1 Primary [Redundant Attenuation _2Q | calc:-20iiM '
RSM TX Input3 I -24.5 1 Calc: -24.9 C
*am TX Pad | JJ"aton | IlO | Calc. -10 '
' SMM TX Output
I SMM I- ^ T X RF Frequency TX IF Frequency
I 24410 I Calc: 24410 I 490 IMHz MHz
I & C Renrasentative: j.c. Milter
Custor
NIU RX Input (-34 to -64 dBm)
^ -44.8 I I -45.3 I Calc: -45
From I From| Primary BTR |Redun.BTR
Noise Floor NIU Dropout NIU Threshold
-90.4 -71 -71 ICalc: -89.8 Calc: -64 Calc: -64
Primary BTR Primary BTR
Date: Dec. 10, 1999
tier Site Representative: Date:
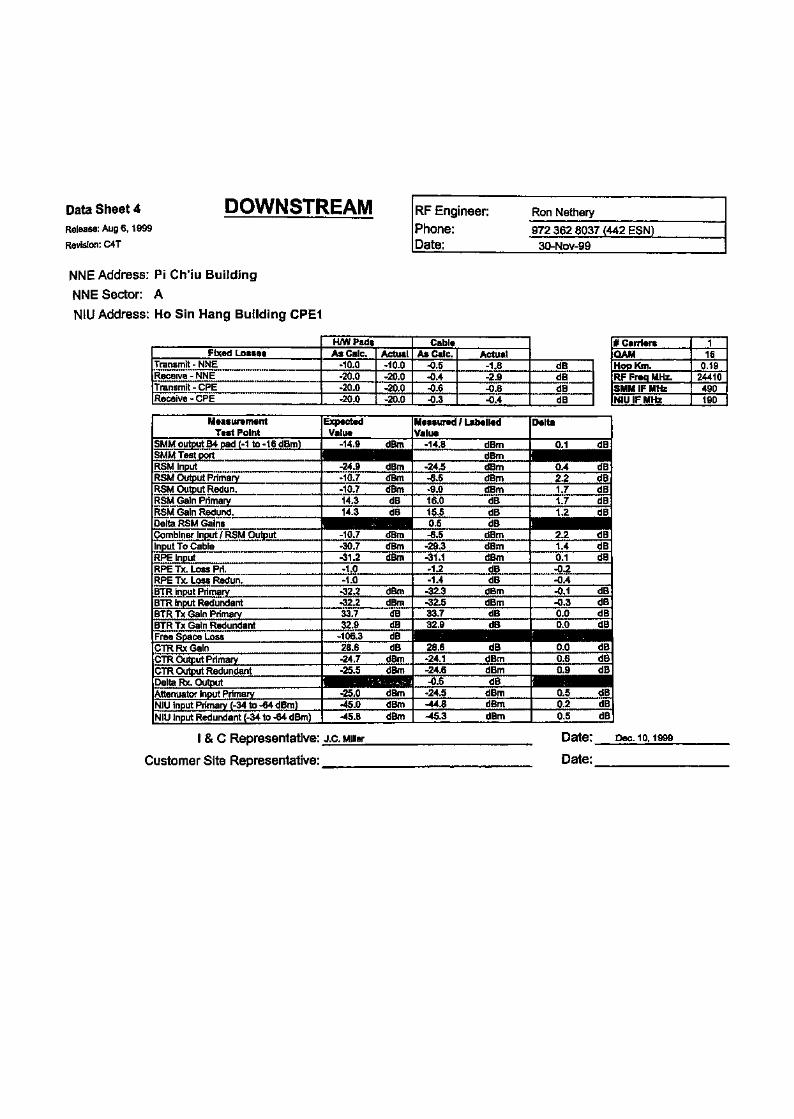
Data Sheet 4Release: Aug 6, 1999
Revision: C4T
DOWNSTREAM RF Engineer:Phone:Date:
Ron Nethery
972 362 8037 (442 ESN)
30-NOV-99
NNE Address: Pi Ch'iu Building
NNE Sector: A
NIU Address: Ho Sin Hang Building CPE1
SMM output B4 pad M to -16 dBm)
NIU input Primary to .dBm)NIU incut Redundant (-34 to -64 dBm)
I & C Representative: j.c. Milter
Customer Site Representative:
# CarriersQAMHop Km.RF Ff*q MHz.SMM IF MHzNiU IF MHz
116
0.1924410490190
Date:
Date:
Dec. 10,1999
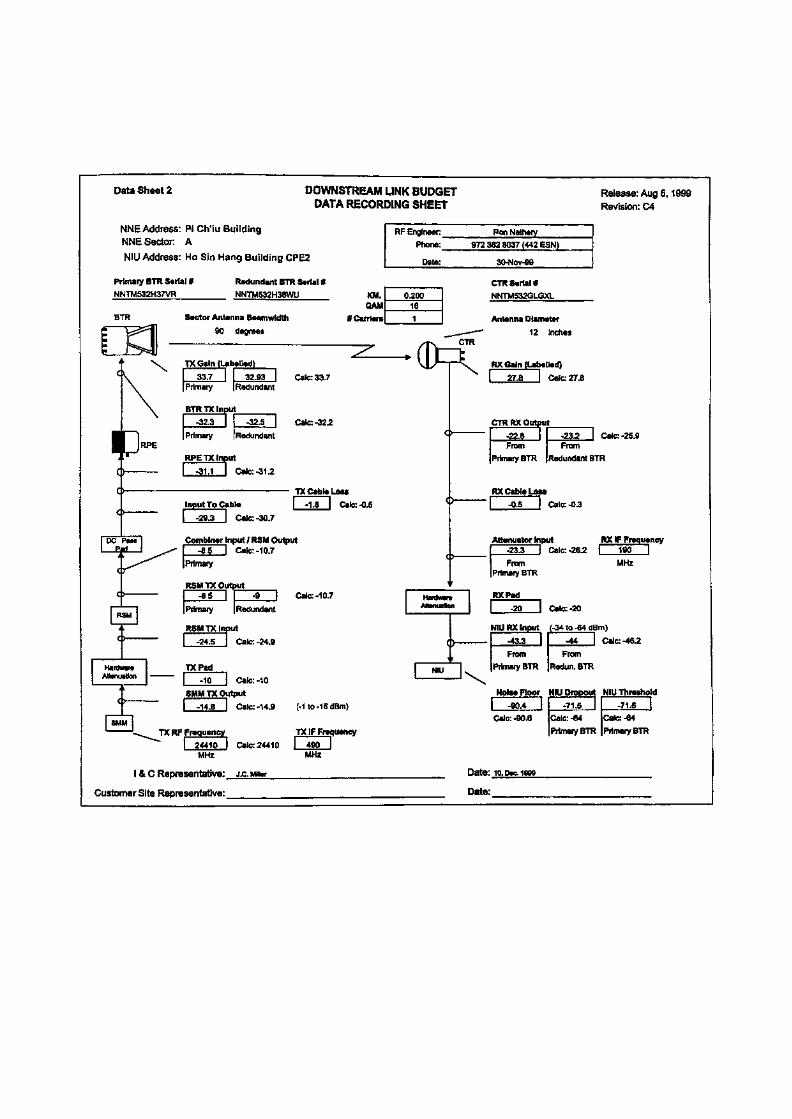
D
1
PiNI
ata Sheet 2 DOWNSTREAM LINK BUDGET Release: Aug 6, 1999
DATA RECORDING SHEET Revision: C4
MNE Address: Pi Ch'iu Building RF Engjneer: Pon Nethery
NNE Sector. A Phooe- 972 362 8037 (442 ESN)
N!U Address: Ho Sin Hang Building CPE2 p . ao-Nov-99
Imary BTR Serial # Redundant BTR Serial #
^JTM532H37VR NNTM532H38WU KM. 0.200QAM 16
BTR Sector Antenna Beamwldth # Carriers 1fe
M
c
1C
C
pDC
C
C
[ R
C
Hard*Attenu
C
"r^Tl ^ dogrees ^
±>4l ^x /T|-\ TXGaln(Ub«ll«d) VU~
\ [ 33.7 | r~a2.ft3 I Calc: 33.7[Primary (Redundant
BTR TX Input
I -32.3 I I -32.S | Calc: -32.2
P | Primary Redundant c
RPE
RPETX Input
) 1 -31.1 I Gate: 31.2
) TXdbtoLossinput To Cabto | -1.8 I Gate: -0.5 (
3 I -20.3 I Gate: -30.7
P^T] Combiner Input / RSM Output[d — I ^ I -as I Calc: -10.7
_^^^^ IPrimary
RSM TX Output5 | -SS I I -9 I Calc: -10.7 H«xJw*i
1 1 Primary JRedundant Attoouata
RSM TX Input5 | ,245 [ Calc: -24.9 (
™* TXPad i ^Tatton 1 -10 1 Calc: -10 '
' SMM TX Output> L -14^ J Gate: -14.9 (-1 to-16dBm)
I SMM I"- TX RF Frequency TX IF Frequency
1 24410 I Calc: 24410 I 490 IMHz MHz
I & C Representative: J.c. Miner
Custor
CTR Serial #NNTM532GLGXL
Antenna Dlanrvatar
^-^- — * 12 InchesCTR
— V RX Gain (Labelled)X 27.8 ) Gate: 27.8
CTR RX Output) -22.8 I I -23.2 I Calc: -25.9
From I From
Primary BTR {Redundant BTR
RX Cable Lo»9
^ -0.5 | Calc: -0.3
Attenuator Input RX IF Frequency-23.3 ( Calc: -265 190 )
3 From MHzPrimary BTR
» RXPad
" -20 I Cata:-20
NIU RX Input (-34 to -64 dBm)
) -43.3 II -44 I Calc: -462
From I From^ Primary BTR jRedun.BTR
Noise Floor NIU Dropout NIU Threshold
-90.4 I I -71.5 I -71.5 ICalc: -90.6 I Calc: -64 Gala -64
J Primary BTR Primary BTR
Date: 10, DM. 1999
Tier Site Representative: Date:
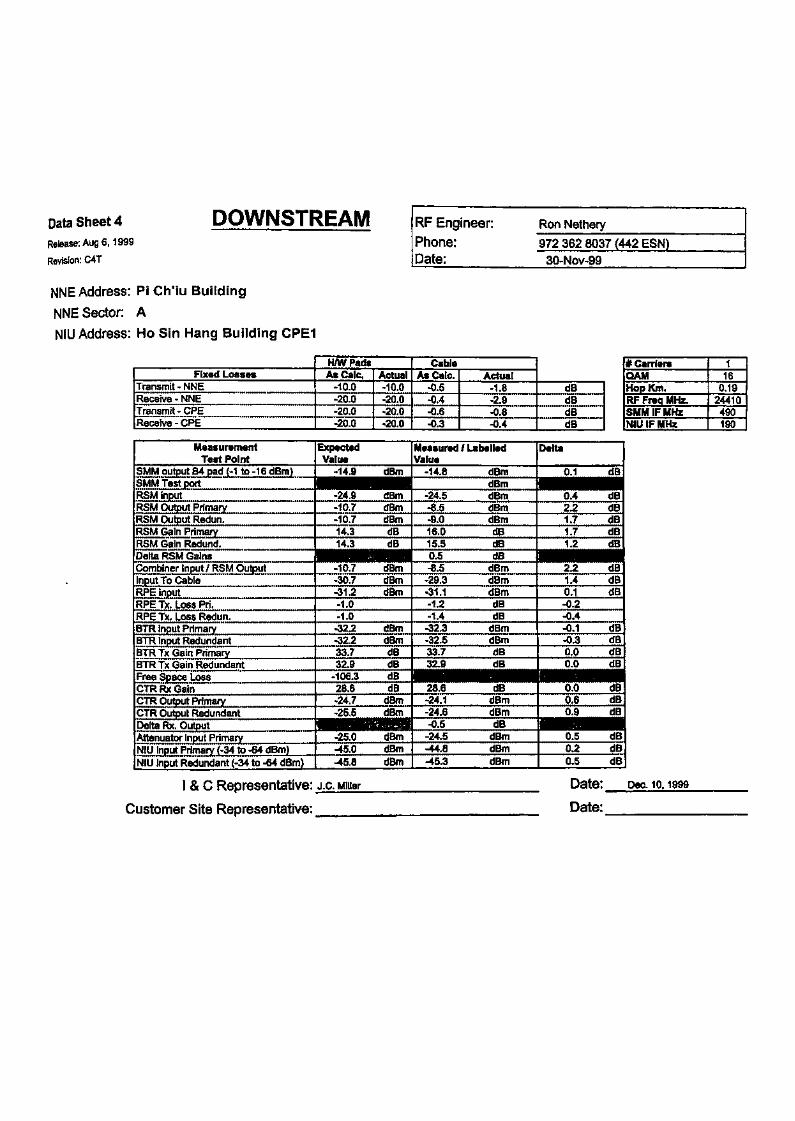
Data Sheet 4Release: Aug 6,1999
Revision: C4T
DOWNSTREAM RF Engineer:Phone:Date:
Ron Nethery972 362 8037 (442 ESN)
30~Nov-99
NNE Address: Pi Ch'iu Building
NNE Sector: A
NIU Address: Ho Sin Hang Building CPE1
Fixed LossesTransmit - NNEReceive - NNETransmit - CPEReceive -CPE
H/WPadsAs Calc.
-10.0-20.0-20.0-20.0
Actual-10.0-20.0-20.0-20.0
CableAs Calc.
-0.5-0.4-0.6-0.3
Actual-1.8-2.9-0.8-0.4
dBdBdBdB
# CarriersQAMHop Km.RF Freq MHz.SMM tF MHzNIU IF MHz
116
0.1924410490190
Combiner Input / RSM Output
NIU input Primary (-34 to -64 dBm)NIU input Redundant (-34 to -64 dBm)
I & C Representative: j.c. Miner
Customer Site Representative:
Date:_
Date:
Dec. 10.1999

Appendix 3B - Link Budgets Upstream
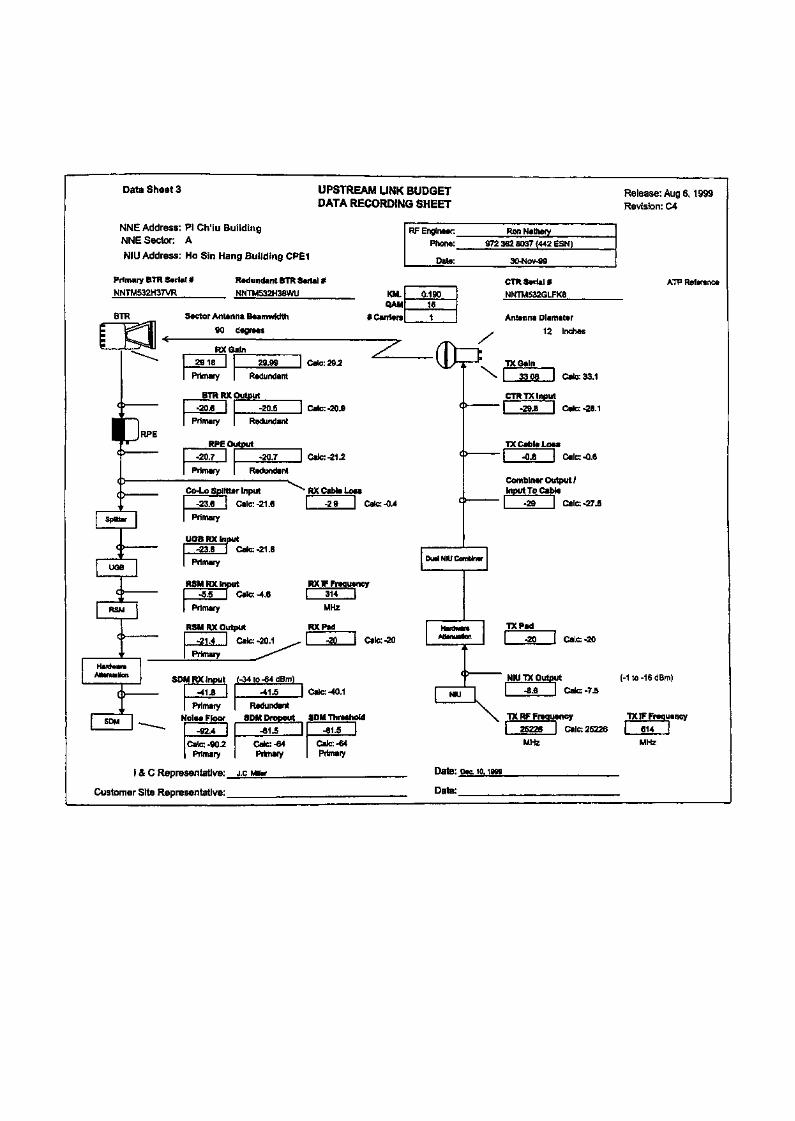
Data Sheet 3
NNE Address: Pi Ch'iu BiNNE Sector: A
N1U Address: Ho Sin Har
Primary BTR Serial #
NNTM532H37VR
UPSTREAM LINK BUDGET Release: Aug 6 1999DATA RECORDING SHEET Revision: C4
lldmS RF Engineer: RonNetnery
Phone: 972 362 8037 (442 ESN)
.g Building CPE1 Date: 30*0*09
Redundant BTR Serial #
NNTM532H38WU KM. 0.190QAM 16
BTR Sector Antenna Beamwldth # Carriers 1
: j Il < M
5 J /^y^JJ mv **>" ' I i j*4 RX G
^ "" I 29 18 |
I Primary
BTRRX
Jl -20.6 ]
I Primary
RPEO
1 Primary
Co4.oSplltti
1 -23 .6 |
1 ^u« | 1 Primary
UGBRXInpt0 I .236 f
j ^ 1 rnmary
RSMRXInpt^ — 1 - 5 . 5 rRSM 1 Primary
degrees
* / n>29.99 | Calc:29.2 V|Jh
Redundant
Output
-20.5 | Calc:-20.9 c
Redundant
jtput
-20.7 | Gate: -21 2 c
Redundant
r Input " RX Cable LOM
Gate: -21 .6 -29 ] Gate: -0.4 c
rt
CTR Serial # ATP Reference
NNTM532GLFK8
Antenna Diameter
* 12 inches
[ — \ TX Gain
\ I 3308 I Calc: 33.1
CTR TX Input
> | .29.8 I Calc: -28.1
TXCabloLoas
* ( ^08 | Calc: ).6
Combiner Output /Input To Cable
> | ^29 | Calc: -27.5
Dual NKJ ComWntr
it RX IF FrequencyCalc; -4.6 | 314 |
MHz
RSMRX Output RXPad K^d*** TXPadC > -21.4 I
i p PrfrnaryHardware
Aitonualion SDMRX Input
C) 1 ll I
v | Primary
I SDM I Nolae floor— *^* - I .92 4 [
|caic:-90.2| Primary
i & C Representative:
Customer Site Representative:
Calc: -20.1 ^ -20 I Calc: -20 Attaourton | .JO I Calc -20
^^ '
^4 to -64 dBm) C 3 NIU TX Output (-1 to -1 6 d Bm)
-41.5 I Cate:-40.1 I NIU I ' •8'6 Cata:-7.5
Redundant ' — ""~
SDM Dropout SDM Threshold
-81.5 | -61.5 |
x, TX RF Frequency TX IF Frequency
I 25226 | Calc: 25226 f 614 j
Cate:-64 Calc: 4 MHz MHzPrimary Primary
J.C MWor Date: Dec. 10, 1099
Date:
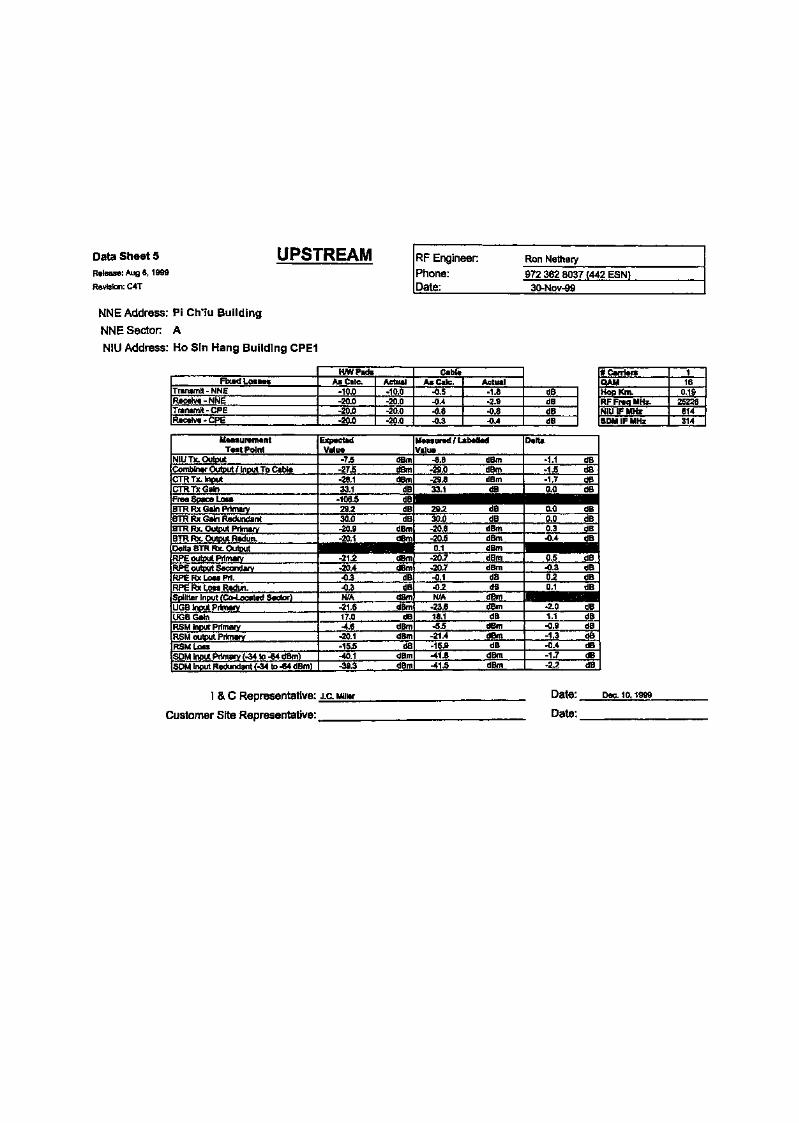
Data Sheet 5Release: Aug 6, 1999
Revision: C4T
UPSTREAM RF Engineer:Phone:Date:
Ron Nethery
972 362 8037 (442 ESN)
30-Nov-99
NNE Address: Pi Ch'iu Building
NNE Sector: A
NIU Address: Ho Sin Hang Building CPE1
Fixed Loss®*Transmit - NNEReceive - NNETransmit - CPEReceive - CPE
MeasurementTest Point
NIU Tx. OutputCombiner Output / input To CableCTRTx. InputCTRTx Gain
BTR Rx Gain PrimaryBTR Rx Gain RedundantBTR Rx. Output PrimaryBTR Rx. Output Redun.
RPE output PrimaryRPE output SecondaryRPE Rx Loss Pri.RPE Rx Loss Redun.Splitter Input (Co-Located Sector)UGB input PrimaryUGB GainRSM input PrimaryRSM output PrimaryRSM LossSDM input Primary (-34 to -64 dBm)
H/WPadsAs Calc.
-10.0-20.0•20.0-20.0
Actual-10.0-20.0-20.0-20.0
CableAs Calc.
-0,5-0.4-0.6-0.3
ExpectedValue
-7.5-27,5-28.133.1
29.230.0-20.9-20.1
-21.2-20.4-0.3-0.3N/A
-21.617.0•4.6-20.1-15.5•40.1
SDM input Redundant (-34 to -64 dBm) I -39,3
dBmdBmdBm
<JB
<JBdB
dBmdBm
dBmdBm
dBdB
dBmdBm
dBdBmdBm
dBdBmdBm
Actual-1.8-2.9-0.8-0.4
dBdBdBdB
Measured /LabelledValue
-8.6-29,0-29.8
dBmdBmdBm
33.1 dB
29.230.0-20.6-20.5
•20.7-20.7-0.1-0.2N/A
•23.618.1-5.5-21.4-15.9-41.8-41.5
dBdB
dBmdBm
dBmdBmdBdB
dBmdBmdB
dBmdBmdB
dBmdBm
Delta
-1.1-1,5
dBdB
-1.7 dB0.0
0.00.00.3-0.4
0.5-0.30.2.oj
-2.01.1-0.9-1.3•0.4-1.7-2.2
dB
dBdBdBdB
dBdBdBdB
dBdBdBdBdBdBdB
* Carriers 1QAM 16Hop Km. 0.19RFFreqMHz. 25226NIU IF MHz 614SDM IF MHz 314
I & C Representative: j.c. Miller
Customer Site Representative:
Date:_
Date:
Dec. 10.1999
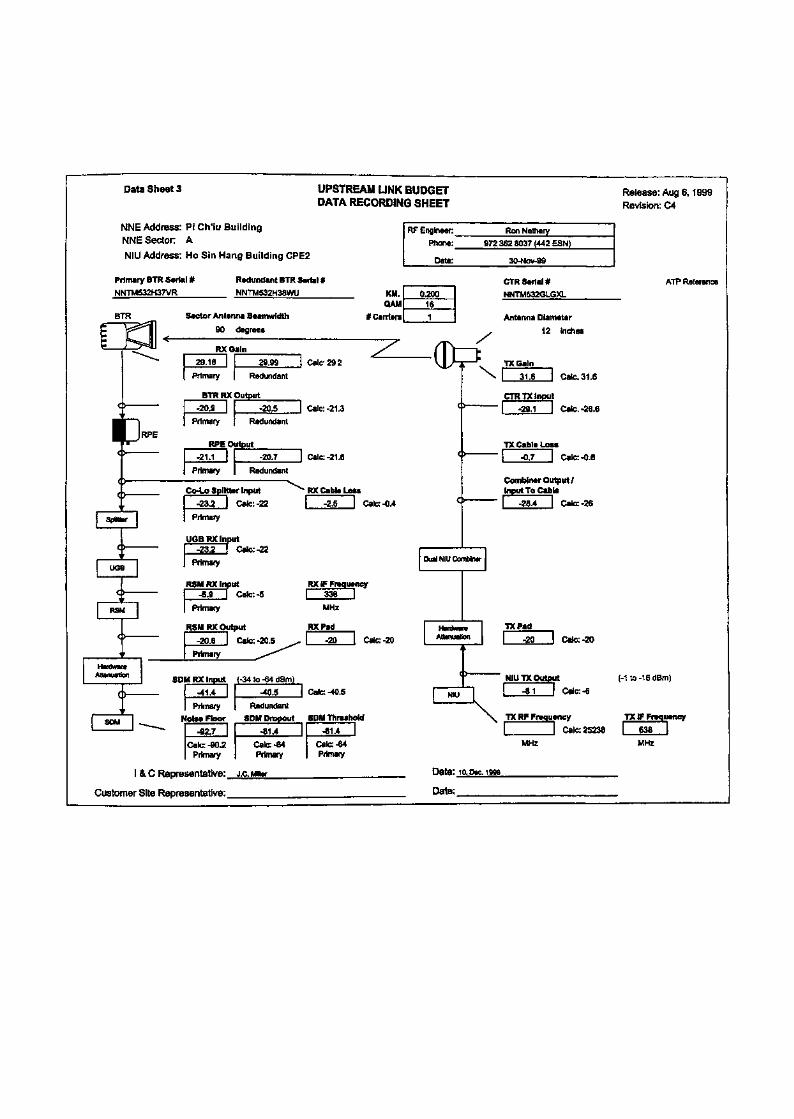
Data Sheet 3 UPSTREAM LINK BUDGET
DATA RECORDSNG SHEET
NNE Address: P. Ctv.u Building RF Englneer. Ron Nethary
NNE Sector: A Pno . 972 362 8037 {442 ESN)
N!U Address: Ho Sin Hang Building CPE2 Date. 30-Nov-99
Primary BTR Serial # Redundant BTR Serial #
NNTM532H37VR NNTM532H38WU KM. 0.200QAM 16
BTR Sector Antenna Beamwldth # Carriers 1
- ^f^n\ ^ degrees
£ J J il j nw ft«in j>r /l\ —— KA Gain ^x^ ill"*• I 29.18 I 29.99 | CalC'292 \\)-l
| Primary Redundant
BTR RX Output
J) -20.9 I -20.5 | Calc: -21.3 c
I Primary Redundant
RPE Output
I -21.1 | -20.7 I Calc: -21. 6 c
| Primary Redundant
Co-Lo Splitter Input ^ RX Cable Loss
I -23.2 ) Calc: -22 -2.5 | Calc: -0.4 c
| Primary
UQBRX Input€ > | -23.2 1 Calc: -22
. ^ | f " _ . pyal N1U Co
jRSM RX Input RX IF Frequency
c> - ^9 i Cate:-5 338 |
I RSM I 1 Primary MHz
CTR Serial #NNTM532GLGXL
Antenna Diameter
* 12 inches
C — \ TXGaln
\ 31.6 | Calc, 31. 6
CTR TX Input) -29.1 | Calc, -26.6
TX Cable Loss} I -0.7 Calc: -0.6
Combiner Output/Input To Cable
) \ -28.4 Calc: -26
mbfewr
RSM RX Output RXPad *»*«» TXPadC) ^Q6 j Ca|c.-ao>6 ^ -2Q | Calc>20 Altonuatton | .gQ | Ca^^o
Primary ^^^Hardwara
Attenuation SDM RX Input {-34 to -64 dBm) (
L
5 NIUTX Output
r^ 1 -41.4 | -40.5 I Calc: -40.5 | wu I -81 I Calc: -6
I Primary RedundantI SOM I Noise Floor SDM Dropout SDM Threshold
' ' "" I -92.7 | -81.4 | -81.4 |
Release: Aug 6, 1999Revision: C4
ATP Reference
(-1 to -16 dBm)
-v\ TX RF Frequency TX BF Frequency
I I Calc: 25238 I 638 I
Calc: -90.2 Calc: -64 Calcr.-64 MHzI Primary Primary Primary
I & C Representative: J.c. MK* Date: 10, D«X 1000
Customer Site Representative: Date:
MHz

Data Sheet 5Release- Aug 6,1999
Revision: C4T
UPSTREAM RF Engineer:Phone:Date:
Ron Nethery
972 362 8037 (442 ESN)30-Nov-99
NNE Address: Pi Ch'iu BuildingNNE Sector: A
NIU Address: Ho Sin Hang Building CPE2
Fixed LossesTransmit -NNEReceive- NNETransmit - CPEReceive -CPE
MeasurementT«st Point
NIU Tx. OutputCombiner Output / Input To CableCTR Tx. InputCTR Tx Gain
BTR Rx Gain PrimaryBTR Rx Gain RedundantBTR Rx. Output PrimaryBTR Rx. Output Redun.
RPE output PrimaryRPE output SecondaryRPE Rx Loss Pri.RPE Rx Loss Redun.Splitter Input (Co-Located Sector)UGB input PrimaryUGB GainRSM Input PrimaryRSM output PrimaryRSM LossSDM input Primary (-34 to -64 dBm)SDM input Redundant (-34 to -64 dBm)
H/WPadsAsCalc.
-10.0-20.0-20.0-20.0
ExpectedValue
-6.0
-26.0-26.631.6
29.2
30.0
-21.3-20,5
-21.6-20.8-0.3
-0.3
N/A-22.017.0
-5.0
-20.5-15.5-40.5-39.7
Actual-10.0-20.0-20.0-20.0
dBmdBmdBm
dB
dBdB
dBmdBm
dBmdBm
dBdB
dBmdBm
dBdBmdBm
dBdBmdBm
CableAsCalc.
-0.5
•0.4
-0.6
-0.3
Measured ILValue
-8.1
-28.4-29.131.6
29.2
30.0
-20.9-20.5
-21.1-20.7-0.2
-0.2
N/A-23.217.3
-5.9
-20.6-14.7•41.4-40.5
Actual-1.8
-2.5
•0.7
-0.5
Rbelled
dBmdBmdBmdB
dBdB
dBmdBm
dBmdBmdBdB
dBmdBmdB
dBmdBmdB
dBmdBm
dBdBdBdB
Delta
-2.1
-2.4
-2.5
0.0
0.00.00.40.0
0.50.10.10.1
-1.2
0.3-0.9
-0.1
0.8-0.9
-0.8
dBdBdBdB
dBdBdBdB
dBdBdBdBmdBdBdBdBdBdBdB
# Carriers 1QAM 16Hop Km. 0.2RF Frag MHz.NIU IF MHz 638SDM 3F MHz 338
I & C Representative:
Customer Site Representative: _
Date:_
Date:

Appendix 3C - Fade Margin CPE 1
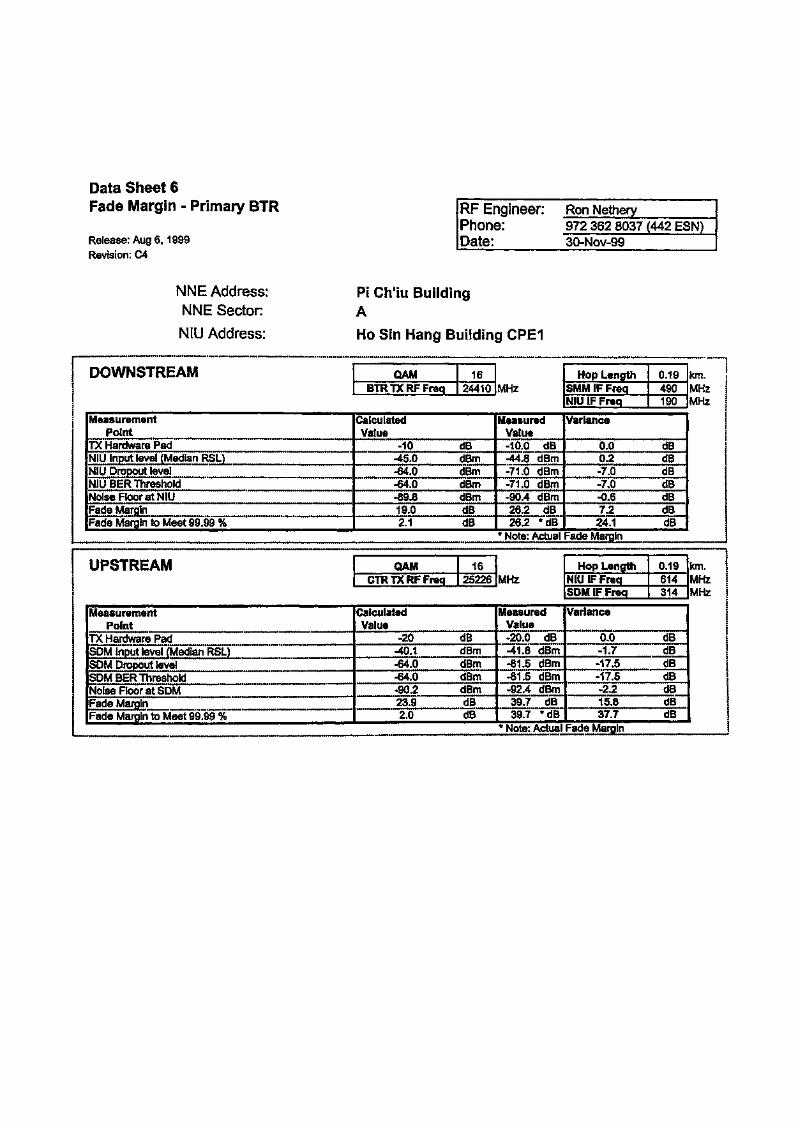
Data Sheet 6Fade Margin - Primary BTR
Release: Aug 6,1999Revision: C4
RF Engineer:Phone:Date:
Ron Nethery972 362 8037 (442 ESN)30-Nov-99
NNE Address:NNE Sector:
NIU Address:
Pi Ch'iu BuildingA
Ho Sin Hang Building CPE1
DOWNSTREAM
MeasurementPoint
TX Hardware PadNIU Input level (Median RSL)NIU Dropout levelNIU BER ThresholdNoise Floor at NIUFade MarginFade Margin to Meet 99.99 %
QAMBTRTXRFFreq
1624410 MHz
CalculatedValue
-10•45.0-64.0-64.0-89.819.02.1
dBdBmdBmdBmdBmdBdB
MeasuredValue-10.0 dB-44.8 dBm-71.0 dBm-71.0 dBm-90.4 dBm26.2 dB26.2 *dB
Hop LengthSMM IF FreqNIU IF Freq
0.19490190
Variance
0.00.2-7.0-7.6-0.67.224.1
dBdBdBdBdBdBdB
* Note: Actual Fade Margin
km. !MHz |MHz
UPSTREAM
MeasurementPoint
TX Hardware PadSDM Input level (Median RSL)SDM Dropout levelSDM BER ThresholdNoise Floor at SDMFade MarginFade Margin to Meet 99,99 %
QAMCTR TX RF Freq
1625226 MHz
CalculatedValue
-20-40.1-64.0-64.0-90.223.92.0
dBdBmdBmdBmdBmdB JdB
MeasuredValue-20.0 dB-41.8 dBm-81.5 dBm-81.5 dBm-92.4 dBm39.7 dB39.7 *dB
Hop LengthNIU IF FreqSDM IF Freq
0.19614314
Variance
0.0-1.7-17.5-17.5-2.215.837.7
dBdBdBdBdBdBdB
km.MHzMHz '
* Note: Actual Fade Margin
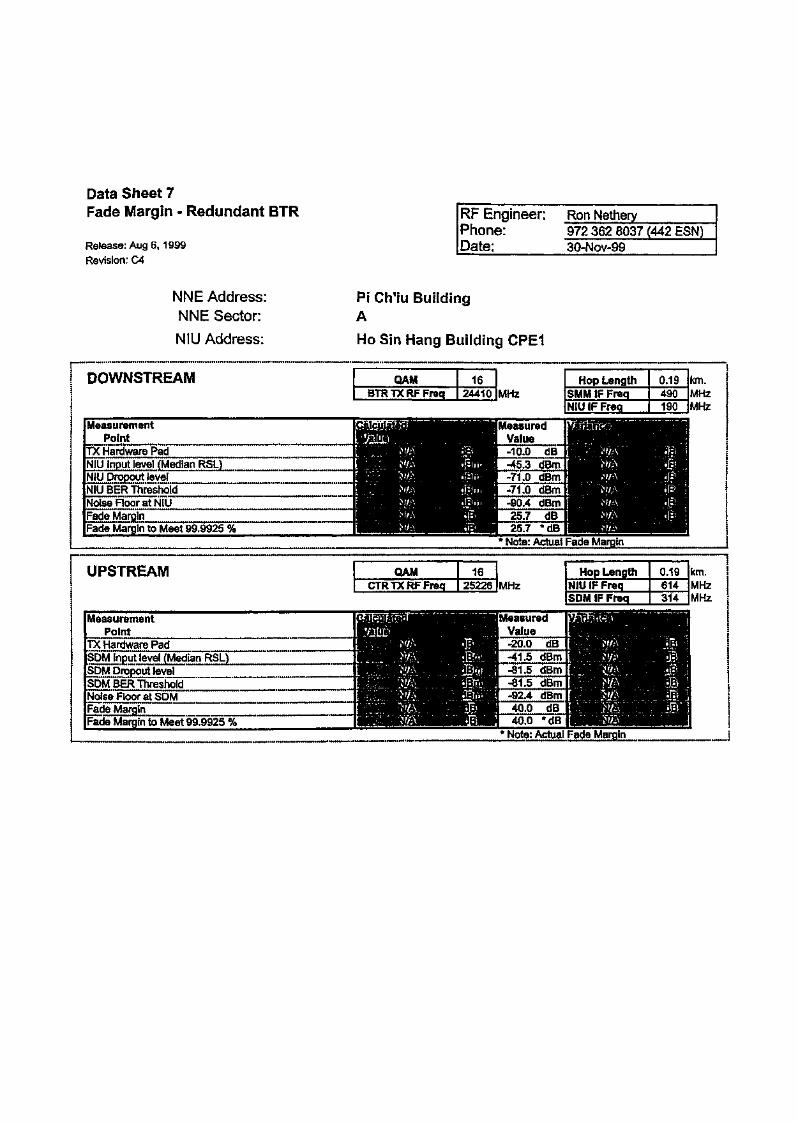
Sheet 7Fade Margin - Redundant BTR
Release: Aug 6, 1999Revision: C4
RF Engineer:Phone:Date:
Ron Nethery972 362 8037 (442 ESN)30-Nov-99
NNE Address:NNE Sector:
NIU Address:
Pi Ch'iu BuildingA
Ho Sin Hang Building CPE1
! DOWNSTREAM QAMBTRTXRFFreq
1624410 MHz
NIU Input level (Median RSL)
Fade Margin to Meet 99,9925 %
Hop LengthSMW 8F Frag
0.19490
km.MHzMHz
* Note: Actual Fade Margin
UPSTREAM QAMCTRTXRFFreq
1625226 MHz
Hop LengthNil? IF FreqSDM 3F Freq
0.19614314
km.MHzMHz

Appendix 3D - Fade Margin CPE 2

Data Sheet 6Fade Margin - Primary BTR
Release: Aug 6,1999Revision: C4
RF Engineer:Phone:Date:
Ron Nethery972 362 8037 (442 ESN)30-Nov-99
NNE Address:NNE Sector:
NIU Address:
Pi Ch'iu BuildingA
Ho Sin Hang Building CPE2
I
I
DOWNSTREAM
MeasurementPoint
TX Hartlware PadNIU Input level (Median RSL)NIU Dropout levelNIU BER ThresholdNoise Floor at NIUFade MarginFade Margin to Meet 99.99 %
QAMBTRTXRFFreq
1624410
CalculatedValue
-10•46.2-64.0-64.0-90.617.82.3
dBdBmdBmdBmdBmdBdB
MHz
MeasuredValue-10.0 dB-43.3 dBm-71.5 dBm-71.5 dBm-90.4 dBm28.2 dB28.2 *dB
Hop LengthSMM IF FreqNIU IF Freq
0.2490190
Variance
0.0 dB2.9 dB-7.5-7,50.210.425.9
dBdBdBdBdB
* Note: Actual Fade Margin
km.MHzMHz
I
UPSTREAM
MeasurementPoint
TX Hardware PadSDM Input level (Median RSL)SDM Dropout levelSDM BER ThresholdNoise Floor at SDMFade MarginFade Margin to Meet 99.99 %
QAMCTRTXRFFreq
1625238 MHz
CalculatedValue
-20-40.5-64.0-64.0-90.223.54.0
dBdBmdBmdBmdBmdBdB
MeasuredValue-20.0 dB-41.4 dBm-81.4 dBm-81.4 dBm-9Z7 dBm40.0 dB40.0 *dB
Hop LengthNiU IF FraqSDM IF Fraq
0.2638338
Variance
0.0-0.9-17.4-17.4-2.516.536.0
dBdBdBdBdBdBdB
km.MHzMHz
* Note: Actual Fade Margin
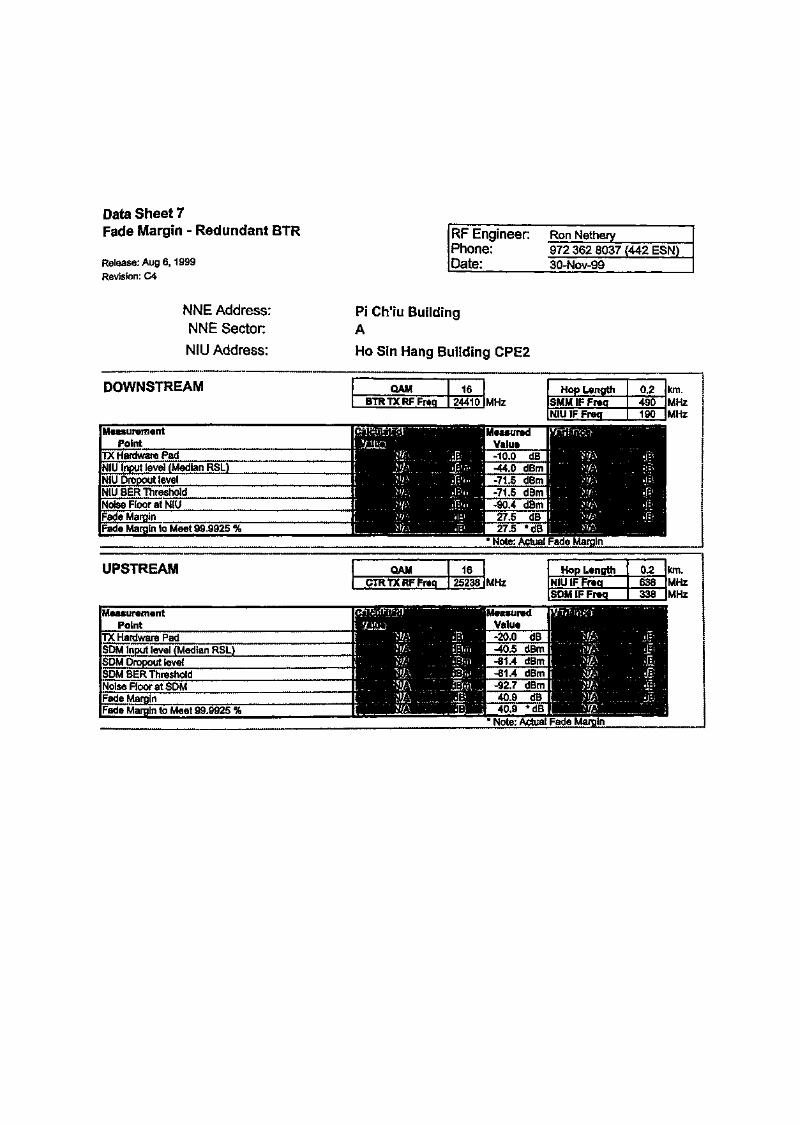
Data Sheet 7Fade Margin - Redundant BTR
Release: Aug 6,1999Revision: C4
RF Engineer:Phone:Date:
Ron Nethery
972 362 8037 (442 ESN)
SO-Nov-99
NNE Address:NNE Sector:
NIU Address:
Pi Ch'iu BuildingA
Ho Sin Hang Building CPE2
DOWNSTREAM QAMBTRTXRFFreq
1624410 MHz
Hop LengthSMM IF FrsqNIU IF Fraq
0.2490190
km.MHzMHz
MeasurementPoint
TX Hardware PadNIU input level (Median RSL)TNIU Dropout levelNIU BER ThresholdNoise Floor at NiUFade MarginFade Margin to Meet 99.9925 %
* Note: Actual Fade Margin
UPSTREAM QAMCTRTXRFFreq
1625238
MeasurementPoint
TX Hardware PadSDM Input level (Median RSL]_SDM Dropout levelSDM BER ThresholdNoise Floor at SDMFade MarginFade Margin to Meet 99.9925 %
km.MHzMHz
* Note: Actual Fade Margin

Appendix 3E - BERT CPE 1
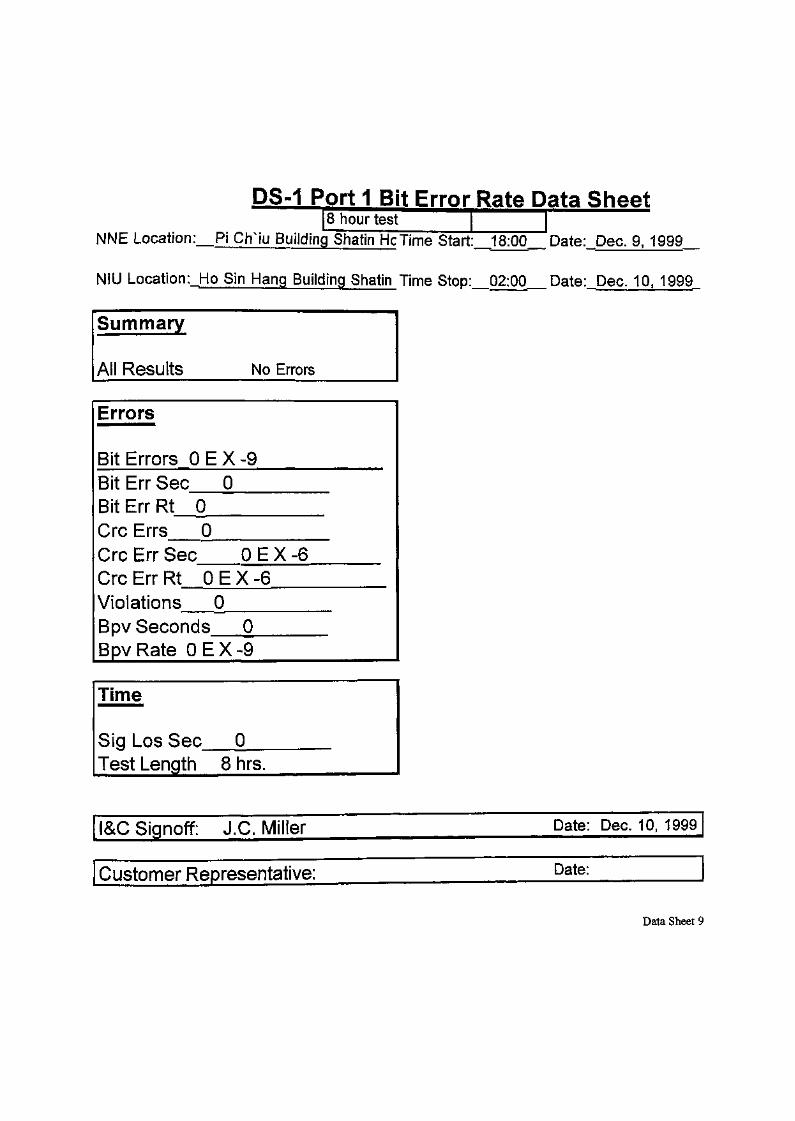
DS-1 Port 1 Bit Error Rate Data Sheet8 hour test
NNE Location: Pi CrTiu Building Shatin He Time Start: 18:00 Date:_Dec. 9, 1999_
NIU Location:_Ho Sin Hang Building Shatin Time Stop: 02:00 Date:_Dec. 10, 1999_
Summary
All Results No Errors
Errors
Bit Errors O E X -9Bit Err Sec 0Bit Err Rt 0Crc Errs 0Crc Err SecCrc Err Rt 0 E
O E X - 6X-6
Violations 0Bpv SecondsBpv Rate O E X
0-9
Time
Sig Los SecTest Length 8
0hrs.
I&C Signoff: J.C. Miller Date: Dec. 10, 1999
Customer Representative: Date:
Data Sheet 9

Appendix 3F - BERT CPE 2

DS-1 Port 1 Bit Error Rate Data Sheet8 hour test
NNE Location: Pi Chlu Building Shatin He Time Start: 18:00 Date:_Dec. 7, 1999_
NIU Location:_Ho Sin Hang Building Shatin Time Stop:_02:00 Date:_Dec. 8, 1999_
Summary
All Results No Errors
Errors
Bit Errors O E X - 9Bit Err SecBit Err Rt 0Crc Errs 0
O E X - 6Crc Err SecCrc Err Rt O E X - 6Violations 0Bpv Seconds 0Bpv Rate O E X - 9
Time
Sig Los SecTest Length 8 hrs.
I&C Signoff: J.C. Miller Date: Dec. 8, 1999
Customer Representative: Date:
Data Sheet 9

Appendix 3 G -NNE Ping test (CPE 1 and 2)
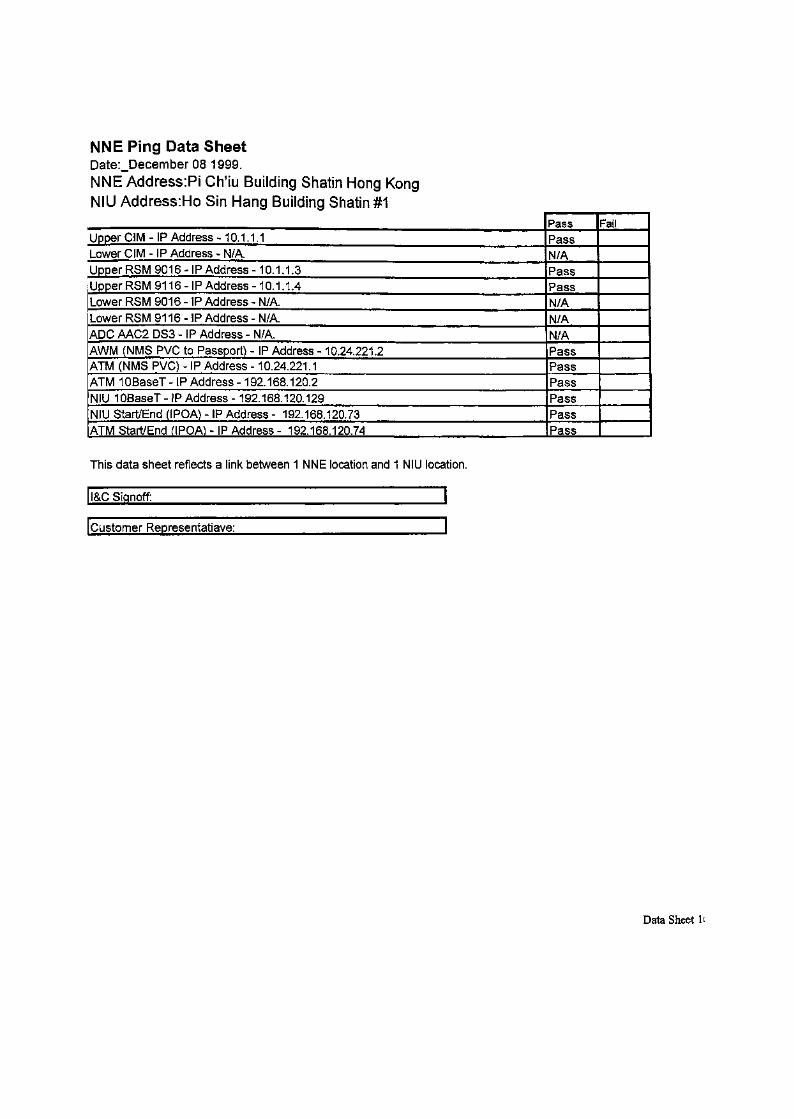
NNE Ping Data SheetDate:_December 08 1999.NNE Address:Pi Ch'iu Building Shatin Hong KongNIU Address:Ho Sin Hang Building Shatin #1
Upper CIM - IP Address - 10.1.1.1Lower CIM - IP Address - N/AUpper RSM 9016 - IP Address - 10.1.1.3Upper RSM 91 16 - IP Address - 10.1.1.4Lower RSM 9016 - IP Address - N/A.Lower RSM 91 16 - IP Address - N/A.ADC AAC2 DS3 - IP Address - N/A.AWM (NMS PVC to Passport) - IP Address - 10.24.221.2ATM (NMS PVC) - IP Address - 10.24.221.1ATM 10BaseT - IP Address - 192.168.120.2NIU 10BaseT - IP Address - 192.168.120.129NIU Start/End (IPOA) - IP Address - 192.168.120.73ATM Start/End flPOA) - IP Address - 192.168.120.74
PassPassN/APassPassN/AN/AN/APassPassPassPassPassPass
Fail
This data sheet reflects a link between 1 NNE location and 1 NIU location.
H&CSignoff:
I Customer Representatiave:
Data Sheet H
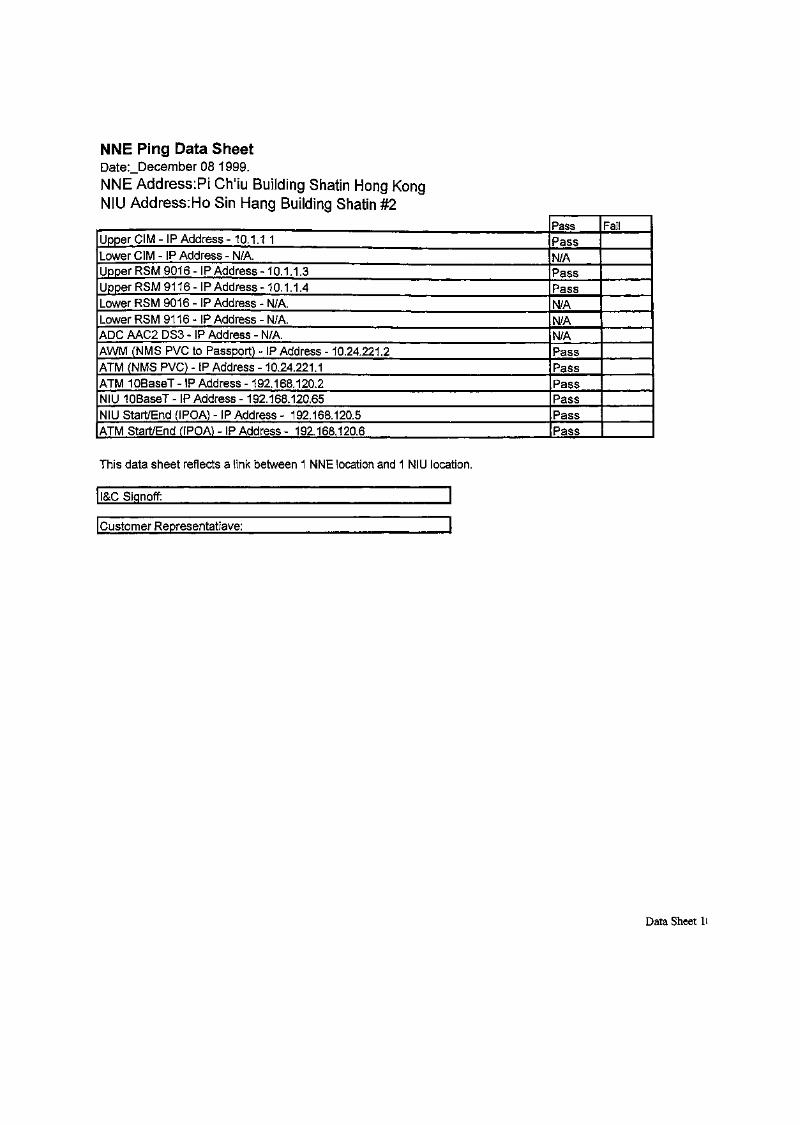
NNE Ping Data SheetDate:_December 08 1999.NNE Address:Pi Ch'iu Building Shatin Hong KongNIU Address:Ho Sin Hang Building Shatin #2
Upper CIM - IP Address - 10.1.1 1Lower CIM - IP Address - N/A.Upper RSM 9016 - IP Address - 10.1.1.3
Upper RSM 91 16 -IP Address -10.1. 1.4Lower RSM 9016 - IP Address - N/A.Lower RSM 91 16 - IP Address - N/AADC AAC2 DS3 - IP Address - N/A.AWM (NMS PVC to Passport) - IP Address - 10.24.2212ATM (NMS PVC) - IP Address - 10.24.221.1ATM 10BaseT- IP Address- 192.168.120.2NIU 10BaseT - IP Address - 192.168.120.65NIU Start/End (IPOA) - IP Address - 192.168.120.5ATM Start/End (IPOA) - IP Address - 192.168.120.6
PassPassN/APassPassN/AN/AN/APassPassPassPassPassPass
Fail
This data sheet reflects a link between 1 NNE location and 1 NIU location.
ll&CSiqnoff:
I Customer Representatiave:
Data Sheet H
Appendix 3H -NIU Ping test (CPE 1 and 2)
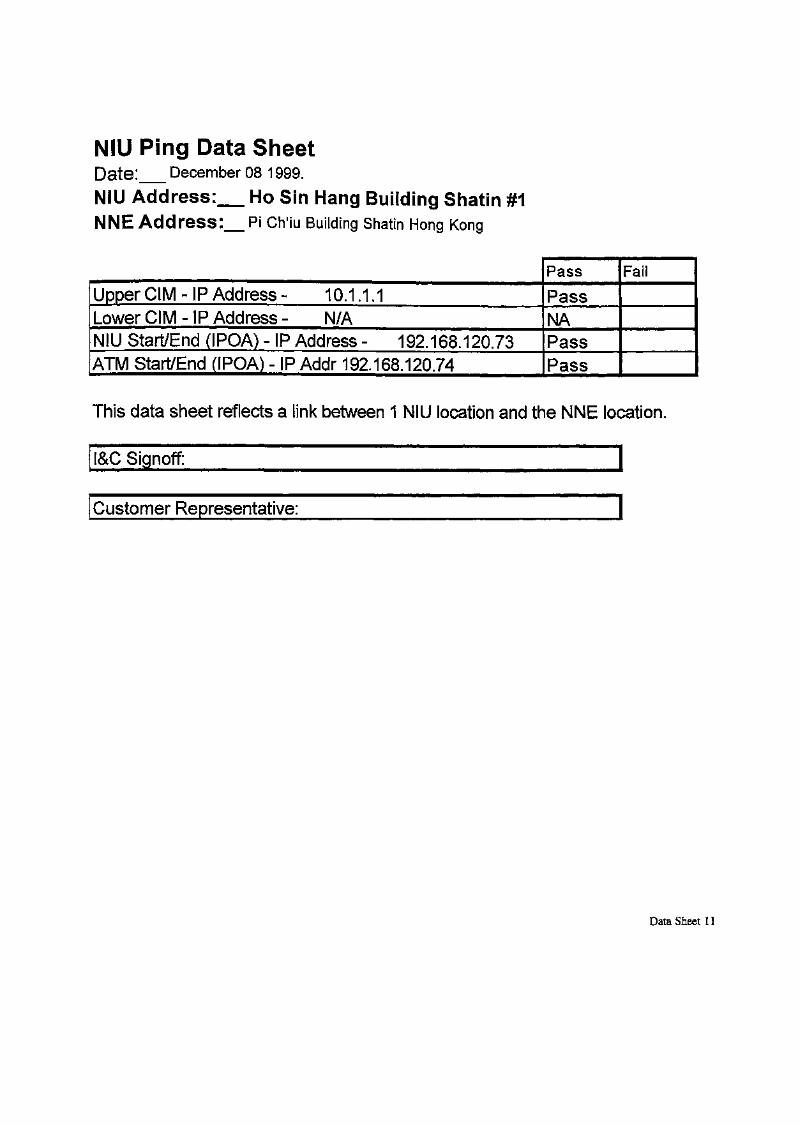
NIU Ping Data SheetDate: December 08 1999.
NIU Address: Ho Sin Hang Building Shatin #1NNE Address: Pi Ch'iu Building Shatin Hong Kong
Upper CIM - IP Address - 10.1.1.1Lower CIM - IP Address - N/ANIU Start/End (IPOA) - IP Address - 192.168.120.73ATM Start/End (IPOA) - IP Addr 192.168.120.74
Pass
PassNAPassPass
Fail
This data sheet reflects a link between 1 NIU location and the NNE location.
I&C Signoff:
Customer Representative:
Data Sheet 11
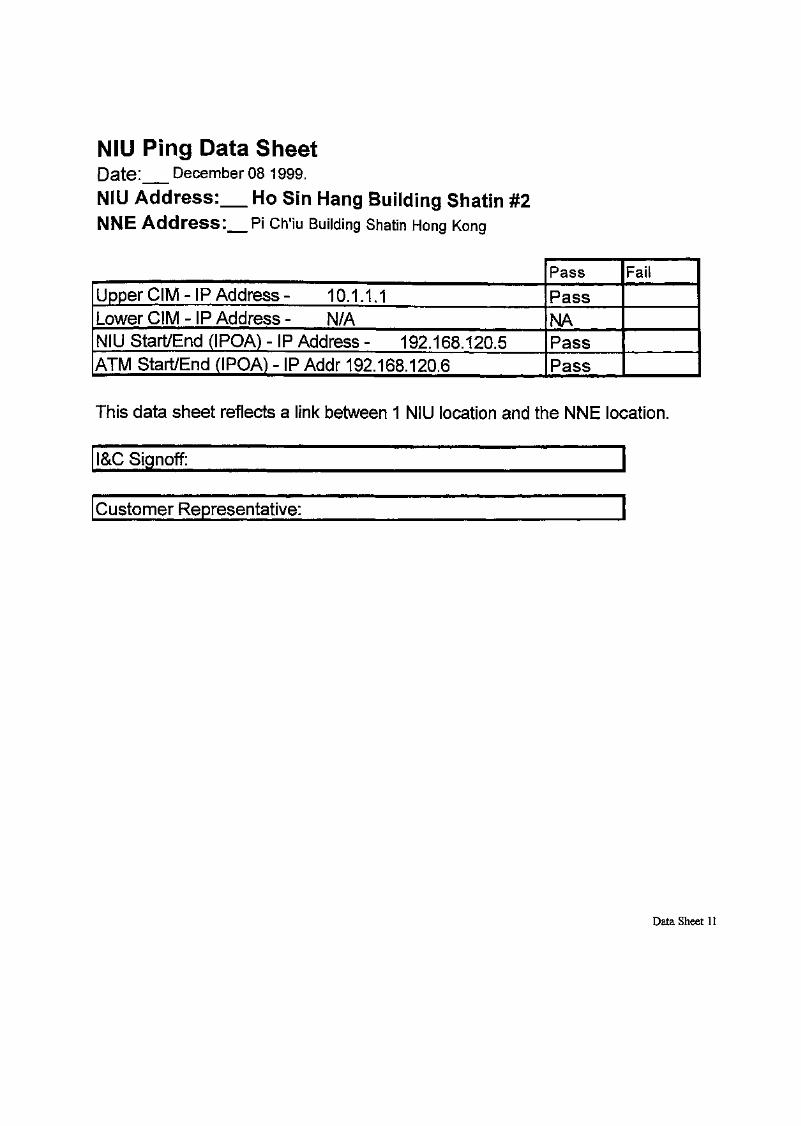
NIU Ping Data SheetDate: December 08 1999.
NIU Address: Ho Sin Hang Building Shatin #2NNE Address: Pi Ch'iu Building Shatin Hong Kong
Upper CIM - IP Address - 10.1.1.1Lower CIM - IP Address - N/ANIU Start/End (IPOA) - IP Address - 192.168.120.5ATM Start/End (IPOA) - IP Addr 192.168.120.6
Pass
PassMAPassPass
Fail
This data sheet reflects a link between 1 NIU location and the NNE location.
I&C Signoff:
Customer Representative:
Datasheet 11
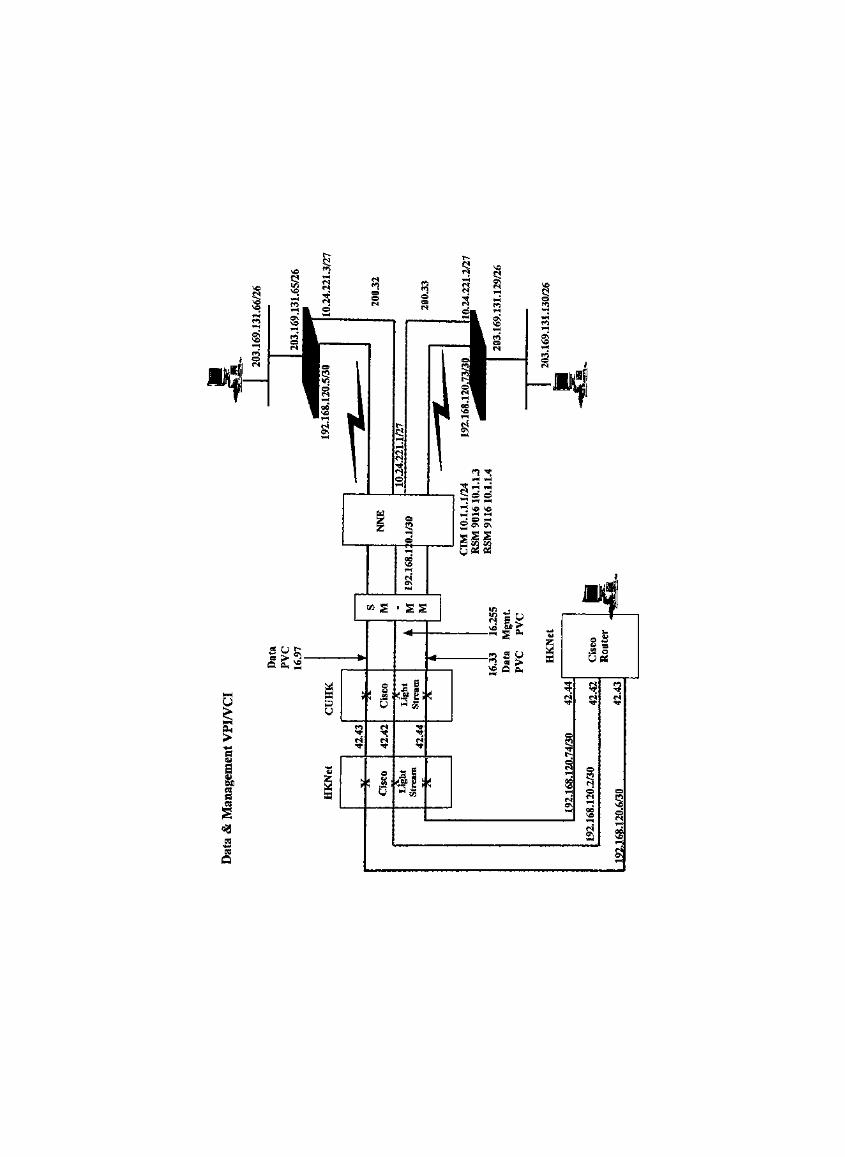

Ihtoufthput (FTP) Tgfit
PC specification:
1. Desktop PC
2. Windows 95
3. 32 Ram
4. PII 266MHz
5. 3Com NIC (3C905B)
Analysis:
1. Average Download/Upload speed for 1M file is 667.02 kbytes/s (5.2Mbit/s) and
561.93 kbytes/s (4.4 Mbit/s) respectively
2. Average Download/Upload speed for 10M file is 648.81 kbytes/s (5.1 Mbit/s) and
623.25 kbytes/s (4.9 Mbit/s) respectively
NIU1Files Size: 1,048,576 bytes
1234567891011121314151617181920AverageMaxMin
D/L Speed(kbytes/s)659.48680.89659.48659.48659.48680.89655.36659.48655.36685.34659.48659.48685.34680.89659.48659.48659.48680.89659.48680.89667.02685.34655.36
U/L Speed(kbytes/s)579.32560.74579.32579.32563.75616.81560.74543.30543.30579.32546.13560.74444.31546.13579.32560.74563.75579.32576.14576.14561.93616.81444.31
Files Size: 10,319,664 bytes
1234567891011121314151617181920AverageMaxMin
D/L Speed(kbytes/s)656.89606.33652.32654.80632.33650.26656.89650.26652.32624.30652.32656.89652.32652.32652.32656.89650.26656.89654.39654.80648.81656.89606.33
U/L Speed(kbytes/s)635.06638.19661.32648.22630.40661.52569.52652.32541.43654.80632.72654.80630.40656.89637.02610.27654.39547.75645.79502.17623.25661.52502.17
Remark:
1 kbytes = 1024 x 8 = 8024 bit/s

Average Download/Upload speed for 1M file is 637.68 kbytes/s and 579.78 kbytes/srespectively.
Average Download/Upload speed for 10M file is 665.03 kbytes/s and 617.09 kbytes/srespectively.
NIU2Files Size: 1,048,576 bytes
1234567891011121314151617181920AverageMaxMin
D/L Speed(kbytes/s)659.48659.48680.89659.48680.89708.50680.89680.89659.48680.89655.36576.14659.48655.36659.48685.34680.89680.89680.89680.89637.68708.50576.14
U/L Speed(kbytes/s)563.75532.27579.32579.32560.74595.78579.32579.32560.74599.19639.38579.32576.14576.14595.78576.14599.19599.19560.74563.75579.78639.38532.27
Files Size: 10,319,664 bytes
1234567891011121314151617181920AverageMaxMin
D/L Speed(kbytes/s)654.80656.89654.39654.80656.89675.81675.81670.98668.81658.98675.81673.61675.81670.98673.61668.81670.98632.33658.98671.42665.03675.81632.33
U/L Speed(kbytes/s)608.11647.81663.64557.52650.26484.26641.37622.04645.38632.72664.07650.26562.69630.79557.52619.80650.26572.68650.26630.40617.09664.07484.26
Remark:
1 kbytes = 1024 x 8 = 8024 bit/s
PSIrtlet
PSINET
Wireless Test and Evaluation Report
Date: 30 December 1999
PSINet
Table of Contents
/. Site Information 4
2. Introduction 5
3. Network Diagram 6
4. T&E Equipment List 7
5. Test Equipment Requirements 8
6. Service 9
6.1 Ethernet Services 9
6.2 Service Quality 11
7. Base Station Test 12
7.1 Initialization and Functional Test 12
7.2 RF Unit Performance 13
7.3 Exception Handling at BTS Site 17
8. NIU - Network Interface Unit Test 19
8.1 Initialization and Functional Test 19
8.2 Exception Handling at CPE Site 20
9. NMS Support 21
9.1 BTS NMS Support 21
9.2 CPE NMS Support 22
9.3 General Wireless NMS Support 24
10. Voice over IP 23
PSINet Hong Kong Ltd.
18/F., Lever Center, 69-71 King Yip Street, Kwun Tong, Kowloon, H.K.tel 852.2331.8123 • fax 852 2795.1262 « www psinet.com hk
PSIftet
List of Figures
Figure 1: PSINET'S T&E Network Diagram 6Figure 2: PSINET Network diagram using 36150 to access Ethernet 10
List of Tables
Table 1: Site Information 4Table 2: Test Equipment for the Field 8
PSINet Hong Kong Ltd.
18/F., Lever Center, 69-71 King Yip Street, Kwun Tong, Kowloon, H.K.tel 852.2331.8123 • fax 852.2795.1262 • www.psinet.com.hk
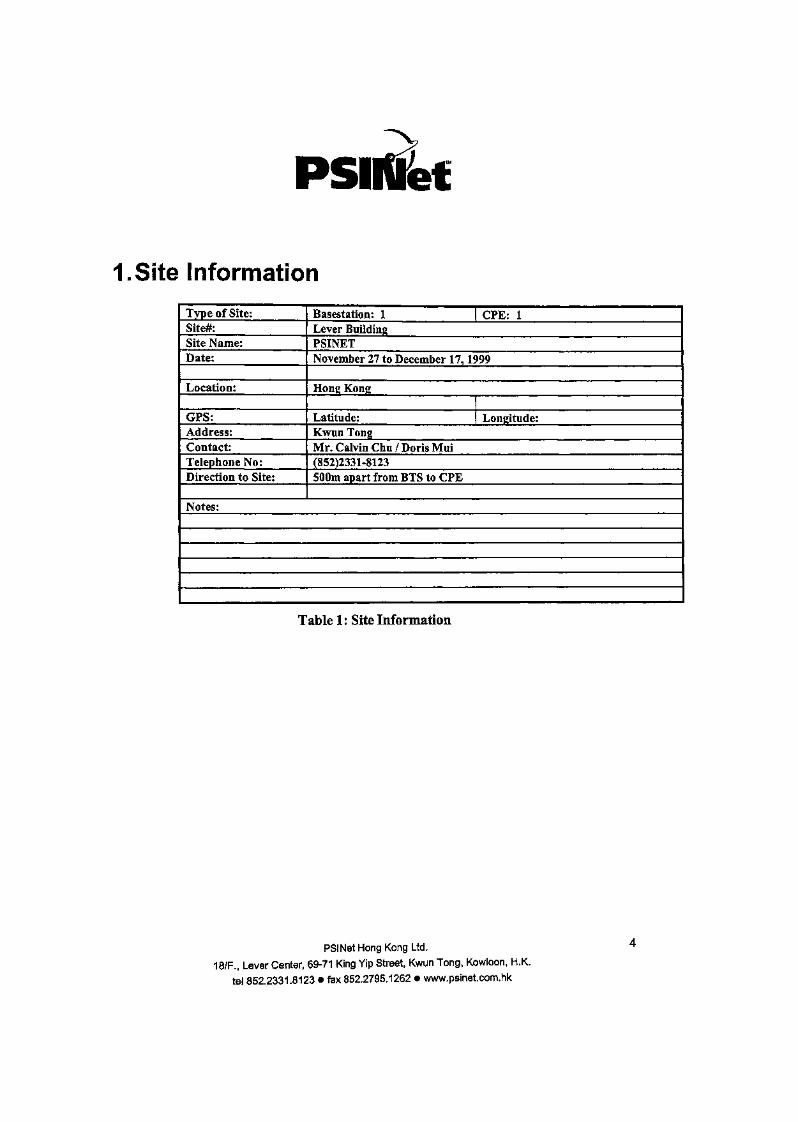
-v
PSIItlet
LSite Information
Type of Site:Site#:Site Name:Date:
Location:
GPS:Address:Contact:Telephone No:Direction to Site:
Basestation: 1 | CPE: 1Lever BuildingPSINETNovember 27 to December 17, 1999
Hong Kong
Latitude: Longitude:Kwun TongMr. Calvin Chu / Doris Mui(852)2331-8123500m apart from BTS to CPE
Notes:
Table 1: Site Information
PSINet Hong Kong Ltd.
18/F., Lever Center, 69-71 King Yip Street, Kwun Tong, Kowloon, H.K.tel 852.23318123 • fax 852.2795.1262 • www.psinetcom.hk

psirticret2JntroducfionDOCUMENT SCOPE
The intent of the PSINET Wireless Test Plan is to demonstrate the Wireless Solution andits capabilities. The document will cover the following functionality(Triai period: Nov 27to Dec 17,1999)
Services (Ethernet)BTS Station UnitCPE Station UnitNMS SupportVoice over IP
PSINet Hong Kong Ltd.
18/F., Lever Center, 69-71 King Yip Street, Kwun Tong, Kowloon, H.K.tel 852.2331.8123 • fax 852.2795.1262 • www.psinetcom.hk
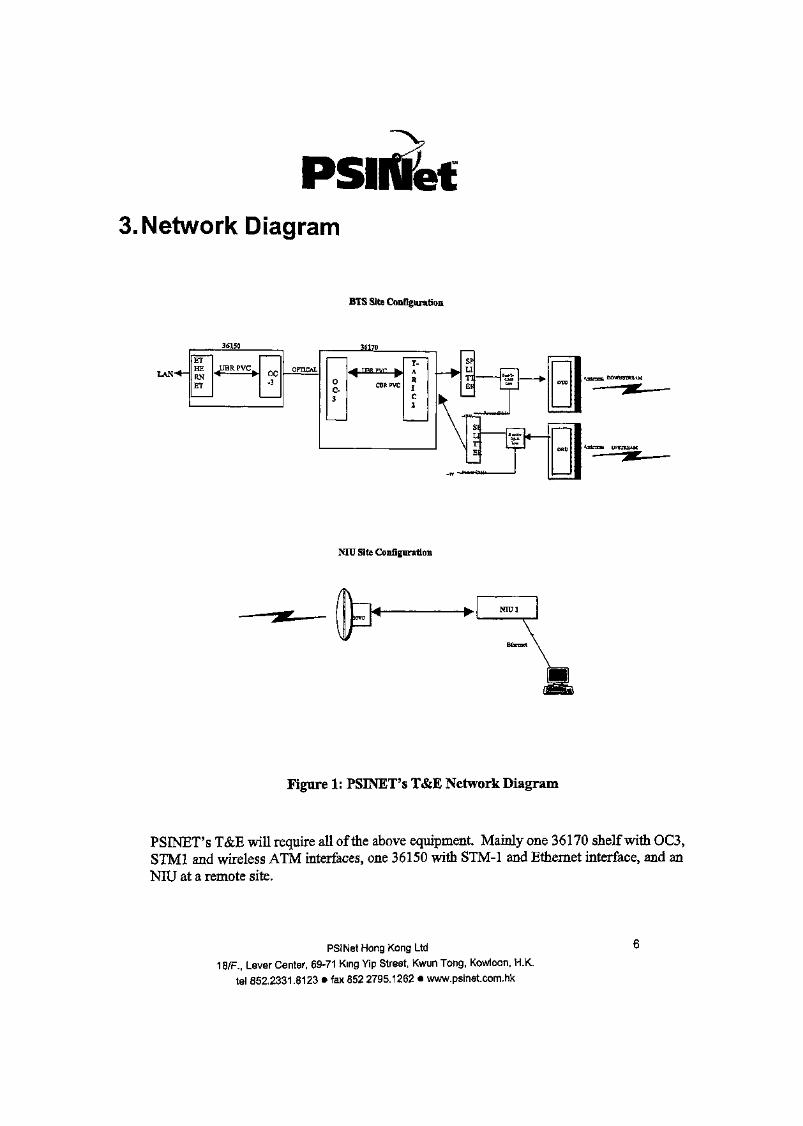
PSIlUet3. Network Diagram
BTS Site Configuration
361SO
ETHERNET
JUBRPVC oc-3
OPTICAL
o3
^fljj TTRR PVP hfe
GBR PVC
T-ARjf<
2
.. -^
k\\ -\
\
SPLIn-F,P
sL
, T
E
P4
I
I
I .
0.L.
o7i*
^
:K-
OTC
NIU Site ConfiguratioBi
)TRU
/
jdH IhijUjj po NIU1
\
Figure 1: PSINET'S T&E Network Diagram
PSINET'S T&E will require all of the above equipment. Mainly one 36170 shelf with OC3,STM1 and wireless ATM interfaces, one 36150 with STM-1 and Ethernet interface, and anNIU at a remote site.
PSINet Hong Kong Ltd
18/F., Lever Center, 69-71 King Yip Street, Kwun long, Kowloon, H.K.
tel 852.2331.8123 • fax 852 2795.1262 • www.psinetcom.hk
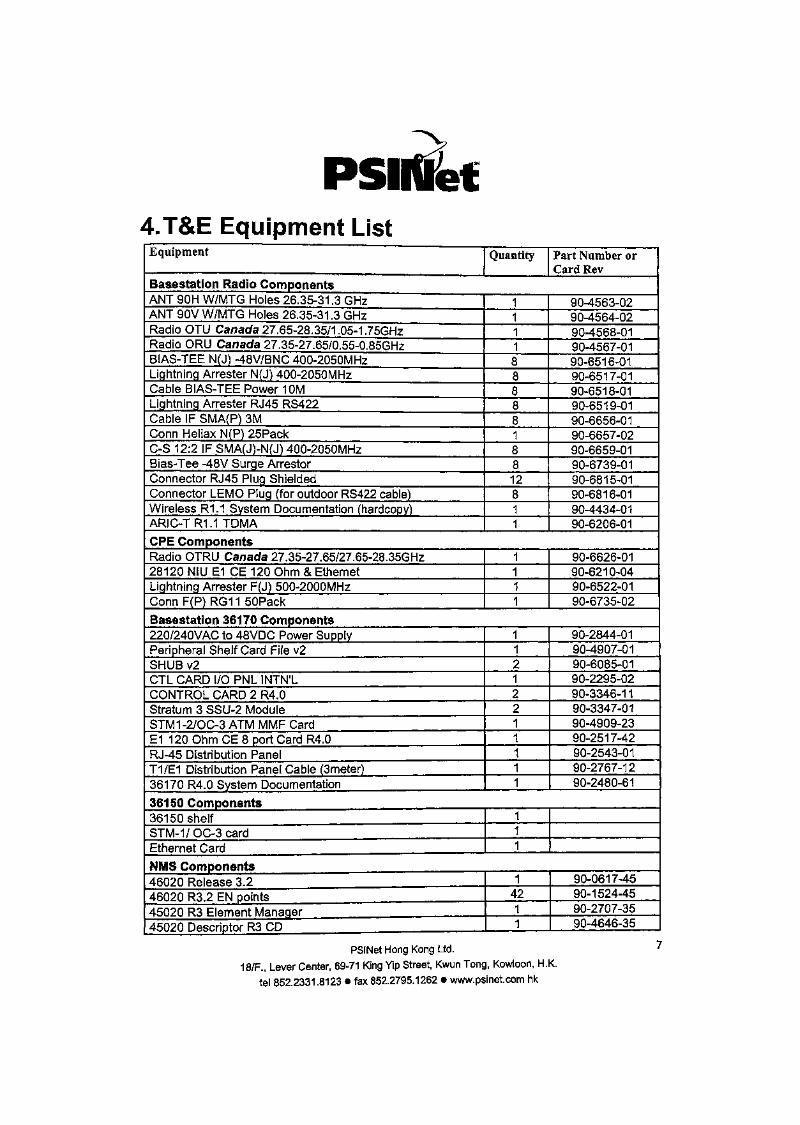
PSIItlet4.T&E Equipment List
Equipment Quantity Part Number orCard Rev
Basestation Radio ComponentsANT 90H W/MTG Holes 26.35-31.3 GHzANT 90V W/MTG Holes 26.35-31.3 GHzRadio OTU Canada 27.65-28. 35/1. 05-1. 75GHzRadio ORU Canada 27.35-27.65/0.55-0.85GHzBIAS^TEE N(J) -48V/BNC 400-2050MHzLightning, Arrester N(J) 400-2050MHzCable BIAS-TEE Power 10MLightning Arrester RJ45 RS422Cable IF SMA[P) 3MConn Heliax N(P) 25PackC-S 12:2 IF SMA(J>N(J) 400-2050MHzBias-Tee -48V Surge ArrestorConnector RJ45 Plug ShieldedConnector LEMO Plug (for outdoor RS422 cable)Wireless R1.1 System Documentation (hardcopy)ARIC-TR1.1 TDMA
11118888818812811
90-4563-0290-4564-0290-4568-0190-4567-0190-6516-0190-6517-0190-6518-0190-6519-0190-6656-0190-6657-0290-6659-0190-6739-0190-6815-0190-6816-0190-4434-0190-6206-01
CPE ComponentsRadio OTRU Canada 27.35-27.65/27.65-28.35GHz28120 NIU E1 CE 120 Ohm & EthernetLightning Arrester F(J) 500-2000MHzConnF(P)RG11 SOPack
1111
90-6626-0190-6210-0490-6522-0190-6735-02
Basestatlon 36170 Components220/240VAC to 48VDC Power SupplyPeripheral Shelf Card File v2SHUB v2CTL CARD I/O PNL INTN1CONTROL CARD 2 R4.0Stratum 3 SSU-2 ModuleSTM1-2/OC-3 ATM MMF CardE1 120 Ohm CE 8 port Card R4.0RJ-45 Distribution PanelT1/E1 Distribution Panel Cable (3meter)36170 R4.0 System Documentation
11212211111
90-2844-0190-4907-0190-6085-0190-2295-0290-3346-1 190-3347-0190-4909-2390-2517-4290-2543-0190-2767-1290-2480-61
36150 Components361 50 shelfSTM-1/OC-3cardEthernet Card
111
NMS Components46020 Release 3.246020 R3.2 EN points45020 R3 Element Manager45020 Descriptor R3 CD
14211
90-0617-4590-1524-4590-2707-3590-4646-35
PSINet Hong Kong Ltd.18/F., Lever Center, 69-71 King Yip Street, Kwun Tong, Kowloon, H.K.
tel 852.2331.8123 • fax 852.2795.1262 • www.psinet.com hk

PSINetS.Test Equipment Requirements
There are basically 3 major pieces of test equipment, covering the IF, baseband(data) interfaces and voltages used to debug either the basestation or CPEequipment. The following is a list of Field oriented test equipment that will beused to commission the sites and perform RF measurements.
List of Field Oriented Test Equipment
1
2
3
4
567
. HP8560ESpectrum Analyzer
. AnritsuS331ASite Master
. HP8648CSignal Generator
. Fireberd6000(with El moduleand cable)
. Inclinometer
. Compass or Map
. Miscellaneous
« Spectrum Analyzer has a range of 30Hz to 2.9GHz* For checking IF signal quality, interference, power levels, etc. . .
• Basestation cable loss measurement and calibration
« Signal Generator has a range of 9KHz to 3.2GHz• For generating tone Signal to measure cable loss.
• Data (BERT) test set for El Links
• For elevation angle measurement at the BTS site• For azimuth angle measurement at the BTS site• Various Test Cables, Adapters, Power Cables, Hub, DMMS,
PCs, etc...
Table 2: Test Equipment for the Field
PSINet Hong Kong Ltd.
18/F., Lever Center, 69-71 King Yip Street, Kwun long, Kowloon, H.K.
tel 852.2331.8123 • fax 852.2795.1262 • www.psinet.com.hk
6. ServiceSCOPEThis section of the test plan covers the Ethernet services provided by the Wirelesssolution.
TEST CASE DESCRIPTION
6,1 Ethernet Services
Test Case #1 - PC to PC Access using 36150The purpose of this test is to show that Ethernet services can be provided overwireless by connecting PCs to the Ethernet port of NIUs directly at the CPE sites andusing 36150 at the BTS site.
Configuration -1Connect a PC to the base station using a 36150 and 36170.Connect a second PC to the Ethernet port of the remote NIU.
Result: The users are able to ping and download file from Web pages overWireless.
The PC is able to ping and download file from web pages over wireless.
PSINet Hong Kong Ltd.
18/F., Lever Center, 69-71 King Yip Street, Kwun Tong, Kowloon, H.K.tel 852.2331.8123 • fax 852.2795 1262 • www.psinet.com.hk
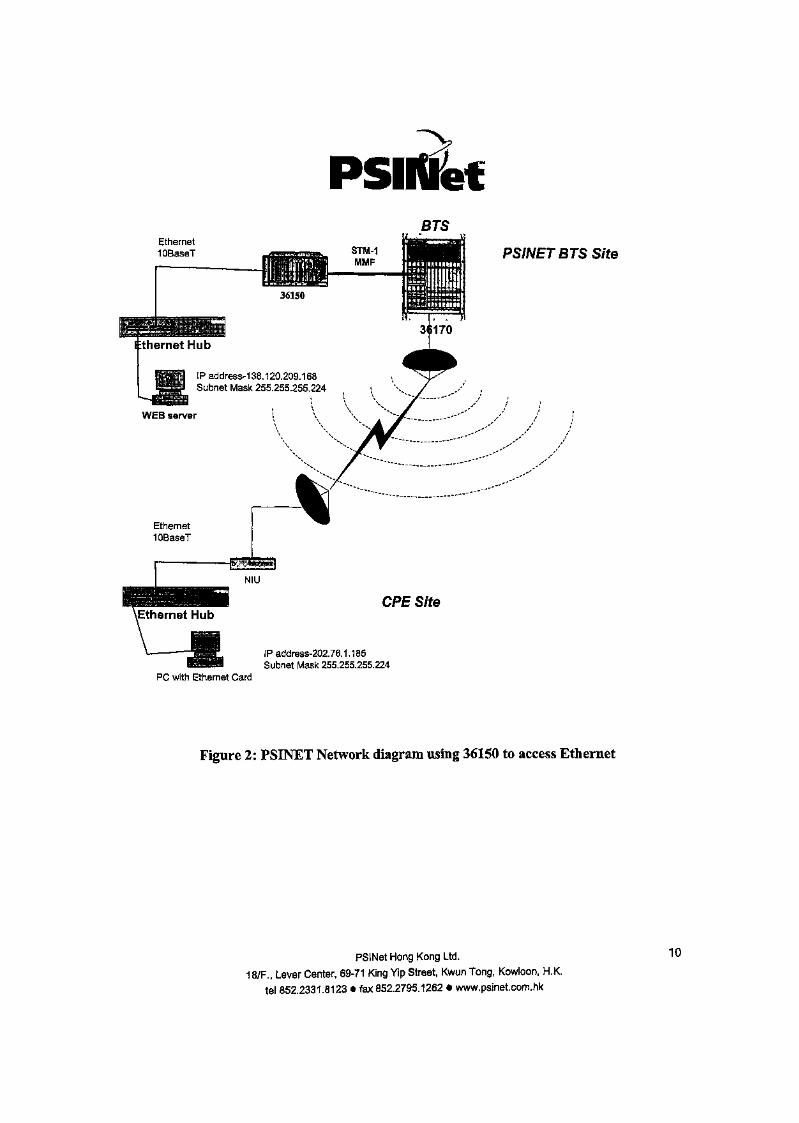
PSINetBTS
Ethernet10BaseT
IPaddress-138.120.209.168Subnet Mask 255.255.255.224
PSINET BTS Site
CPE Site
IPaddress-202.76.1.185Subnet Mask 255.255.255.224
PC with Ethernet Card
Figure 2: PSINET Network diagram using 36150 to access Ethernet
PSINet Hong Kong Ltd.
18/F., Lever Center, 69-71 King Yip Street, Kwun Tong, Kowloon, H.K.
tel 852.23318123 • fax 852.2795.1262 • www.psinet.com.hk
10
PSINet6.2 Service Quality
SCOPEThis section of the test plan covers the quality of the Ethernet services provided by theWireless solution.
TEST CASE DESCRIPTION
Test Case #1 - Long RunIn this test we want to observe how long the PCs will remain pinging each otherwithout being cut-off. The test run for a minimum of 2 hours.
ConfigurationEstablish an Ethernet connection between the NIU's Ethernet port and the PC atBTS or 2nd NIU. Start Pinging from one of the PCs and let the connection run forat least 2 hours.
Result: The result shows the link keep alive and without interruption during thetesting period, and this guarantee a stable & reliable IP transport over the LMDSlink, hence suitable for IP application likely broadband internet access. Theaccess speed for internet access and interactive internet application reachapproximately 2Mbps for a single user, and this prove the network support IPbased video application.
22MB files was downloaded using the wireless through the PSINet ISP backbone, theresult are:
PCI with: P5 300MHz, 96M RAM, 4G harddisk used 1 minutes and 30 sec. Thebandwidth is using 2M, approximate calculation, 22M* 8 bit 790 sec = 1.96 Mbps
PC2 with: P5 266MHz, 96M RAM, 4G harddisk used 1 minutes and 35 sec. Thebandwidth is using 2M, approximate calculation, 22M*8 bit / 95 sec = 1.85 Mbps
As a result, the 4 M bandwidth, is used up in the 6 M bandwidth of NIU.
Test Case #2 - Traffic StatisticsVerify the ATM traffic using the NMTI screen.
PSINet Hong Kong Ltd.
18/F., Lever Center, 69-71 King Yip Street, Kwun long, Kowloon, H.K.tel 852.2331,8123 • fax 852.2795.1262 • www.psmet.com.hk
PSItilet
7. Base Station Test
7.1 Initialization and Functional Test
SCOPEThis section covers the Base Station Initialization Procedure during Power On.
TEST CASE DESCRIPTION
Test Case #1 - Power-On InitializationDemonstrate that the system is correctly initialized when power is turned on.
ConfigurationPower up the System
Result: System is initialized in a pre-determined time (in this trial, 4 mins) oncepower is fed.
The LED system start-up sequence is as expected
Test Case #2 - Console/Reset InitializationShow that a console reset and H/W reset are correctly made when any faultoccurs to the system.
Configuration-1Using NMTI cause the system to reset.
Result: System is initialized in a pre-determined time (in this trial, 4 mins) afterthe console reset.
The LED system start-up sequence is as expected
Configuration-2Cause a H/W reset
Result: System is initialized in a pre-determined time after a H/W reset.The LED system start-up sequence is as expected.
The timing for T-ARIC pull out the card and reset: 1 minutes and 50 sec to bringthe Radio back.
PSINet Hong Kong Ltd. 12
18/F., Lever Center, 69-71 King Yip Street, Kwun long, Kowloon, H.K.tel 852.2331.8123 • fax 852.2795.1262 • www.psinet.com.hk
PSINetThe timing for 36170shelf power down: 4 minutes to bring the whole system back
7-2 RF Unit Performance
SCOPEThis section covers some of the RF performance and specifications.
1. Modulation Scheme:Down Link : 26.2Msps transmission rate, QPSKUp Link : 6.4Msps transmission rate, DQPSK
2. Polarization:Down Link : V Linear with -24dB Isolation for cross polarizationUp Link : H Linear with -30dB mainbeam isolation & -15dB
side/backlobes isolation for cross polarization3. Theoretical Link Budget in this T&E:
13PSINet Hong Kong Ltd.
18/F., Lever Center, 69-71 King Yip Street, Kwun Tong, Kowloon, H.K.tel 852.2331.8123 • fax 852.2795.1262 • www.psinet.com.hk
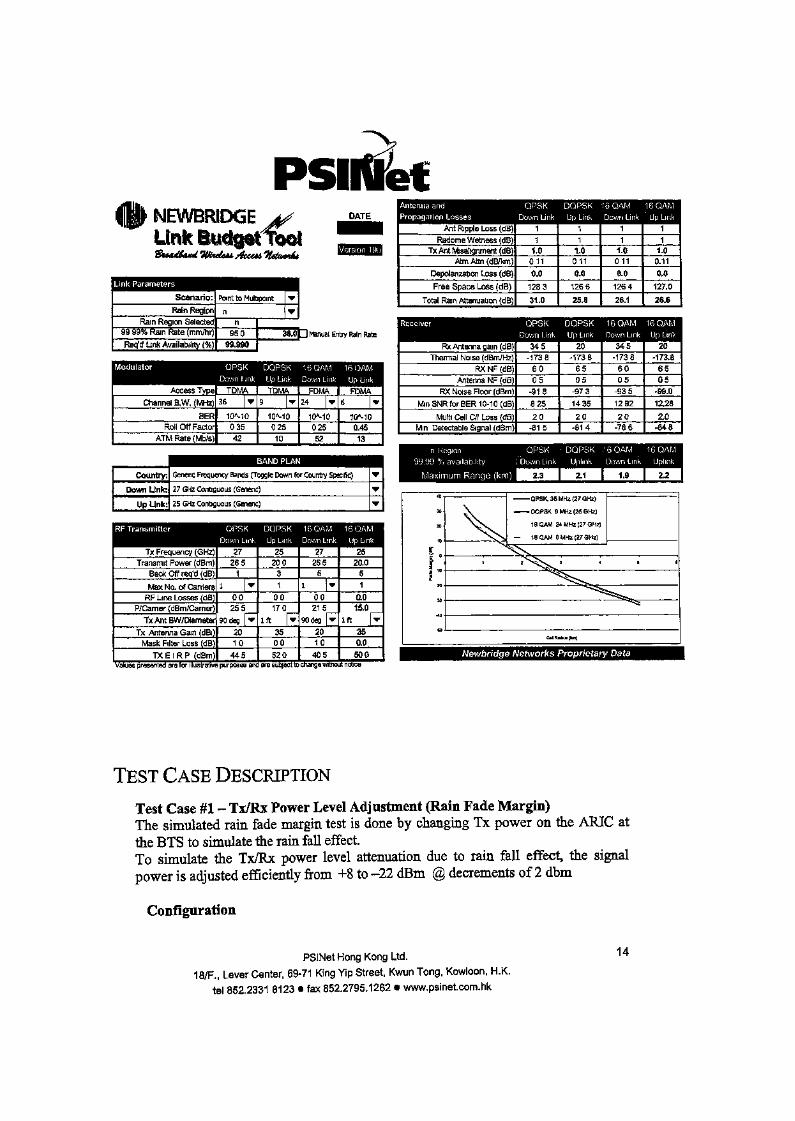
PSINetNEWBRIDGE j?Link Budget Tool
DATE
Link Parameters
Scenario:
Rain RegionRam Region Selected
99 99% Rain Rate (mm/hr)
fteq*d Link Availability (%)
Point to Multipoint
950$9,990
i tepaian^:PTOpagatidn:lbsses;;":s::S;;i;y|:^s?J^
Ant Ripple Loss (dB)Radome Wetness (dB)
Tx Ant Misalignment (dB)Atm Attn (dB/km)
Depolanzatwn toss (dB)
Free Space Loss (dB)
Total Rain Attenuation (dB)
11
1.00110.0
1283
31.0
11
1.00110,0
1266
25.8
11
1.00110.0
1264
26.1
11
1.00.11
0,0
127,0
26.6
3&OP Manual Entry Rain Rate
Access Type]
Channel B,W, (MHz)
BERRoll Off Factor
ATM Rate (Mb/s)
| <
10MO
03542
10A-1002510
10MO
02552
1QMO
0,45
13
Country;!
Down Unklj
UpUnk;
Genenc Frequency Bands (Toggle Down for Country Specific)
27 GHz Contiguous (Genenc)
25 GHz Contiguous (Genenc)
'RStir? itt6rJ;g^
^SiflSS^SS'STx Frequency (GHz)
Transmit Power (dBm)Back Off req'd (dB)
Max No, of CarriersRF Line Losses (dB)
P/Carner (dBm/Camer)
TxAntBW/OtemeterTx Antenna Gam (dBi)
Mask Filter Loss (dB)
TX E I R P (dBm)
27265
1
1 ^
00255
90deg [*
2010
445Values presented are for illustrative purposes anc
25200
31
00170
1ft [V3500520
27265
51 v
00215
90deg [
2010
405
2520,0
51
0.015.0
1ft [
3S0,0500
are subject to change without notice
Meivw;l;;:>:|^•H£C:::
Rx Antenna gam (dB)Thermal Noise (dBm/Hz)
RX NF (dB)
Antenna NF (dB)RX Noise Floor (dBm)
MmSNRforBER10-10(dB)
Multi Cell C/l Loss (dB)Mm Detectable Signal (dBm)
345-1738
6005
-918
825
20-815
20-1738
6505
-973
1435
20-814
345-1738
6005
-935
1292
20-786
20-ma
6505
-99,0
12,28
2,0-848
n Region I QPSK 1 DQPSK §16 QAM 116 QAM99.99 % availability f Down Link 1 Upiink | Down Link | Uplink
40-
30-
10 •
s .
*I "'
50-
QFSK, 36 MHz (27 GHz)
\ DQPSK 9 MHz (25 GHz)
\X. 1 6 QAM 24 MHz (27 GHz)
^xNs — 16 QAM 6 MHz (27 GHz)
,-v ,
^%^^^555^^
^54
CaB Radius (km)
Ate
TEST CASE DESCRIPTIONTest Case #1 - Tx/Rx Power Level Adjustment (Rain Fade Margin)The simulated rain fade margin test is done by changing Tx power on the ARIC atthe BTS to simulate the rain fall effect.To simulate the Tx/Rx power level attenuation due to rain fall effect, the signalpower is adjusted efficiently from +8 to -22 dBm @ decrements of 2 dbm
Configuration
PSINet Hong Kong Ltd.
18/F., Lever Center, 69-71 King Yip Street, Kwun long, Kowloon, H.K.
tel 852.2331 8123 • fax 852.2795.1262 • www.psinet.com.hk
14
v h s PSIItletUsing the Spectrum analyzer, verify the power level. Keep lowering the Tx powerto a predetermine level (+4dbm), the power is still on.
Result: The Link is up and OK.
Test Case # 2 - ffiU-ODU InterfaceVerify the physical interface between the IDU and the ODU for power, Tx, andRx IF signals.The expected results should be:
1- DC-48VDVM2- I/F Downstream-36Mhz
Spectrum Analyzer at Combiners Tx3. I/F UpStream-9Mhz
Spectrum Analyzer at Combiners Rx
Test Case # 3 - RegistrationShow the NIU's registration with the NMTI after start-up
ConfigurationEstablish NMTI communication with the 36170 T-ARIC and cause the wirelesslink to fail. The NIU should be in "out of network" status. Reestablish theconnection and keep refreshing the NMTI screen.
Result: The NMTI shows all the NIU parameters and the status should change to"in network" when registration is complete.
Previous Test Results for Reference:
Due to the time constraint & availability of test equipment to evaluate the RP Test Cases,PSINET accepted the results captured by Newbridge from previous T&E in Hong Kongas reference:
Reference One: Simulated Rain Fade Margin Test
Distance Between BTS & CPE : 2.7km approx.
17 October 1999PSINet Hong Kong Ltd. 15
18/F., Lever Center, 69-71 King Yip Street, Kwun long, Kowloon, H.K.
tel 852.2331.8123 • fax 852.2795.1262 • w\AW.psinet.com.hk
-^v
PSINetTime start the BERT 4:52pm of Oct 16AIS=16 secAVGBER=10E-10Time stopped BERT= 11: Mam of Oct 17TX power = +4dBm
18 October 1999Time start the BERT at 11:20am of Oct 17AIS= 17 secAVGBER=10E-11Time stopped BERT =11:1 Sam of Oct 18TX power at ARIC = ~2dBm
19 October 1999Time start the BERT at 11:20am of Oct 18AIS = 26 secAVGBER=10E-10Time stopped BERT =11: 15am of Oct 19TX power at ARIC = -14dBm
Reference Two: Co-channel Frequency Interference
ConfigurationThis test requires 2 x 90 degree sectors of OTU/RTU at BTS and the downlinkfrequencies to be the same.a. Two OTU/RTUs positioned back-to-backb. Rotate/step one OTU/ORU into 60, 75, 90, 120 degree towards the other
Result: AVE BER was zero for all the 4 different setup.
16PSINet Hong Kong Ltd.
18/F., Lever Center, 69-71 King Yip Street, Kwun long, Kowloon, H.K.tel 852.23318123 • fax 852.2795.1262 « www.psinetcom.hk
~x,
PSIfoet7.3 Exception Handling at BTS Site
SCOPEThis section covers exceptional link loss to the RF equipment up and how the systembehaves in case of any system fault occurrences.
TEST CASE DESCRIPTIONTest Case #1 - Cable Plug after PullVerify the status report and automatic link recovery after disconnecting andreconnecting the RF/IF cable and the network line.
Configuration-1Disconnect the RF/IF Cable. (Tx or Rx)
To set up a UBR test towards Nanyang Plaza El bert test:Log into the 36170 and configure the E1CE port .CONFIG OBJECT PORT <l-7-l>To make the connection on the 36170, select CONFIG CONNECT <Pl-8-l>TOJBNDPOINT < Pl-9-1; NIU268/34 < PROCEED> then SERVICE CATEGORY :Constant Bit RatePEAK RATE :2M
Result: The unit loses sync.was shown on fireberd tester with RED "LED" turnon while we are running 2M El bert.
Bert test result:30 Nov evening to 1 Dec morningTotal time run=57741 secAVGbiterror=10E-09Pat loss=45Sig loss = 0AIS sec=24Power loss=0
Bert test result:IDec afternoon to 3 DecTotal time=l73305 secAVGbiterror=10E-09Patloss=251Sig loss=0AIS sec=80 secPower loss=0
PSINet Hong Kong Ltd. 17
18/F., Lever Center, 69-71 King Yip Street, Kwun long, Kowloon, H.K.tel 852.2331.8123 • fax 852.2795.1262 • www.psinet.com.hk
PSINet
Configuration-!Reconnect the RF/IF Cable. (Tx or Rx)
Result: The original link is restored. The link was down by shown the amber LEDon.
Configuration-3Disconnect the Ethernet Cable.
Result: The Ethernet loses sync. (Pinging will stop)
ConfIguration-4Reconnect the Ethernet Cable.
Result: The Ethernet link is restored within 10 seconds. (Pinging will resume)
18PSINet Hong Kong Ltd.
18/F., Lever Center, 69-71 King Yip Street, Kwun long, Kowloon, H.K.tel 852.2331.8123 • fax 852.2795.1262 • www.psinetcom.hk

psirtiiet8.NIU - Network Interface Unit Test
8.1 Initialization and Functional Test
SCOPEThis section covers the NIU Initialization Procedure during Power up
TEST CASE DESCRIPTION
Test Case #1 - Cold Start-up (Power On/Off)Demonstrate that the system is correctly initialized when power it turned on.
ConfigurationPower up the SystemPoint out the following initialization states
- Downstream Scanning (LED activity)- Upstream Parameters acquisition- Ranging completion
Registration
Result: System is initialized in 50 secondsThe LED system demonstrates the Downstream Scanning
Test Case #2 - Warm Start-upDemonstrate that we can perform a warm start up from the NMTI menu.
ConfigurationUnder the Maintenance menu select the Reset
Result: The NIU resets and comes back up in 50 seconds.
19PSINet Hong Kong Ltd.
18/F., Lever Center, 69-71 King Yip Street, Kwun long, Kowloon, H.K.
tel 852.23318123 * fax 852,2795.1262 • www.psinet.com.hk
PSINet8.2 Exception Handling at CPE Site
SCOPEThis section covers the NIU's exception handling
TEST CASE DESCRIPTION
Test Case #1-EthernetShow how the NIUs Ethernet port recovers from loss of sync
Configuration- 1Disconnect the Ethernet cable between the NIU-E1 and the PC/Hub.
Result: The PC no longer has access to the 2nd PC at the other end.
Configuration- 2Reconnect the Ethernet cable between the NIU-E1 and the PC/Hub.
Result: The Ethernet port should regain sync, the PC should regain pingingthe 2nd PC
Test Case #2 - RFShow how the NIU recovers when it's accidentally loses power.
Configuration- 1Power down the NIU.
Result: The NKJ loses Downstream signal
Configuration- 2Power up the NIU.
Result: Without any intervention the NIU should initialize properly and come up.The RF and Ethernet link should resume as well.
PSINet Hong Kong Ltd.
18/F., Lever Center, 69-71 King Yip Street, Kwun long, Kowloon, H.K.tel 852.2331.8123 * fax 852.2795.1262 • www.psinet.com.hk
PSIflet9. NMS Support
SCOPEThis section covers some general aspects of the NMS and how it interacts with theWireless equipment.The software 46020 Rel.3.2 is the simulator version we are using for the demo.
9.1 BTS NMS Support
TEST CASE DESCRIPTIONTest Case #1 - Base Station Configuration ManagementDemonstrate that it is possible to add, modify, and delete a Base Station throughthe NMS
Configuration- 1: Adding a Base StationAdd a new icon for a Base StationConfigure all the parameters of the Base StationConnect the Base Station and the NIU to the Wireless network
Result: The NMS should display the new icon in Green.
Configuration- 2: Making ChangesPull up the Base Stations configurationMake the required changes, making sure that they coincide with the unit,otherwise the icon will not return to its normal operation color (green)
Result: The NMS should display the new icon in red, since its parameters arenot accurate. Once the changes are completed the icon should become green.
Configuration- 3: Deleting a Base Station from the NMSSelect the Base Station icon and choose to delete it.
Result: The icon will be deleted
PSINet Hong Kong Ltd. 21
18/F., Lever Center, 69-71 King Yip Street, Kwun long, Kowloon, H.K.tel 852.2331.8123 • fax 852.2795.1262 • www.psinet.com.hk
PSINetTest Case #2 - System InformationShow that the Network Manager can display the BTS's system information,such as Ethernet Address, IP Address, S/W Version
ConfigurationPull up the BTS's configuration window
Result: In the window is all the relevant information.
9.2 CPE NMS Support
TEST CASE DESCRIPTIONTest Case #1 - CPE Configuration ManagementDemonstrate that it is possible to add, modify, and delete a CPE throughthe NMS
Configuration- 1: Adding a NIU InformationAdd a new icon for a NIUConfigure the NIU parametersConnect the NIU and the Base Station to the Wireless network
Result: The NMS should display the new icon in Green.
Configuration- 2: Making ChangesPull up the NIU configurationMake the required changes, making sure that they coincide with the unit,otherwise the icon will not return to its normal operation color (green)
Result: The NMS should display the new icon in red, since its parameters arenot accurate. Once the changes are completed the icon should become green.
PSINet Hong Kong Ltd. 22
18/F., Lever Center, 69-71 King Yip Street, Kwun long, Kowloon, H.K.tel 852.2331.8123 • fax 852.2795.1262 • www.psinet.com.hk
PSINet
Configuration- 3: Deleting the NIU from the NMSSelect the Base Station icon and choose to delete it.
Result: The icon will be deleted. This may fail if any links or paths involvethis unit. All links and paths will have to deleted prior to deleting the icon.
Test Case #2 - System InformationShow that the Network Manager can display the NIU's system information,such as Ethernet Address, IP Address, S/W Version, are displayed
ConfigurationPull up the NIU's configuration window
Result: In the window is all the relevant information.
23PSINet Hong Kong Ltd.
18/F., Lever Center, 69-71 King Yip Street, Kwun long, Kowloon, H.K.tel 852.2331.8123 «fax 852.2795.1262 • www.psinet.com.hk
filePSINet9.3 General Wireless NMS Support
TEST CASE DESCRIPTIONTest Case #1 - Access ControlUsers will be able to modify the password access to the Units.
Configuration-1; Operation TestAccess the system console, enter the user password as requested.
Result: User is given access to the unit's console.
Configuration- 2: Password UpdateAccess the system console, enter the user password as requested. Userrequests to change the original Password.
Result: User is given the possibility to change the password
Configuration- 3: Time ManagementDemonstrate the possibility of changing the system's date and time. Note thatthe NMS will use the Spare's date and time
Result: Display of date and time
Configuration- 4: Port ManagementVerify the Network management support of the NIU's subscriber port.Select the subscriber port and show all its configuration information.
Result: Window displaying the NIU's El and Ethernet port information.
Configuration- 5: ATM StatisticsDisplay the Network Management Statistics for the Wireless link. We want todemonstrate the collection of statistics related to the ATM traffic transportedover the radio network.
Result: On the console, transported ATM cell count and HEC error detectedcell count is displayed
Configuration- 6: ATM ConnectionsShow the ATM PVC connection status between the Base Station and the NIU.
PSINet Hong Kong Ltd. 24
18/F., Lever Center, 69-71 King Yip Street, Kwun long, Kowloon, H.K.tel 852.2331.8123 • fax 852.2795.1262 • www.psinetcom.hk
PSIrtletResult: Display of the ATM PVC connection, its status and the port VPI/VCIstatus.
Configuration- 7: ATM PVC CreationCreate the PVC connection between the Base Station and the NIU.
Result: The customer can see how to create a PVC connection
Configuration- 8: ATM PVC DeletionDelete the PVC connection
Result: The customer can see how to remove a PVC connection involving theBase Station and the NIU
Configuration- 9: Wireless Link statusList all NIUs to show the wireless link status
Result: The customer can see if each NIU is registered with the NMS and what itsstatus is.
Test Case #2 - Operation StatusShow the system operation status
ConfigurationDisplay the Radio link's normal statusDisplay the voice/data Tx/Rx status,Display the power supply status
Result: All the information required is available.
Test Case #3 - On Line DocumentationNMS has on-line documentation
ConfigurationClick on the information icon at the bottom of the map window.
25PSINet Hong Kong Ltd.
18/F., Lever Center, 69-71 King Yip Street, Kwun long, Kowloon, H.K.tel 852,2331.8123 • fax 852.2795.1262 • www.psinetcom.hk
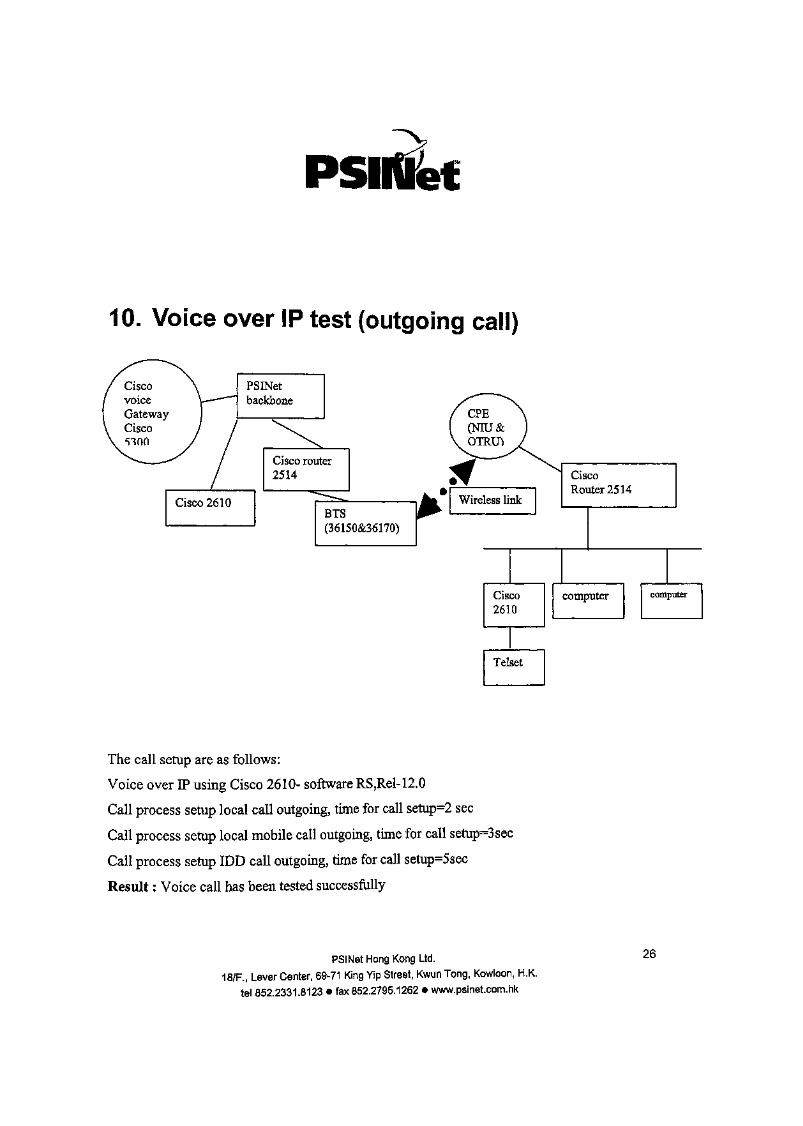
PSINet
10. Voice over IP test (outgoing call)
CiscovoiceGatewayCiscoS100
The call setup are as follows:
Voice over DP using Cisco 2610- software RS,Rel-12.0
Call process setup local call outgoing, time for call setup=2 sec
Call process setup local mobile call outgoing, time for call setup=3sec
Call process setup IDD call outgoing, time for call setup=5sec
Result: Voice call has been tested successfully
PSINet Hong Kong Ltd.
18/F., Lever Center, 69-71 King Yip Street, Kwun Tong, Kowloon, H.K.tel 852.2331.8123 • fax 852.2795.1262 • www.psinetcom.hk
26
LMDS Phase 1 Inal ReportS MAR TONE
Ref: CB90274
REPORT ONSMARTONE LMDS TECHNOLOGY TRIAL - PHASE 1
A. Version history
VersionIni t ia l
B
Date8th Nov 99
20'h Dec 99
Written ByJimmy LingTanny NgKhanh LuuMichael WongJimmy Ling
Updated by
Katherine Kwan
B. Distribution
to Stephen Chau, Andrew Chan, Brian Ho, Alan Mok
C. Approval / updating
Approved b> Stephen ChauChief Technology OfficerSmarTone Mobile Communications Ltd
Updated hy Katherine Kwan
D. File Reference
CBW274
c; new tecLMCSlri rpt2.doc
E, Appendixes
Nil
14/01/00 1(49)

SMARlONE
LMDS Phase I I ml Report Ref: CB90274
L INTRODUCTION
U BACKGROUND
Convergence of the fixed and wireless telephony is taking place. At the meeting of
the Executive Council on 4 May 1999, the Chief Executive has ordered to liberalise
the external facilities based telecommunications market
The legislation decision calls for the attention to LMCS (Local Multipoint
Communication Systems/ LMDS (Local Multipoint Distribution systems) technology
to provide wireless broadband access. The point-to-multipont radio access system is
capable of providing services from voice to high speed data (up to 155 Mbps) and
multimedia access, There has been a heated bidding war for licences in the US as it
seems to be a low infrastructure cost technology while offering enormous bandwidth
in sizable packets. The technology has been trial and launched in a number of
Canadian & US cities, Sweden, as well as Taiwan during late 97 & 98. However,
there has been doubts that the technology may not apply equally well in Hong Kong,
due to the not so favourable propagation environment for the very high frequency (at
around 2HOH/) that limits the cell size. A trial has been proposed to investigate the
implications of the technology on SmarTone's business opportunities.
The trial is expected to facilitate the understanding and appreciation of the system
characteristics and broadband capability of LMDS technology, to the advanced
knowledge of the Company, The results produced would be opened to OFTA and
other relevant parties in the industry upon request, for reference.
Invitation to trial was sent to a number of short-listed vendors. Experience obtained in
the trial would be essential for the vendor selection process to be held. The Phase 1
trial in process is focused on basic LMDS technology & radio characteristics studies,
as well as evaluation of in-building distribution solutions including cable modems
and ethernet modems. The test setup comprises of LMDS equipment from Newbridge
at three different sites and subscriber access solution from Nortel
LMDS Phase 1 Trial Report Ref. Q390274
The trial equipment was installed in September and the trial was completed by mid-
October. Highlights on the investigation falls on one of the extreme case of radio link
being tested, where a link distance of 2.7 km over the harbour in the urban city was
set up. The bit error performance was compared to another simultaneous link of
distance 0.6 km. The test has delivered very practical reference to the future network
planning as the wireless system has been stretched to operate over a marginal
condition in the dense urban environment of Hong Kong. The trial system has also
tolerated the sixteen years ever typhoon signal No. 10. Successful of this phase 1 trial
has provided SmarTone with the positive answer to the feasibility of the LMDS
technology in Hong Kong, as well as to master the key factors to a viable business.
Continuing to this success, SmarTone is planning for a second phase trial to focus on
the applications and in-building distribution solutions.
14/01/00 3(49)

LMDS Phase 1 Trial Report Ref;
1.2 TRIAL OBJECTIVES
• To provide advanced insight to the radio characteristics and operation of the LMDS
system for the engineering staffs of Smartone.
• To provide understanding of the technology and system architecture as a background
for the strategic planning for the deployment planning to fulfill the Local Wireless
Fixed Network services.
• To provide hands on experience on the products from different vendors as one of the
references for the later equipment selection process.
• To evaluate the broadband customer access solutions and the concerns on the
provision of an integrated cnd-to-end solution,
• To enhance the image of Smartone of 'technology leadership' in the region.
13 TRIAL SYSTEM OVERVIEW
LMDS equipment from Newbridge has been used to conduct the trial. The entire setup
comprises 3 different sites, 1 Base Transceiver Station (BTS) site in Hoi Yuen Road,
Kwun TongCAPBC Plaza 28/F), 2 Customer Premises Equipment (CPE) sites in Taikoo
Place, Quarry Bay (Somerset House 4/F) and Hung To Road, Ngau Tau Kok (Remington
Centre 23/F). Two radio transceivers were involved in the trial, with the 1st radio sector
covering both the CPE sites whilst the 2nd sector was used for the simulation of Adjacent
and Co-Channel interference,
The frequencies used for conducting the trial were as follows:• Downlink = 28.073 and 28.109 GHz* Uplink - 27355 and 27364 GHz
The distance between the BTS site in Kung Tong and the Quarry Bay CPE site isapproximately 2700m whilst the distance for the other link to the Ngau Tau Kok CPE siteis approximately 600m.
The BTS used for this trial can support a carrier with 36MHz channel spacing on thedownlink and 9MHz channel spacing on the uplink. The Network Interface Units (NIU)at the customers1 end used for this trial were equipped with both an ethernet interface aswell as an El interface,
S MAE TONE
LMDS Phase I Trial Report Ref:
Access Technologic
I. Ethernet Modem
The Ethernet Modem on trial is a new high-speed, Ethernet centric, digital subscriberloop system that can adapt to a changing transmission and crosstalk environment.Because of this adaptation, Etherloop can itself achieve high instantaneous bit rates inboth upstream and downstream directions. One of the most attractive characteristics isthat it is able to co-exist with other services in the same cable, including POTS, ISDN,HDSL, Tl line and ADSL. Crosstalk interference is a critical issue with xDSL systemsdue to the use of higher frequency spectral energy. Crosstalk between the eDSL and otherservice should not significantly impair each other.
The current version is a phase I product, which is configured with 4Mbps capacity. Thesystem consists of a multiplexer, the configuration & management server & ethernetmodems,Voice connection with the office PBX together with data services on LAN interconnect,routed through the wireless interface of the test LMDS system were setup on the ethernetmodems in the trial.
II Cable Modem
The trial for the cable modem has been conducted at Mount Haven (Residential Estate) inTsing Yi. The trial setup comprises a cable headend and a cable modem. Signal wasinjected into the existing SMATV headend (Tower 1) and distributed to the cable modem(Tower 6) via the existing in-building SMATV cabling system.
Cable Modems based on the DOCSIS standards were used, which can deliver lOMbpsethernet connections over a 6MHz baseband channel. The operating frequency of thecable modem is 5 - 42MHx for the uplink and 88 - 860MHz for downlink.
L4 TEST & EVALUATION PLAN OUTLINE
The tests & evaluation items was planned around the focus of:
* Radio characteristics, such as; effect of transmission power, antenna polarision,propagation over harbour, adjacent channel interference on the Bit Error Rate (BER) andcell radius,* Demonstration of the broadband and basic telecommunication services in a multi-userenvironment.
S MAR TONE
LMDS Phase 1 I ual Report Ref, 0590274
* Demonstration of the inter-working capability of the LMDS system with the varioussubscriber access solutions, in a multi-vendor situation.
Test items includes : Analogue & IP voice calls, Bit Error Rate recording, data throughput (system ATM cell transfer & end user data rate), etc. on LAN & internet access underdifferent radio environments & system loading.
In the trial using Cable Modem, user data was transmitted as modulated signal throughthe SMATV backbone to the end user. No inter-modulation with the co-existedTV/SMATV signal along the eo-axial cable trunk was found. Alignment of the cabletrunk amplifiers should be taken care of in the future implementation in order tomaximize the transmission capacity.
14/01 /(XT""" " " ' " • • • - • • - - ~* 6(49)
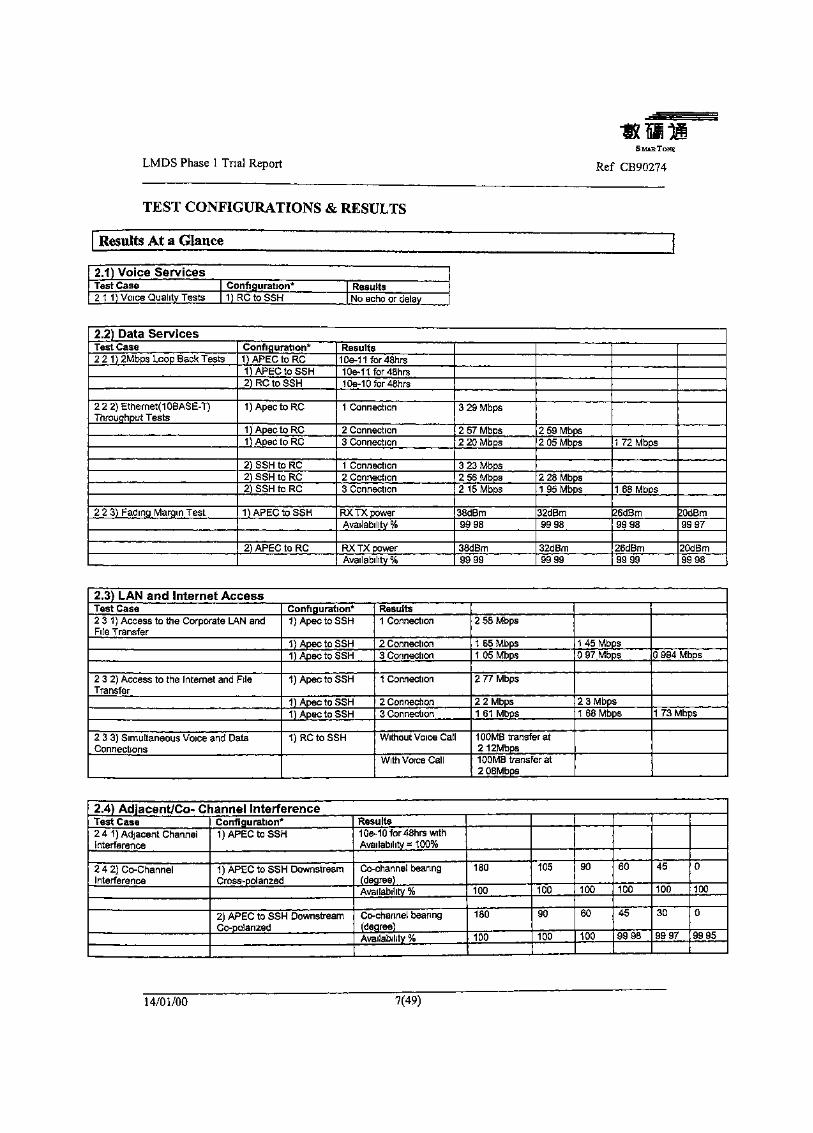
LMDS Phase 1 Trial ReportS MAR TONE
Ref CB90274
TEST CONFIGURATIONS & RESULTS
Results At a Glance
2.1) Voice ServicesTest Case21 1) Voice Quality Tests
Configuration*1)RCtoSSH
ResultsNo echo or delay
2.2) Data ServicesTest Case221) 2Mbps Loop Back Tests
222) Ethernet(1 OBASE-T)Throughput Tests
223) Fading Margin Test
Configuration*1)APECtoRC1lAPECtoSSH2) RC to SSH
1)ApectoRC
HApectoRC1) ApectoRC
2) SSH to RC2) SSH to RC2) SSH to RC
DAPECtoSSH
2) APEC to RC
Results10e-11 for48hrs10e-11for48hrs10e-10for48hrs
1 Connection
2 Connection3 Connection
1 Connection2 Connection3 Connection
RX TX powerAvailability %
RX TX powerAvailability %
3 29 Mbps
2 57 Mbps2 20 Mbps
3 23 Mbps2 56 Mbps2 15 Mbps
38dBm9998
38dBm9999
2 59 Mbps2 05 Mbps
2 28 Mbps1 95 Mbps
32dBm9998
32dBm9999
1 72 Mbps
1 68 Mbps
26dBrn9998
26dBm9999
?OdBm9997
20dBm9998
2.3) LAN and Internet AccessTest Case231) Access to the Corporate LAN andFile Transfer
232) Access to the Internet and FileTransfer
233) Simultaneous Voice and DataConnections
Configuration*1) ApectoSSH
1) ApectoSSH1) ApectoSSH
1) ApectoSSH
1J ApectoSSH1) ApectoSSH
1)RCtoSSH
Results1 Connection
2 ConnectionL3 Connection
1 Connection
2 Connection3 Connection
Without Voice Call
With Voice Call
2 58 Mbps
1 65 Mbps1 05 Mbps
2 77 Mbps
2 2 Mbps1 61 Mbps
100MB transfer at212Mbps100MB transfer at2 OSMbps
1 45 Mbps0 97 Mbps
2 3 Mbps1 68 Mbps
0 994 Mbps
1 73 Mbps
2.4) Adjacent/Co- Channel InterferenceTest Case241) Adjacent ChannelInterference
242) Co-ChannelInterference
Configuration*1) APEC to SSH
1) APEC to SSH DownstreamCross-polarized
2) APEC to SSH DownstreamCo-polarized
Results1Qe-10for48hrs withAvailability =100%
Co-channel bearing(degree)Availability %
Co-channel bearing_(degree)_Availability %
180
100
180
100
105
100
90
100
90
100
60
100
60
100
45
9998
45
100
30
9997
0
100
0
9995
14/01/00 7(49)
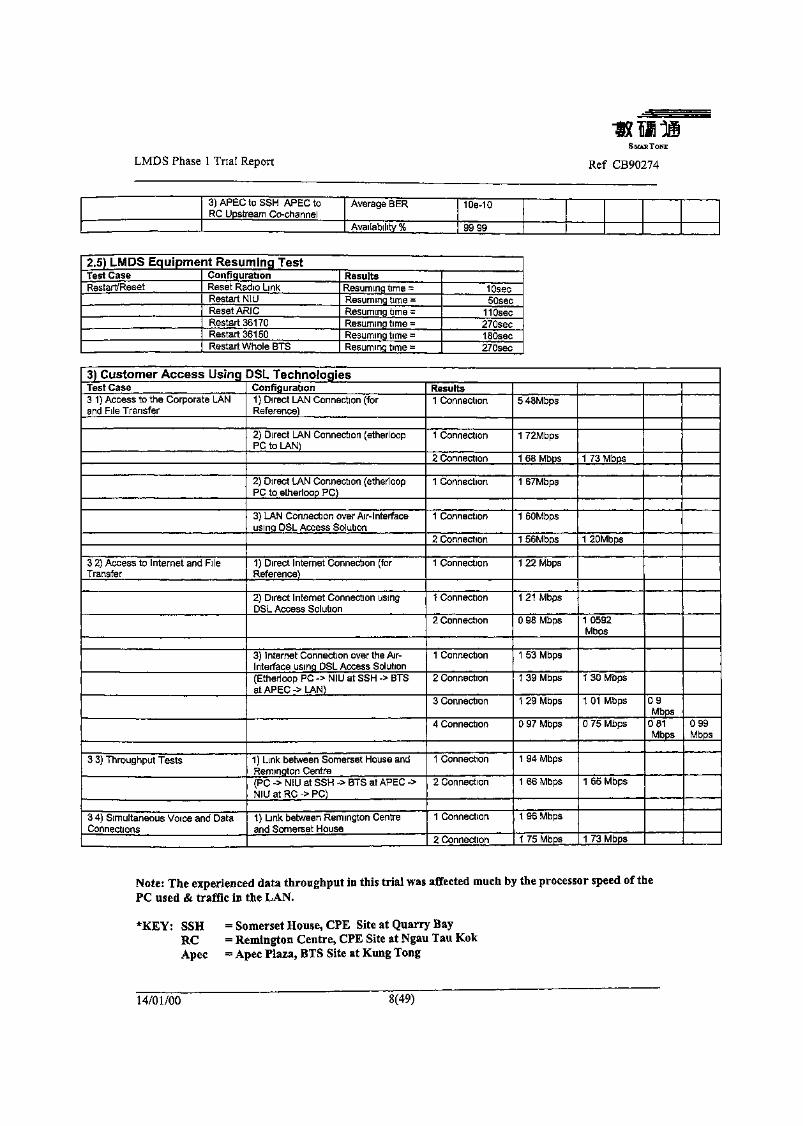
LMDS Phase 1 Trial ReportS MAR TONE
Ref CB90274
3) APEC to SSH APEC toRC Upstream Co-channel
Average BER
Availability %
10e-10
9999
2.5) LMDS Equipment Resuming TestTest CaseRestart/Reset
ConfigurationReset Radio LinkRestart NIUReset ARICRestart 361 70Restart 361 50Restart Whole BTS
ResultsResuming time =Resuming time =Resuming time =Resuming time =Resuming time =Resuming time =
10secSOsec
110sec270sec1 SOsec270sec
3) Customer Access Using DSL TechnologiesTest Case3 1) Access to the Corporate LANand File Transfer
3 2) Access to Internet and FileTransfer
3 3) Throughput Tests
3 4) Simultaneous Voice and DataConnections
Configuration1) Direct LAN Connection (forReference)
2) Direct LAN Connection (etherloopPC to LAN)
2) Direct LAN Connection (etherloopPC to etherloop PC)
3) LAN Connection over Air-Interfaceusing DSL Access Solution
1) Direct Internet Connection (forReference)
2) Direct Internet Connection usingDSL Access Solution
3) Internet Connection over the Air-Interface using DSL Access Solution(Etherloop PC -> NIU at SSH -> BTSat APEC -> LAN)
1) Link between Somerset House andRemington Centre(PC -> NIU at SSH -> BTS at APEC ->NiU at RC -> PC)
1) Link between Remington Centreand Somerset House
Results1 Connection
1 Connection
2 Connection
1 Connection
1 Connection
2 Connection
1 Connection
1 Connection
2 Connection
1 Connection
2 Connection
3 Connection
4 Connection
1 Connection
2 Connection
1 Connection
2 Connection
5 48Mbps
1 72Mbps
1 68 Mbps
1 67Mbps
1 60Mbps
1 56Mbps
1 22 Mbps
1 21 Mbps
0 98 Mbps
1 53 Mbps
1 39 Mbps
1 29 Mbps
0 97 Mbps
1 94 Mbps
1 66 Mbps
1 96 Mbps
1 75 Mbps
1 73 Mbps
1 20Mbps
1 0592Mbps
1 30 Mbps
1 01 Mbps
0 75 Mbps
1 65 Mbps
1 73 Mbps
09Mbps
081Mbps
099Mbps
Note: The experienced data throughput in this trial was affected much by the processor speed of thePC used & traffic in the LAN.
*KEY: SSH = Somerset House, CPE Site at Quarry BayRC = Remington Centre, CPE Site at Ngau Tau KokApec = Apec Plaza, BTS Site at Kung Tong
14/01/00 8(49)
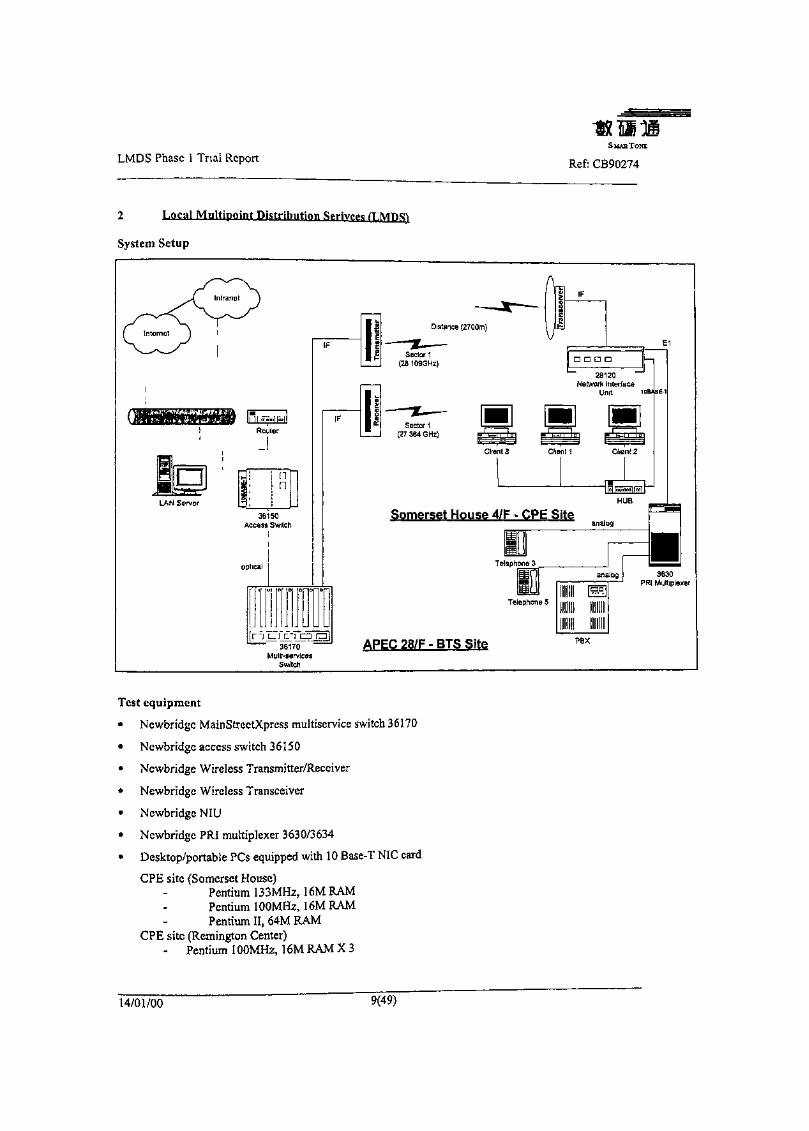
LMDS Phase 1 Trial ReportS MAK TONE
Ref: CB90274
JDistribution Senvces (TfMPfil
System Setup
EH
IAN Server
Router
ni
36f^rcoss
}tical
, !'f
i. ' i.
||
150Switch
Ii r " J ^ril-'l'rrll
IIII
al .„
Distance (2700m)
E1Sector 1
(28 109GHz)
Sector 1(27 364 GHz)
n a a n
28120 ~Network Interface
Unit 10B/JSE-1
Client 3 Client 1 Client 2
Somerset House 4/F - CPE Siteanalog
Telephone 3 _
analog
Telephone 5
3630PRI Multiplexer
36170Multi-strvices
Switch
^ APEC 28/F • BTS Site PBX
Test equipment
« Newbridge MainStreetXpress multiservice switch 36170
* Newbridge access switch 36150
» Newbridge Wireless Transmitter/Receiver
* Newbridge Wireless Transceiver
* Newbridge NIU
* Newbridge PRI multiplexer 3630/3634
* Desktop/portable PCs equipped with 10 Base-T NIC card
CPE site (Somerset House)Pentium 133MHz, 16M RAMPentium 100MHz, 16M RAMPentium II, 64M RAM
CPE site (Remington Center)- Pentium 3 00MHz, 16M RAM X 3
14/01/00 9(49)

LMDS Phase 1 Trial Report Ref: CB90274
Others (attached to local LAN)Pentium 100MHz, 16M RAM X 3
* 100/10 Base-Thub
» Analogue phones
« PBX Name: Definity Communications System G3siV5+m
The IF connection between ATM Radio Interface Card and the Microwave Antenna System has been tested
together with RF generator. Additional attenuation has been added to align the required RX IF level into
BTS, Test IF frequency is generated by signal generator at one end and the attenuation is measured by
spectrum analyzer at the other end. Both upsteam IF frequencies (555MHz & 564MHz) and downsteam IF
frequencies (1473MH? & 1509MHz) are verified. The measurement includes all passive devices such as
splitter and combiner along the cable connection. In the case of BTS site, the total loss of upstream and
downstream are recorded to be 24 ± IdB and 27 ± IdB respectively. For the same case done in anchor site
the cable loss of upstream and downstream are 6 ± land 12± IdB respectively.
Link Budget
For the antenna system of LMDS, the attached outdoor transceiver unit has a gain of 40dB and the antenna
has a gain of i2 ldB. On the Anchor site, the CPE has a transceiver gain of+35dB and antenna gain of
^36dB, Therefore for a TX IF power output at BTS equals to +4dBm, the actual downstream power at
BTS antenna should be 44 - 27 + 40 + 21 - +38dBm. Similarly, for a TX IF power output at NIU equals
to - 38dBm, the actual upstream power at CPE antenna should be -38 - 6 +35 + 36 = +27dBm. Taking
elevation beam width and tilting into account, the Radio link attenuation is found to be 117dB between
APEC rooftop and Remington Centre 23/F(600m), 130dB between APEC rooftop and Somerset House
4/F (2700m)
Link Budge Summary(A) Tx IF Power(B) Transceiver Gain(C) Antenna Gain(D) Cable Loss(E) Effective Power=A+B+C-D(F) Radio Link Attenuation
(G) Receive signal Strength= E + C - F
BTS (Hub) Downstream
4dBrn40 dB21 dB27 dB38dBm
117 dB (between APEC & RC)130 dB (between APEC & SSH)-69 dBm (from RC to APEC)-82 dBm (from SSH to APEC)
NIU (Anchor) Upstream
-38 dBm35 dB36 dB6dB27 dBm
1 17 dB (between APEC & RC)130 dB (between APEC & SSH)-43 dBrn (from APEC to RC)-56 dBm (from APEC to SSH)
14/01/00 10(49)
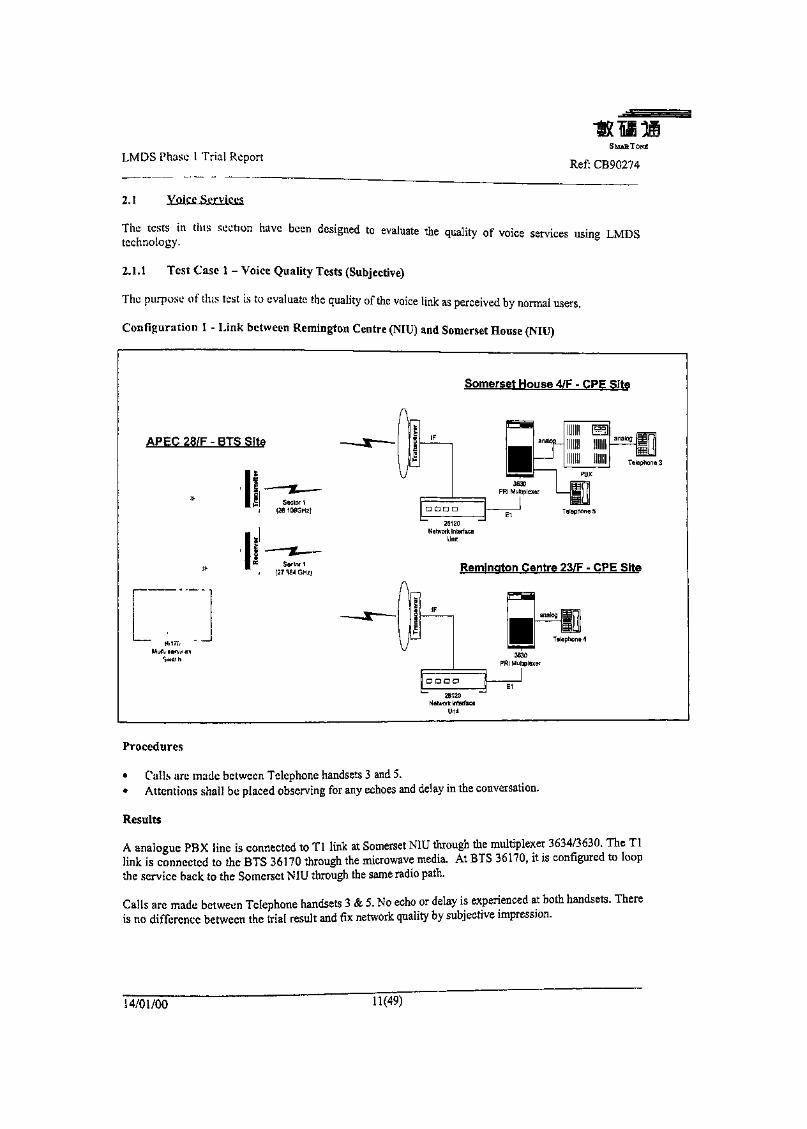
LMDS Phase 1 Trial ReportS MAR TONE
Ref: CB90274
2.1
The tests in this section have been designed to evaluate the quality of voice services using LMDStechnology,
2.1.1 Test Case 1 - Voice Quality Tests (Subjective)
The purpose of this test is to evaluate the quality of the voice link as perceived by normal users.
Configuration I - Link between Remington Centre (NIU) and Somerset House (NIU)
Somerset House 4/F - CPE Site
APEC 28/F - BTS Site
SKtorl(as 10SGHZ)
analog
Telephones
3630PRI Multiplexer
28120Network Interface
Telephone 5
Remington Centre 23/F - CPE Site
\ /l
analog
Telephone 4
PRI Multiplexer
28120Network Interface
Unit
Procedures
* Calls are made between Telephone handsets 3 and 5,* Attentions shall be placed observing for any echoes and delay in the conversation.
Results
A analogue PBX line is connected to Tl link at Somerset NIU through the multiplexer 3634/3630. The Tllink is connected to the BTS 36170 through the microwave media. At BTS 36170, it is configured to loopthe service back to the Somerset NIU through the same radio path.
Calls are made between Telephone handsets 3 & 5. No echo or delay is experienced at both handsets. Thereis no difference between the trial result and fix network quality by subjective impression.
14/01/00 11(49)
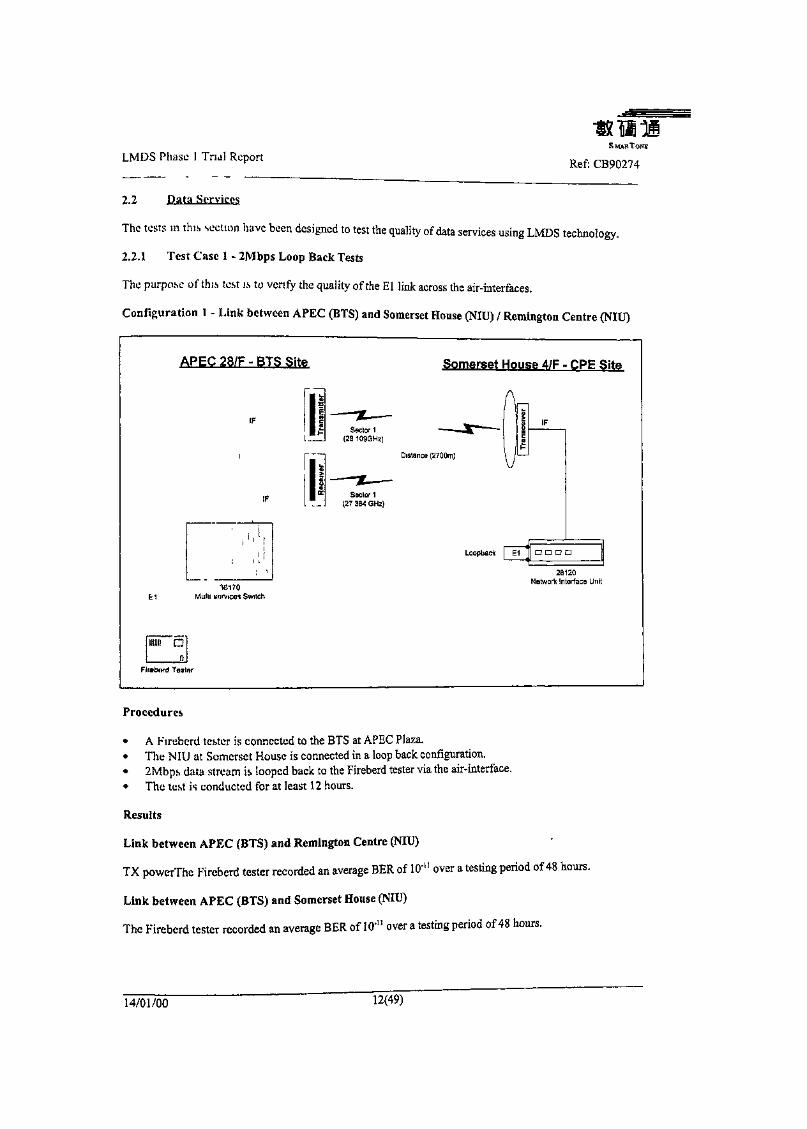
LMDS Phase 1 Trial ReportSMARTOME
Ref: CB90274
2.2
The tests in this section have been designed to test the quality of data services using LMDS technology.
2.2.1 Test Case 1 - 2Mbps Loop Back Tests
The purpose of this test us to verify the quality of the El link across the air-interfaces.
Configuration I - Link between APEC (BTS) and Somerset House (NIU) / Remington Centre (NIU)
APEC 28/F ~ BTS Site Somerset House 4/F - CPE Site
ASector 1
(28 109GHz)
Sector 1(27 364 GHz)
Distance (2700m)
Loopback E1
fc1111170
Multt ofirvtcui Switch
28120Network Interface Unit
fti a]L_,JU
FJreberd Testor
Procedures
* A Fircbcrd tester is connected to the BTS at APEC Plaza.* The NIU at Somerset House is connected in a loop back configuration.* 23VIbps data stream is looped back to the Fireberd tester via the air-interface.* The test is conducted for at least 12 hours.
Results
Link between APEC (BTS) and Remington Centre (NIU)
TX powcrThc Fireberd tester recorded an average BER of lO'11 over a testing period of 48 hours.
Link between APEC (BTS) and Somerset House (NIU)
The Fireberd tester recorded an average BER of 10"11 over a testing period of 48 hours.
14/01/00 12(49)
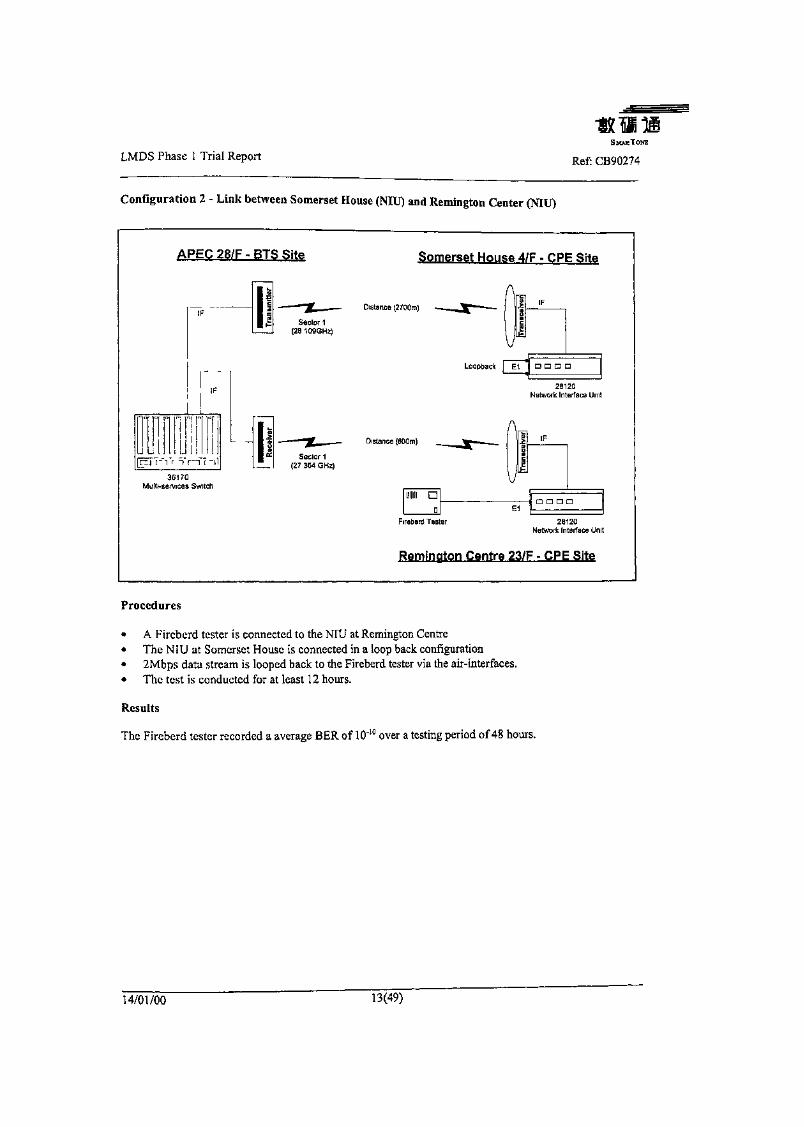
LMDS Phase 1 Trial ReportSMARlONE
Ref: CB90274
Configuration 2 - Link between Somerset House (NIU) and Remington Center (NIU)
APEC 28/F - BTS Site Somerset House 4/F - CPE Site
Distance (2700m)
Distance (600m)
Sector 1(27 364 GHz)
36170Multi-servicos Switch
Fireberd Tester 28120Network Interface Unit
Remington Centre 23/F - CPE Site
Procedures
» A Fireberd tester Is connected to the NIU at Remington Centre» The NIU at Somerset House is connected in a loop back configuration* 2Mbps data stream is looped back to the Fireberd tester via the air-interfaces.» The test is conducted for at least 12 hours.
Results
The Fireberd tester recorded a average BER of 10"10 over a testing period of 48 hours.
14/01/00 13(49)
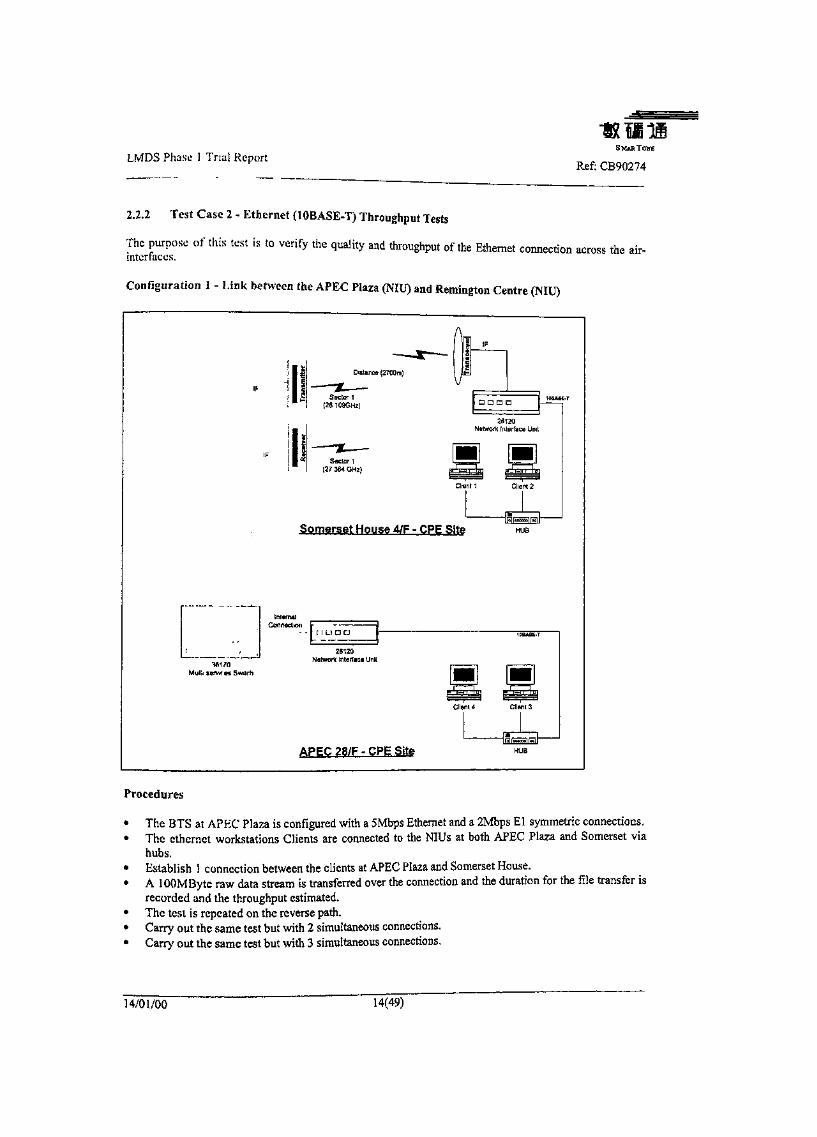
LMDS Phase 1 Trial ReportRef; CB90274
2.2.2 Test Case 2 - Ethernet (10BASE-T) Throughput Tests
The purpose of this test is to verify the quality and throughput of the Ethernet connection across the air-interfaces.
Configuration ! - Link between the APEC Piaza (NIU) and Remington Centre (NIU)
Distance (2700m)
Sector 1I (28109GHZ)
28120Network Interface Unit
Somerset House 4/F - CPE Site
InternalConnection
"Wlt/0Mutt, lorvtf m Swtfrh
28120Network Interface Unit
APEC 28/F - CPE Site
Client 4 Client 3
Procedures
• The BTS at APKC Plaza is configured with a SMbps Ethernet and a 2Mbps El symmetric connections.• The ethernct workstations Clients are connected to the NIUs at both APEC Plaza and Somerset via
hubs,• Establish 1 connection between the clients at APEC Plaza and Somerset House.• A lOOMBytc raw data stream is transferred over the connection and the duration for the file transfer is
recorded and the throughput estimated.• The test is repeated on the reverse path,• Carry out the same test but with 2 simultaneous connections.• Carry out the same test but with 3 simultaneous connections.
14/01/00 14(49)
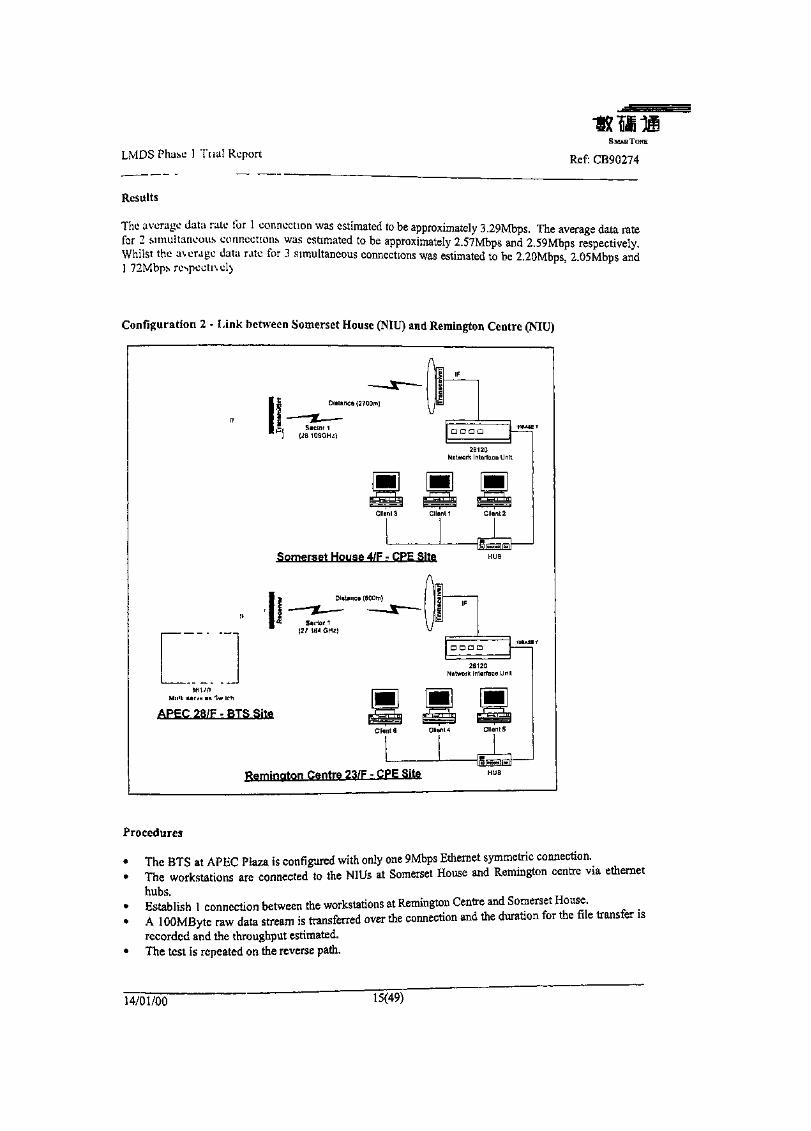
LMDS Phase 1 Tnal Report
Results
SMAKTONE
Ref: CB90274
The average data rate for 1 connection was estimated to be approximately 3.29Mbps. The average data ratefor 2 simultaneous connections was estimated to be approximately 2.57Mbps and 2.59Mbps respectively.Whilst the average data rate for 3 simultaneous connections was estimated to be 2.20Mbps, 2.05Mbps and1 72Mbps respecti\el>
Configuration 2 - Link between Somerset House (NIU) and Remington Centre (NIU)
Distance (2700m)
Somerset House 4/F - CPE Site
Procedures
» The BTS at APEC Plaza Is configured with only one 9Mbps Ethernet symmetric connection.* The workstations are connected to the NIUs at Somerset House and Remington centre via ethernet
hubs,* Establish 1 connection between the workstations at Remington Centre and Somerset House _* A iOOMByte raw data stream is transferred over the connection and the duration for the file transfer is
recorded and the throughput estimated.* The test is repeated on the reverse path.
14/01/00 15(49)
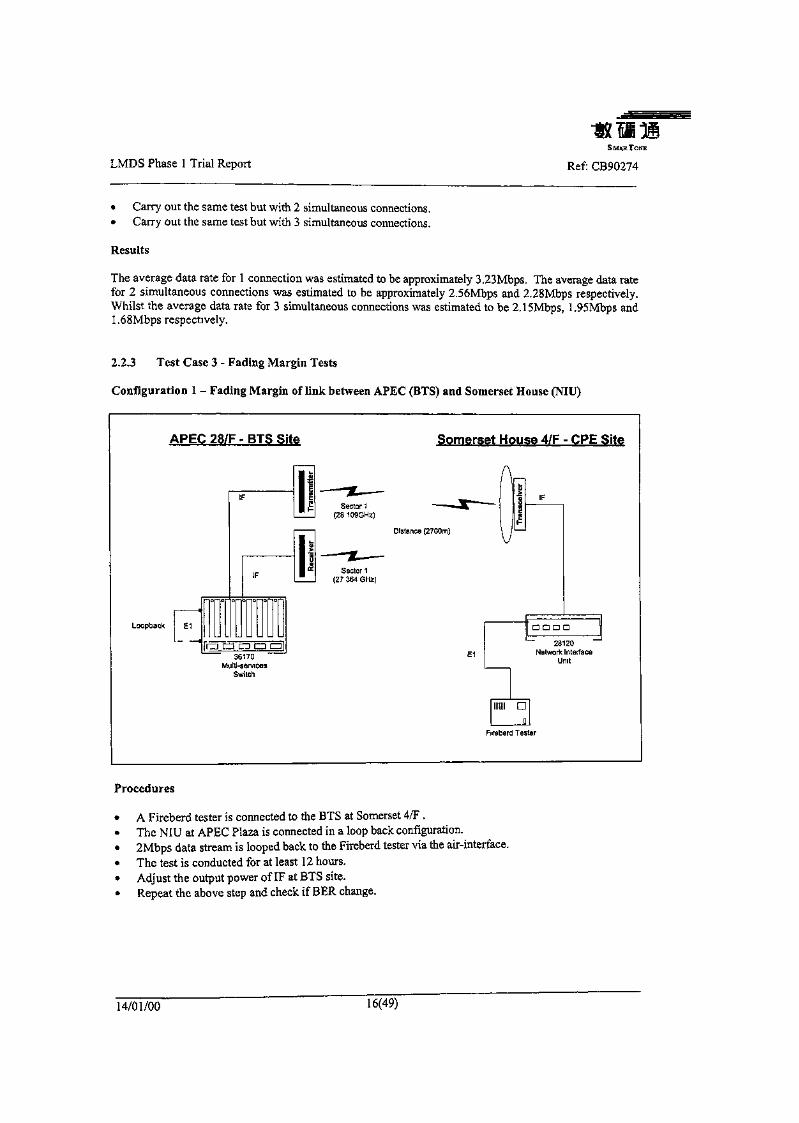
LMDS Phase 1 Trial ReportS MAE TONE
Ref: CB90274
* Carry out the same test but with 2 simultaneous connections.9 Carry out the same test but with 3 simultaneous connections.
Results
The average data rate for 1 connection was estimated to be approximately 3.23Mbps. The average data ratefor 2 simultaneous connections was estimated to be approximately 2.56Mbps and 2.28Mbps respectively.Whilst the average data rate for 3 simultaneous connections was estimated to be 2.15Mbps, 1.95Mbps and1.68Mbps respectively.
2.2.3 Test Case 3 - Fading Margin Tests
Configuration I - Fading Margin of link between APEC (BTS) and Somerset House (NIU)
APEC 28/
- -[flfLoopback E1
F - BTS Site Somerset House 4/F - CPE Site
I'-*- AilIF 1| 3L- ^__ | IFi! £ Sector 1 — •— uiHr ^ 8
(28 109GHz) «| £
1* Sectorllh (27 364 GHz)
TTKII — LDDDD JU L. U U U L_ _|
" * Frb BTTa" ciil u t ™™ J
Mi,iti.RBrv1CeS Umt
Switch
lilllll D
D
Fireberd Tester
Procedures
• A Fireberd tester is connected to the BTS at Somerset 4/F .• The NIU at APEC Plaza is connected in a loop back configuration.• 2Mbps data stream is looped back to the Fireberd tester via the air-interface.• The test is conducted for at least 12 hours.• Adjust the output power of IF at BTS site.• Repeat the above step and check if BER change.
14/01/00 16(49)
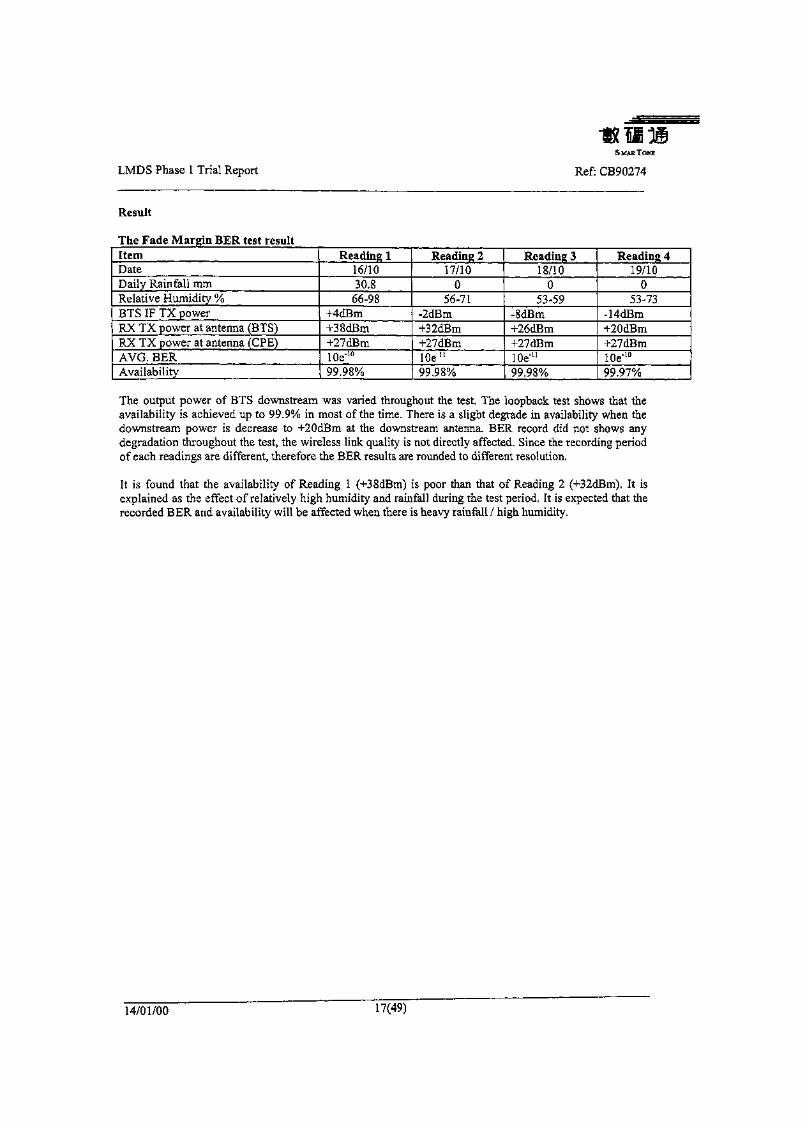
LMDS Phase 1 Trial Report
S MAR TONE
Ref: CB90274
Result
The Fade Margin BER test resultItemDateDaily Rainfall mmRelative Humidity %BTS IF TX powerRX TX power at antenna (BTS)RX TX power at antenna (CPE)AVG. BERAvailability
Reading I16/1030.8
66-98+4dBm+38dBm+27dBm10e'10
99.98%
Reading 217/10
056-71
-2dBm+32dBm+27dBmlOe1 1
99.98%
Reading 318/10
053-59
-8dBm+26dBm+27dBmlOe'11
99.98%
Reading 419/10
053-73
-14dBm+20dBm+27dBmlOe'10
99.97%
The output power of BTS downstream was varied throughout the test. The loopback test shows that theavailability is achieved up to 99.9% in most of the time. There is a slight degrade in availability when thedownstream power is decrease to -KZOdBm at the downstream antenna. BER record did not shows anydegradation throughout the test, the wireless link quality is not directly affected. Since the recording periodof each readings are different, therefore the BER results are rounded to different resolution.
It is found that the availability of Reading 1 (+38dBm) is poor than that of Reading 2 (+32dBm). It isexplained as the effect of relatively high humidity and rainfall during the test period. It is expected that therecorded BER and availability will be affected when there is heavy rainfall / high humidity.
14/01/00 17(49)
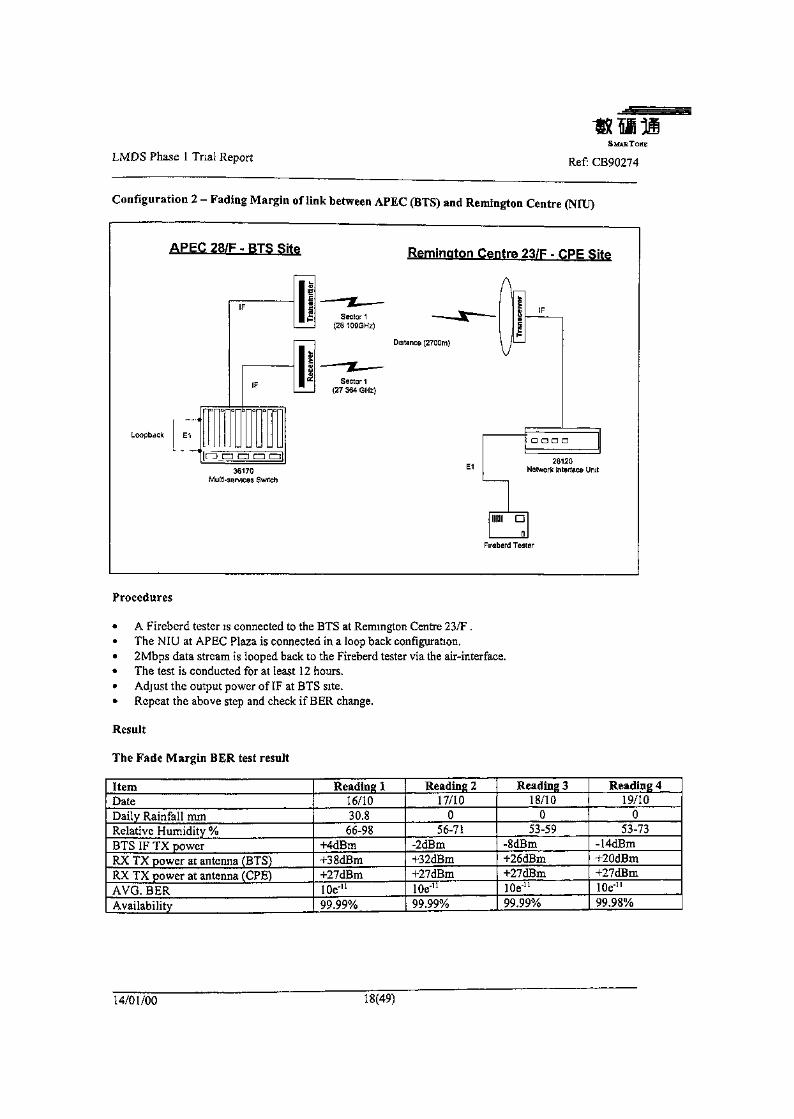
LMDS Phase 1 Trial ReportS MAR TONE
Ref: CB90274
Configuration 2 - Fading Margin of link between APEC (BTS) and Remington Centre (NIU)
APEC 28/F - BTS Site Remington Centre 23/F - CPE Site
Loopback
Distance (2700m)
36170Multi-services Switch
a D a n
28120Network Interface Unit
Fireberd Tester
Procedures
« A Fireberd tester is connected to the BTS at Remington Centre 23/F .» The NIU at APEC Plaza is connected in a loop back configuration.• 2Mbps data stream is looped back to the Fireberd tester via the air-interface.« The test is conducted for at least 12 hours.• Adjust the output power of IF at BTS site.• Repeat the above step and check if BER change.
Result
The Fade Margin BER test result
ItemDateDaily Rainfall mmRelative Humidity %BTS IF TX powerRX TX power at antenna (BTS)RX TX power at antenna (CPE)AVG. BERAvailability
Reading 116/1030.8
66-98-HdBm+38dBm+27dBm10e"n
99.99%
Reading 217/10
056-71
-2dBm+32dBm+27dBm10e-n
99.99%
Readings18/10
053-59
-8dBm+26dBm+27dBm10e-u
99.99%
Reading 419/10
053-73
-14dBm+20dBm+27dBmlOe-11
99.98%
14/01/00 18(49)
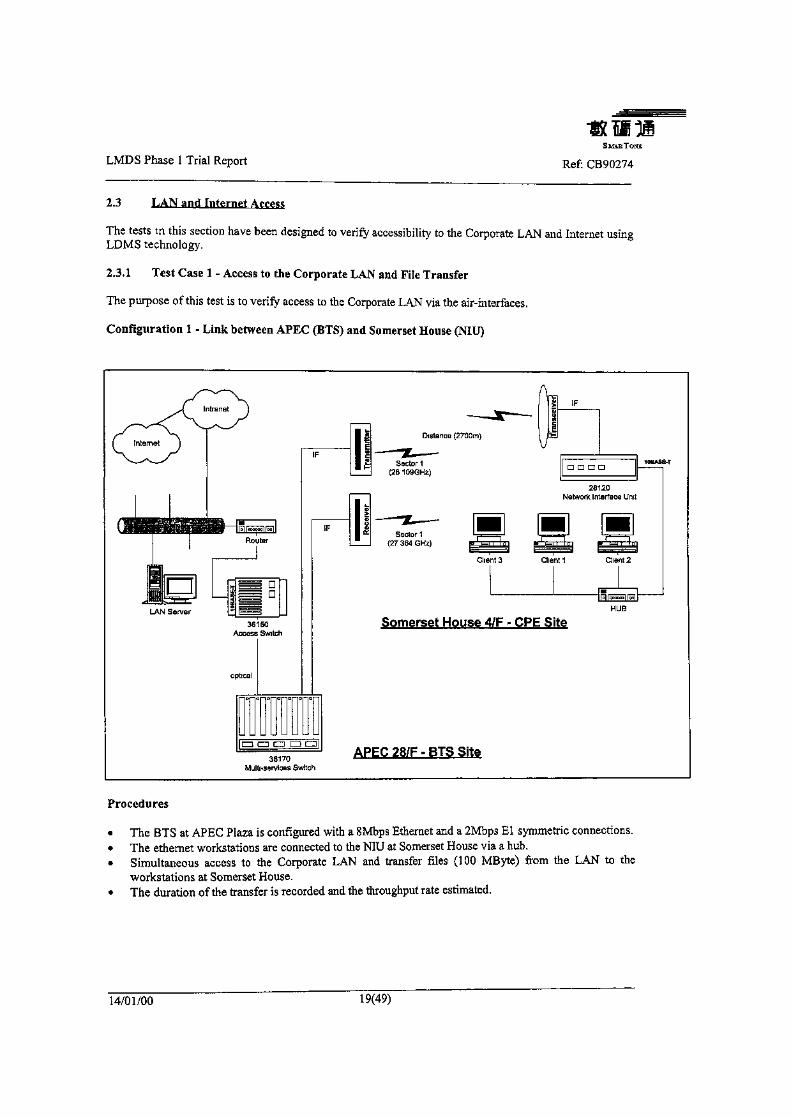
LMDS Phase 1 Trial Report Ref: CB90274
2.3 LAN and Internet Access
The tests in this section have been designed to verify accessibility to the Corporate LAN and Internet usingLDMS technology.
2.3.1 Test Case 1 - Access to the Corporate LAN and File Transfer
The purpose of this test is to verify access to the Corporate LAN via the air-interfaces.
Configuration 1 - Link between APEC (BTS) and Somerset House (NIU)
Distance (2700m)
Somerset House 4/F - CPE Site
36170Multi-services Switch
APEC 28/F - BTS Site
Procedures
• The BTS at APEC Plaza is configured with a SMbps Ethernet and a 2Mbps El symmetric connections.• The ethernet workstations are connected to the NIU at Somerset House via a hub.• Simultaneous access to the Corporate LAN and transfer files (100 MByte) from the LAN to the
workstations at Somerset House.• The duration of the transfer is recorded and the throughput rate estimated.
14/01/00 19(49)
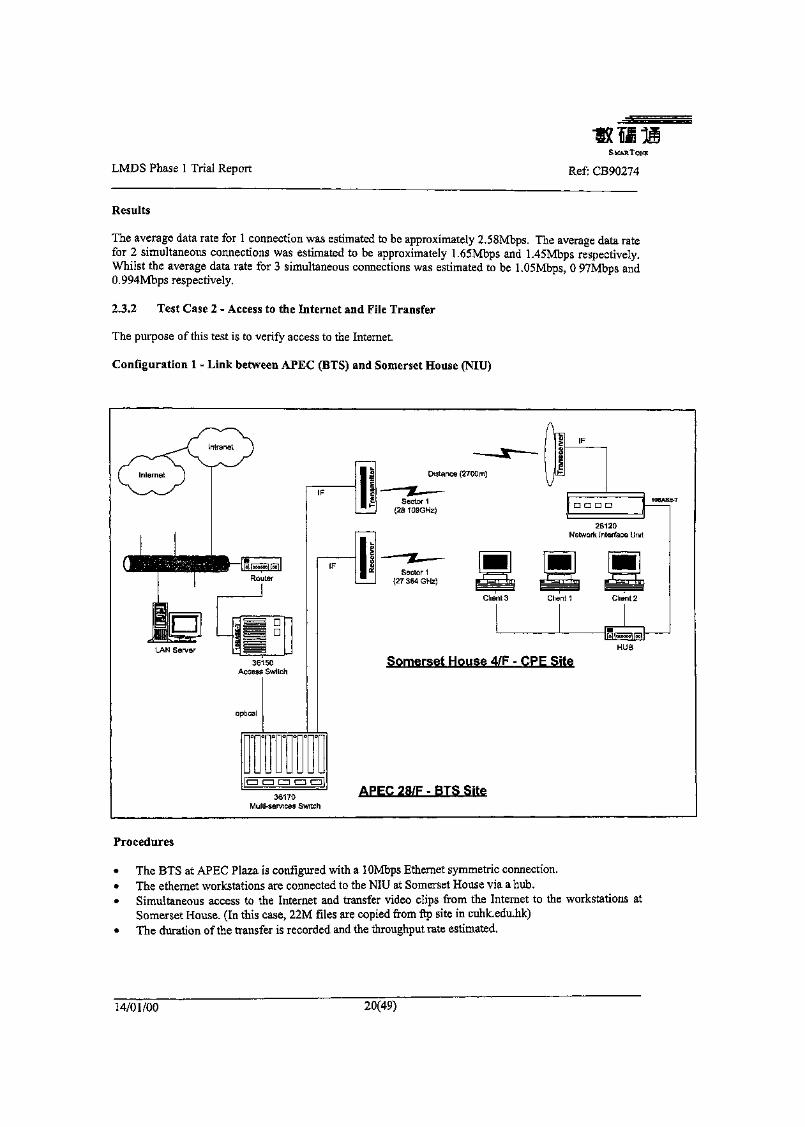
LMDS Phase 1 Trial ReportS MAE TONE
Ref: CB90274
Results
The average data rate for 1 connection was estimated to be approximately 2.58Mbps. The average data ratefor 2 simultaneous connections was estimated to be approximately 1.65Mbps and 1.45Mbps respectively.Whilst the average data rate for 3 simultaneous connections was estimated to be l.OSMbps, 0 97Mbps and0.994Mbps respectively.
2.3.2 Test Case 2 - Access to the Internet and File Transfer
The purpose of this test is to verify access to the Internet.
Configuration 1 - Link between APEC (BTS) and Somerset House (NIU)
A
Distance (2700m)
28120Network Interface Unit
Client 3 Client 1 Client 2
HUB
Somerset House 4/F - CPE Site
36170Multi-services Switch
APEC 28/F - BTS Site
Procedures
The BTS at APEC Plaza is configured with a lOMbps Ethernet symmetric connection.The ethernet workstations are connected to the NIU at Somerset House via a hub.Simultaneous access to the Internet and transfer video clips from the Internet to the workstations atSomerset House. (In this case, 22M files are copied from ftp site in cuhk.edu.hk)The duration of the transfer is recorded and the throughput rate estimated.
14/01/00 20(49)
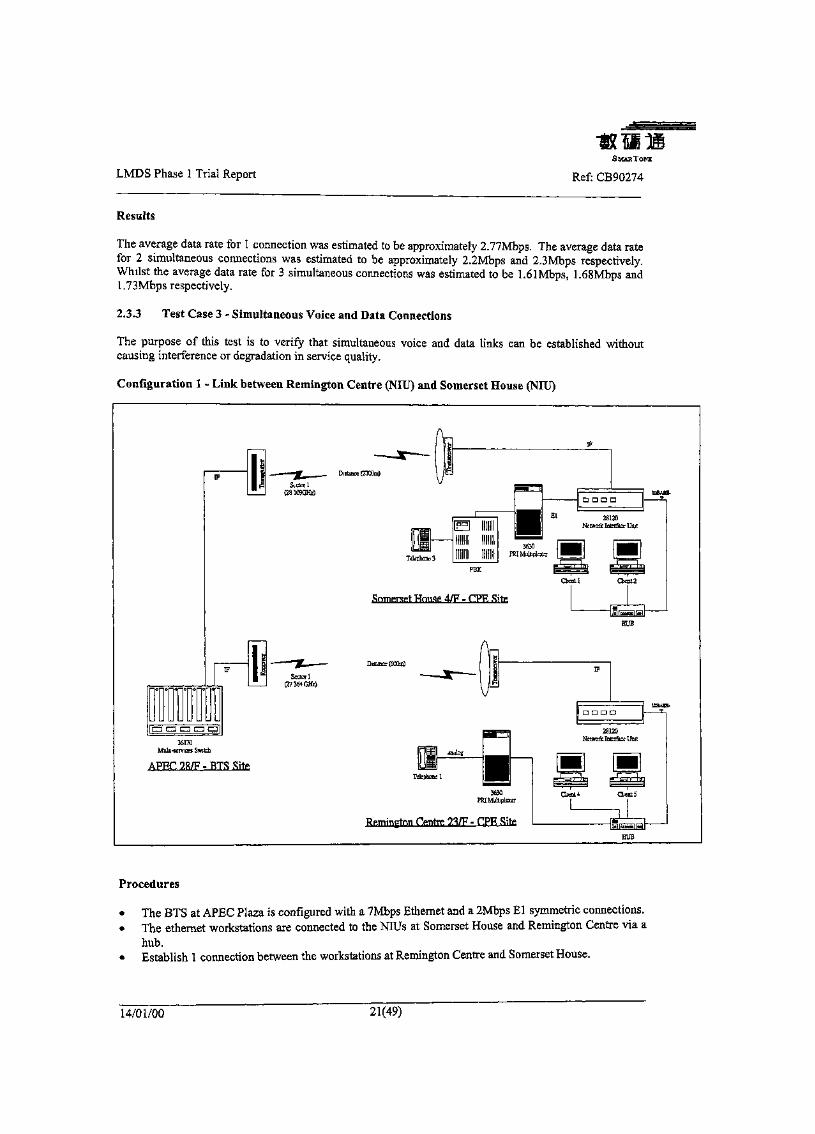
LMDS Phase 1 Trial ReportS MAR TONE
Ref: CB90274
Results
The average data rate for 1 connection was estimated to be approximately 2.77Mbps. The average data ratefor 2 simultaneous connections was estimated to be approximately 2.2Mbps and 2.3Mbps respectively.Whilst the average data rate for 3 simultaneous connections was estimated to be 1.61Mbps, 1.68Mbps andL73Mbps respectively.
2.3.3 Test Case 3 - Simultaneous Voice and Data Connections
The purpose of this test is to verify that simultaneous voice and data links can be established withoutcausing interference or degradation in service quality.
Configuration \ - Link between Remington Centre (NIU) and Somerset House (NIU)
Distance (2700m)
36170Multi-services Switch
APRC 2R/P - BTS Site
Somerset House 4/F - CPE Site
Distance (600m)
Remington Centre 23/P - CPE Site
Procedures
• The BTS at APEC Plaza is configured with a 7Mbps Ethernet and a 2Mbps El symmetric connections.• The ethernet workstations are connected to the NIUs at Somerset House and Remington Centre via a
hub.• Establish 1 connection between the workstations at Remington Centre and Somerset House.
14/01/00 21(49)
LMDS Phase 1 Trial Report Ref: CB90274
A lOOMByte raw data stream was transferred over the connection and the duration of the transfer isrecorded and the throughput estimated.The test was repeated on the reverse path.Simultaneously make a voice call from Somerset House to Remington Centre.Carry out the same test but with 2 simultaneous connections.Attention shall be placed observing for any echoes and delay in the conversation.Attention shall be placed observing for any sudden deduction in the data transfer rate.
Results
Without the voice call connected, 100MB of file is transferred between two terminals and the recorded datarate is found to be 2.12Mbps. When voice call is connected, 100MB of file is transferred between twoterminals and the recorded data rate is found to be 2.08Mbps. There is no significant drop in data rate forthe ethernet connection. No echo or delay is experienced in the voice service.
14/01/00 22(49)
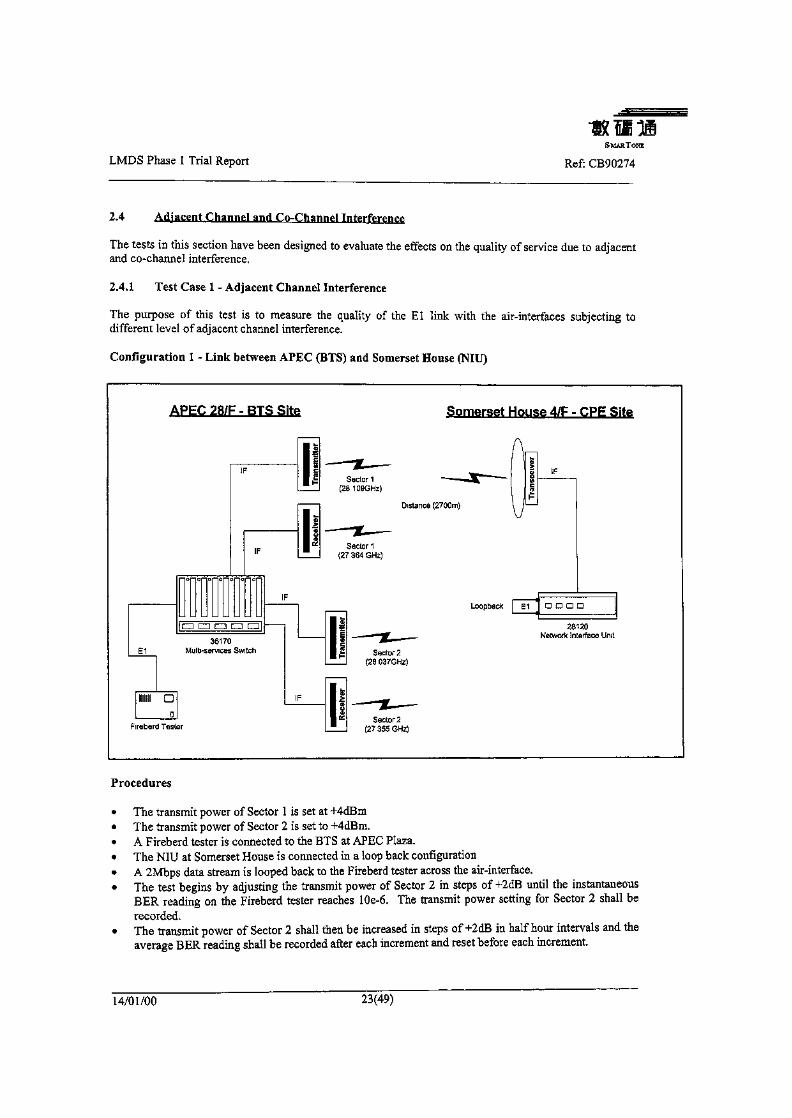
LMDS Phase 1 Trial Report Ref: CB90274
2.4 Adjacent Channel and Co-Channel Interference
The tests in this section have been designed to evaluate the effects on the quality of service due to adjacentand co-channel interference.
2.4.1 Test Case 1 - Adjacent Channel Interference
The purpose of this test is to measure the quality of the El link with the air-interfaces subjecting todifferent level of adjacent channel interference.
Configuration 1 - Link between APEC (BTS) and Somerset House (NIU)
APEC 28/F - BIS Site Somerset House 4/F - CPE Site
A
Distance (2700m)
Loopback E1
28120Network Interface Unit
Fireberd TesterSector 2
(27 355 GHz)
Procedures
• The transmit power of Sector 1 is set at +4dBm• The transmit power of Sector 2 is set to +4dBm.• A Fireberd tester is connected to the BTS at APEC Plaza.• The NIU at Somerset House is connected in a loop back configuration• A 2Mbps data stream is looped back to the Fireberd tester across the air-interface.» The test begins by adjusting the transmit power of Sector 2 in steps of+2dB until the instantaneous
BER reading on the Fireberd tester reaches 10e-6. The transmit power setting for Sector 2 shall berecorded.
« The transmit power of Sector 2 shall then be increased in steps of+2dB in half hour intervals and theaverage BER reading shall be recorded after each increment and reset before each increment.
14/01/00 23(49)
LMDS Phase 1 Trial Report Ref: CB90274
® The test should be continued until the average BER reaches 10e-3.• A plot of BER versus Adjacent Channel Power shall be recorded.
Results
Two channels with centre frequency 28.109GHz & 28.073GHz with bandwidth 36MHz are injected to thesame antenna located at APEC BTS site. The downstream channel 28.109GHz serves the CPE at SomersetHouse. The adjacent downstream channel 28.073GHz serves the CPE at Remington Building. Both CPEsites are under the coverage of BTS sector with normal radio connection. In order to serve equal coverage,same power (+37dBm) of two channels are transmitted at the BTS antenna. There is no rainfall during thetest.
The Fireberd tester recorded a average BER of 10"10 in the link between APEC and Somerset House over atesting period of 12 hours. No loss connection was encountered during that period and the availability isrecorded as 100%. It is possible to have two adjacent channels to serve the same area in frequency planning.However, it is expected that if the overlapped region is covered by a much stronger adjacent channel, theoverall performance will be downgrade.
14/01/00 24<49)

LMDS Phase 1 Trial Report Ref: CB90274
2.4.2 Test Case 2 - Co-Channel Interference
The purpose of this test is to measure the quality of the El link with the air-interfaces subjecting todifferent level of co-channel interference.
AEEC28/F-B1S Site Somerset House 4/F - CPE Site
A
Distance (2700m)
Loopback El I n n n n
28120Network Interface Unit
Firebcrd Tester
Procedures
• The transmit power of Sector 1 is set at -H 7dBm• The transmit power of Sector 2 is set to 16dB less than the transmit power of Sector 1, i.e. +ldBm.» A Fireberd tester is connected to the BTS at APEC Plaza.• The NIU at Somerset House is connected in a loop back configuration.• A 2Mbps data stream is looped back to the Fireberd tester across the air-interface.• The test begins by adjusting the transmit power of Sector 2 in steps of +2dB until the instantaneous
BER reading on the Fireberd tester reaches 10e-6. The transmit power setting for Sector 2 shall berecorded.
« The transmit power of Sector 2 shall then be increased in steps of+2dB in half hour intervals and theaverage BER reading shall be recorded after each increment and reset before each increment.
• The test should be continued until the average BER reaches 1 Oe-3.• A plot of BER versus Co-Channel Power shall be recorded.
14/01/00 25(49)

LMDS Phase 1 Trial ReportSMASTOKE
Ref: CB90274
Configuration 1 - APEC - Somerset House Downstream Co-channel test (cross polarized co-channel)
Sector 1'ointing Direct to
Somerset
ResultsRF Settings:
Sector I (Serving Somerset House)DownstreamTX power at ARIC = +4dBmTXRF =28109MHzTXIF = 1509MHz
Sector 2 (Co-channel to Sector 1)DownstreamTX power at ARIC = +4dBmTXRF =28109MHzTXIF = 1509MHz
UpstreamRX power (measured at splitter) = -53dBmRX RF = 27364MHzRX IF = 564MHz
UpstreamN/ARX RF = 27355MHzRX IF = 555MHz
ItemsDateRainfall record mmHumidityCo-channelbearingAve BERin 45 minsTX channel PwrRX channel PwrAvailability*
Reading 119-OctOmm53-73%180°
lO'9
+4dBm-53dBm100%
Reading 219-OctOmm53-73%105°
lO'9
+4dBm-53dBm100%
Reading 319-OctOmm53-73%90°
lO'9
+4dBm-53dBm100%
Reading419-OctOmm53-73%60°
lO'9
+4dBm-53dBm100%
Reading 519-OctOmm53-73%45°
lO'9
H-4dBm-53dBm100%
Reading 619-OctOmm53-73%0°
io-9
+4dBm-53dBm100%
The availability is taken for 45 min in each session.
The co-channel cross-polar interference transmitting the same power is turned with different bearingrelative to the serving antenna. No loss signal pattern was observed during the test in all direction. The CPEsite is capable to withstand any co-channel cross-polar interference in main loop direction. There is norainfall recorded during the test period. Since rainfall can cause change of polarization, the effect of co-
14/01/00 26(49)
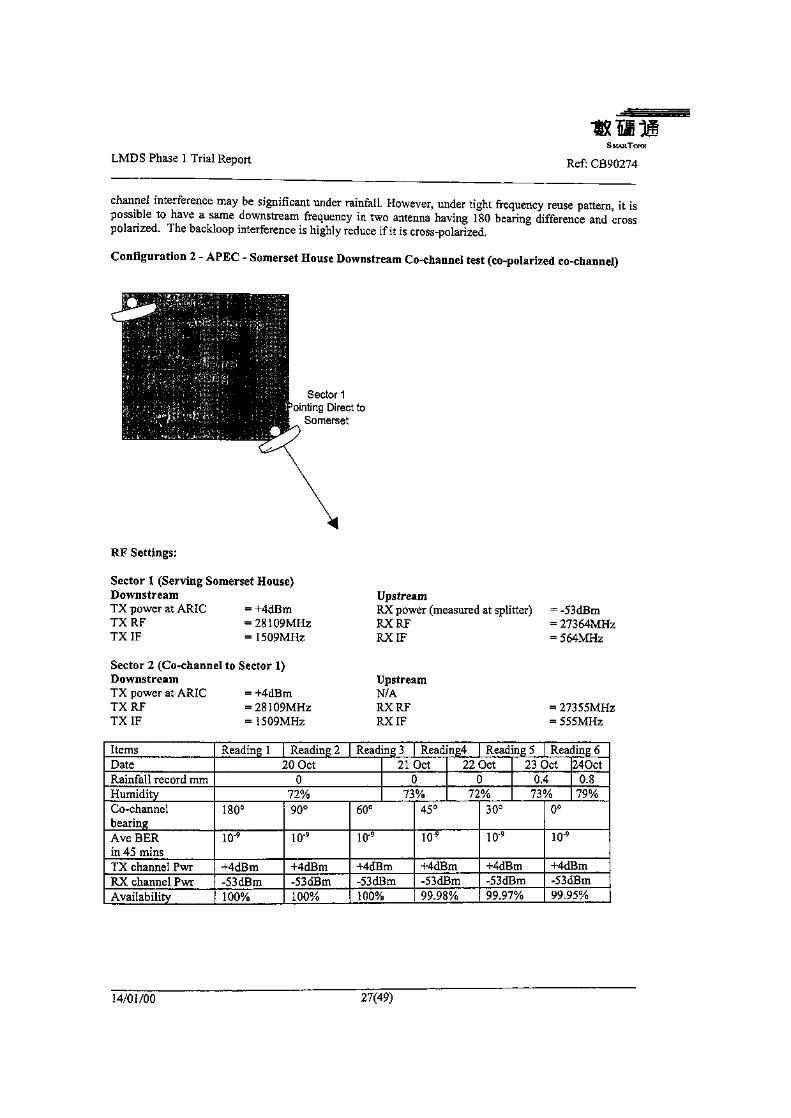
LMDS Phase 1 Trial ReportS MAE TONE
Ref: CB90274
channel interference may be significant under rainfall. However, under tight frequency reuse pattern, it ispossible to have a same downstream frequency in two antenna having 180 bearing difference and crosspolarized. The backloop interference is highly reduce if it is cross-polarized.
Configuration 2 - APEC - Somerset House Downstream Co-channel test (co-polarized co-channel)
Sector 1'ointing Direct to
Somerset
RF Settings:
Sector I (Serving Somerset House)DownstreamTX power at ARIC = +4dBmTXRF =28109MHzTXIF = 1509MHz
Sector 2 (Co-channel to Sector 1)DownstreamTX power at ARIC = +4dBmTXRF =28109MHzTX IF = 1509MHz
UpstreamRX power (measured at splitter) = -53dBmRX RF = 27364MHzRX IF = 564MHz
UpstreamN/ARXRF = 27355MHzRX IF = 555MHz
ItemsDateRainfall record rnrnHumidityCo-channelbearingAve BERin 45 minsTX channel PwrRX channel PwrAvailability
Reading 1 Reading 2 Reading 3200ct
072%
180°
io-9
+4dBm-53dBm100%
90°
io-9
+4dBm-53dBm100%
Reading421Oct
073%
60°
io-9
+4dBm-53dBm100%
Reading 5220ct
072%
45°
io-9
+4dBm-53dBm99.98%
Reading 6230ct
0.473%
30°
io-9
+4dBm-53dBm99.97%
240ct0.8
79%0°
io-9
+4dBm-53dBm99.95%
14/01/00 27(49)

LMDS Phase 1 Trial Report Ref: CB90274
The co-channel co-polarized interference is turned from 180 bearing to 0 bearing to see if there is anyadverse effect to the data link. This situation is particularly common when there is tight reuse pattern andhigh user capacity.
The antenna under test has a main loop with 90 degree bandwidth, four antenna of this type can cover thehub site serving area. It is found that the interference is more significant when the bearing is turned within45 degrees. As the interference main loop gets closer to the serving link, radio link becomes more unstable.It should be noted that the interference is a modulated signal transmitted from an antenna co-located atAPEC. There is no traffic or data transfer in the interference signal during the test and there is no user datamodulated. The interference signal has less adverse effect towards the data link. In practical case, the co-channel interference becomes more significant when the interference source is fully modulated.
Since no rainfall is recorded during the test period, the radio signal did not deteriorate much through the airmedia. It is expected that the recorded BER and availability will be affected when there is heavy rainfall /high humidity.
Configuration 3 - APEC - Somerset House, APEC - Remington Upstream Co-channel test
Sector 1Pointing Directfrom Somerset
Sector 1 (Serving Somerset House)DownstreamTX power at ARIC = +4dBmTXRF =28109MHzTXIF = 1509MHz
Sector 2 (Serving Remington Center)DownstreamTX power N/ATX RF = 28073MHzTX IF = 1473MHz
El connection was tested by firebert tester:Average BER = 10'10
Availability =99.994%
UpstreamRX power (measured at splitter) = ~53dBmRX RF = 27364MHzRX IF = 564MHz
UpstreamRX power (measured at splitter) == -48dBmRX RF = 27364MHzRX IF = 564MHz
14/01/00 28(49)
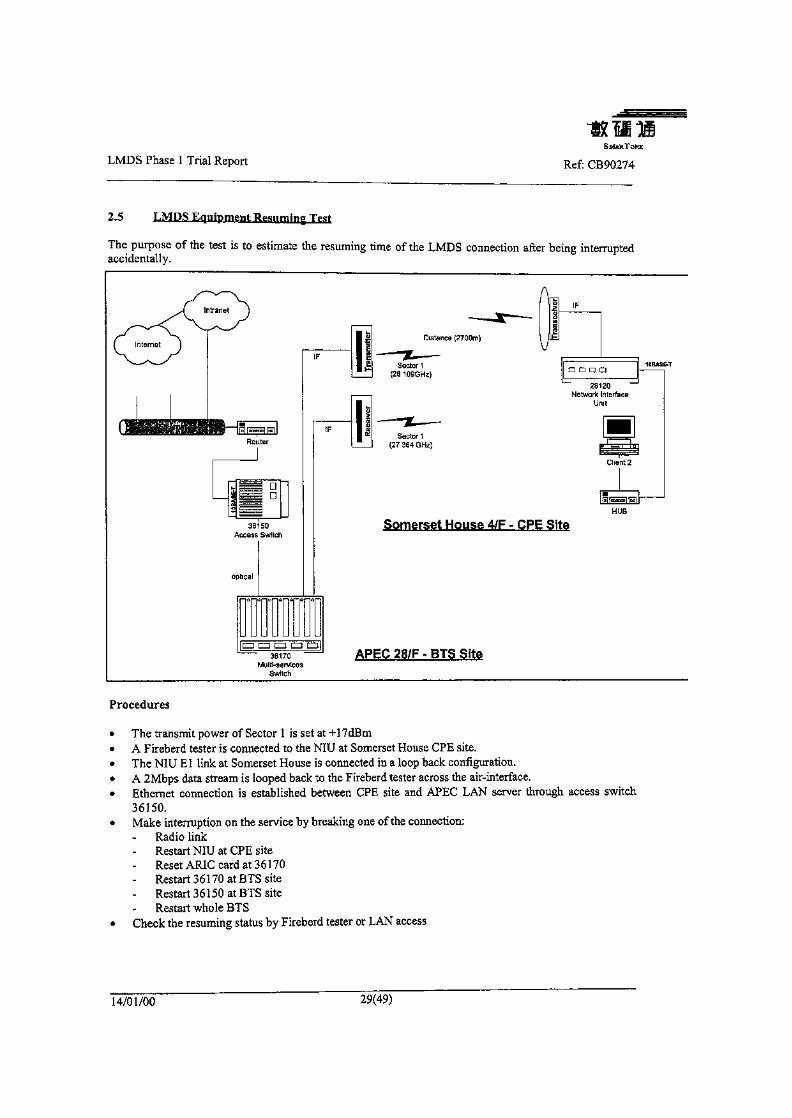
LMDS Phase 1 Trial ReportS MAR TONE
Ref: CB90274
2.5 LMDS Equipment Resuming Test
The purpose of the test is to estimate the resuming time of the LMDS connection after being interruptedaccidentally.
Distance (2700m)
anna
28120Network Interface
Unit
HUB
Somerset House 4/F • CPE Site
APEC 28/F • BTS Site
Procedures
» The transmit power of Sector 1 is set at +17dBm• A Fireberd tester is connected to the NIU at Somerset House CPE site.* The NIU El link at Somerset House is connected in a loop back configuration.* A 2Mbps data stream is looped back to the Fireberd tester across the air-interface.* Ethernet connection is established between CPE site and APEC LAN server through access switch
36150.• Make interruption on the service by breaking one of the connection:
Radio linkRestart NIU at CPE siteReset ARIC card at 3 6170Restart 36170 at BTS site
- Restart 36150 at BTS site- Restart whole BTS
• Check the resuming status by Fireberd tester or LAN access
14/01/00 29(49)
SMARTONE
LMDS Phase 1 Trial Report Ref: CB90274
Results
Radio Link - Radio link is broken by disconnecting the IF connection at BTS site. The link is establishedagain in 10 sec after the IF connector is plugged in.
Restart NIU - NIU is powered off and on. The time required to restart the NIU and synchronize with radiolink is around 50 sec.
Reset ARIC - ARIC is the key component of multi-service switch 36170 and it provides interface forATM cell grooming and distribution, IF radio modulation and demodulation, digital codingetc. The operating ARIC card is pull out from the rack and back again. The time required tosetup a new connection is 110 sec.
Restart 36170 - The multi-serving switch 36170 is the backbone system of LMDS. The setup time for thecold restart of 36170 is around 270 sec.
Restart 36150 - 36150 is the interface unit between 36170 and other network element (e.g. LAN), Thesetup time for the cold restart of 36150 is around 180 sec.
Restart whole BTS ~ the whole BTS in APEC is powered off and on again. The established time is around270 sec.
14/01/00 3°(49)
SMARTONE
LMDS Phase 1 Trial Report Ref; CB90274
Customer Access Technologies
The tests in this section have been designed to evaluate the different access technologies available at theCustomer Site e.g. access using DSL and Cable Modem technologies.
3 Customer Access Using DSL Technologies
Test equipment
• Nortel Elite 1 Modem x 2
« Nortel Etherloop modem ELMOS x 1
• Nortel Etherloop server Yesware x 1
• Desktop/portable PCs equipped with 10 Base-T NIC card x 2
- Client Notebook: Pentium 100MHz, 16M RAM- Client Notebook: Pentium II, 64M RAM
• 10 Base-T hub x 1
14/01/00 31(49)
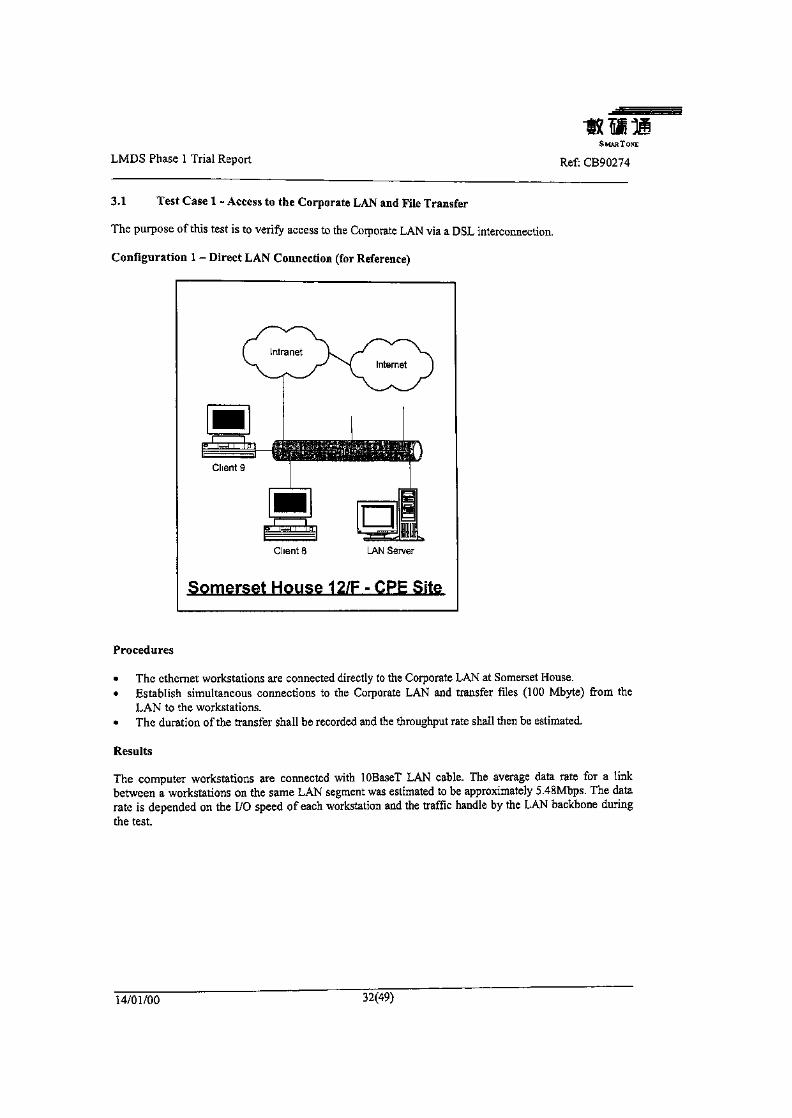
LMDS Phase 1 Trial ReportSMARTONE
Ref: CB90274
3.1 Test Case I - Access to the Corporate LAN and File Transfer
The purpose of this test is to verify access to the Corporate LAN via a DSL interconnection.
Configuration I - Direct LAN Connection (for Reference)
Client 8 LAN Server
Somerset House 12/F - CPE Site
Procedures
• The ethernet workstations are connected directly to the Corporate LAN at Somerset House.• Establish simultaneous connections to the Corporate LAN and transfer files (100 Mbyte) from the
LAN to the workstations.• The duration of the transfer shall be recorded and the throughput rate shall then be estimated.
Results
The computer workstations are connected with lOBaseT LAN cable. The average data rate for a linkbetween a workstations on the same LAN segment was estimated to be approximately 5.48Mbps. The datarate is depended on the I/O speed of each workstation and the traffic handle by the LAN backbone duringthe test.
14/01/00 32(49)
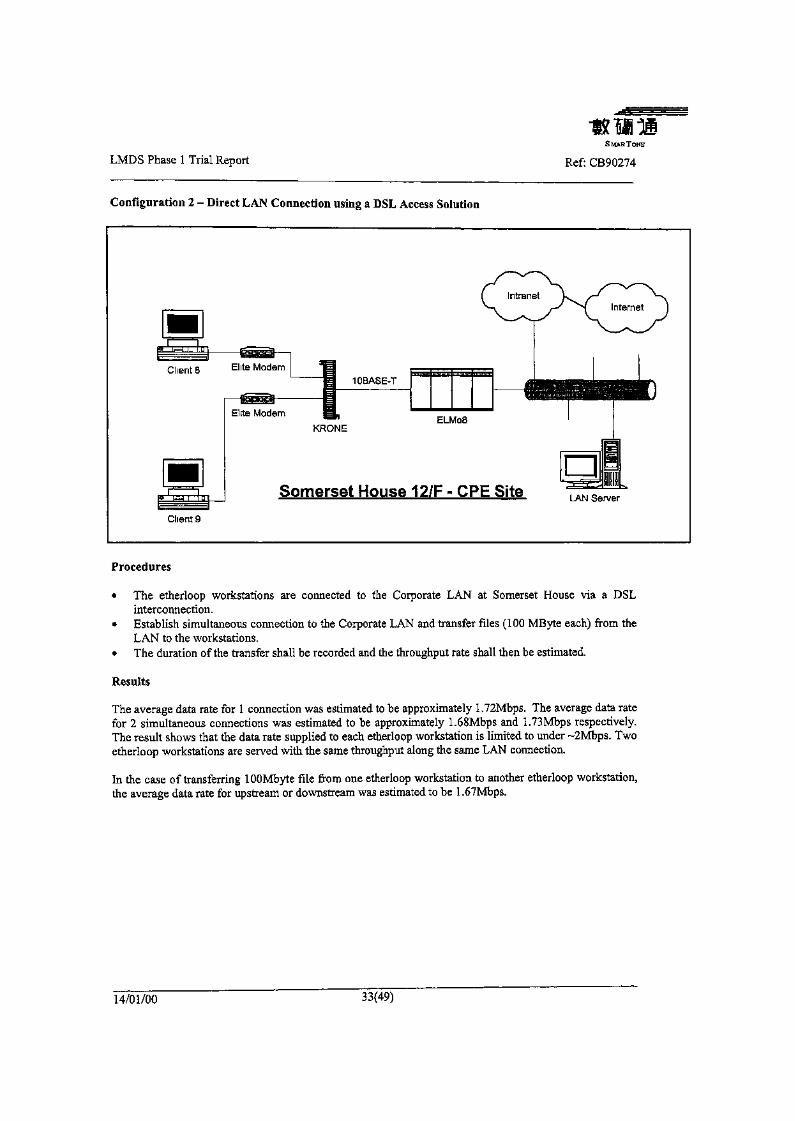
LMDS Phase 1 Trial ReportS MAR TOOT:
Ref: CB90274
Configuration 2 - Direct LAN Connection using a DSL Access Solution
Elite Modem
KRONE
Somerset House 12/F • CPE Site LAN Server
Client 9
Procedures
• The etherloop workstations are connected to the Corporate LAN at Somerset House via a DSLinterconnection.
• Establish simultaneous connection to the Corporate LAN and transfer files (100 MByte each) from theLAN to the workstations.
• The duration of the transfer shall be recorded and the throughput rate shall then be estimated.
Results
The average data rate for 1 connection was estimated to be approximately 1.72Mbps. The average data ratefor 2 simultaneous connections was estimated to be approximately 1.68Mbps and 1.73Mbps respectively.The result shows that the data rate supplied to each etherloop workstation is limited to under ~2Mbps. Twoetherloop workstations are served with the same throughput along the same LAN connection.
In the case of transferring lOOMbyte file from one etherloop workstation to another etherloop workstation,the average data rate for upstream or downstream was estimated to be 1.67Mbps.
14/01/00 33(49)
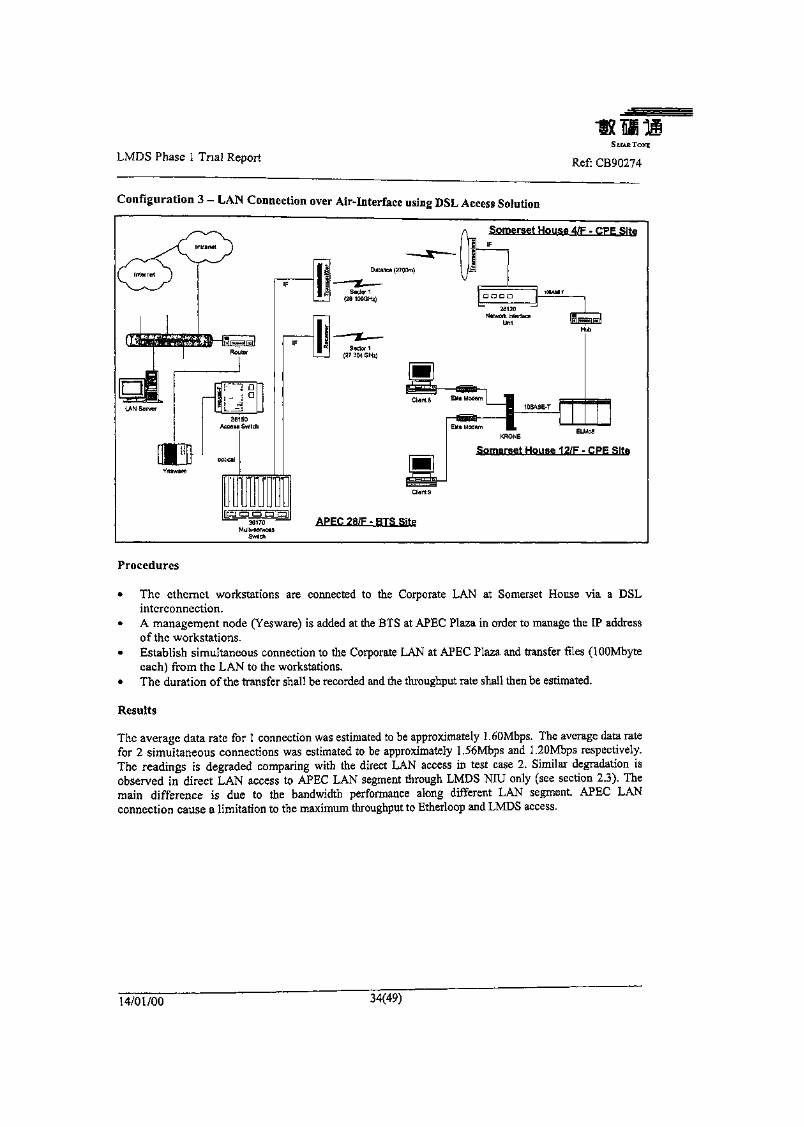
LMDS Phase 1 Trial ReportS MAE TONE
Ref: CB90274
Configuration 3 - LAN Connection over Air-Interface using DSL Access Solution
Somerset House 4/F - CPE Site
KRONE
Somerset House 12/F - CPE Site
tto^36w~~""=ij APEC 28/F - BTS Site
Procedures
* The ethernct workstations are connected to the Corporate LAN at Somerset House via a DSLinterconnection.
* A management node (Yesware) is added at the BTS at APEC Plaza in order to manage the IP addressof the workstations.
» Establish simultaneous connection to the Corporate LAN at APEC Plaza and transfer files (lOOMbyteeach) from the LAN to the workstations.
* The duration of the transfer shall be recorded and the throughput rate shall then be estimated.
Results
The average data rate for I connection was estimated to be approximately 1.60Mbps. The average data ratefor 2 simultaneous connections was estimated to be approximately 1.56Mbps and 1.20Mbps respectively.The readings is degraded comparing with the direct LAN access in test case 2. Similar degradation isobserved in direct LAN access to APEC LAN segment through LMDS NIU only (see section 23). Themain difference is due to the bandwidth performance along different LAN segment. APEC LANconnection cause a limitation to the maximum throughput to Etherloop and LMDS access.
14/01/00 34(49)
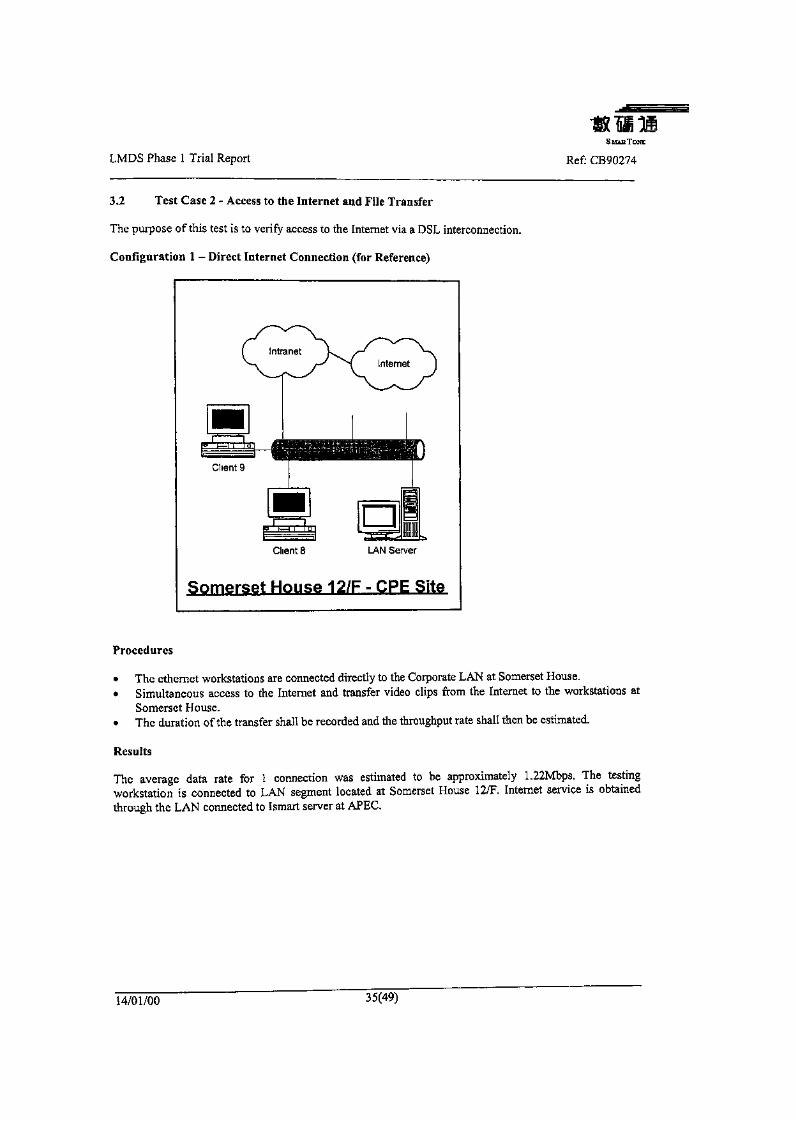
LMDS Phase 1 Trial Report
SMARTONE
Ref: CB90274
3.2 Test Case 2 - Access to the Internet and File Transfer
The purpose of this test is to verity access to the Internet via a DSL interconnection.
Configuration 1 - Direct Internet Connection (for Reference)
Client 8 LAN Server
Somerset House 12/F - CPE Site
Procedures
» The ethernet workstations are connected directly to the Corporate LAN at Somerset House.• Simultaneous access to the Internet and transfer video clips from the Internet to the workstations at
Somerset House.« The duration of the transfer shall be recorded and the throughput rate shall then be estimated.
Results
The average data rate for 1 connection was estimated to be approximately 1.22Mbps. The testingworkstation is connected to LAN segment located at Somerset House 12/F. Internet service is obtainedthrough the LAN connected to Ismart server at APEC.
14/01/00 35(49)
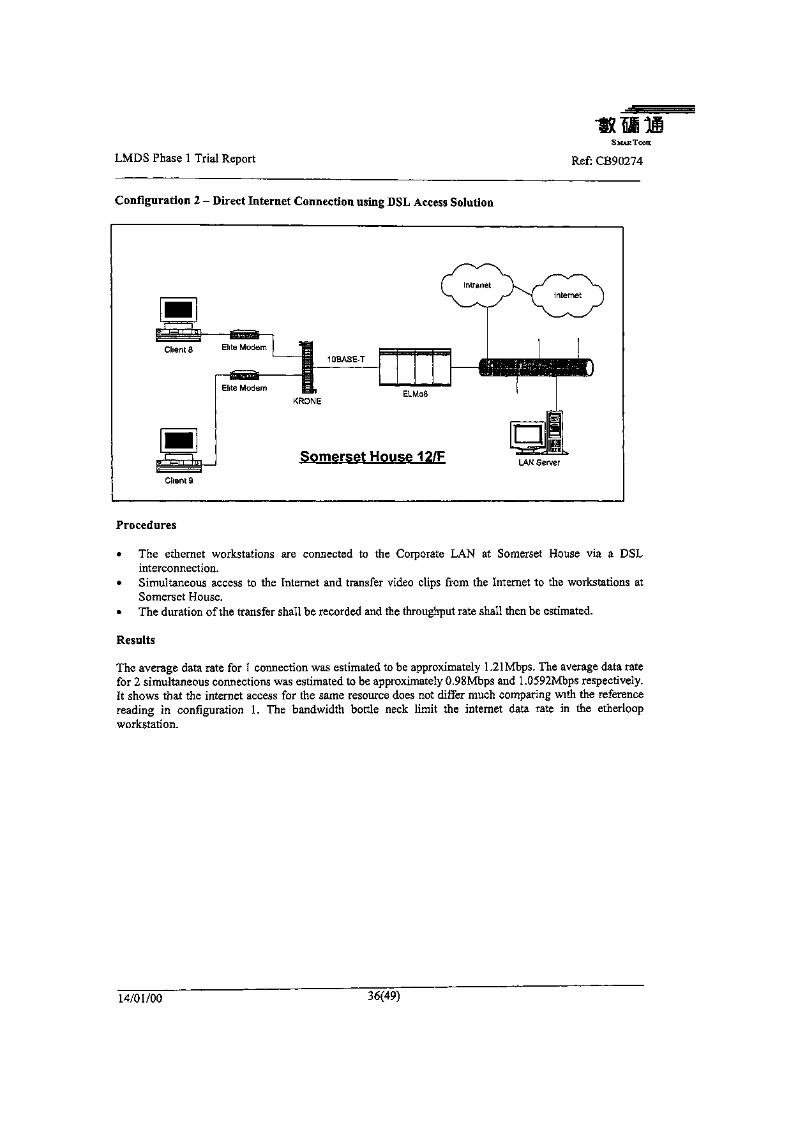
LMDS Phase 1 Trial ReportS MAR TONE
Ref: CB90274
Configuration 2 - Direct Internet Connection using DSL Access Solution
Somerset House 12/F LAN Server
Client 9
Procedures
« The ethernet workstations are connected to the Corporate LAN at Somerset House via a DSLinterconnection.
• Simultaneous access to the Internet and transfer video clips from the Internet to the workstations atSomerset House.
« The duration of the transfer shall be recorded and the throughput rate shall then be estimated.
Results
The average data rate for 1 connection was estimated to be approximately 1.21Mbps. The average data ratefor 2 simultaneous connections was estimated to be approximately 0.98Mbps and 1.0592Mbps respectively.It shows that the internet access for the same resource does not differ much comparing with the referencereading in configuration 1. The bandwidth bottle neck limit the internet data rate in the etherloopworkstation.
14/01/00 36(49)
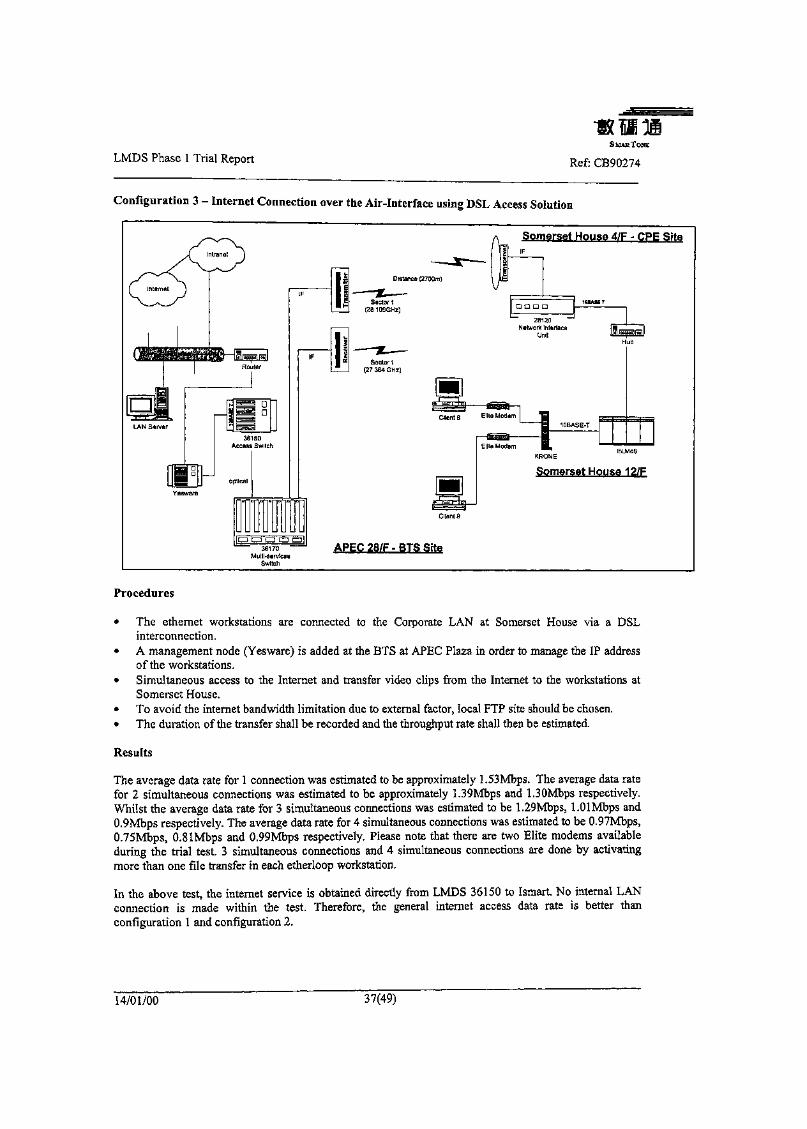
LMDS Phase 1 Trial Report
•fin HIS MAR TONE
Ref: CB90274
Configuration 3 - Internet Connection over the Air-Interface using DSL Access Solution
Somerset House 4/F - CPE Site
KRONE
Somerset House 12/F
APEC 28/F - BTS Site
Procedures
• The ethernet workstations are connected to the Corporate LAN at Somerset House via a DSLinterconnection.
• A management node (Yesware) is added at the BTS at APEC Plaza in order to manage the IP addressof the workstations.
• Simultaneous access to the Internet and transfer video clips from the Internet to the workstations atSomerset House.
• To avoid the internet bandwidth limitation due to external factor, local FTP site should be chosen.• The duration of the transfer shall be recorded and the throughput rate shall then be estimated.
Results
The average data rate for 1 connection was estimated to be approximately l.SSMbps. The average data ratefor 2 simultaneous connections was estimated to be approximately 1.39Mbps and l.SOMbps respectively.Whilst the average data rate for 3 simultaneous connections was estimated to be 1.29Mbps, LOlMbps and0.9Mbps respectively. The average data rate for 4 simultaneous connections was estimated to be 0.97Mbps,0.75Mbps, O.SlMbps and 0.99Mbps respectively. Please note that there are two Elite modems availableduring the trial test. 3 simultaneous connections and 4 simultaneous connections are done by activatingmore than one file transfer in each etherloop workstation.
In the above test, the internet service is obtained directly from LMDS 36150 to Ismart No internal LANconnection is made within the test. Therefore, the general internet access data rate is better thanconfiguration 1 and configuration 2,
14/01/00 37(49)
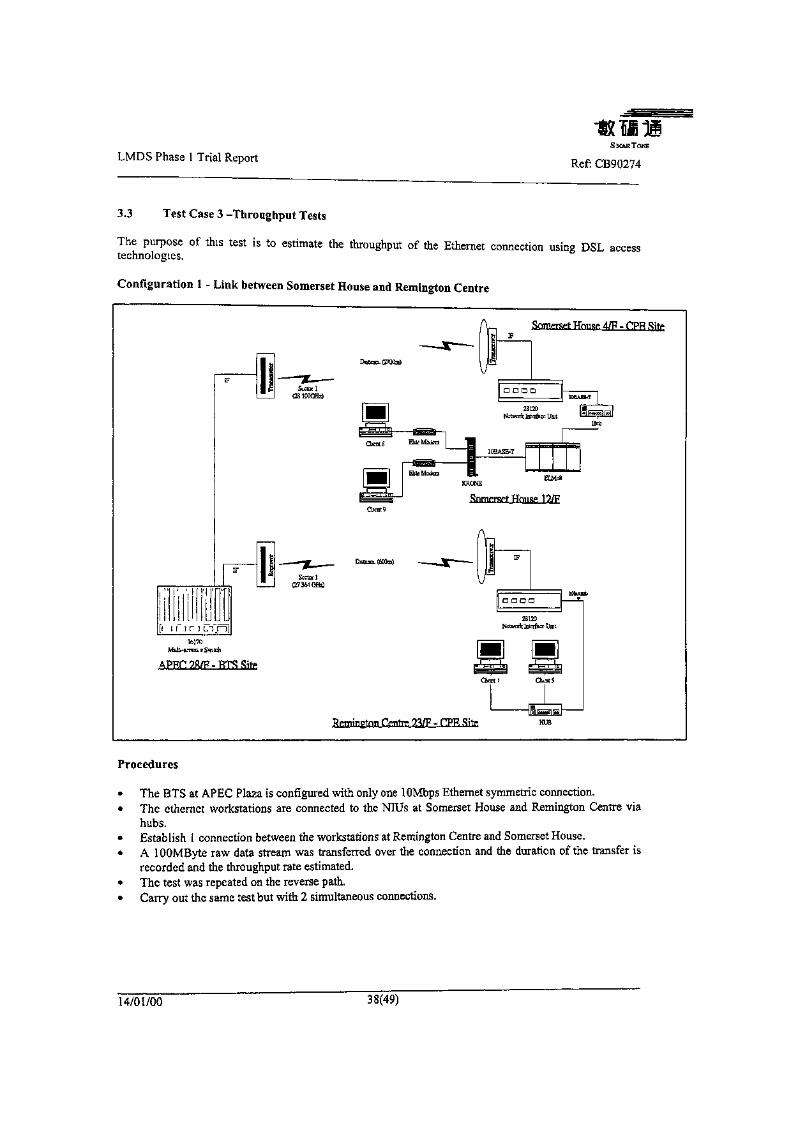
LMDS Phase 1 Trial Report Ref: CB90274
3.3 Test Case 3 -Throughput Tests
The purpose of this test is to estimate the throughput of the Ethernet connection using DSL accesstechnologies,
Configuration 1 - Link between Somerset House and Remington Centre
Somerset Hnuse 4/F - CPE Site
Distancx (2700m)
KRONE
Somerset House 12/F
Distancx (600m)
28120Network Interface Unit
36170Mult.-j«vta i Switch
AP1?r!7ft/P-ETC Site
Remington Centre 23/P - CTFR Site
Procedures
• The BTS at APEC Plaza is configured with only one lOMbps Ethernet symmetric connection.• The elhernet workstations are connected to the NIUs at Somerset House and Remington Centre via
hubs.• Establish I connection between the workstations at Remington Centre and Somerset House.« A 1 DOM Byte raw data stream was transferred over the connection and the duration of the transfer is
recorded and the throughput rate estimated.• The test was repeated on the reverse path.• Carry out the same test but with 2 simultaneous connections.
14/01/00 38(49)
SMARTONE
LMDS Phase 1 Trial Report Ref CB90274
Results
The average data rate for 1 connection was estimated to be approximately 1 94Mbps The average data ratefor 2 simultaneous connections was estimated to be approximately 1 66Mbps and 1 65Mbps respectivelyThis result is similar to direct access to LAN (see section 3 1 configuration 2) The data transfer rate is bandlimited to Etherloop rather than LMDS and LAN It is expected that if more etherloop workstations are putto test, the throughput of each etherloop will decrease further
14/01/00 39(49)
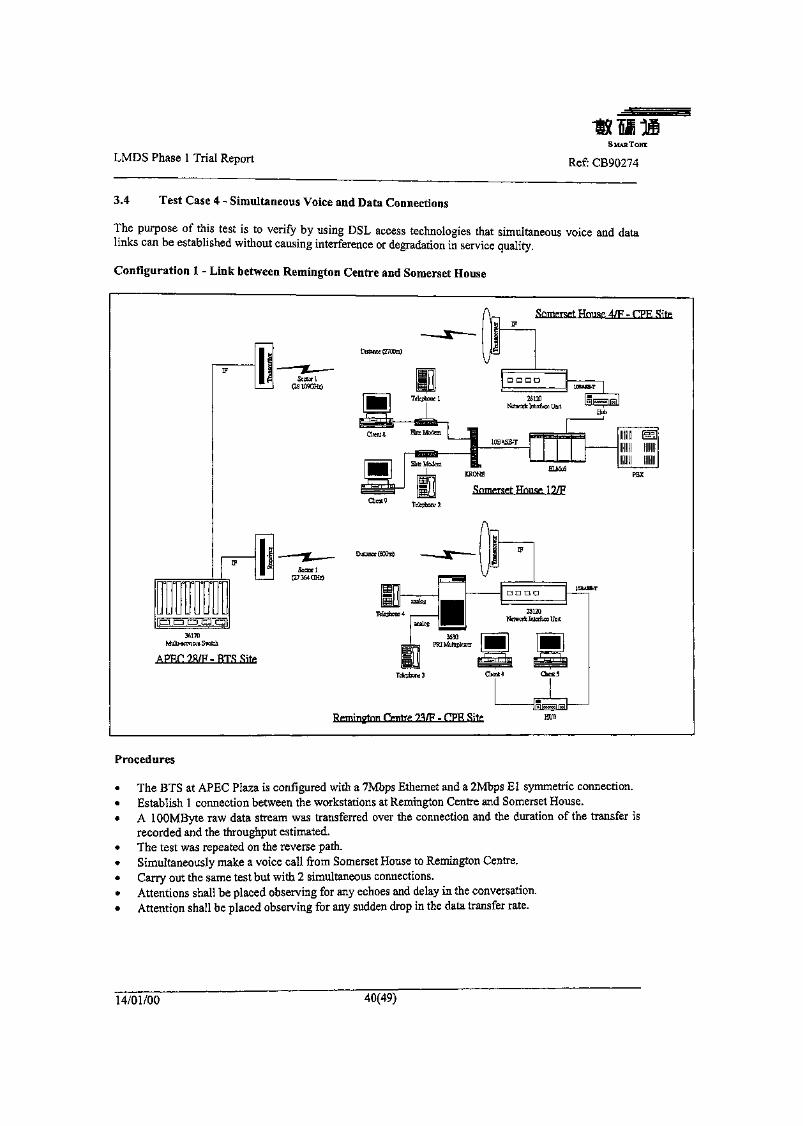
LMDS Phase 1 Trial ReportS MAE TONE
Ref: CB90274
3.4 Test Case 4 - Simultaneous Voice and Data Connections
The purpose of this test is to verify by using DSL access technologies that simultaneous voice and datalinks can be established without causing interference or degradation in service quality.
Configuration I - Link between Remington Centre and Somerset House
36170Multi-services Switch
APRT 2K/P - RTS Site
Somerset House 4/F - CPE Site
Distance (2700m)
Telephone 2
Telephone 4 28120Network Interface Unit
3630PRI Multiplexer
Telephones
Remington Centre 23/F - C1PK Site
Procedures
• The BTS at APEC Plaza is configured with a 7Mbps Ethernet and a 2Mbps El symmetric connection.» Establish 1 connection between the workstations at Remington Centre and Somerset House.« A lOOMByte raw data stream was transferred over the connection and the duration of the transfer is
recorded and the throughput estimated.• The test was repeated on the reverse path.« Simultaneously make a voice call from Somerset House to Remington Centre.• Carry out the same test but with 2 simultaneous connections.• Attentions shall be placed observing for any echoes and delay in the conversation.• Attention shall be placed observing for any sudden drop in the data transfer rate.
14/01/00 40(49)
S MAE TONE
LMDS Phase 1 Trial Report Ref: CB90274
Results
The average data rate for 1 connection was estimated to be approximately 1.96Mbps. The average data ratefor 2 simultaneous connections was estimated to be approximately 1.75Mbps and 1.73Mbps respectively.The voice call is connected from PBX analogue line (at Somerset house) to LMDS BTS 36170 and loopback to NIU at Somerset House through the same radio path. No echo or delay is observed throughout thecall and data transfer. V.35 64kbps loop back test was done by BERT tester on one of the Tl link timeslot.Average bit error rate of 10E-8 was recorded for over 1 hour.
Consequence ethernet access is obtained together with voice call service, no sudden degradation in datarate is observed when the handset is hooked on/off.
14/01/00 41<49)
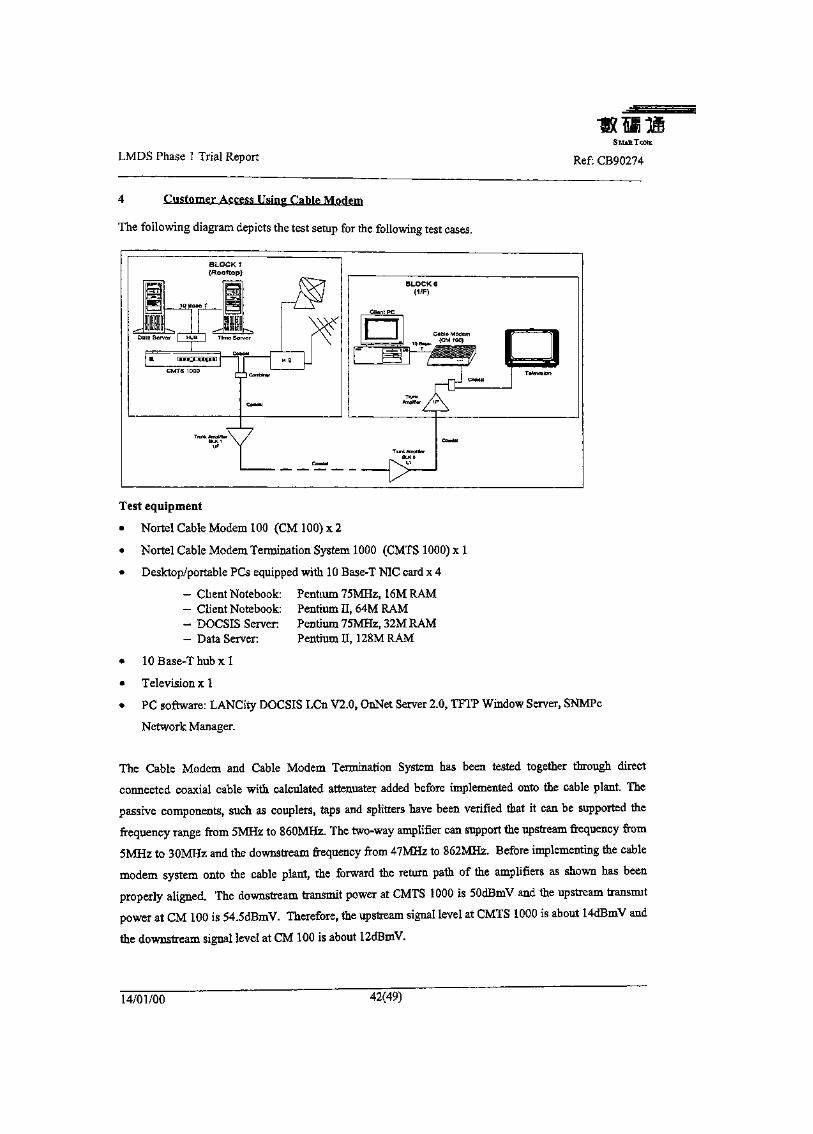
LMDS Phase 1 Trial ReportSMARTONE
Ref: CB90274
4 Customer Access Using Cable Modem
The following diagram depicts the test setup for the following test cases.
Test equipment
* Nortel Cable Modem 100 (CM 100) x 2
• Nortel Cable Modem Termination System 1000 (CMTS 1000) x 1
» Desktop/portable PCs equipped with 10 Base-T NIC card x 4
- Client Notebook:- Client Notebook:- DOCSIS Server:- Data Server:
Pentium 75MHz, 16M RAMPentium II, 64M RAMPentium 75MHz, 32M RAMPentium II, 128M RAM
» 10 Base-T hub x l
• Television x 1
• PC software: LANCity DOCSIS LCn V2.0, OnNet Server 2.0, TFTP Window Server, SNMPc
Network Manager.
The Cable Modem and Cable Modem Termination System has been tested together through direct
connected coaxial cable with calculated attenuater added before implemented onto the cable plant. The
passive components, such as couplers, taps and splitters have been verified that it can be supported the
frequency range from 5MHz to 860MHz. The two-way amplifier can support the upstream frequency from
5MHz to 30MHz and the downstream frequency from 47MHz to 862MHz. Before implementing the cable
modem system onto the cable plant, the forward the return path of the amplifiers as shown has been
properly aligned. The downstream transmit power at CMTS 1000 is SOdBmV and the upstream transmit
power at CM 100 is 54,5dBmV. Therefore, the upstream signal level at CMTS 1000 is about 14dBmV and
the downstream signal level at CM 100 is about 12dBmV.
14/01/00 42(49)
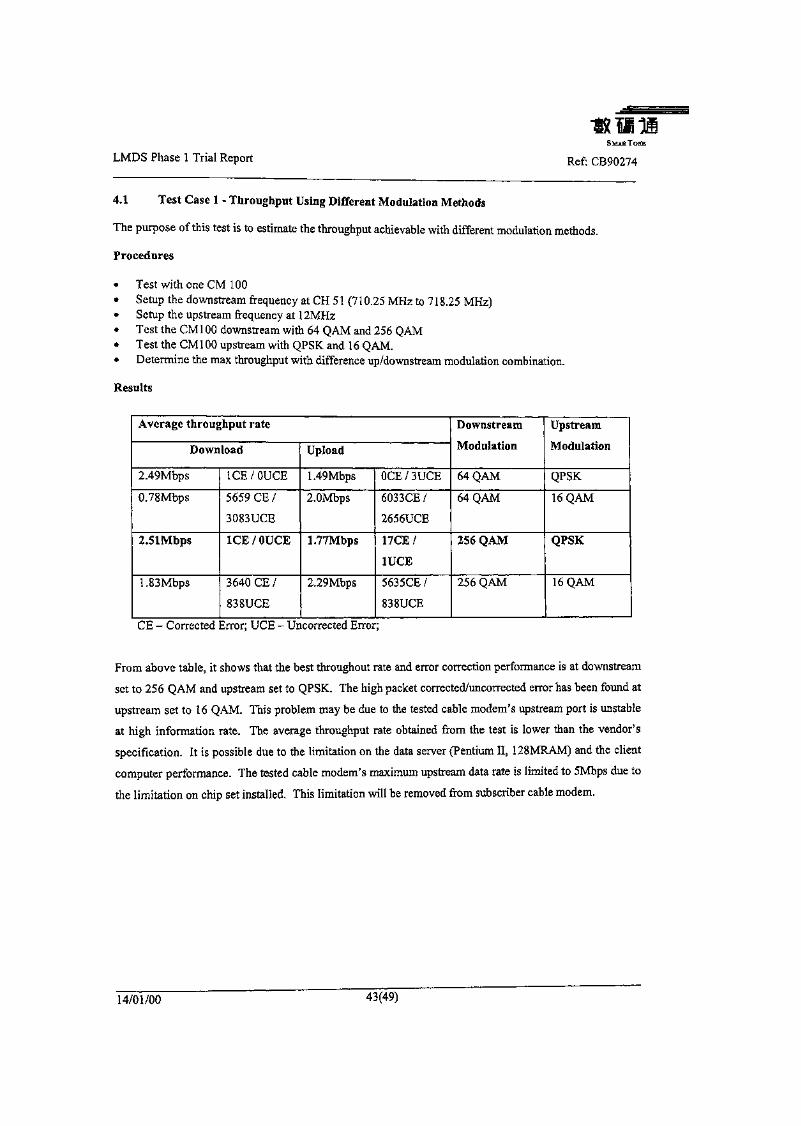
LMDS Phase 1 Trial ReportSMARlONE
Ref: CB90274
4.1 Test Case 1 - Throughput Using Different Modulation Methods
The purpose of this test is to estimate the throughput achievable with different modulation methods.
Procedures
• Test with one CM 100• Setup the downstream frequency at CH 51 (710.25 MHz to 718.25 MHz)« Setup the upstream frequency at 12MHz• Test the CM100 downstream with 64 QAM and 256 QAM« Test the CM 100 upstream with QPSK and 16 QAM.• Determine the max throughput with difference up/downstream modulation combination.
Results
Average throughput rate
Download
2.49Mbps
0.78Mbps
2.51Mbps
1.83Mbps
1CE/OUCE
5659 CE /
3083UCE
ICE / OUCE
3640 CE /
838UCE
Upload
1.49Mbps
2.0Mbps
l.TTMbps
2.29Mbps
OCE / 3UCE
6033CE/
2656UCE
17CE/
1UCE
5635CE /
838UCE
Downstream
Modulation
64 QAM
64 QAM
256 QAM
256 QAM
Upstream
Modulation
QPSK
16 QAM
QPSK
16 QAM
CE - Corrected Error; UCE - Uncorrected Error;
From above table, it shows that the best throughout rate and error correction performance is at downstream
set to 256 QAM and upstream set to QPSK. The high packet corrected/uncorrected error has been found at
upstream set to 16 QAM. This problem may be due to the tested cable modem's upstream port is unstable
at high information rate. The average throughput rate obtained from the test is lower than the vendor's
specification. It is possible due to the limitation on the data server (Pentium II, 128MRAM) and the client
computer performance. The tested cable modem's maximum upstream data rate is limited to 5Mbps due to
the limitation on chip set installed. This limitation will be removed from subscriber cable modem.
14/01/00 43(49)
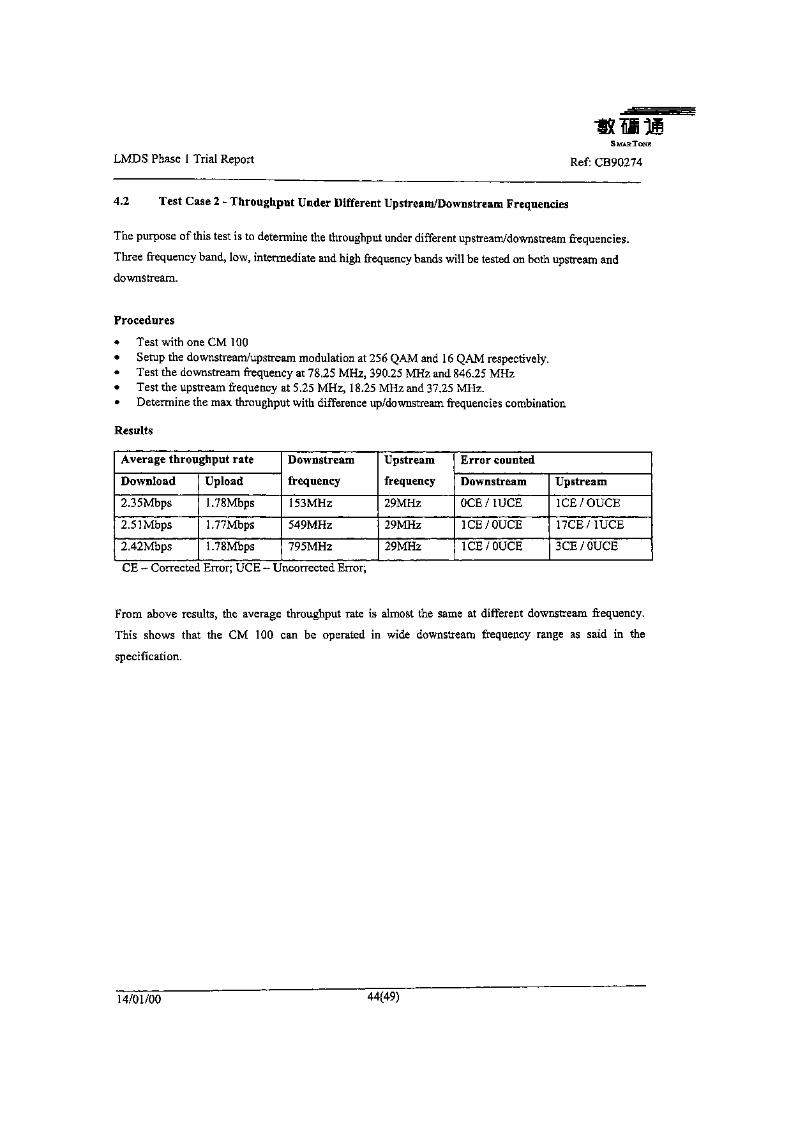
LMDS Phase 1 Trial ReportSMARTONE
Ref: CB90274
4.2 Test Case 2 - Throughput Under Different Upstream/Downstream Frequencies
The purpose of this test is to determine the throughput under different upstream/downstream frequencies.
Three frequency band, low, intermediate and high frequency bands will be tested on both upstream and
downstream.
Procedures
« Test with one CM 100« Setup the downstream/upstream modulation at 256 QAM and 16 QAM respectively.* Test the downstream frequency at 78.25 MHz, 390.25 MHz and 846.25 MHz« Test the upstream frequency at 5.25 MHz, 18.25 MHz and 37.25 MHz.* Determine the max throughput with difference up/downstream frequencies combination
Results
Average throughput rate
Download
2.35Mbps
2.51Mbps
2.42Mbps
Upload
1.78Mbps
1.77Mbps
1.78Mbps
Downstream
frequency
153MHz
549MHz
795MHz
Upstream
frequency
29MHz
29MHz
29MHz
Error counted
Downstream
OCE/1UCE
1CE/OUCE
1CE/OUCE
Upstream
1CE/OUCE
17CE/1UCE
3CE / OUCE
CE - Corrected Error; UCE - Uncorrected Error;
From above results, the average throughput rate is almost the same at different downstream frequency.
This shows that the CM 100 can be operated in wide downstream frequency range as said in the
specification.
14/01/00 44(49)
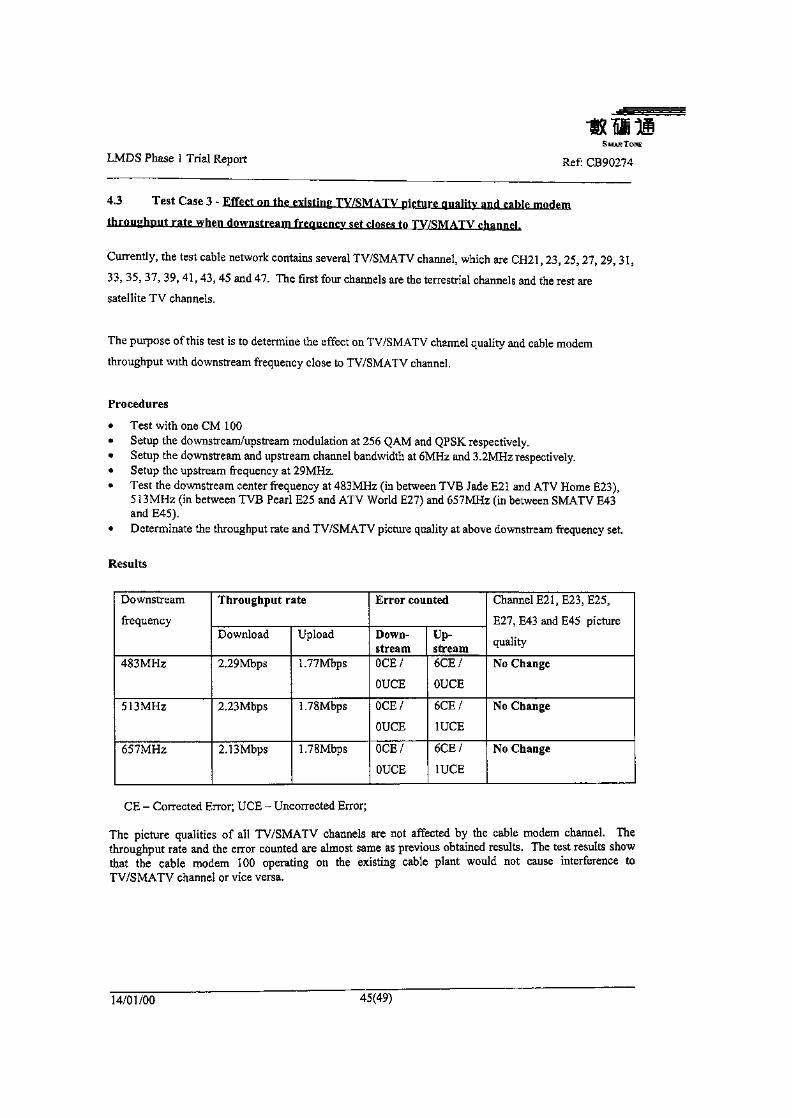
LMDS Phase 1 Trial ReportS MAR TONE
Ref: CB90274
4.3 Test Case 3 - Effect on the existing TV/SMATV picture quality and cable
rate when downstream frequency set closes to TV/SMATV channel.
Currently, the test cable network contains several TV/SMATV channel, which are CH21, 23, 25, 27, 29, 31,
33, 35, 37, 39, 41 , 43, 45 and 47. The first four channels are the terrestrial channels and the rest are
satellite TV channels.
The purpose of this test is to determine the effect on TV/SMATV channel quality and cable modem
throughput with downstream frequency close to TV/SMATV channel.
Procedures
* Test with one CM 100* Setup the downstream/upstream modulation at 256 QAM and QPSK respectively.* Setup the downstream and upstream channel bandwidth at 6MHz and 3.2MHz respectively.« Setup the upstream frequency at 29MHz.« Test the downstream center frequency at 483MHz (in between TVB Jade E21 and ATV Home E23),
5 13 MHz (in between TVB Pearl E25 and ATV World E27) and 657MHz (in between SMATV E43and E45).
« Determinate the throughput rate and TV/SMATV picture quality at above downstream frequency set.
Results
Downstream
frequency
483MHz
513MHz
657MHz
Throughput rate
Download
2.29Mbps
2.23Mbps
2.13Mbps
Upload
1.77Mbps
1.78Mbps
1.78Mbps
Error counted
Down-streamOCE/
OUCE
OCE/
OUCE
OCE/
OUCE
Up-stream6CE/
OUCE
6CE/
1UCE
6CE/
1UCE
Channel E21,E23,E25,
E27, E43 and E45 picture
quality
No Change
No Change
No Change
CE - Corrected Error; UCE - Uncorrected Error;
The picture qualities of all TV/SMATV channels are not affected by the cable modem channel. Thethroughput rate and the error counted are almost same as previous obtained results. The test results showthat the cable modem 100 operating on the existing cable plant would not cause interference toTV/SMATV channel or vice versa.
14/01/00 45(49)
TONE
LMDS Phase 1 Trial Report Ref: CB90274
4.3 Test Case 4 - Throughput with two cable modems
The purpose of this test is to evaluate if there is any degradation in the throughput when more than one
cable modem is operating simulatneously.
Procedures
« Setup two CM 100 to the cable plant.« Setup the downstream and upstream channel bandwidth at 6MHz and 3.2MHz respectively.« Setup the upstream and downstream center frequency at 29MHz and 549MHz respectively.• Test the CM 100 downstream with 64 QAM and 256 QAM» Test the CM 100 upstream with QPSK.• Determinate the average throughput at each CM 100 when both CM 100 downloading/uploading data
from/to server simultaneous.
14/01/00 46(49)
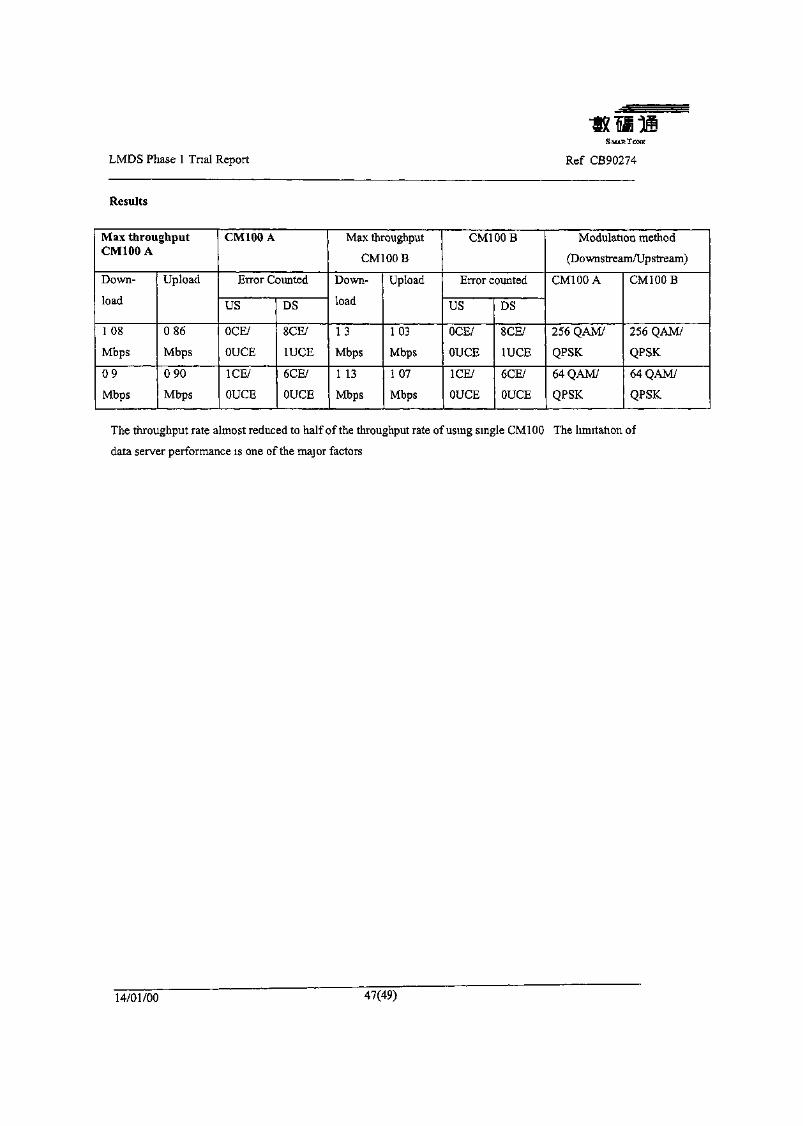
LMDS Phase 1 Trial Report
S MAR TONE
Ref CB90274
Results
Max throughputCM100 A
Down-
load
108
Mbps
09
Mbps
Upload
086
Mbps
090
Mbps
CM100 A
Error Counted
US
OCE/
OUCE
ICE/
OUCE
DS
8CE/
1UCE
6CE/
OUCE
Max throughput
CM100B
Down-
load
1 3
Mbps
1 13
Mbps
Upload
103
Mbps
1 07
Mbps
CM100B
Error counted
US
OCE/
OUCE
ICE/
OUCE
DS
8CE/
1UCE
6CE/
OUCE
Modulation method
(Downstream/Upstream)
CM100A
256 QAM/
QPSK
64 QAM/
QPSK
CM100B
256 QAM/
QPSK
64 QAM/
QPSK
The throughput rate almost reduced to half of the throughput rate of using single CM 100 The limitation of
data server performance is one of the major factors
14/01/00 47(49)
LMDS Phase 1 Trial Report Ref: CB90274
4,5 Test Case 5 - Average throughput rate between two client computers
The purpose of the test is to determine the average throughput rate of sending data through one upstreamand one downstream simultaneously.
Procedures:
1. Setup two CM100 to the cable plant.
2 Setup the downstream and upstream channel bandwidth at 6MHz and 3.2MHz respectively.
3. Setup the upstream and downstream center frequency at 29MHz and 549MHz respectively,
4. Setup both CM 100 downstream with 256 QAM and upstream with QPSK.
5. Determinate the average throughput when uploading data from one client computer to the other client
computer.
Results:
The average throughput rate is 1.38Mbps
14/01/00 48(49)

IK ii aLMDS Phase 1 Trial Report Ref: CB90274
5. SUMMARY OF RESULTS
The wireless link performance was tested by El tester and 10E-10 Bit Error Rate (BER)has been recorded for more than 48 hours in the worst case. 10E-11 BER was recordedfor most of the other time, independent of the difference in the link distance.Loss of synchronisation would result under adverse radio condition and leads to linkunavailability. The availability achieved was over 99.994% throughout the trial, while thefade margin was found to be less than +20dBm in the 2.7km radio link. 99.98%availability was recorded on the same link on a night with 30.8mm daily rainfall recorded.
In the adjacent channel and co-channel interference tests, results show that the adjacentchannel and co-channel interference can be avoided with cross-polarised antennae, evenwhen frequency reuse is tight. A reuse factor of 4 can reasonably be employed in thefrequency planning for the 'Golden Bowl' area in Hong Kong, while achieving a higherreuse factor of 2 for the New Territories.
An average cell radius of 1.5 km could be a comfortable coverage size to be deployed interms of link budget, taking into considerations of the availability of'Line Of Sight' pathsin the urban forest of high-rise and rain fade margin required in the region. [Hong Kongis in the ITU rain region 'N'.]
In the trial using LMDS and eDSL, over 2Mbps of data transfer rate could be achieved inconnecting end user to internal LAN or internet in a shared environment. This throughputvalue is applicable to both up and down stream. Voice calls were made simultaneously inEthernet modem system, and no significant drop in data transfer rate or effects fromcross-talks were observed. The data rate or throughput of each connection is dependenton the following:
total no of user in sharing the data connection.The traffic on the LAN segment or internet.The type of end user computerOverhead of the network protocol, such as ethernet protocol.
Since, the behavior of data usage is different among different type of applications. Detailstudies on data bandwidth requirement are required for dimensioning the data connection.
In the trial using Cable Modem, user data was transmitted as modulated signal throughthe SMATV backbone to the end user. No inter-modulation with the co-existedTV/SMATV signal along the co-axial cable trunk was found. Alignment of the cabletrunk amplifiers should be take care of in the future implementation in order to maximizethe transmission capacity.
14/01/00 49(49)
Preliminary Report of Technical Trial ofWireless FTNS in Hong Kong
(10 January 2000)
1. Purpose
The aim of this trial was to have an in-depth technical field study of the Hong Kong uniqueenvironment in order to expedite the implementation and roll-out of wireless FTNS. Thescope mainly covered the environmental factors such as rain fade and the technicalcharacteristics of existing in-building coaxial distribution system.
2. Field Trial Period
The field trial was commenced on 18 September 1999, the next day after Ofta's approval ofthe trial was granted. We expected that we could conclude the study by March 2000.
3. Trial Sites
There were two main trial sites. The first one was located at the Hong Kong University ofScience and Technology (HKUST). The primary objective of this site was on theenvironment study. The second site was situated in Mong Kok. Our aim for this site wasmainly the study of network deployment for commercial buildings and old residentialbuildings.
The total number of customers were limited to 100 in the Ofta's approval of our field trials.Such a quota was equally split amongst these two trial sites. There were around 50customers in each trial site. Together with our own test traffic, the trial system was fullyloaded during the test,
(a) Trial Site at HKUST
The address of trial site at HKUST was at Clear Water Bay, Kowloon. It was a typical humidarea in Hong Kong. Foggy weather was expected in Spring. It would also be quite windyduring the typhoon as the university was located at a hill on the east side of the KowloonPeninsula. The diagram below gave an overview of the trial site at HKUST.
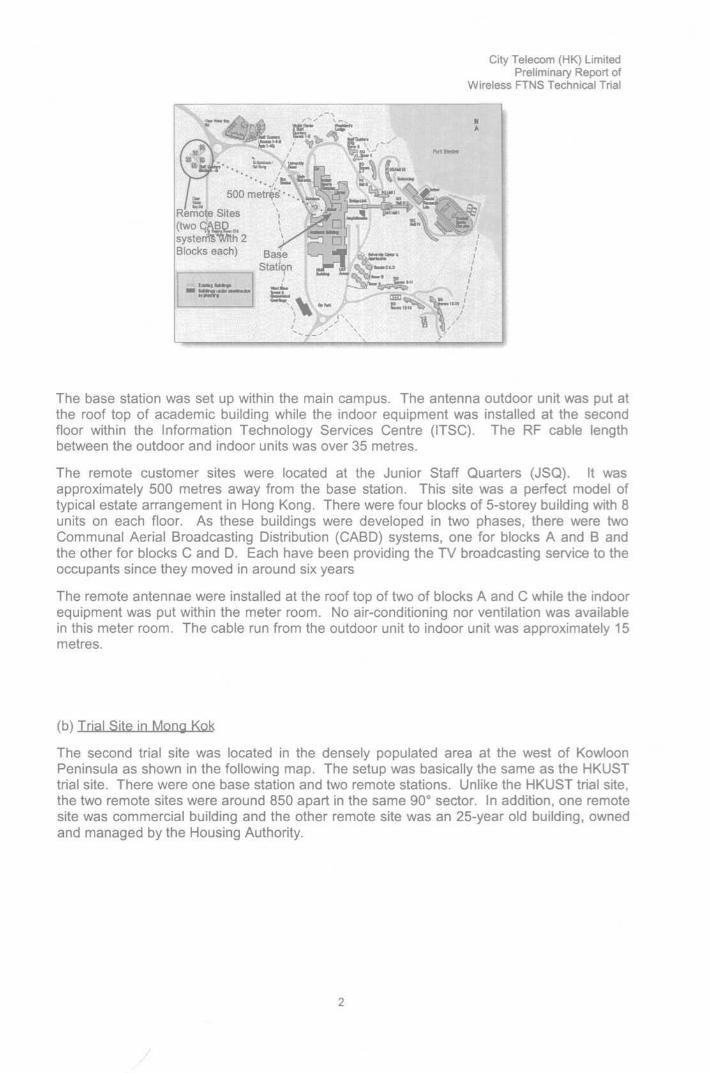
City Telecom (HK) LimitedPreliminary Report of
Wireless FTNS Technical Trial
500 metres' • • .ij
Remote Sites
systemsvwh 2 xBlocks each) Base
The base station was set up within the main campus. The antenna outdoor unit was put atthe roof top of academic building while the indoor equipment was installed at the secondfloor within the Information Technology Services Centre (ITSC). The RF cable lengthbetween the outdoor and indoor units was over 35 metres.
The remote customer sites were located at the Junior Staff Quarters (JSQ). It wasapproximately 500 metres away from the base station. This site was a perfect model oftypical estate arrangement in Hong Kong. There were four blocks of 5-storey building with 8units on each floor. As these buildings were developed in two phases, there were twoCommunal Aerial Broadcasting Distribution (CABD) systems, one for blocks A and B andthe other for blocks C and D. Each have been providing the TV broadcasting service to theoccupants since they moved in around six years
The remote antennae were installed at the roof top of two of blocks A and C while the indoorequipment was put within the meter room. No air-conditioning nor ventilation was availablein this meter room. The cable run from the outdoor unit to indoor unit was approximately 15metres.
(b) Trial Site in Mong Kok
The second trial site was located in the densely populated area at the west of KowloonPeninsula as shown in the following map. The setup was basically the same as the HKUSTtrial site. There were one base station and two remote stations. Unlike the HKUST trial site,the two remote sites were around 850 apart in the same 90° sector. In addition, one remotesite was commercial building and the other remote site was an 25-year old building, ownedand managed by the Housing Authority.
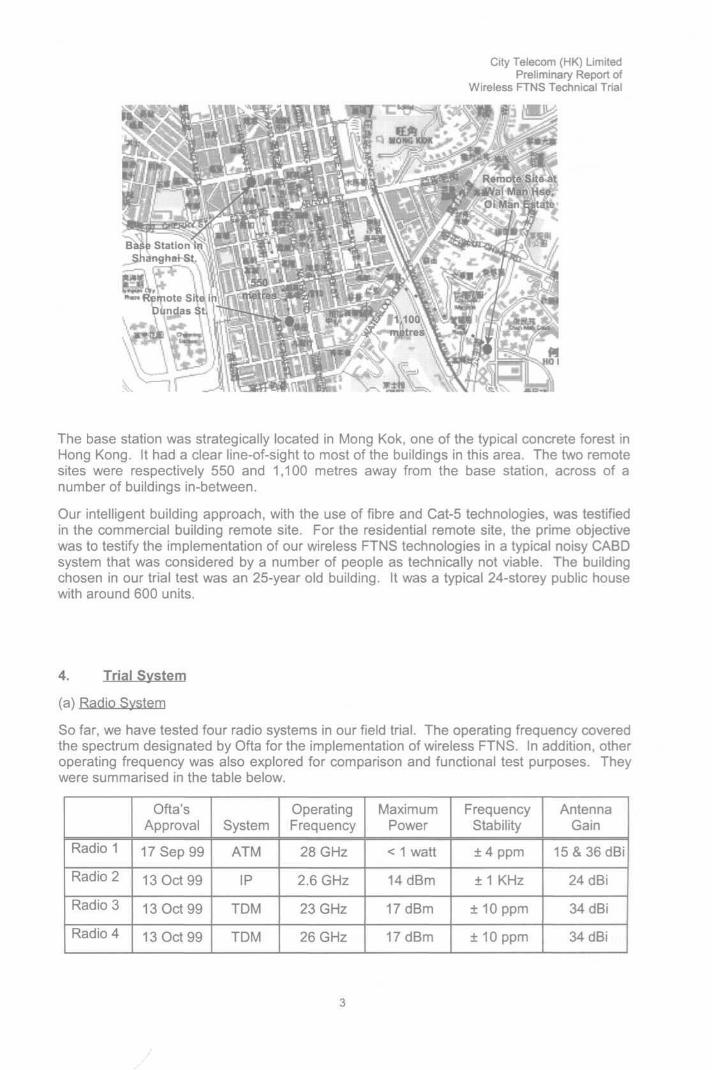
City Telecom (HK) LimitedPreliminary Report of
Wireless FTNS Technical Trial
The base station was strategically located in Mong Kok, one of the typical concrete forest inHong Kong. It had a clear line-of-sight to most of the buildings in this area. The two remotesites were respectively 550 and 1,100 metres away from the base station, across of anumber of buildings in-between.
Our intelligent building approach, with the use of fibre and Cat-5 technologies, was testifiedin the commercial building remote site. For the residential remote site, the prime objectivewas to testify the implementation of our wireless FTNS technologies in a typical noisy CABDsystem that was considered by a number of people as technically not viable. The buildingchosen in our trial test was an 25-year old building. It was a typical 24-storey public housewith around 600 units.
4. Trial System
(a^ Radio System
So far, we have tested four radio systems in our field trial. The operating frequency coveredthe spectrum designated by Ofta for the implementation of wireless FTNS. In addition, otheroperating frequency was also explored for comparison and functional test purposes. Theywere summarised in the table below.
Radio 1
Radio 2
Radio 3
Radio 4
Ofta'sApproval
17Sep99
13Oct99
13Oct99
13Oct99
System
ATM
IP
TDM
TDM
OperatingFrequency
28 GHz
2.6 GHz
23 GHz
26 GHz
MaximumPower
< 1 watt
14dBm
17dBm
17dBm
FrequencyStability
±4 ppm
±1 KHz
±10 ppm
±10 ppm
AntennaGain
15&36dBi
24dBi
34dBi
34 dBi
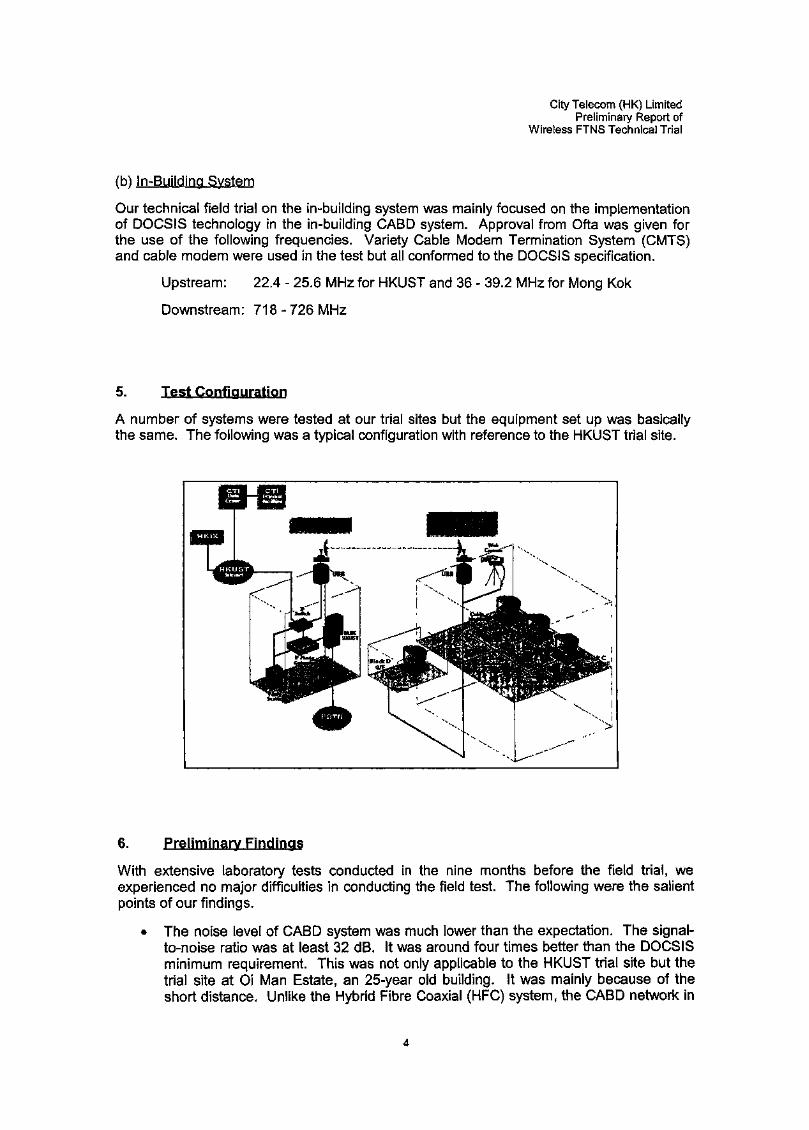
City Telecom (HK) LimitedPreliminary Report of
Wireless FTNS Technical Trial
(b) In-Building System
Our technical field trial on the in-building system was mainly focused on the implementationof DOCSIS technology in the in-building CABD system. Approval from Ofta was given forthe use of the following frequencies. Variety Cable Modem Termination System (CMTS)and cable modem were used in the test but all conformed to the DOCSIS specification.
Upstream: 22.4 - 25.6 MHz for HKUST and 36 - 39.2 MHz for Mong Kok
Downstream: 718 - 726 MHz
5. Test Configuration
A number of systems were tested at our trial sites but the equipment set up was basicallythe same. The following was a typical configuration with reference to the HKUST trial site.
6. Preliminary Findings
With extensive laboratory tests conducted in the nine months before the field trial, weexperienced no major difficulties in conducting the field test. The following were the salientpoints of our findings.
• The noise level of CABD system was much lower than the expectation. The signal-to-noise ratio was at least 32 dB. It was around four times better than the DOCSISminimum requirement. This was not only applicable to the HKUST trial site but thetrial site at Oi Man Estate, an 25-year old building. It was mainly because of theshort distance. Unlike the Hybrid Fibre Coaxial (HFC) system, the CABD network in

City Telecom (HK) LimitedPreliminary Report of
Wireless FTNS Technical Trial
Hong Kong covered only one estate within an area of less than 500 metres in HongKong.
We experienced no technical difficulties in putting our upstream and downstreamchannels in the existing CABD system. There was no degrade in the TV receptionquality after our DOCSIS system was in place. Our system was transparent to otheroccupants who did not involve in the field trial.
The net information rate achieved at the customer end could be 3 - 4 Mbit/s.
With the real time traffic generated from the customers, the trial platformsuccessfully supported the following multimedia applications to be run on it. Over800 visitors, including government officials, telecommunications analysts, reporters,incorporate owners, owner committees, management offices and propertydevelopers, have witnessed this during their visit to our trial site.
> Broadband Internet at 3 Mbit/s
> Video on demand at 2 Mbit/s
> Video Broadcast at 2 Mbit/s
> Video Conference at 512 Kbit/s
> Home Security at 512 Kbit/s
> Voice over IP
With the proper design of radio link budget and the Automatic Gain Control (AGC)built in the radio system, all our field trial radio systems could immunise from theweather condition during the trial period. The following was a summary of the majorkey meteorological data from September to December 1999. The most severeweather in Hong Kong last year was on 16 September 1999, unfortunately one daybefore the Ofta's approval of our trial was granted. The maximum instantaneousrate of rainfall was 180 mm per hour at 5:04pm while the maximum gust peak speedwas 234 km/hour at 5:14pm. This was the highest record since 1983.
Month
Sep 1999
Oct1999
Nov 1999
Dec 1999
Mean Pressure
1,007hPa
1,014hPa
1,017 hPa
1,021 hPa
Mean AirTemperature
28 °C
26 °C
22 °C
17 °C
Mean RelativeHumidity
78%
73%
70%
60%
Total Rainfall
366mm
39 mm
16 mm
33 mm
The radio system integrated perfectly with our DOCSIS system. The overallconnection efficiency depended on the radio link protocol. For IP or TDM radio link,we could achieve 70 - 80% efficiency but it was only 50% for ATM radio link.
- End -

OP*o,
HK 621.382 R42Reports on trials on IMT-2000and Local MultipointDistribution Services (LMDs)technology
^nr Winry
Date Due |^/ \ V Z y f / 4
f Bindin"
( • i \ ( (
AJ^VI1A'U I
D
ti & }• i i u • v-« I 4 ? i| t