the u.s. gas pipeline transportation market
TRANSCRIPT

JANUARY 2021 – EDF ECONOMICS DISCUSSION PAPER SERIES – EDF EDP 21–01
The U.S. Gas Pipeline Transportation Market An Introductory Guide with Research Questions for the Energy Transition
Kristina Mohlin
About Environmental Defense Fund
Guided by science and economics, Environmental Defense Fund (EDF) tackles our most urgent
environmental challenges with practical solutions. EDF is one of the world's largest
environmental organizations, with more than 2.5 million members and a staff of 700 scientists,
economists, policy experts and other professionals around the world.
EDF Economics Discussion Paper Series
EDF Economics Discussion Papers represent unrefereed works-in-progress by researchers who
are solely responsible for the content and any views expressed therein. Any comments on these
papers are welcome and should be sent to the author(s) by email. EDF’s Office of the Chief
Economist manages the series.
Sharing Our Discussion Papers
Our Discussion Papers (the “Materials”) are available for sharing and adaptation under an
Attribution-NonCommercial-NoDerivatives 4.0 International (CC BY-NC-ND 4.0) license (the
“License”). You can copy and redistribute the Materials in any medium or format; provided,
however: (i) you must give appropriate credit to us through recognition of our authorship of the
Materials (generally by citing to the Materials); (ii) you must provide the link to the License as
per the below; (iii) If you remix, transform, or build upon the Material, you may not distribute
the modified Material without our prior written consent; (iv) you may not apply any additional
restrictions to any third party that you distribute the Material to other then as specified herein,
except that you may not permit any third party to remix, transform or build upon the Materials,
without our prior written consent; and (v) you may not reproduce, duplicate, copy, distribute,
transmit, sell, trade, resell or exploit for any commercial purpose any portion of the
Materials. Images, trademarks, service marks, logos and icons used in the discussion papers are
our property and may not be used without our prior written consent. License information can be
found by visiting: https://creativecommons.org/licenses/by-nc-nd/4.0/
© 2021 Environmental Defense Fund. All rights reserved.
The U.S. Gas Pipeline Transportation Market:
An Introductory Guide with Research Questions for the Energy Transition
Kristina Mohlina _____ a Environmental Defense Fund, [email protected]
Abstract
Natural gas currently represents close to a third of U.S. primary energy consumption and has
often been described as a bridge fuel in the context of the ongoing energy transition. As coal
plants are retired and the share of variable renewable resources in the U.S. power markets
grows, power sector CO2 emissions are declining and gas-fired power plants increasingly relied
upon to provide peak and balancing services to complement the variable electricity supply from
wind and solar plants. Growth in gas-fired electricity generation in the past decade has made the
power sector the largest user of the U.S. interstate gas pipeline network, just ahead of the
industrial and building sectors. Nevertheless, future gas demand from these latter two sectors,
and from the power sector, is expected to be reduced by policy and regulatory initiatives aimed
at electrification of heating loads and economy-wide decarbonization. These developments open
up important questions around the role of the U.S. interstate pipeline network in the ongoing
energy transition. Such questions include what changes may be needed in the gas transportation
markets to provide more flexible gas delivery services to gas-fired generators that provide
valuable balancing in the power markets, and how long-term stranded asset risk for gas
transportation infrastructure should be managed in the face of electrification and
decarbonization. The objective of this paper is to facilitate further research to address these
types of questions by outlining the main market features and regulations important for
understanding the U.S. gas transportation market.
Keywords
Gas transportation markets, natural gas, pipelines, market design, economics of regulation,
electrification, decarbonization
JEL classification numbers
D47, H54, L50, Q41, Q50

Acknowledgments
I am grateful to Naim Jonathan Peress, Greg Lander, Levi Marks and Matthew Zaragoza-
Watkins for numerous interesting discussions over the past years that have stimulated my
thinking and informed this report. Particular thanks go to Natalie Karas for lending her in-depth
expertise of FERC and state public utility commission rules and practice to review and
comment, and to Levi, who did stellar research during his PhD student internship at EDF and
deserves the credit for Sections 3 and 4. Many thanks also go to Paul Joskow, Michael Roberts,
Mark Brownstein, Suzi Kerr, Oleg Lugovoy, Graham McCahan, Vickie Patton, Gwen Ruta and
Beia Spiller for valuable comments and support, and to Ricardo Esparza for helpful research
assistance. Any errors or omissions are my own. The views and opinions expressed herein do not
necessarily reflect those of EDF.
Contents
1. Introduction ......................................................................................................................... 4
2. The primary market for gas transportation ........................................................................ 6
2.1 Cost-of-service regulation of interstate gas pipelines ..................................................... 6 2.1.1 Costs of service and ratemaking ............................................................................ 7 2.1.2 Regulated rates of return ...................................................................................... 10
2.2 Long-term gas transportation contracts ....................................................................... 14
3. The secondary market for gas transportation ..................................................................17
3.1 The gas spot market ..................................................................................................... 17 3.2 Gas spot market participants ....................................................................................... 18 3.3 Local distribution companies and the gas spot market ................................................. 19
4. Pipeline operations and practices .....................................................................................19
4.1 Nominations and scheduling ....................................................................................... 20 4.2 Pipeline imbalance penalties ........................................................................................ 22
5. Where to find gas transportation market data ..................................................................23
5.1 Pipeline tariffs and rates ............................................................................................... 23 5.2 Spot market prices ....................................................................................................... 23 5.3 Gas quantities delivered (scheduled) ........................................................................... 24 5.4 Firm contract ownership ............................................................................................... 25 5.5 Gas infrastructure data ................................................................................................. 25
6. Potential updates to the market design for gas transportation ......................................26
7. Integrated gas–electric energy system models ................................................................30
8. Areas for future research and analysis.............................................................................32
References ...........................................................................................................................36
Appendix. An illustration of pipeline capacity utilization patterns ......................................41
The U.S. Gas Pipeline Transportation Market
4
1. Introduction
Natural gas has often been described as a bridge fuel in the context of decarbonizing the energy
system, even though achieving greenhouse gas (GHG) benefits from replacing coal or petroleum
with natural gas relies on limiting the methane emissions along the gas supply chain.1 The U.S.
power system is already going through a major transition in which variable renewable energy
sources (VREs) and gas-fired power plants are providing an increasing share of electricity
supply and coal plants are being retired. This energy transition will be driven further by
continued cost reductions for utility-scale wind and solar power, which in many places are
already cost competitive compared to fossil fuel-fired generation,2 and by policy goals for
economy-wide decarbonization. These drivers imply pressure to further reduce fossil fuel
resources in the power markets and to electrify at least parts of the building, transportation and
industrial sectors, resulting in energy demand moving away from natural gas and petroleum and
toward the power markets.
While gas-fired power plants currently produce close to 40% of U.S. electricity, continued
penetration of wind and solar power into the market due to their advantagous economics and
policy targets for 100% clean electricity implies decreasing future demand for electricity
generated with natural gas. To reach policy goals for economy-wide net zero GHG emissions by
2050, capacity factors for gas-fired genetors will need to fall as we get closer to that date. Any
gas-fired power plants remaining in three decades’ time would need to have their carbon
emissions compensated by negative emissions elsewhere and/or be outfitted with carbon
capture and storage (CCS) technology. As their capacity factors fall during this transition, gas-
fired generators will instead play a key role as peak capacity at times when VRE electricity
production from wind and solar plants is low and/or electricity demand is high. They can also
provide valuable ramping services for grid balancing in power markets with high shares of VREs
in response to deviations from the predicted electricity supply from VREs. By implication, the
U.S. interstate pipelines have an important role to play in the energy transition by providing the
1 See Alvarez et al. (2012) on methane leakage as a determinant of the climate impacts of switching to natural gas, and Alvarez et al. (2018) for an assessment of the methane emissions from the U.S. oil and gas supply chain. 2 See Lazard (2020) for a comparative analysis of various power-generation technologies on a levelized cost of energy ($/MWh) basis.
EDF Economics Discussion Paper 21-01
5
flexible gas delivery services that the gas-fired generators will need to deliver these peak and
ramping services in the power markets.3
Lower future demand for gas-generated electricity would, in combination with electrification of
heating loads in the residential and commercial sectors, also imply a reduction in the total
volumes of gas transported through the interstate pipelines (as well as the gas distribution
system, where space and water heating are large fractions of end-use demand for gas in some
regions). These trends thereby open up important questions around how the interstate pipelines
will manage this reduction in their revenue base, and who is, or should be, shouldering the costs
of the gas transportation infrastructure and the risk of some of these assets becoming stranded
in a low-carbon-energy future.
As further described in this report, the interstate pipeline market and its operational practices
were primarily designed to deliver gas to more predictable sources of gas demand. These include
heating loads in residential and commercial buildings, as a fuel source and feedstock for
industry, and for ‘baseload’ gas-fired power generation, but not for gas-fired generators with
highly variable gas demand. More analysis is therefore needed of how the gas transportation
market design can be improved to better accommodate this shift in customer composition, gas
demand profiles and pipeline service needs throughout the energy transition.
This paper is intended as a guide for anyone interested in the U.S. gas transportation markets. It
outlines the main market features and regulations important for understanding the basic
features of this market. The objective of the paper is to stimulate further research and analysis
on how to improve the design, regulation and operation of this market to facilitate an efficient
use of the U.S. gas transportation system throughout the ongoing energy transition, and to
manage stranded asset risk and associated distributional impacts.
Section 2 describes the primary market for gas transportation, which is defined by the long-term
contracts between the interstate pipeline companies and their customers, and how the rates
charged to primary customers are regulated by the Federal Energy Regulatory Commission
(FERC). Section 3 describes the secondary market and the main features of the gas spot market.
Section 4 describes pipeline operations and practices. To facilitate new research and analysis,
Section 5 provides guidance on where to find data on the U.S. gas transportation markets.
3 As the energy system gets closer to net zero CO2 emissions, gas-fired peak and ramping capacity will likely need to be complemented with energy storage.
The U.S. Gas Pipeline Transportation Market
6
Section 6 discusses potential market design updates that could potentially improve market
efficiency in the U.S. gas transportation markets. Section 7 describes models that can be used for
simulation analyses of the U.S. gas–electric intersection. Finally, Section 8 outlines a few of the
many possible avenues of research on the role of natural gas and the gas pipeline network in the
U.S. energy transition.
2. The primary market for gas transportation
The current market design for U.S. natural gas transportation was established through a series
of reforms implemented by FERC in the 1980s and 1990s. These reforms separated the gas
transportation service market from the gas commodity market and required interstate pipeline
companies to sell their transportation services through long-term contracts for pipeline capacity
(Marks et al. 2017). Previously, interstate pipeline companies would buy gas from producers at
the wellhead, transport it to retail distributors, and sell it for a single bundled price that
encompassed the costs of both the transportation service and the gas commodity itself (for more
background, see Oliver and Mason [2018]).
Since the reforms of the 1980s and 1990s, the interstate pipeline companies no longer take
ownership of the gas at any point and sell only gas transportation and storage services. The
majority of their revenue comes from the long-term gas transportation contracts under which
they charge their customers, such as local gas distribution utilities, rates that are regulated by
FERC (as described in Section 2.1).4 The long-term contracts between the pipeline companies
and their customers define the main features of the primary market for interstate gas
transportation.
2.1 Cost-of-service regulation of interstate gas pipelines
As an industry with natural monopoly features under federal jurisdiction, interstate pipeline
companies have their revenues regulated by FERC.5 Under the Natural Gas Act of 1938, the rates
4 The degree to which FERC regulation is binding depends on whether there are several competitive alternatives for gas pipeline transportation between the point of gas injection and the point of gas delivery (P. L. Joskow, pers. comm., November 2020). 5 Intrastate transportation of natural gas is typically regulated by state agencies, such as a state public utilities commission, rather than FERC.
EDF Economics Discussion Paper 21-01
7
charged to the pipeline users are required to be “just and reasonable.” The default methodology
used by FERC is cost-of-service ratemaking, in which it sets rates at the level required to recover
a pipeline’s cost of providing service, including a rate of return on its investments (FERC 2019a).
However, compared to more traditional cost-of-service regulation of gas and electric utilities,
FERC’s regulation of the gas pipelines is more “lighthanded,” since some gas transportation
routes are served by several different pipelines that compete for customers. Instead, FERC
practice relies on competitive bidding and negotiation between the pipelines and their
customers under the shadow of cost-of-service regulation, which functions more as a backstop
(P. L. Joskow, pers. comm., November 2020).
2.1.1 Costs of service and ratemaking
An interstate pipeline’s rates are typically established using one of the three methods below. See,
e.g., AGA (2011) and FERC’s (1999a) Cost-of-service rates manual for further details beyond the
overview provided in this section.
The cost-of-service method (further described below) is based on the pipeline providing
FERC with documentation of capital investments and operational costs in a cost-of-
service study, which in turn is used to set the pipeline’s so-called “recourse rate.”
The negotiated rate method allows the pipeline to charge a rate that is negotiated and
agreed upon between it and the pipeline customer. To safeguard against unequal
bargaining power, the customer has the option to select service under the pipeline’s
recourse rate, which is based on the pipeline’s cost of service as above. The recourse rate
effectively serves as a price cap.6
The market-based rate method may be employed when a pipeline can demonstrate that
it does not have market power on the relevant gas transportation route. In this case, the
pipeline is allowed to charge rates based on market conditions (AGA 2011).
The primary contracts established with either of these methods may have different durations
and different terms of service. The cost-of-service study is an analysis that is used to determine
the costs of serving the pipeline’s customers. The three main cost categories are rate base, return
and operational expenses. Since the gas transportation market is, as noted above, separated
6 For more details on FERC’s approach to market-based and negotiated rates, see Federal Register (1996).
The U.S. Gas Pipeline Transportation Market
8
from the physical gas commodity market, the costs discussed here therefore relate only to the
costs of transporting gas and do not include the cost of the gas commodity.7
The rate base is the amount of capital investment the pipeline company has made in facilities
and equipment, such as pipes, land, buildings and compressors (AGA 2011). Return is the
amount the operator earns as a return on those investments and is generally determined by
multiplying the rate base with the allowed rate of return (further discussed in Section 2.1.2). The
rate base at FERC (and most state public utility commissions) is based on the “depreciated
original cost” of these facilities. Because accumulated depreciation is subtracted, other things
being equal, the rate base declines over time if there is no additional investment (see, e.g., Davis
[2009] and FERC [1999a] for more details).8
Operational expenditures include items such as operating, labor and maintenance costs, taxes,
and administrative costs (AGA 2011). Operational costs are passed through to customers
without the pipeline companies charging a markup, and — in contrast to the rate base — are
therefore not a source of net revenue and potential profits to the companies. Operational
expenditures also include an annual depreciation item, even though this is a non-cash expense
and is usually based on straight-line depreciation (Davis 2009).
Once these cost categories have been identified, they are used to determine the recourse rate
and assigned to be recovered through either of the two elements of a pipeline’s demand rate: the
usage fee and the reservation fee (GAO 1993).9 Recourse rates typically decline over time, as the
pipeline’s rate base depreciates. Under the negotiated rate method, these two elements are both
negotiable (Jost and Benson 2016).
The usage fee is set to recover the variable costs — i.e., costs that vary with the amount of
gas transported (GAO 1993) — and is applied per unit of gas transported under the
billing period.
7 The cost of the gas commodity does, however, feature as part of the operational cost, e.g., the cost of the gas used to fuel compressor stations. 8 See Schmalensee (1989) for a discussion on the relationship between depreciation schedules and profitability under rate of return regulation. Companies keep two measures of “book value” (the depreciated value of their assets), one for rate of return regulations and related reporting, and another for tax purposes, since the allowed depreciation rate for taxes can differ from the one allowed under rate of return regulation. 9 Other common rate designs, more typically used by electric and gas distribution utilities, are flat volumetric rates and/or fixed monthly fees.
EDF Economics Discussion Paper 21-01
9
The reservation fee is typically significantly higher and set to recover the pipeline’s fixed
costs — i.e., costs that do not vary with the amount of gas transported (GAO 1993). The
reservation fee is applied to each unit of capacity the customer is allowed to reserve
during periods of peak demand under the contract.
Customers with so-called firm service primarily pay for their pipeline capacity through this
reservation fee, which is constant regardless of how much gas they end up transporting on the
pipeline (GAO 1993). Essentially, the firm customers pay for the right to use the pipeline when
they need to, rather than for their actual usage of it.
In contrast, customers with so-called interruptible (non-firm) service primarily pay for their
pipeline services through a usage fee that is applied to each unit of gas they transport (GAO
1993). The interruptible service usage fee typically differs from the usage fee under the firm
service rate and may be set to additionally recover some of the pipeline’s fixed costs.
These regulated rates are designed to give pipeline companies the opportunity to recover their
costs and make a return on investment, but they are not a revenue guarantee. If a pipeline does
not achieve its authorized level of revenue (as determined by the cost of service and associated
rates), there is usually no compensation. In such cases, the company can request a new rate
going forward, but it may not recover revenue lost in the past. Customers can also file a
complaint with FERC challenging a pipeline’s rates (AGA 2011).
That the majority of the interstate pipelines’ primary customers, the firm service customers, face
a reservation fee that is a fixed cost to them regardless of how much gas they end up using is an
important consideration in the context of decarbonization and the ramping services needed
from the gas-fired generators to balance VRE generation. In regions with restructured electricity
markets and centrally organized wholesale electricity markets, such as ISO New England (ISO-
NE) and PJM, merchant gas-fired electric generators have tended not to sign up for firm long-
term contracts with associated fixed reservation fees because doing so is considered too
financially risky.10
Alternative pipeline service options need to be considered in pipeline tariffs, with rate designs
that are more suitable for gas-fired generators and their highly variable gas demand (see, e.g.,
INGAA [2019] for the natural gas pipeline industry’s own recognition of this need). Primary
10 The firm service customers can, however, choose to sell their capacity in the secondary market somewhat mitigating this risk.
The U.S. Gas Pipeline Transportation Market
10
contracts with more sophisticated rate designs that are reflective of both location- and time-
varying gas delivery constraints and the costs of providing flexible gas delivery services could
improve utilization of the interstate pipeline capacity. At the same time, they could also facilitate
reliable provision of ramping services in power markets with high shares of VREs.
2.1.2 Regulated rates of return
The allowed rate of return under FERC regulation reflects the estimated weighted average cost
of capital for the pipeline, and is the weighted average of the return on equity (ROE) and the
embedded cost of debt, adjusted for income taxes net of the tax shield from debt (see FERC
[1999a] for details).11 However, unlike many of the cost items in a cost-of-service study —
including the cost of debt — a pipeline’s ROE is not directly observable and is therefore
estimated by FERC according to the methods described in this section.
Interstate pipelines currently receive regulated ROEs of approximately 10% as established by
FERC practice (see, e.g., FERC [2018]), but in practice ROEs may also be higher than that (see,
e.g., Troutman Pepper [2019]). According to rulings by the Supreme Court, “the return to the
equity owner should be commensurate with the return on investments in other enterprises
having corresponding risks. That return, moreover, should be sufficient to assure confidence in
the financial integrity of the enterprise, so as to maintain its credit and to attract capital” (U.S.
Supreme Court 1944). In May 2020, FERC updated its methodology for establishing a
reasonable ROE for natural gas and oil pipelines (see FERC 2020). The main features of this
policy statement are summarized here; readers are referred to the document for more detail.
The main policy change adopted by FERC in May 2020 was a move away from its reliance since
the 1980s on the so-called discounted cash flow (DCF) model. Instead, FERC decided to use an
average of the results from both DCF and capital asset pricing model (CAPM) analyses, with
equal weight given to both (the two models are briefly described below). The motivation given
for this policy change was that including “the CAPM in addition to the DCF model will better
reflect how investors in those industries measure cost of equity while tending to reduce the
model risk associated with relying on the DCF model alone. This should result in our ROE
11 Income taxes are accounted for differently from other taxes in cost-of-service assessments since they are tied to a firm’s taxable income, which is determined by the ROE. Since interest on debt is tax deductible, interest payments on debt “shield” some of the gross return on equity. Pipelines may also earn more or less than the allowed rate of return in negotiated contracts (P. L. Joskow, pers. comm., November 2020).
EDF Economics Discussion Paper 21-01
11
analyses producing cost-of-equity estimates for natural gas and oil pipelines that more
accurately reflect what ROE a pipeline must offer in order to attract capital” (FERC 2020).
Since most natural gas pipelines are wholly owned subsidiaries and their stock is not publicly
traded, FERC develops an estimate based on a range of ROEs in a proxy group of publicly traded
entities with similar risk profiles. These entities must be comparable to the pipeline whose ROE
is being determined with respect to their risk exposure, and unless the specific pipeline faces
unusually high or low risks, FERC sets the pipeline’s cost-of-service nominal ROE at the median
of the range of returns estimated for the proxy group (FERC 2020).
Proxy group of similar firms
FERC has historically required the proxy group to consist of at least four, and preferably at least
five, members. Each firm in the proxy group should also satisfy three standards: (1) the
company’s stock must be publicly traded; (2) the company must be recognized as a natural gas
company and its stock must be recognized and tracked by an investment information service;
and (3) pipeline operations must constitute a high proportion of the company’s business (at
least 50% of the company’s assets or operating income on average over the most recent three-
year period). However, this approach has been complicated by a reduction in the number of
publicly traded corporations with significant shares of natural gas pipeline operations due to
mergers and acquisitions, and a trend toward master limited partnerships (MLPs) owning
natural gas pipelines (FERC 2011). In its May 2020 policy statement, FERC said it would
maintain a flexible approach to forming proxy groups and would also continue to relax the 50%
standard in (3) when necessary to obtain a proxy group of five members.
Discounted cash flow (DCF) model
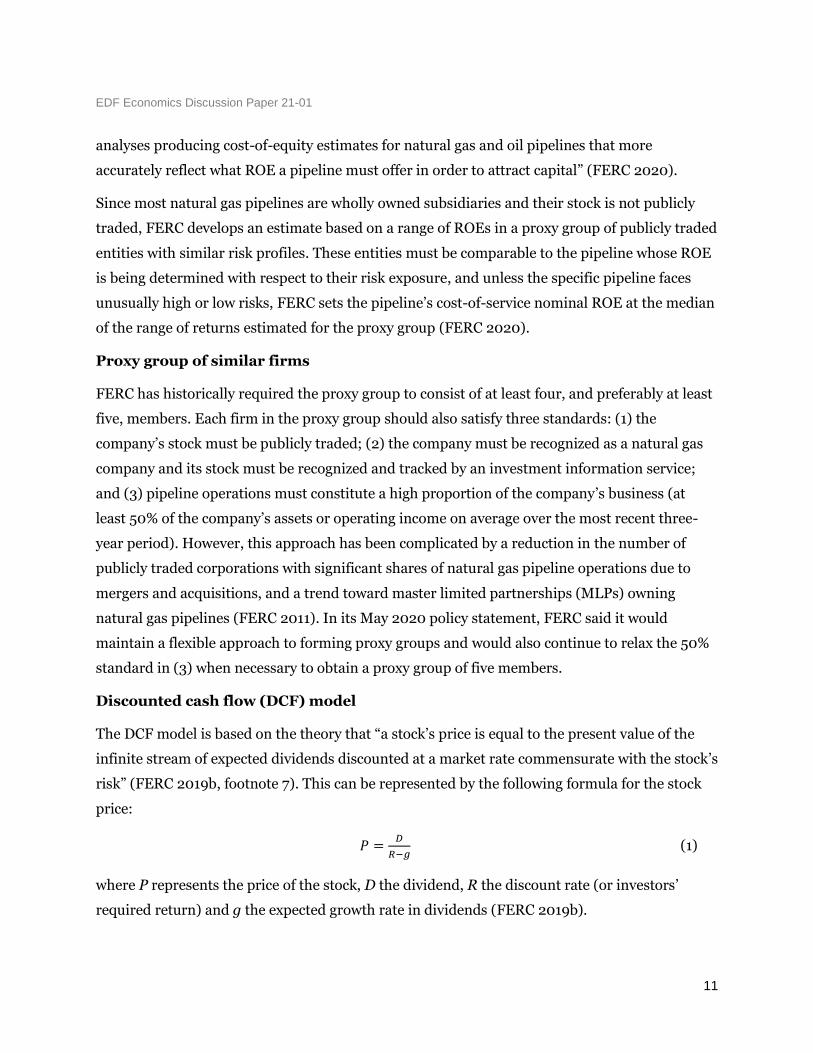
The DCF model is based on the theory that “a stock’s price is equal to the present value of the
infinite stream of expected dividends discounted at a market rate commensurate with the stock’s
risk” (FERC 2019b, footnote 7). This can be represented by the following formula for the stock
price:
𝑃 =𝐷
𝑅−𝑔 (1)
where P represents the price of the stock, D the dividend, R the discount rate (or investors’
required return) and g the expected growth rate in dividends (FERC 2019b).
The U.S. Gas Pipeline Transportation Market
12
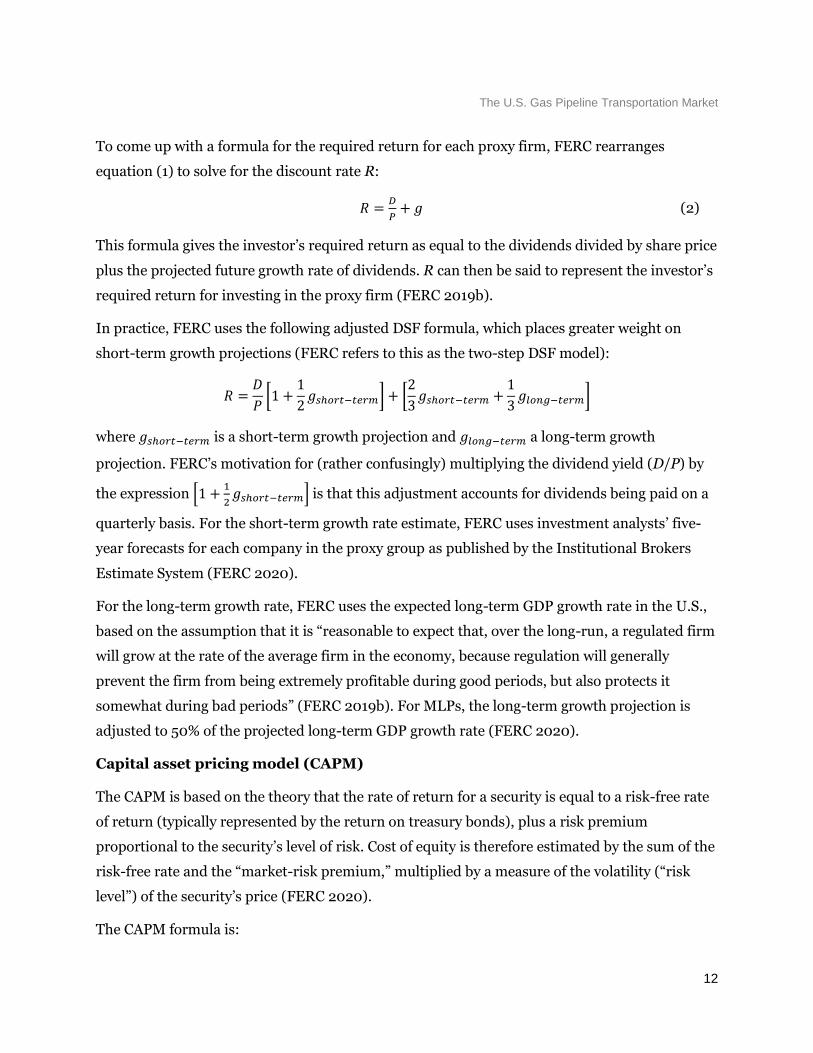
To come up with a formula for the required return for each proxy firm, FERC rearranges
equation (1) to solve for the discount rate R:
𝑅 =𝐷
𝑃+ 𝑔 (2)
This formula gives the investor’s required return as equal to the dividends divided by share price
plus the projected future growth rate of dividends. R can then be said to represent the investor’s
required return for investing in the proxy firm (FERC 2019b).
In practice, FERC uses the following adjusted DSF formula, which places greater weight on
short-term growth projections (FERC refers to this as the two-step DSF model):
𝑅 =𝐷
𝑃[1 +
1
2𝑔𝑠ℎ𝑜𝑟𝑡−𝑡𝑒𝑟𝑚] + [
2
3𝑔𝑠ℎ𝑜𝑟𝑡−𝑡𝑒𝑟𝑚 +
1
3𝑔𝑙𝑜𝑛𝑔−𝑡𝑒𝑟𝑚]
where 𝑔𝑠ℎ𝑜𝑟𝑡−𝑡𝑒𝑟𝑚 is a short-term growth projection and 𝑔𝑙𝑜𝑛𝑔−𝑡𝑒𝑟𝑚 a long-term growth
projection. FERC’s motivation for (rather confusingly) multiplying the dividend yield (D/P) by
the expression [1 +1
2𝑔𝑠ℎ𝑜𝑟𝑡−𝑡𝑒𝑟𝑚] is that this adjustment accounts for dividends being paid on a
quarterly basis. For the short-term growth rate estimate, FERC uses investment analysts’ five-
year forecasts for each company in the proxy group as published by the Institutional Brokers
Estimate System (FERC 2020).
For the long-term growth rate, FERC uses the expected long-term GDP growth rate in the U.S.,
based on the assumption that it is “reasonable to expect that, over the long-run, a regulated firm
will grow at the rate of the average firm in the economy, because regulation will generally
prevent the firm from being extremely profitable during good periods, but also protects it
somewhat during bad periods” (FERC 2019b). For MLPs, the long-term growth projection is
adjusted to 50% of the projected long-term GDP growth rate (FERC 2020).
Capital asset pricing model (CAPM)
The CAPM is based on the theory that the rate of return for a security is equal to a risk-free rate
of return (typically represented by the return on treasury bonds), plus a risk premium
proportional to the security’s level of risk. Cost of equity is therefore estimated by the sum of the
risk-free rate and the “market-risk premium,” multiplied by a measure of the volatility (“risk
level”) of the security’s price (FERC 2020).
The CAPM formula is:
EDF Economics Discussion Paper 21-01
13
𝑅 = 𝑟𝑓 + 𝛽[𝑟𝑚 − 𝑟𝑓]
where 𝑟𝑓 is the risk-free rate, 𝑟𝑚 is the expected market return and 𝛽 is a measure of the volatility
of the security compared to the rest of the market. The risk-free rate is typically represented by
the yield on 30-year U.S. Treasury bonds. The expected market return is, in a forward-looking
CAPM analysis, based on a DCF analysis — as previously described — but for a large segment of
the market, such as the dividend-paying companies in the S&P 500. Measures of the volatility,
𝛽, of a particular stock are published by several commercial sources (FERC 2020).
In its May 2020 policy statement, FERC determined that for the CAPM it would: “(1) use as the
risk-free rate, the 30-year U.S. Treasury average historical bond yield over a six-month period
corresponding as closely as possible to the six-month financial study period used to produce the
DCF study in the applicable proceeding; (2) estimate the expected market return using a
forward-looking approach based on a one-step DCF analysis of all dividend paying companies in
the S&P 500; and (3) exclude S&P 500 companies with growth rates that are negative or in
excess of 20%” (FERC 2020). For the value of the parameter 𝛽 in the CAPM formula, FERC
stated that it would use “Value Line” adjusted betas (see, e.g., Value Line [2020] for more
details).
It is not yet clear what FERC’s May 2020 policy statement and its decision to include the CAPM
in its methodology will mean for pipeline-regulated ROEs going forward compared to previous
practice. Nevertheless, FERC will also continue to rely on the two-step DSF model (albeit with
the same weight now given to both the DSF and the CAPM model), in which the GDP growth
rate is a weighted average across all U.S. productive sectors that individually have different
growth rate projections. While electric utilities are likely to see long-term growth in their
industry in light of new policy drivers pushing for electrification and decarbonization (perhaps
even at a rate higher than average GDP growth), it is not clear that the same long-term growth
rate is relevant for regulated gas assets.
Given projections for the future electrification of the heating sector and increasing shares of
renewables in the power sector, FERC and state public utility commissions may want to pass the
future demand risk from electrification and decarbonization trends to the pipeline companies.
One way to do this would be to make it clear that cost recovery for new capacity is not
The U.S. Gas Pipeline Transportation Market
14
guaranteed if future demand for their gas services falls short of projections.12 This would give
firms an incentive to actively manage the risks around future demand. There have also been
proposals to FERC to use its 1996 incentive ratemaking policy statement (FERC 1996) to
provide increased returns to pipelines that provide more flexible gas transportation services.
Jointly, such policy signals would incentivize the pipeline companies to improve their service
offerings through their existing assets rather than building new pipeline capacity.
2.2 Long-term gas transportation contracts
Buyers of firm pipeline capacity enter into multi-year contracts with a pipeline at the type of
FERC-regulated rates described in Section 2.1.2. Pipelines primarily offer firm and interruptible
service contracts. Firm service is offered on a guaranteed basis, with the pipeline warranting
service on every day of the contract unless prevented by an act of force majeure. The firm
capacity contract gives the holders (also known as “shippers”) the right to transport an agreed
daily quantity of gas. Shippers exercise their capacity rights by electronically submitting
“nominations” to the pipeline company on a daily basis (see Section 4.1). Additionally, pipelines
own or contract with storage facilities, and there are also independent storage facilities.13
In contrast, interruptible service contracts give the pipeline the option to cease the service with
short or no notice — e.g., if the capacity is required to serve a firm service customer. The
regulated charges for the lower-priority interruptible service contracts are lower than those for
the firm service (as described in Section 2.1.1).
Local gas distribution companies (LDCs or gas utilities) are typically the largest subscribers of
interstate pipeline capacity. In turn, LDCs provide gas to their retail residential, commercial and
industrial customers, and procure enough firm contract capacity from the interstate pipelines to
meet their peak retail customer demand. LDCs assume little financial risk by entering into these
long-term contracts, because as revenue-regulated utilities they are able to pass procurement
costs through to their ratepayers (as long as the state public utility commission has implemented
12 Interestingly, some pipelines are flagging this stranded asset risk in their rate case applications to FERC to motivate higher depreciation rates and thereby seek to increase their approved revenue requirement (see, e.g., WBI Energy Transmission, Inc. [2013, October 31]. Section 4 Rate case, Docket no. RP14-118, Exhibit no. WBI-110, page 35, lines 4–7; and Dominion Cove Point LNG. [2016, November 23]. Section 4 Rate case, Docket no. RP17-197, Exhibit no. DCP-0088, page 19, lines 17–22). 13 In general, gas storage plays an important role on the U.S. interstate pipeline system, but further discussion of storage is beyond the scope of this paper.
EDF Economics Discussion Paper 21-01
15
decoupling of utility revenues and sales volumes; otherwise, there is some risk for the utilities if
there is an unexpected reduction in customer gas demand). Other buyers of long-term interstate
pipeline capacity contracts include industrial facilities and gas marketers (Marks et al. 2017).
The process by which pipelines offer up gas transportation capacity on new or existing pipelines
is called open season. The pipeline typically notifies shippers of the availability of capacity by
posting an open season notice on its electronic bulletin board or website and allows shippers to
bid for the capacity. FERC requires the pipelines to award the capacity to the shippers that value
it the most, up to the maximum recourse rate (as determined by the cost-of-service method
described in Section 2.1.1). The value of the shippers’ bids is typically evaluated using the net
present value (NPV) method and is determined by the offered price, the volume of gas and the
duration of the contract. The shipper submitting the bid with the highest NPV receives the
capacity, and this principle applies until all the available capacity has been allocated (see, e.g.,
Federal Register [2011] and Jost and Benson [2016]).
A shipper that successfully bids for pipeline capacity in an open season will next negotiate a
precedent agreement (PA) with the pipeline. The PA includes specifics on the financial terms
under which the shipper is to purchase the capacity, the transportation path, volumes and terms
of service. When negotiating a PA, the pipeline will typically offer the shipper to take service at a
negotiated rate (which can take many forms). The shipper, however, always has the option to
elect service at the pipeline’s recourse rate (Jost and Benson 2016).
One of the requirements a company must meet to get approval from FERC to build a new
pipeline or expand a pipeline’s capacity is demonstration of what FERC calls “market need” for
the capacity expansion. Up until now, FERC has let market need be demonstrated by
documenting a sufficient number of firm contract signatories and quantities committing to
subscribe to the new pipeline capacity.14 This practice has been heavily criticized where both
pipeline developer and shipper are affiliated entities. The reason is the inherent risk-shifting in
such transactions, whereby pipeline developers stand to earn a return in excess of risk and
captive utility customers are levied with significant reservation costs regardless of whether their
gas utility actually uses the pipeline capacity.
14 See FERC (1999b) for the policy statement that guides its review of applications to build natural gas pipelines and associated infrastructure, and Tierney (2019) for a summary of the comments submitted in response to a notice of inquiry FERC has opened to consider changes to this policy.

The U.S. Gas Pipeline Transportation Market
16

EDF Economics Discussion Paper 21-01
17
3. The secondary market for gas transportation
Holders of long-term gas transportation contracts are allowed to sell temporary use of their
pipeline capacity on a secondary “capacity release market.” Secondary capacity release sales can
last anywhere from several hours to the total duration of the initial contract.15 Thus, firm
pipeline capacity purchased directly from a pipeline in the primary market can be sold by the
shipper in the secondary market for gas transportation, either in the long- to medium-term
capacity release market (with prices capped by FERC if the duration is longer than a year) or the
short-term gas spot market (without a price cap). Furthermore, pipeline operators are allowed
to sell or allocate unreserved capacity on an interruptible basis (and charge an associated
volumetric rate that is regulated by FERC). These policies are designed to promote a more liquid
market for gas transport and to allow pipeline operators to allocate scarce capacity efficiently.
(Section 3 is an amended version of market descriptions found in Marks et al. [2017]).
3.1 The gas spot market
There are many gas trading hubs on the interstate pipeline system, with secondary market
prices for different gas injection and gas delivery locations reflected in gas price indices for the
different trading hubs (see Section 5.2.). When FERC first decoupled gas transportation from
the gas commodity market in the 1990s and created a capacity release program, it was
concerned about insufficient competition in the secondary market and therefore instituted a rate
ceiling. FERC removed this ceiling for short-term capacity release transactions of one year or
less in 2008 with FERC Order 712 (FERC 2008). The motivation for this was that the rate
ceiling worked against the interests of short-term shippers, because a shipper who needed gas
deliveries on a peak day and was willing to offer a price above the rate ceiling was not legally
allowed to do so. Because the prices of primary contracts for capacity are regulated but short-
term capacity release and spot market prices are not (as a consequence of Order 712), the
holders of firm capacity contracts can extract congestion rents when capacity is scarce by selling
their gas transportation rights in the secondary market at prices above their own cost of using
them (Oliver et al. 2014).
15 See, e.g., Oliver and Mason (2018) and David and Percebois (2004) for further discussion of the U.S. capacity release market, but note that the David and Percebois discussion precedes the FERC ruling in 2008 that lifted the price cap on short-term capacity release sales.
The U.S. Gas Pipeline Transportation Market
18
In the spot market, gas transportation contracts are typically traded without the benefit of a
central exchange where bids and asks can be matched and settled for market-wide price
determination. Instead, it is a bilateral contract market, with private brokers and exchanges that
help buyers and sellers find willing and able counterparties and negotiate prices. Sales on the
gas spot market involve delivery to a specific pipeline node and typically rebundle the physical
commodity with the transportation service. Spot market prices therefore incorporate the
wellhead price of the gas, the cost of the pipeline capacity needed to transport it and the shadow
price of the pipeline capacity constraint. This shadow price captures the difference in gas prices
between the receipt and delivery points due to differences in available gas transportation
capacity when the pipeline is congested. In other words, it reflects the scarcity of available
pipeline capacity along the gas transportation route (Cremer et al. 2003) and is the source of the
congestion rents earned by primary firm contract holders when selling scarce transportation
capacity in the spot market.
3.2 Gas spot market participants
Most LDCs are both buyers and sellers of gas transportation capacity. Because they must hold
sufficient long-term primary contracts to provide reliable gas supply for their rate-paying end-
use customers, LDCs usually have excess pipeline capacity rights on most days of the year —
aside from the coldest winter days, with their peak gas-heating loads. LDCs can use that excess
capacity either to ship gas to the region and sell it on the spot market, or sell it directly on the
capacity release market. Furthermore, FERC regulations intended to ensure pipelines are fully
utilized require that pipeline operators sell any excess capacity (that is not scheduled by firm
contract holders) to interruptible contract holders who request access to that capacity (by means
of nominations to use it, as described in Section 4.1).
Merchant gas-fired generators purchase the vast majority of their gas on the spot market, on a
“delivered to their location” basis, because their gas delivery needs are typically much more
variable and less predictable than those of LDCs and therefore not well served by long-term
contracts. A mechant generator that has forward contracts to sell electricity may nevertheless
hedge the gas price risk by entering into gas supply contracts or futures that match the duration
and volume of its forward commitments to sell electricity.
EDF Economics Discussion Paper 21-01
19
Additionally, there are independent marketers who do not themselves use gas, but instead hold
long-term contracts in anticipation of profiting from short-run sales to pipeline users (primarily
gas-fired generators). These independent marketers hold long-term contracts either as a
principal directly with the pipeline, or as a replacement shipper under a long-term capacity
release transaction. Another set of spot market participants are asset managers, who act as
third-party agents and/or principals for firm contract holders such as LDCs.
3.3 Local distribution companies and the gas spot market
The LDCs forecast their customers’ aggregate daily gas demand16 and, based on those forecasts,
schedule their total daily gas deliveries on the interstate pipelines a day in advance according to
the terms in their long-term gas transportation contracts and the practices described in
Section 4. An LDC can sell on the spot market any excess pipeline capacity in their long-term
contracts that they do not need for servicing their customers. Investor-owned LDCs are
regulated by their respective state public utility commission. Like the interstate pipelines, they
are allowed to make a rate of return under cost-of-service regulation. The LDCs pass through to
their ratepayers the cost of their firm pipeline capacity contracts. When selling excess contracts
on the spot market, LDCs are subject to rules that limit their ability to profit from excess
contracts. These revenue-sharing rules are set by the respective public utility commission and
vary across states.17 In general, they require LDCs to return a certain percentage of revenues
from capacity release and spot market sales (sometimes referred to as non-firm margin sales) to
their ratepayers.
4. Pipeline operations and practices
This section, which is based on excerpts from Marks et al. (2017), describes the main operational
features of the pipeline capacity markets in terms of gas flow nominations and scheduling. In
addition, it details the imbalance penalties used to enforce contract stipulations and ensure
operational integrity and system safety.
16 For example, according to gas demand aggregation methods, as described in Vitullo et al. (2009). 17 Revenue-sharing rules sometimes also vary across firms within states.
The U.S. Gas Pipeline Transportation Market
20
4.1 Nominations and scheduling
Each contract for capacity gives the shipper holding it the right to use, on a daily basis, a certain
amount of space along the pipeline between one or more specifically listed receipt (intake)
points and one or more specifically listed delivery (outflow) points.18 To exercise this right, the
shipper must electronically submit a nomination to the pipeline company, stating the quantity of
gas they intend to move, where it will enter the pipeline and where it will exit. This capacity
scheduling process is carried out on a daily basis for each gas day, which runs from 9 a.m. until
9 a.m. the following day.19 Importantly, capacity is nominated not as a rate of flow, but rather as
a total quantity to be transported at a roughly constant rate over the course of the 24-hour gas
day. The precise rule for most contracts is that the total daily nominated gas volume must be
transported (“flowed”) over a period lasting from 16 to 24 hours.20
Nominations consist of an intake “receipt” point, an outflow “delivery” point, and a scheduled
daily quantity of gas to flow.21 To induce shippers to manage nominations and flows judiciously,
and not create significant system pressure imbalances, they are subject to imbalance penalties if
there are differences between their scheduled nominations and actual flows. These penalties are
more or less severe depending on the size and nature of the infraction, and are generally more
severe when there is less slack available in the system to compensate, as in winter. Imbalance
penalties are described further in Section 4.2.
Shippers must submit their initial nominations by the close of the timely cycle, which occurs at
1 p.m. the day before the gas day (i.e., 20 hours before the start of the gas delivery day), in order
to be given priority and guaranteed the capacity provided by their contracts.22
18 At least in theory, a contract for firm capacity should guarantee access such that the total quantity of firm capacity contracts across all firm customers on a given route should not exceed maximum transmission capacity. 19 The gas day and all associated scheduling times are in Central Time for all interstate pipelines to facilitate harmonization of the gas transportation industry across the U.S. 20 For example, a capacity owner holding 24,000 MMBtu would generally be entitled to flow 1,000–1,500 MMBtu per hour, as specifically set out in their service agreement. 21 Net a small percentage that is skimmed by the pipeline operator to power compression stations. 22 If shippers neglect to nominate by the timely cycle, the pipeline may use their contracted capacity to allow other shippers to move gas to other points on the pipeline that are not specifically allocated to them. These nominations — which are called secondary in-path, secondary out-of-path and interruptible nominations — are used by LDCs and independent marketers to sell gas on the wholesale market to generators located at other parts of the pipeline. On a day when the pipeline is fully scheduled, the shipper that did not nominate on time will be able to utilize pipeline capacity only if another shipper will adjust their nomination downward later in the scheduling period to free up some capacity.
EDF Economics Discussion Paper 21-01
21
Shippers can make adjustments to their nominations during the gas day. FERC requires
pipelines to offer a minimum of three intraday scheduling cycles, although some pipelines offer
more frequent scheduling opportunities. On some pipelines, the last intraday cycle generally
occurs a few hours before the end of the gas day and is commonly know as the cleanup cycle.
During this cycle, shippers match their scheduled nominations to their actual flows.
Most interstate pipelines allow schedule adjustments at just five specific times following the
initial timely cycle nomination: a late cycle in the evening the day before the gas day, three
intraday cycles during the gas day and a final cleanup cycle near the end of the gas day.
However, some interstate pipelines allow shippers to adjust their nominations on an hourly
basis over the 44-hour scheduling period, which begins with the timely cycle at 1 p.m. the day
before and concludes at 9 a.m. at the end of the gas day.
In addition to firm and interruptible service contracts, some pipelines offer no-notice contracts,
which are a form of legacy contract generally available only to LDCs.23 When combined with a
gas storage service contract, a no-notice contract can allow an LDC to adjust its scheduled flows
without prior notice, and to flow their total scheduled quantity of gas on an uneven hourly basis
and over a period of less than a full 24 hours.
If at any point during the gas day there is unused space on the pipeline after all holders of
primary and secondary capacity have made their nominations, the pipeline company can sell the
extra capacity as “interruptible” service, meaning the pipeline will stop the flow of gas if a
primary or secondary capacity holder increases their nomination. The schedule adjustments
made in the window between 6 a.m. and 8 a.m. at the end of the gas day represent shippers
matching the node’s final scheduled daily nomination to the quantity of gas that was actually
delivered to it, in what the industry refers to as the cleanup or true-up cycle. Beyond accurate
bookkeeping, this adjustment is necessary for shippers to avoid the accounting imbalance
penalties assessed for monthly deviations between scheduled and actual flows in excess of 5%
(see Section 4.2 for further details on imbalance penalties).
No-notice contracts are exempt from this requirement. For the most part, provided a non-zero nomination is submitted in the timely cycle, these contracts enable scheduled quantities to be adjusted at any time during the scheduling period with guaranteed approval. 23 At the request of LDCs, a requirement that interstate pipeline companies offer no-notice contracts was included in FERC Order 636, the policy that mandated the unbundling of gas transportation service from the physical commodity. The LDCs argued that no-notice contracts would be needed in the new market structure to ensure they could reliably serve unexpected fluctuations in demand.
The U.S. Gas Pipeline Transportation Market
22
Capacity cannot be double-booked, and the pipeline company manages nominations such that
the scheduled flows through any point on the pipeline do not exceed safe operating limits. Thus,
a negative adjustment in the cleanup cycle indicates capacity that was scheduled but not used to
ship gas to that node. When aggregate nominations reach the pipeline’s capacity constraint and
the negative schedule adjustment is not accompanied by a positive adjustment at another node,
the negative adjustment in the cleanup cycle corresponds to capacity that went unused across
the entire system for that gas day.
4.2 Pipeline imbalance penalties
To enforce contract stipulations, interstate pipeline companies charge two types of imbalance
penalties. These are important to ensure reliable pipeline operations, because if some shippers
draw gas from the pipeline in excess of their nomination, the pressure balance is affected and
other customers will not be able to draw the gas they had scheduled. Conversely, if shippers
inject more gas into the pipeline than they had scheduled (or inject the scheduled amount but
withdraw less), pipeline pressure may build to unsafe levels. Information on the penalty levels
for a pipeline can be found in the pipeline’s gas tariff, typically available on the pipeline
company’s website.
The severest type of imbalance penalty is called an operational flow order (OFO) imbalance
penalty, which is assessed when shippers cause a physical imbalance on the system on a day
when pipeline operations are at risk of running into critical constraints. The pipeline company
issues an OFO warning by electronically notifying all of its customers that the pipeline has
reached, or is about to reach, its capacity constraint on at least one bottleneck on the system
(usually a compressor station). On a congested day, this warning is usually sent out well before
the gas day starts, but it may be issued or updated during the gas day. For example, once an
OFO has been issued on the Algonquin pipeline (which serves New England), any shipper that
causes a physical imbalance in the system by withdrawing in excess of 2% more or less gas at
their delivery node than they had injected at their receipt node is served a penalty equal to three
times the Algonquin Citygate price multiplied by the quantity of the infraction (see Spectra
Energy 2020). This penalty is severe because causing a physical imbalance on the system can
lead to serious operational challenges on days when the pipeline is near its capacity constraint.
EDF Economics Discussion Paper 21-01
23
The second type of penalty is an accounting imbalance penalty, which is assessed symmetrically
for deviations in either direction between the quantity of gas the shipper had scheduled to flow
through the pipeline and the amount they actually flowed on an aggregate monthly basis. For
example, shippers on Algonquin are served a penalty that ranges from 1.1 to 1.5 times the
Algonquin Citygate price multiplied by the quantity of the infraction, with the scaling factor
increasing with the size of the infraction.24 This penalty is much less severe because infractions
do not affect the safety and reliability of the system. Nevertheless, it is still substantial —
especially for LDCs, which cannot pass any imbalance penalties they incur onto their ratepayers.
5. Where to find gas transportation market data
To facilitate new research and analysis, this section provides brief guidance on where to find
data on the U.S. natural gas transportation markets.
5.1 Pipeline tariffs and rates
The FERC-approved regulated pipeline rates relevant to the primary market are available on the
respective pipelines’ websites and described in detail in their gas tariffs, which also include
information on imbalance penalties. Some examples are given below:
Algonquin Gas Transmission Tariff
El Paso Natural Gas Tariff
Florida Gas Transmission Tariff
FERC also provides a database of different tariffs on its website (https://etariff.ferc.gov).
5.2 Spot market prices
The natural gas price at Henry Hub, in Erath, Louisiana, is the benchmark price for natural gas
traded in the U.S., including natural gas futures traded on the New York Mercantile Exchange,
24 To be specific, the penalty is 1.1 × PACG × Q for deviations between 5% and 10%, 1.2 × PACG × Q for 10–15%,
1.3 × PACG × Q for 15–20%, 1.4 × PACG ×Q for 20–25%, and 1.5 × PACG × Q for deviations in excess of 25%
(see Spectra Energy [2020, section 25]).
The U.S. Gas Pipeline Transportation Market
24
and is considered reflective of the commodity value without gas pipeline transportation costs.
Shale gas development in Texas, Pennsyvania, Ohio, and other parts of the country have also
increased the importance of other gas trading hubs.
The unregulated secondary market prices for different delivery locations on the interstate
pipeline system are reflected in gas price indices (bundled for both gas commodity and
transportation) for the different trading hubs. These are provided for day-ahead as well as
forward markets by data providers such as Intercontinental Exchange (ICE), Natural Gas
Intelligence and S&P Platts.
These indices are based on confidential survey data from market participants on their recent
transactions, and are aggregates for deliveries to or from certain segments of the pipeline as
detailed in the respective data provider’s methodology section. Prices from Friday trades
represent gas deliveries for Saturday, Sunday and Monday (as there is no trading on the
weekends). Posted Friday price indices are therefore an aggregate across all three days.
The day-ahead gas price indices therefore do not provide information for deliveries during
certain hours of the day or for a particular delivery point on the pipeline, and represent only the
aggregated prices for trades made the day before for delivery points along the relevant pipeline
segment. Thus, in the U.S. gas wholesale gas markets, there is no available price information
equivalent to the locational marginal prices (LMPs) in organized U.S. wholesale electricity
markets such as ISO-NE and PJM, which reflect sub-day demand, supply and transmission
constraints. Gas transportation markets therefore do not provide granular price information
that can indicate time- and location-specific capacity constraints and serve as a basis for robust
objective assessments of the need for new infrastructure investment, such as for new
compressor station capacity or local gas storage.
5.3 Gas quantities delivered (scheduled)
FERC mandates that the interstate pipelines provide data on daily scheduled quantities during
the previous three years on their electronic bulletin boards. Those data contain information on
the daily total quantities scheduled from each receipt point to each delivery point for each of the
FERC mandated scheduling cycles, and they specify the type of delivery point (i.e., LDC, power
plant, end user or storage) as well as the identity of the point operator (who manages actual gas
flows to the delivery point).
EDF Economics Discussion Paper 21-01
25
The pipeline companies themselves have access to more granular gas delivery data than these
daily quantities through their supervisory control and data acquisition (SCADA) systems, but
these data are proprietary and the pipelines are not required to make them public.25
5.4 Firm contract ownership
Data on firm contract ownership are available through index of customers reports, which
interstate pipelines are also required to make publicly accessible on their reporting websites for
the previous three years. These data can be also found on Form 549B — Index of Customers on
FERC’s website (https://www.ferc.gov).
5.5 Gas infrastructure data
Gas distribution systems have been designated as critical energy infrastructure information
(CEII), which makes it a challenge for the general public to retrieve information due to national
security restrictions. Nonetheless, some information on main interstate pipelines reported
capacity can be found in the following sources:
The Energy Information Adminstration provides monthly pipelines inflows, outflows
and capacity, by state and region (EIA 2020). EIA also provides maps of the interstate
pipeline network, with an associated online geographic information system database.
Some other data providers, such ICE and S&P Global Platts, have details of pipeline
point maximum capacity, scheduled volume, available capacity, utilization rate and
maps. The Pipeline and Hazardous Materials Safety Administration provides pipeline
mileage and facilities data, as well as a general public map that is available only by
county and at a large scale. However, detailed and granular information on node and
pipeline real capacity, which is derived from parameters such as compressors and
diameter, is not available.
FERC Form 567 contains specific information on the pipeline system, including pipeline
diameter, pressure and volume data, but access is restricted because natural gas pipeline flow
diagrams are protected under the security level of CEII. This form is a report containing pipeline
25 For an example of an analysis using hourly historical SCADA data from an actual — but small — part of the interstate pipeline system that an undisclosed pipeline company agreed to share, see Rudkevich et al. (2019).
The U.S. Gas Pipeline Transportation Market
26
cross-section diagrams by more than 100 interstate natural gas pipelines with system delivery
capacity in excess of 100 million cubic feet per day. These diagrams reflect operating conditions
of a company’s main transmission system during the previous 12 months. Companies are
required to submit five copies of this diagram, and can do it either on paper or by e-filing. This
implies that not all of the data are digital. Specific engineering and detailed design information
about pipeline facilities, components and equipment is limited. The requirements for the report
are very general (e.g., units, which dimensions should be reported, which labels should be
included, etc.). This lack of a standardardized reporting format hinders data analysis, as well as
consistent review and comparisons across pipeline companies.
6. Potential updates to the market design for gas transportation
This section provides a brief discussion of potential updates to the market design for U.S. gas
transportation from an economics standpoint and suggestions for further readings.26 It focuses
on market updates that could improve economic efficiency both in the short term (by enabling
additional trades such that limited pipeline capacity is more likely to be allocated to the uses of
highest value) and in the long term (by providing more granular price signals to facilitiate
improved assessment of the net social benefit of new gas infrastructure investments).
As described in Sections 3 and 4 (and further discussed in Carter et al. [2016] and MIT [2013]),
the pipeline market and operations are currently set up such that spot market clearing, flow
scheduling and planning of physical operations are conducted consecutively and separately
rather than being jointly coordinated. This arrangement makes optimization of the system and
its associated market challenging. Instead of being coordinated by the pipeline operator, day-
ahead trades of gas transmission capacity are conducted through bilateral agreements between
market participants who do not have the overview and information to account for relevant
operational constraints (Carter et al. 2016).27
This arrangement can be contrasted with the way in which nonprofit independent system
operators (ISOs) in restructured electricity markets, such as ISO-NE and PJM, clear the day-
26 For more of a regulatory and gas and electricity industry perspective on these issues, see, e.g., FERC Order 809 and related docket (FERC 2015). 27 Under current operational practices on interstate pipelines, pipeline operators may already have access to predicted hourly gas takes for their interconnected gas-fired power plants, but that information may nevertheless remain unused.
EDF Economics Discussion Paper 21-01
27
ahead market and solve a series of optimization problems to miminize the cost of serving
electricity load given bids from generator and load-serving entities, transmission capacity and
other operational constraints. The system operator thereby generates a jointly consistent
dispatch schedule and associated set of day-ahead LMPs. The associated real-time spot market
and prices (and ancillary service markets) then serve to adjust for deviations from day-ahead
forecasted conditions.28
To optimize the use of the pipeline system along similar lines to the arrangement in restructured
electricity markets, market and physical operations would need to be jointly coordinated and
pipeline operators (or another entity) tasked with solving optimization problems that would
generate day-ahead prices that account for forecasted next-day conditions. Real-time (hourly)
spot markets could then deal with readjustments of prices and flow schedules according to
deviations from forecasted conditions. Such a market design would determine hourly prices for
each given location on a pipeline network based on demand and the physical ability to deliver
gas there (Carter et al. 2016).
The Australian state of Victoria has such a gas market design, managed by the Australian Energy
Market Operator (AEMO), which also manages the Australian wholesale market for electricity.
In this market, AEMO simultaneously determines optimal gas dispatch and corresponding
LMPs based on a linear programming (LP) formulation (Read et al. 2012).29 According to Read
et al., however, this market has not fully exploited the potential of its market-clearing approach
due to its small size, degree of vertical integration and relative lack of congestion, and therefore
provides only limited evidence of its value.
To optimize the system (as also noted by Read et al. [2012] as a limitation of the LP
formulation), this type of day-ahead market-clearing mechanism would ideally take transient
gas flows into account due to the slow speed of gas relative to electricity flow. The high
nonlinearity and complexity of the associated optimization problem requires the use of so-called
transient optimization methods (Carter et al. 2016). A tool that implements such methods to
provide consistent gas market clearing, flow schedules and prices is the gas system optimizer
(GSO), which was deveveloped as part of the Gas-Electric Co-Optimization (GECO) project
28 For a rigorous discussion of market design in electricity markets, see, e.g., Wilson (2002). 29 Linear programming is a mathematical optimization method based on a linear objective function and linear constraints — i.e., based on making the (then often simplifying) assumption that the relevant mathematical relationships are linear.

The U.S. Gas Pipeline Transportation Market
28
funded by the U.S. Department of Energy’s Advanced Research Projects Agency — Energy
(ARPA-E) program. ARPA-E funded this project to “improve coordination of wholesale natural
gas and power operators both at the physical and market levels” and address current
inefficiencies by developing methods and a market mechanism that enable access to pipeline
capacity “on the basis of its economic value as determined by gas buyers and sellers” (ARPA-E
[2015]).30
The nature of the existing pipeline capacity property rights and the operational practices given
by the current market design likely create practical and political challenges to market reforms.
For example, one such challenge is confidentiality concerns with respect to the exchange of
proprietary data such as network data and customer information across different pipelines and
electric system operators (see Zhao et al. [2018]).
In effect, the U.S. pipeline capacity market is currently based on physical transmission rights,
which entitle the holder to use the pipeline capacity as stipulated by the contract. This can be
contrasted with the financial electricity transmission rights in the markets operated by
nonprofit electricity system ISOs, which instead entitle the holder to a share of the congestion
rents as given by the differences in LMPs between transmission nodes (for more details, see
Joskow and Tirole [2000]).
Implementing a day-ahead and real-time gas spot market similar to the restructured electricity
markets would likely require the type of capacity release program and redefinition of property
rights as described by Joskow and Tirole (2000, pp. 466–468) for electric power networks.
Applying this design to the gas transmission context, the existing bilateral market for gas
transportation would remain for all trades negotiated at any point in time (a year ahead, a week
ahead, etc.) before the day ahead of delivery and the associated physical rights and flow
schedules registered with the pipeline operator. The day before delivery, however, any
unscheduled remaining capacity would turn into financial rights, which the pipeline operator (or
another entity) would auction to the highest bidder in day-ahead and real-time spot markets, as
in the restructured electricity markets. The owner of the pipeline capacity could still be awarded
the value of the congestion rents in the real-time market under what Joskow and Tirole (2000)
refer to as the “use-it-or-get-paid-for-it” rule.
30 The GECO project ran between 2016 and 2019. For further details, see ARPA-E (2015).
EDF Economics Discussion Paper 21-01
29
However, there is a challenging institutional mismatch between the gas transportation industry
(with long private pipelines crossing many states) and its by now largest customer, the electric
power industry (with multiple ISOs that organize wholesale electricity markets for more
compact geographies, but also large areas of the country — e.g. the Southeast — that have no
electric market ISOs). In this context, it is not clear what a gas ISO would look like in the U.S.
and whether such an entity could coordinate day-ahead and real-time markets on pipelines
belonging to several different pipeline companies (P. L. Joskow, pers. comm., November 2020).
Given the challenge of redefining markets and existing property rights,31 researchers have
proposed alternative market designs that can work within the constraints given by current
market and contract structures (but that would nevertheless require substantial changes to the
responsibilities of the U.S. interstate pipeline operators). Specifically focusing on improving the
efficiency of the gas–electric market intersection, Zhao et al. (2018) proposed a market-based
mechanism designed to efficiently coordinate the gas and electric systems day ahead and
maximize the economic value of the gas delivered to gas-fired generators, while also serving
other sources of gas demand. Importantly, their proposal does not require the exchange of
proprietary information between natural gas and electricity system operators, which would
otherwise be a key constraint for actual implementation, since electric system operators do not
transact directly with the interstate pipelines and would therefore not be at liberty to share such
information.
Another mechanism that aims to maximize the value of existing pipeline capacity and enable
gas-fired generators to schedule gas deliveries according to their time-varying demand for gas is
outlined in Rudkevich et al. (2018). Based on the GSO, this intraday market mechanism for
coordinated gas scheduling (developed as part of the GECO project) would enable beneficial
real-time trades in the secondary gas market while being compatible with current contract and
capacity ownership structures.
Although they do not provide the equivalent of electricity market LMPs in the way more
comprehensive market reforms would, these latter two market mechanisms would still generate
more granular gas price signals that could provide more detailed information. In turn, this more
31 As another illustration of these challenges and potential opposition from current property rights holders, a proposal to the North American Energy Standards Board to introduce a standard for how a primary customer under existing contract structures could submit nominations to the pipeline for each hour of the day (rather than the current arrangement based on nominations of daily total gas volume) was rejected due to opposition from one of the voting industry segments.

The U.S. Gas Pipeline Transportation Market
30
detailed information would allow better assessment of the value of proposed investment in new
gas transmission assets (e.g., in compressor stations or liquefied natural gas [LNG] storage that
can increase the pipeline’s ability to deal with gas-fired generator ramping requirements and
associated pressure deviations).
7. Integrated gas–electric energy system models
Considering the importance of the intersection between the gas transportation and electricity
markets for the U.S. energy transition, there is a relative paucity of energy modeling frameworks
formulated in a way that makes it possible to analyze the relevant interactions and
interdependencies between the sectors. This section briefly describes some of the few existing
modeling frameworks that include a detailed representation of both the gas and electric markets
and that could be used for future integrated analysis of the intersection between the two.32
A more granular representation of the power system and associated gas system as offered by
some — but not all — of these models is needed for many investment planning decisions related
to integrating large shares of variable renewable resources. Essentially, such integration
planning requires models able to take into account when and where wind and solar electricity
can be expected to be available (given associated probability distributions), and what flexible
resources such as gas-fired generation capacity (potentially with CCS), transmission and storage
will be required to address the variability and associated uncertainty and ensure a reliable
electricity supply.
EIA’s economy-wide National Energy Modeling System (NEMS) framework includes the
Natural Gas Market Module (NGMM), which represents the North American natural gas
transmission and distribution system and was first incorporated into the NEMS framework for
the Annual Energy Outlook 2018. The NGMM optimizes welfare subject to a number of gas
system constraints, and thus solves for production, flows and prices of natural gas at the state
level for the U.S. pipeline network and at the regional level for the Canadian and Mexican
pipeline networks for all months in the model year. The NGMM also solves for gas used for
liquefaction, LNG export capacity new builds and pipeline capacity expansions. The NGMM
currently does not include gas demand curves and instead holds gas consumption from each
32 For details on dedicated gas market models, see the EIA (2014) review of natural gas models.
EDF Economics Discussion Paper 21-01
31
sector (residential, commercial and industrial, and the power sector) constant in each iteration.
Gas consumption from the power sector derives from the NEMS Electricity Market Module,
which solves for consumption by North American Electric Reliability Corporation regions and
three seasons in each year, and is then disaggregated to the state and monthly representation
required by NGMM (EIA 2018).
An open-source model framework specifically focused on optimizing flows and capacity
expansions between the gas and electricity sectors is the simultaneous steady-state natural gas
and electric power network optimization framework developed at Los Alamos National
Laboratory and available on Github for use by other researchers (Bent and Sundar 2020). An
example of this framework, applied and calibrated to the U.S. Northeast, can be found in Bent et
al. (2018).
A gas market module is also being developed for pairing with the open-source power system
modeling framework Switch 2.0, which has been specifically developed for planning transitions
to low-emission electric power systems and provides granular representation of variable
renewable technologies (see Johnston et al. 2019). A U.S.-wide version of Switch 2.0 is being
developed at the University of Hawai’i, and will be calibrated to correspond to the
Environmental Protection Agency’s Integrated Planning Model of the U.S. power system.
The Joint Institute for Strategic Energy Analysis has developed a modeling platform that is not
an optimization model but instead is more focused on representing the potential for improved
coordination between gas and electricity systems . This “cooperation” platform pairs the
PLEXOS unit commitment and economic electricity dispatch model with the SAInt simulation
model of gas network flows. The platform and findings from three studies based on this model
on coordination of gas and electric system operations are presented in Guerra et al. (2020).
Planning models such as NGMM and Switch 2.0 focus on predicting optimal capacity expansion
for long-term energy infrastructure planning. For mathematical tractability, such models often
have coarser time resolution and abstract away from some of the physical constraints relevant to
the short-term operation of the pipeline systems and associated gas flows. A model that provides
a more granular and sophisticated representation of those constraints, and that is more focused
on optimizing short-term operations of existing gas pipeline capacity, is the GSO developed as
part of the GECO project. An application of the (transient optimization) GSO model and the
The U.S. Gas Pipeline Transportation Market
32
intraday gas balancing market mechanism (described in Section 6) it is designed to represent
can be found in Rudkevich et al. (2019).
For long-term energy infrastructure planning, energy system model resolution such as sub-day
and daily resolution are important so that the uncertainty and variability associated with
variable renewable resources is taken into account. Modeling needs to include appropriate
sampling approaches to represent the probability distributions for resource availability across
hours, seasons and years, and associated flexibility and storage needs. These models should also
be able to represent a responsive and flexible demand side — especially as more of the heating
sector is electrified and offers opportunities for demand-side management.
Another priority for strengthening modeling of decarbonization pathways in U.S. power system
models is creating mutually consistent scenarios for future electricity load and gas supply
capacity. This is important because electrification will lead to both higher levels of aggregate
electricity demand and potential changes in its load shape, as well as decreases in gas-heating
demand (from the residential, commercial and industrial sectors), with associated increases in
the availability of gas transportation capacity for the power sector. Thus, creating consistent
electrification scenarios for future electricity demand and gas supply availability for gas-fired
generators is important for robust analyses of decarbonization pathways for the U.S. power
sector. One potential framework for creating such scenarios is Tools for Energy Model
Optimization and Analysis (Temoa) and the Open Energy Outlook (OEO) project. The OEO is
intended to complement NEMS and the EIA’s Annual Energy Outlook, and is focused on
examining technology and policy pathways to achieve deep decarbonization in the U.S. using
open-source tools and data.
8. Areas for future research and analysis
The objective of this paper has been to facilitate and stimulate new research and analysis into
how to improve the design, regulation and operation of the U.S. gas transportation market in the
context of the ongoing energy transition and decarbonization of the U.S. energy system. Such
studies would be valuable for providing new insights and decision support to policy makers and
energy market regulators, as well as electric and gas industry players and other stakeholders.
The intersection between the gas and electricity markets is ripe with interesting research
questions; this section outlines just a few of these, categorized by topic.
EDF Economics Discussion Paper 21-01
33
More flexible and granular gas transportation markets and their value
Exploring alternatives to the current market design for gas transportation that will be better able
to deal with the current and future needs of gas-fired generators is an important avenue for
research. Analysis of whether more granular scheduling (e.g., based on hourly rather than daily
total quantities) and primary contracts with more sophisticated rate designs could significantly
improve efficiency in the primary market would be valuable. For the secondary market, it would
be useful to have larger-scale evaluation of the potential welfare gains from a centrally cleared
intraday market mechanism (e.g., the mechanism outlined by Rudkevich et al. [2018]) that
enables additional trades in the secondary market and can improve capacity utilization on
pipelines with delivery constraints. Another question of interest is how different ownership
structures for gas-fired generators (e.g., merchant versus cost-of-service regulated entities)
affect their willingness to enter into long-term firm gas transportation contracts under both
existing and potential new primary contract designs.
Importantly, what are the distributional implications of these potential reforms? How would
they impact costs to gas-fired generators and to consumers, as well as the ability of pipeline
companies to recover costs and earn a return despite trends toward declining gas demand? A
related outstanding question is how to design revenue incentive mechanisms to reward the
pipeline companies for providing flexible delivery services in both primary and secondary
markets and/or change their operations to manage a centrally cleared intraday market.33
Financial returns from gas pipelines
Relevant research questions in financial economics include how the regulated returns for the
natural gas pipeline industry compare to returns from other industries; what rate of return is
implied by competitively bid projects that fall below the allowed regulated rate of return
backstop; how FERC’s new ROE policy, which now includes the CAPM in addition to its
previous reliance on the DCF model, will affect the pipeline ROEs; how pipeline rates of return
relate to regulatory risk given trends toward future electrification of the heating sector; and if (or
to what extent) the regulated rates of return of the pipeline companies hinder efficient use (and
retirement) of gas transmission assets.
33 See also the related discussion on incentive-based regulation in Oliver and Mason (2018).
The U.S. Gas Pipeline Transportation Market
34
Stranded gas assets
Electrification also opens up questions about how the pipeline companies will deal with any
unrecovered costs of existing pipeline capacity. Widespread switching from gas heating in the
residential and commercial sectors would, for the interstate pipelines, result in significant
reductions in long-term firm contracts with local gas utilities. Could such costs be partially
recovered through introducing new primary contracts for pipeline capacity that are more
attractive to gas-fired generators (e.g., contracts with more sophisticated rate designs)? Could
they be at least partially shouldered by the pipeline companies themselves? And/or could they
be recovered with increased rates for industry and other remaining users of the interstate
pipelines? What are the potential distributional and welfare impacts of these alternatives?
And what incentives should be provided to ensure pipelines companies still invest in
monitoring, upgrades and necessary replacements throughout the energy transition to maintain
system reliability and safety, as well as addressing methane emissions from leaky and
malfunctioning equipment?
LNG demand
How will the expansion of the international LNG market continue to impact the economics of
U.S. gas pipelines and their regional markets? How could LNG export demand be impacted by
new climate and energy policy initiatives in key export markets and how are such developments
incorporated into the financial assessments of existing and proposed U.S. LNG export capacity?
Potential for hydrogen gas transportation
What is the potential to upgrade the U.S. interstate pipeline system to be compatible for
hydrogen transportation? What role can hydrogen play in U.S. decarbonization efforts? How
could a hydrogen market be created and which parts of the pipeline network would it be
beneficial to transform given potential centers of hydrogen supply and demand? How could
such a transition be financed and incentivized? How should a potential hydrogen transportation
market be designed to best benefit public welfare? Are there fundamental differences compared
to how one would ideally design a natural gas transportation market?
Answers to these questions would be valuable for informing policy and regulatory discussions on
the future role of the gas pipeline industry, how to regulate it for cost-effective decarbonization
of the U.S. energy system and how to deal with related distributional impacts.

EDF Economics Discussion Paper 21-01
35
The U.S. Gas Pipeline Transportation Market
36
References
AGA (American Gas Association). (2011). Ratemaking for energy pipelines. American Gas Association.
https://www.phmsa.dot.gov/sites/phmsa.dot.gov/files/docs/Ratemaking%20for%20Energy%20Pipelines%200
71111.pdf
Alvarez, R. A., Pacala, S. W., Winebrake, J. J., Chameides, W. L. and Hamburg, S. P. (2012). Greater focus needed on
methane leakage from natural gas infrastructure. Proceedings of the National Academy of Sciences, 109(17),
6435–6440.
Alvarez, R. A., Zavala-Araiza, D., Lyon, D. R., Allen, D. T., Barkley, Z. R., Brandt, A. R. … Hamburg, S. P. (2018).
Assessment of methane emissions from the US oil and gas supply chain. Science, 361(6398), 186–188.
ARPA-E (Advanced Research Projects Agency — Energy). (2015, November 23). Newton Energy Group: Gas-Electric
Co-Optimization. https://arpa-e.energy.gov/technologies/projects/gas-electric-co-optimization
Bent, R., Blumsack, S., Van Hentenryck, P., Borraz-Sanchez, C. and Shahriari, M. (2018). Joint electricity and natural
gas transmission planning with endogenous market feedbacks. IEEE Transactions on Power Systems, 33(6),
6397–6409.
Bent, R. and Sundar, K. (2020). GasPowerModels.jl. https://github.com/lanl-ansi/GasPowerModels.jl
Carter, R., Zlotnik, A. V., Backhaus, S. N., Chertkov, M., Daniels, A., Hollis, A. and Giacomoni, A. (2016). Impact of
regulatory change to coordinate gas pipelines and power systems (No. LA-UR-16-23168). Los Alamos National
Laboratory.
Cremer, H., Gasmi, F. and Laffont, J.-J. (2003). Access to pipelines in competitive gas markets. Journal of
Regulatory Economics, 24(1), 5–33.
David, L. and Percebois, J. (2004). Access pricing on gas networks and capacity release markets: Lessons from North
American and European experiences. Energy Studies Review, 12(2), 125–142.
Davis, R. (2007). Group Exercise I: Calculating the Revenue Requirement.
https://pubs.naruc.org/pub.cfm?id=5376DE70-2354-D714-51BA-736C233E4185
EIA (Energy Information Administration). (2014). Review of natural gas models. Energy Information
Administration.
https://www.eia.gov/outlooks/documentation/workshops/pdf/Review%20of%20Natural%20Gas%20Models.pd
f
EIA (Energy Information Administration). (2018). Natural Gas Market Module of the National Energy Modeling
System: Model documentation 2018. Energy Information Administration.
https://www.eia.gov/outlooks/aeo/nems/documentation/ngmm/pdf/ngmm(2018).pdf
EIA (Energy Information Administration). (2020). Natural gas: Data. https://www.eia.gov/naturalgas/data.php
Federal Register. (1996). Alternatives to traditional cost-of-service ratemaking for natural gas pipelines and
regulation of negotiated transportation services of natural gas pipelines; statement of policy and request for

EDF Economics Discussion Paper 21-01
37
comments. Federal Register, 61(26), 4633–4645. https://www.govinfo.gov/content/pkg/FR-1996-02-
07/pdf/96-2547.pdf
Federal Register. (2011). Bidding by affiliates in open seasons for pipeline capacity. Federal Register, 76(226),
72301–72302. https://www.govinfo.gov/content/pkg/FR-2011-11-23/pdf/2011-30115.pdf
FERC (Federal Energy Regulatory Commission). (1996). Alternatives to traditional cost-of-service ratemaking for
natural gas pipelines (incentive ratemaking policy statement, 74 FERC ¶ 61,076). Federal Energy Regulatory
Commission.
https://www.federalregister.gov/documents/1996/02/07/96-2547/alternatives-to-traditional-cost-of-service-
ratemaking-for-natural-gas-pipelines-and-regulation-of
FERC (Federal Energy Regulatory Commission). (1999a). Cost-of-service rates manual [for natural gas pipelines].
Federal Energy Regulatory Commission
https://cms.ferc.gov/sites/default/files/2020-04/cost-of-service-manual.doc
FERC (Federal Energy Regulatory Commission). (1999b). Statement of policy, certification of new interstate natural
gas pipeline facilities (Docket no. PL99-3-000; 88 FERC ¶ 61,227). Federal Energy Regulatory Commission.
https://www.ferc.gov/sites/default/files/2020-04/PL99-3-000.pdf
FERC (Federal Energy Regulatory Commission). (2008). Promotion of a more efficient capacity release market
(Order 712). Federal Energy Regulatory Commission.
https://www.federalregister.gov/documents/2008/06/30/E8-14444/promotion-of-a-more-efficient-capacity-
release-market
FERC (Federal Energy Regulatory Commission). (2011). Order and opinion on initial decision. Portland Natural Gas
Transmission System (Opinion no. 510; Docket no. RP08-306-000). Federal Energy Regulatory Commission.
https://www.federalregister.gov/d/2011-18020/p-32
FERC (Federal Energy Regulatory Commission). (2015). Coordination of the scheduling processes of interstate
natural gas pipelines and public utilities (Order no. 809; Final rule). Federal Energy Regulatory Commission.
https://www.federalregister.gov/documents/2015/08/06/2015-19292/coordination-of-the-scheduling-
processes-of-interstate-natural-gas-pipelines-and-public-utilities
FERC (Federal Energy Regulatory Commission). (2018). Interstate and intrastate natural gas pipelines; rate changes
relating to federal income tax rate. American Forest and Paper Association (Order no. 849, 164 FERC ¶ 61,031).
https://www.ferc.gov/sites/default/files/2020-04/final-rule-order-849.pdf
FERC (Federal Energy Regulatory Commission). (2019a, April). Cost-of-service rate filings.
https://www.ferc.gov/industries-data/natural-gas/overview/general-information/cost-service-rate-filings
FERC (Federal Energy Regulatory Commission). (2019b). Inquiry regarding the commission’s policy for
determining return on equity (Notice of inquiry, Docket no. PL19-4-000).
The U.S. Gas Pipeline Transportation Market
38
https://www.federalregister.gov/documents/2019/03/28/2019-05893/inquiry-regarding-the-commissions-
policy-for-determining-return-on-equity
FERC (Federal Energy Regulatory Commission). (2020). Policy statement on determining return on equity for
natural gas and oil pipelines (Docket no. PL19-4-000). Federal Energy Regulatory Commission.
https://www.federalregister.gov/documents/2020/05/27/2020-11406/inquiry-regarding-the-commissions-
policy-for-determining-return-on-equity
GAO (General Accounting Office). (1993). Natural gas: Costs, benefits, and concerns related to FERC’s Order 636.
General Accounting Office.
https://www.gao.gov/products/RCED-94-11
Guerra, O. J., Sergi, B., Hodge, B.-M., Craig, M., Pambour, K. A., Sopgwi, R. T. and Brancucci, C. (2020, September).
Electric power grid and natural gas network operations and coordination (Technical Report NREL/TP-6A50-
77096). Joint Institute for Strategic Energy Analysis.
INGAA (Interstate Natural Gas Association of America). (2019, May 7). The role of natural gas in the transition to a
lower-carbon economy. Black and Veatch.
Johnston, J., Henriquez-Auba, R., Maluenda, B. and Fripp, M. (2019). Switch 2.0: A modern platform for planning
high-renewable power systems. SoftwareX, 10, 100251.
Joskow, P. L. and Tirole, J. (2000). Transmission rights and market power on electric power networks. Rand Journal
of Economics, 31(3), 450–487.
Jost, B. S. and Benson, G. S. (2016). Securing new pipeline capacity in today’s turbulent gas market: Best practices
and things to know. Davis Wright Tremaine LLP.
Lazard. (2020, October 2). Levelized cost of energy analysis. Version 14.0.
https://www.lazard.com/perspective/levelized-cost-of-energy-and-levelized-cost-of-storage-2020
Marks, L., Mason, C. F., Mohlin, K. and Zaragoza-Watkins, M. (2017, October). Vertical market power in
interconnected natural gas and electricity markets (CESifo Working Paper No. 6687). Center for Economic
Studies, ifo Institute.
MIT (Massachusetts Institute of Technology). (2013). Report from growing concerns, possible solutions: The
interdependency of natural gas and electricity systems. An MIT Energy Initiative Symposium held on April 16,
2013. http://energy.mit.edu/publication/growing-concerns-possible-solutions
Oliver, M. and Mason, C. F. (2018). Interstate gas pipeline regulation in the United States — past, present and future.
Foundations and Trends in Microeconomics, 11(4), 227–288.
Oliver, M. E., Mason, C. F. and Finnoff, D. (2014). Pipeline congestion and basis differentials. Journal of Regulatory
Economics, 46(3), 261–291.
EDF Economics Discussion Paper 21-01
39
Read, E. G., Ring, B. J., Starkey, S. R. and Pepper, W. (2012). An LP based market design for natural gas. In A.
Sorokin, S. Rebennack, P. Pardalos, N. A. Iliadis and M. V. F. Pereira (Eds.), Handbook of networks in power
systems II (pp. 77–113). Springer.
Rudkevich, A., Zlotnik, A., Li, X., Ruiz, P., Beylin, A., Goldis, J. … and Philbrick, R. (2019). Evaluating benefits of
rolling horizon model predictive control for intraday scheduling of a natural gas pipeline market. In Proceedings
of the 52nd Hawaii International Conference on System Sciences, Grand Wailea, Maui, Hawaii, January 8–11,
2019. http://hdl.handle.net/10125/59799
Rudkevich, A., Zlotnik, A., Ruiz, P., Goldis, E., Tabors, R. D., Hornby, R. … and Philbrick, R. (2018). Market based
intraday coordination of electric and natural gas system operation. In Proceedings of the 51st Hawaii
International Conference on System Sciences, Hilton Waikoloa Village, Hawaii, January 3–6, 2018 (pp. 1–10).
https://aisel.aisnet.org/hicss-51/es/markets/6
Schmalensee, R. (1989). An expository note on depreciation and profitability under rate-of-return regulation. Journal
of Regulatory Economics, 1(3), 293–298.
Spectra Energy. (2020). FERC gas tariff of Algonquin Gas Transmission, LLC. Sixth revised volume, no. 1. Version
6.0.0, Section 26.8.
https://infopost.spectraenergy.com/regulatory/tariff/AGTVolumeNo1GTC.pdf
Tierney, S. (2019). FERC’s certification of new interstate natural gas facilities: Revising the 1999 policy statement
for 21st century conditions. Analysis Group. https://www.analysisgroup.com/Insights/publishing/fercs-
certification-of-new-interstate-natural-gas-facilities-revising-the-1999-policy-statement-for-21st-century-
conditions
Troutman Pepper. (2019). FERC initiates NGA Section 5 investigations into three gas pipelines’ rates, terminates nine
other proceedings in response to Form 501-G filings. Washington Energy Report blog.
https://www.lexology.com/library/detail.aspx?g=e823b955-c4db-4c33-8594-52f021f29292
U.S. Supreme Court. (1944). FPC v. Hope Natural Gas Co., 320 U.S. 591.
Value Line. (2020). Complete overview: The Value Line Investment Survey. Value Line.
http://www3.valueline.com/pdf/The_Complete_Overview_of_the_Value_Line_Investment_Survey.pdf
Vitullo, S., Brown, R. H, Corliss, G. F. and Marx, B. M. (2009). Mathematical models for natural gas forecasting.
Canadian Applied Mathematics Quarterly, 17(4), 807–827.
Weiss, J., Levine, S., Sergici, S., Thapa, A. and Grausz, L. (2018). Demand response for natural gas distribution:
Opportunities and challenges. PowerPoint presentation.The Brattle Group.
http://files.brattle.com/files/13929_demand_response_for_natural_gas_distribution.pdf
Wilson, R. (2002). Architecture of power markets. Econometrica, 70(4), 1299–1340.
Zhao, B., Zlotnik, A. Conejo, A. J., Sioshansi, R. and Rudkevich, A. M. (2018). Shadow price-based co-ordination of
natural gas and electric power systems. IEEE Transactions on Power Systems, 34(3), 1942–1954.

The U.S. Gas Pipeline Transportation Market
40
EDF Economics Discussion Paper 21-01
41
Appendix. An illustration of pipeline capacity utilization patterns
As described in Section 5, gas delivery quantities and spot prices are currently availabe only at a
daily resolution, which makes assessments of actual pipeline utilization patterns and the specific
timing of potential capacity constraints challenging. Anectodal evidence from gas market
experts indicates that in some places pipeline delivery constraints may be binding for only a few
hours during the peak day of the year. However, the lack of transparency and granular data in
the pipeline capacity markets makes it difficult to evaluate such claims, much less provide
proposals for how to best manage perceived pipeline capacity constraints — be it through the
fairly new concept of gas demand response programs (see, e.g., Weiss et al. [2018]), or more
traditional investment in strategically placed LNG storage facilities or new compressor capacity.
For an illustration of current pipeline capacity utilization and why there may be potential for
improvement (e.g., through implementing one of the market reforms discussed in Section 6),
Figure 1 provides a stylized picture of aggregate LDC gas loads during a winter day. Figure 2
similarly shows an aggregate gas load pattern from the power sector derived from the electricity
generation patterns of gas-fired generators.
Figure 3 combines Figures 1 and 2 to illustrate a hypothetical total aggregate gas load pattern for
an interstate pipeline by combining the hourly LDC and power sector gas loads (in this example,
potential gas loads from large industry with their own primary gas contracts are disregarded).
Assuming a pipeline with a capacity constraint of 70,000 MMBtu per hour, Figure 3 indicates
that pipeline capacity utilization is very close to maximum capacity at 8 a.m. and 7 p.m. In other
words, these are the hours of the day when gas delivery capacity is the most valuable. Had there
been a transparent market for pipeline capacity in which firm contract holders such as LDCs
could sell any excess capacity to gas-fired generators, these are the hours during which the gas
spot price would be highest.
However, since the gas transportation markets are so opaque and do not provide data on hourly
usage patterns and prices, there is no way of knowing the extent to which such trades actually
take place. Because secondary gas market trades take place bilaterally without the benefit of a
central exchange where bids and asks can be matched and the scheduling of pipeline capacity
coordinated centrally according to how the market clears, it is fairly likely that quite a few
mutually beneficial trades do not happen under the current market design. A market
mechanism like the one outlined by Rudkevich et al. (2018) would likely lower transaction costs
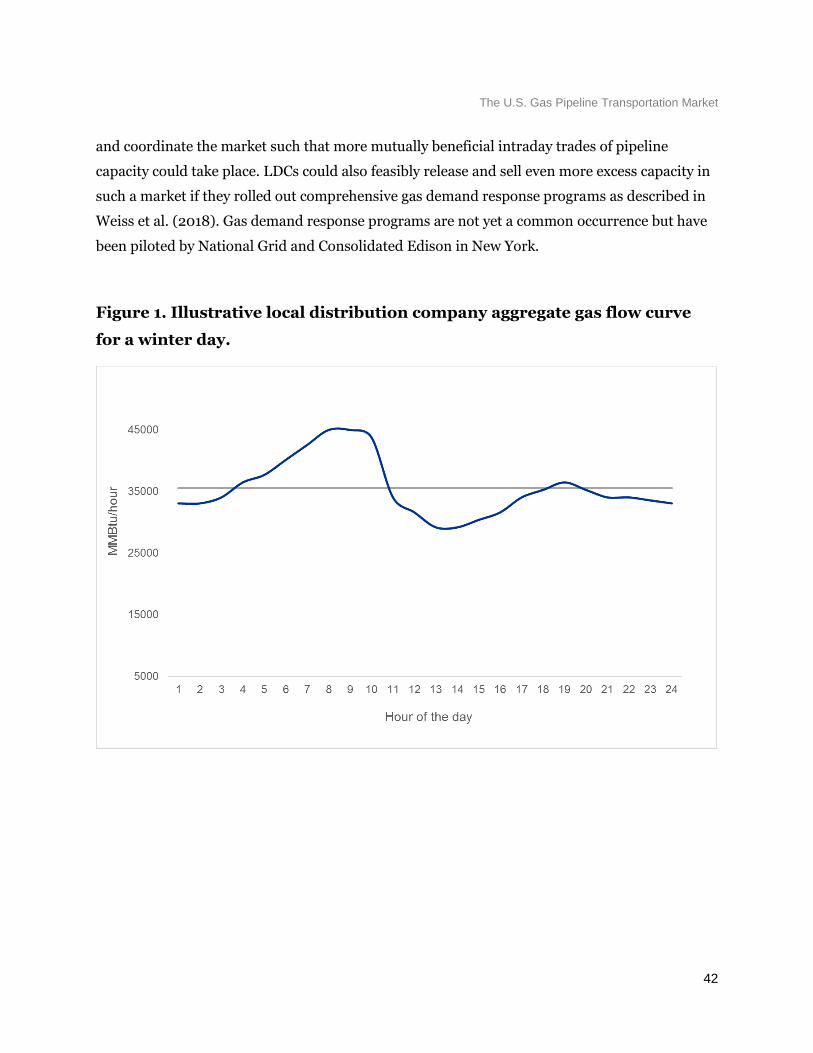
The U.S. Gas Pipeline Transportation Market
42
and coordinate the market such that more mutually beneficial intraday trades of pipeline
capacity could take place. LDCs could also feasibly release and sell even more excess capacity in
such a market if they rolled out comprehensive gas demand response programs as described in
Weiss et al. (2018). Gas demand response programs are not yet a common occurrence but have
been piloted by National Grid and Consolidated Edison in New York.
Figure 1. Illustrative local distribution company aggregate gas flow curve
for a winter day.
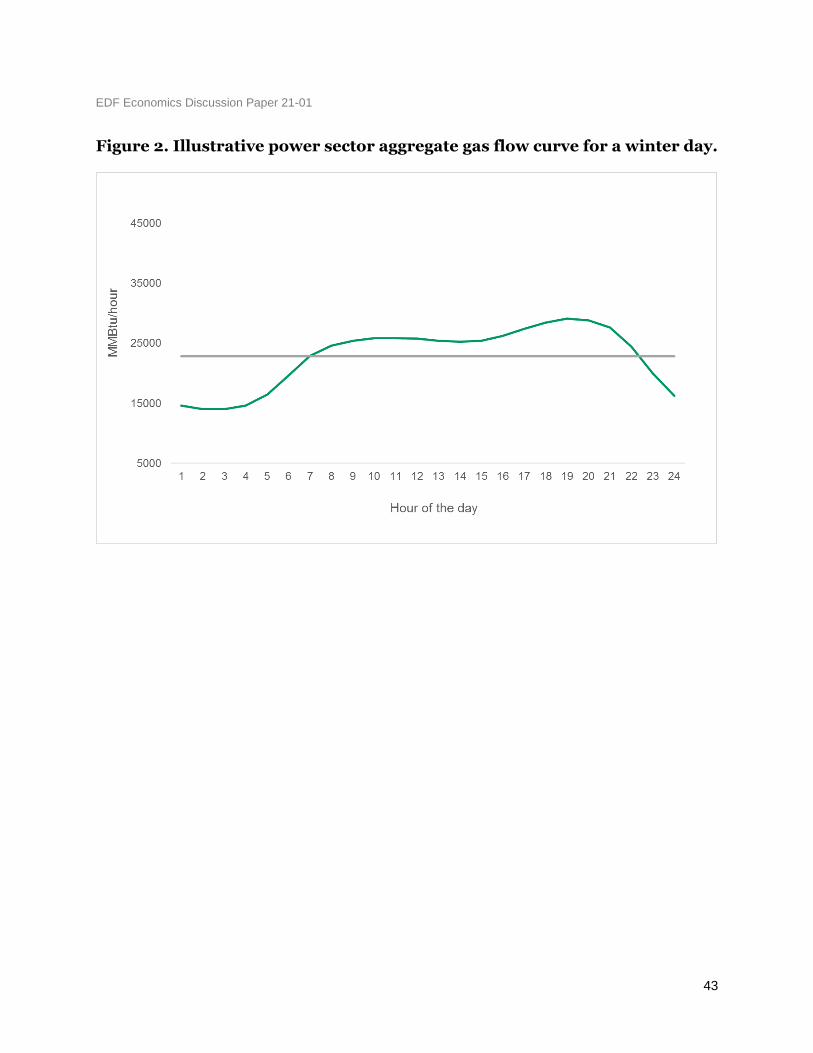
EDF Economics Discussion Paper 21-01
43
Figure 2. Illustrative power sector aggregate gas flow curve for a winter day.
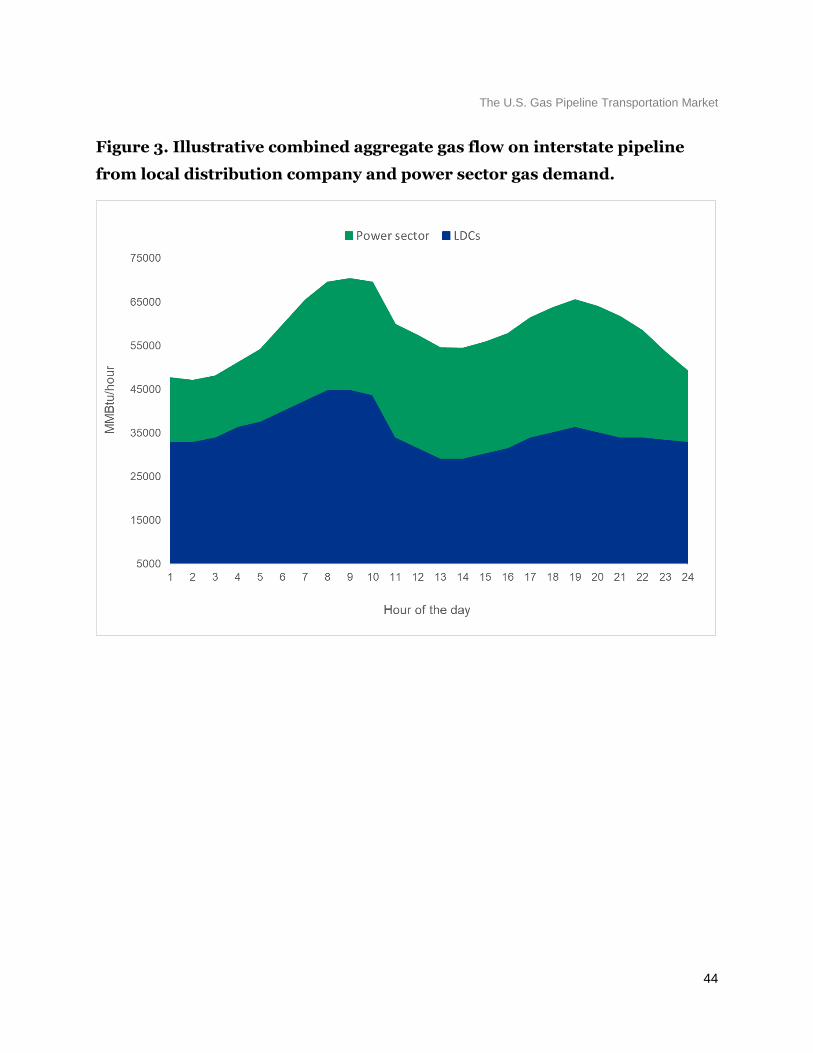
The U.S. Gas Pipeline Transportation Market
44
Figure 3. Illustrative combined aggregate gas flow on interstate pipeline
from local distribution company and power sector gas demand.