the validation of a human force model to predict … model to predict dynamic forces resulting...
TRANSCRIPT
NASATechnicalPaper3206
June 1992 _
L r
-- L --
.......i
The Validation of a HumanForce Model To PredictDynamic Forces ResultingFrom_Muit{-Joint Motions
and Barbara J. W__
= _
k
Abhilash K. Pandya,
James C. Maida, _ _
Ann M, Aldridge, _i ............
Scott M. Hasson, _
(_;ABA-TP-3205) THE VALIDATION OF A HUMA_
FORCE MO_EL TO PREDICT DYNAMIC FORCES
RESULTING FROM MULTI-JOINT MOTIONS (NASA)
33 p
I
N92-2653_ -
Unclas
H1/54 0097842
https://ntrs.nasa.gov/search.jsp?R=19920017295 2018-05-18T01:57:55+00:00Z

k _
r __
I r

NASATechnical
Paper3206
1992
National Aeronautics and
Space Administration
Office of Management
Scientific and TechnicalInformation Program
The Validation of a HumanForce Model To Predict
Dynamic Forces ResultingFrom Multi-Joint Motions
Abhilash K. Pandya
Lockheed Engineering & Sciences Company
Houston, Texas
James C. Maida
Lyndon B. Johnson Space Center
Houston, Texas
Ann M. Aldridge
Lockheed Engineering & Sciences Company
Houston, Texas
Scott M. Hasson
Texas Women's University
Denton, Texas
Barbara J. Woolford
Lyndon B. Johnson Space Center
Houston, Texas

TABLE OF CONTENTS
ACKNOWLEDGMENTS ....................................................................................................
ABSTRACT ..........................................................................................................................
1.0
2.0
Page
INTRODUCTION ........................................................................................................
OBJECTIVE ................................................................................................................
3.0 METHOD ....................................................................................................................
3.1 Data Collection ....................................................................................................
3.2 Data Reduction ....................................................................................................
3.3 Anthropometrically Correct Figure Creation ..................................................
3.4 Environment Setup ............................................................................................. 10
3.5 Modeling the Motion (Inverse Kinematics) ..................................................... 11
3.6 Torque Vector Calculation ................................................................................. 14
4.0 DATA ANALYSIS ....................................................................................................... 16
5.0 RESULTS AND DISCUSSION ............................................................................... 17
6.0 CONCLUSIONS ........................................................................................................ 23
7.0 FUTURE DIRECTIONS ............................................................................................. 24
8.0 REFERENCES ........................................................................................................... 25
v
vii
I
8
4
4
5
8
iii
_L_j_ INT_NTION/_I_L't'_[_N_ PRECEDING PAGE BLANK NOT FILMED i

Table 1
Table 2
Figure 1
Figure 2
Figure 3
Figure 4
Figure 5
Figure 6
Figure 7
Figure 8
Figure 9
Figure 10
Figure 11
Figure 12
Figure 13
Figure 14
LIST OF TABLES AND FIGURESPage
Summary of Subject Pool .........................................................................9
Pairwise T Statistic Results.......................................................................17
LIDO multi-joint testing system ................................................................. 5
Data before and after visual editing ........................................................ 6
An example of the coefficient file format ................................................. 7
Correlation between human skeleton and computer ........................... 8
Computer-generated figures ................................... " ............................... 9
Video image of subject with computer figures ....................................... 10
Model versus actual ratcheting ................................................................ 11
Magnetic tracking setup ............................................................................. 13
Human-model representation operating ratchet tool .......................... 13
Diagram illustrating the force vector propagation ................................. 15
Model versus measured average torque ............................................... 18
Model versus measured work .................................................................. 19
Measured versus model values ............................................................... 21
Chart comparing errors of polynomial fit ................................................ 22
"[V

ACKNOWLEDGMENTS
The investigators would like to thank all the subjects of our experiments. We wouldlike to thank John Salmon, Jack Aldridge, and J.J. Huang for insightful discussions onthe physics of rotational linked systems. Also, we would like to acknowledge the lateLinda S. Orr, whose contributions to research and practical work in computersimulation and graphics was invaluable to this project.
V


ABSTRACT
The focus of this report is on the development and validation of a dynamic strengthmodel for humans. Unlike earlier attempts at strength modeling, which were based onrotational spring and damper systems, this model is based on empirical data. Theshoulder, elbow, and wrist joints were characterized in terms of maximum isolatedtorque, or position and velocity, in all rotational planes. This information was reducedby a least squares regression technique into a table of single variable second degreepolynomial equations determining torque as a function of position and velocity. Theisolated joint torque equations were then used to compute forces resulting from acomposite motion, in this case, a ratchet wrench push and pull operation. Acomparison of the predicted results of the model with the actual measured values forthe composite motion indicates that forces derived from a composite motion of joints(ratcheting) can be predicted from isolated joint measures. Calculated T valuescomparing model versus measured values for 14 subjects were well within thestatistically acceptable limits (alpha = 0.01) and regression analysis revealedcoefficient of variation (R**2) between actual and measured to be within 0.72 to 0.80.
wjI_._.I- tN1TNTIOI_aLLI'_,[ere
PRECEDING PAGE lANK NOT FILMED
vii

_l
=
z
Z
=
Z

1.0 INTRODUCTION
Computer aided engineering (CAE) is commonly used in many aspects of aerospaceengineering. Extensions and enhancements of this useful tool of analysis are nowbeginning to be applied to the complex area of human modeling. The overall goalsinclude analyses of the performance capabilities of a given individual or population ina specific environment. This is a multifaceted problem. Anthropometricrepresentations, kinematic articulation of joints (reach), vision, and strength are just afew examples of the areas of complexity involved. The focus of this report is on thedevelopment and validation of a dynamic strength model for humans.
A dynamic strength model could be used to assess and predict whether a person orpopulation is capable of performing a physical task on the job. This is important in thecase of space extravehicular activities (EVAs) where crewmembers need to handlemassive structures such as satellites and various space assembly components. Inthese situations, mission planners would benefit from a simulation model of all theforces, torques, and accelerations that would be Imposed by and on the crewmember.
Equipment design engineers could also benefit from a strength model. Designspecifications can be enhanced if engineers could predict the forces and torques to beapplied on or with a given piece of equipment. These applications include, forexample, threshold torques needed to open hatches and doors and to operate toolsneeded for assembly or to determine maximum forces applied to ensure that theequipment will not be damaged. Equipment may be better designed if information onthe strength of the user population were available.
Equipment placement designs and scenarios may also be enhanced. Questions like:"what is the best configuration for this body restraint relative to this tool for maximumstrength," or, "where should this handhold be placed for the most efficient strengthutilization" could be better answered by the systematic examination of manypossibilities and scenarios with the goal of developing more comfortable and saferdesigns.
Lastly, a strength model is useful as a tool of study to achieve a greater understandingof how the musculoskeletal system functions, of how the torques and forces arepropagated, and of what the system control mechanisms and parameters are. Thisknowledge may lead to better designs of robotic and manipulator systems of the future.
To date, a more comprehensive dynamic strength model in the literature has not beenvalidated than the one developed here at NASA-JSC [1, 2, 3, 4]. Here are a fewquotes from the conference proceedings of Human-Centered Technology, June 1991regarding dynamic strength models [5].
Dr. Norman Badler, University of Pennsylvania: "We prefer that the user supply anacceptable strength model simply because ours is probably not very good."
Dr. Susan Evans, Vector Research Inc.: "The biomechanic strength modelspresented here reflect static controlled exertions. Performing dynamic exertionsis the next step."
Brenda Thein, U.S. Army Human Engineering Laborato_: "[There is a need] for adynamic strength model."
Dr. M. Ayoub, Texas Tech University: "Due to the complexity of dynamicbiomechanical analysis, as well as the limited dynamic muscle strength data tocompare with the task... [strength modeling] has been done with the aid of staticmodels."
The purpose of this project is to develop and validate a physically based humanmodeling system which incorporates dynamic strength infor_at!on into ananthrop0metricaiiy correct human figure model. Unlike earlier attempts at strengthmodeling, which were based on rotational spring and damp_er systems, our model isbased on empirical data. The shoulder, elbow, an-d-Wrlst joints_were characterized interms of maximum isolated torque, or position and velocity, in all rotational planes.This information was reduced by a least squares regression technique into a table ofsingle variable second degree polynomial equations determining torque as a functionof position for a range of velocities (e.g., torque = a + b * angle + c * angle ** 2, wherea, b, and c are the polynomial coefficients). The isolated joint torque equations werethen used to compute forces resulting from a composite motion, that is, a ratchetwrench push and pull operation. The force torque calculations were dependent on thegeometry of the human figures to convert the measured isolated joint torques to forcesat the end effector. This required accurate anthropometric measurements. Presentedhere is a comparison of the computed or predicted results of the model with the actualmeasured values for the composite motion.
2

2.0 OBJECTIVE
Our objective is to develop and validate a human dynamic strength model for theupper extremity using empirical data.
Specific aims:
1. Document and describe all data processing techniques and algorithms usedto validate the strength model.
2. Develop prediction equations to compute force for a multi-joint motion.
3. Validate the prediction equations of the dynamic strength model utilizing amulti-joint task (a ratchet wrench push-pull) using empirically collected data.
4. Implement a set of graphically based programs to demonstrate the flexibilityand feasibility of this modeling approach.
3

3.0 METHOD
3.1 Data Collection
The data collection effort occurred over an 8-week period. There were 14 subjects, 8males and 6 females, ranging in age from 21 to 28 years. Each subject was testedisokinetically for isolated upper extremity motion (shoulder, elbow, and wrist) at4 angular velocities (60, 120, 180, and 240 deg/sec) and then tested with a simulatedratchet wrench maneuver at 2 angular velocities (120 and 240 deg/sec).
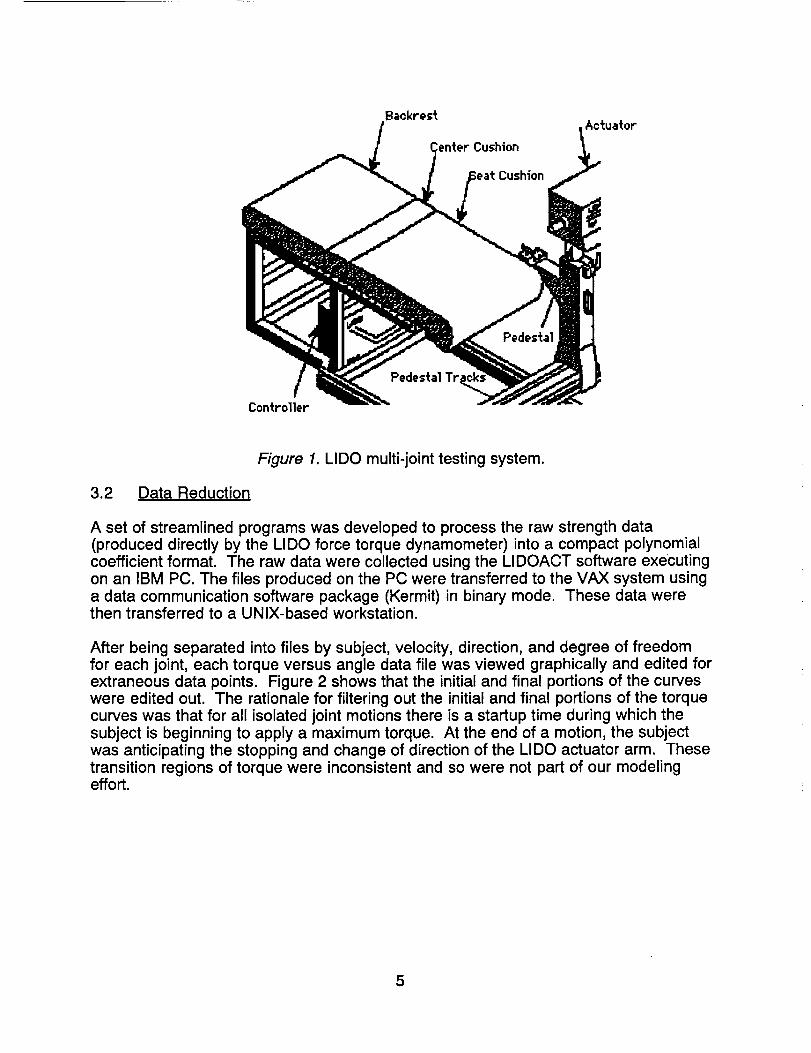
The general procedure for evaluating all the upper extremity joint movements was thesame. Torque was measured using a LIDO active multi-joint testing unit (LoredanBiomedical, Inc., West Sacramento, California, Figure 1). The subjects were positionedso that the axis of the joint was directly in line with the axis of the dynamometergoniometer. Dynamometer attachments were selected and placed to isolate the jointbeing measured. The subject was positioned on the instrument and maximallystabilized with the joint positioned at a specified initial condition. The subject was theninstructed to give a maximum effort for each of the five repetitions and to move theisolated joint through the entire range of motion. A 3-minute recovery period was takenbefore each change in velocity setting. The axes of motion measured were theshoulder flexion/extension, shoulder medial/lateral rotation, shoulderabduction/adduction, elbow flexion/extension, wrist flexion/extension, wrist radial/ulnardeviation, and wrist supination/pronation. The setups for these motions are describedin the LIDO multi-joint testing manuals.
For the multi-joint test, a ratchet wrench maneuver, the subject was stabilized withvelcro straps at the waist and across the chest. The subject gripped a simulated ratchetdevice at a height of 90% of the linear distance measured from the subject's greatertrochanter to the acromioclavicular joint. The range of motion for the ratchet bar wasbetween 40 and 50 degrees. To minimize the motion of the upper extremity, thesubject extended the elbow and shoulder fully forward without bending at the waist.This test was also a maximum torque effort of 5 repetitions with a 3-minute recoveryperiod before each change in the velocity setting (120 and 240 deg/sec).
The anthropometric data which were collected included height, weight, age, sex, skinfold measures, and dimensional assessment. The anthropometric data format isdocumented in NASA Man-Systems Integration Standards (MSIS) document (NASA-STD-3000) [6]. The standard was also used to provide the joint limit information. Jointlimits for the model were applied statistically as this information was not collected inour study [4].
4
Backrest
Center Cushion
Cushion
Actuator
Controller
Figure 1. LIDO multi-joint testing system.
3.2 Data Reduction
A set of streamlined programs was developed to process the raw strength data(produced directly by the LIDO force torque dynamometer) into a compact polynomialcoefficient format. The raw data were collected using the LIDOACT software executingon an IBM PC. The files produced on the PC were transferred to the VAX system usinga data communication software package (Kermit) in binary mode. These data werethen transferred to a UNIX-based workstation.
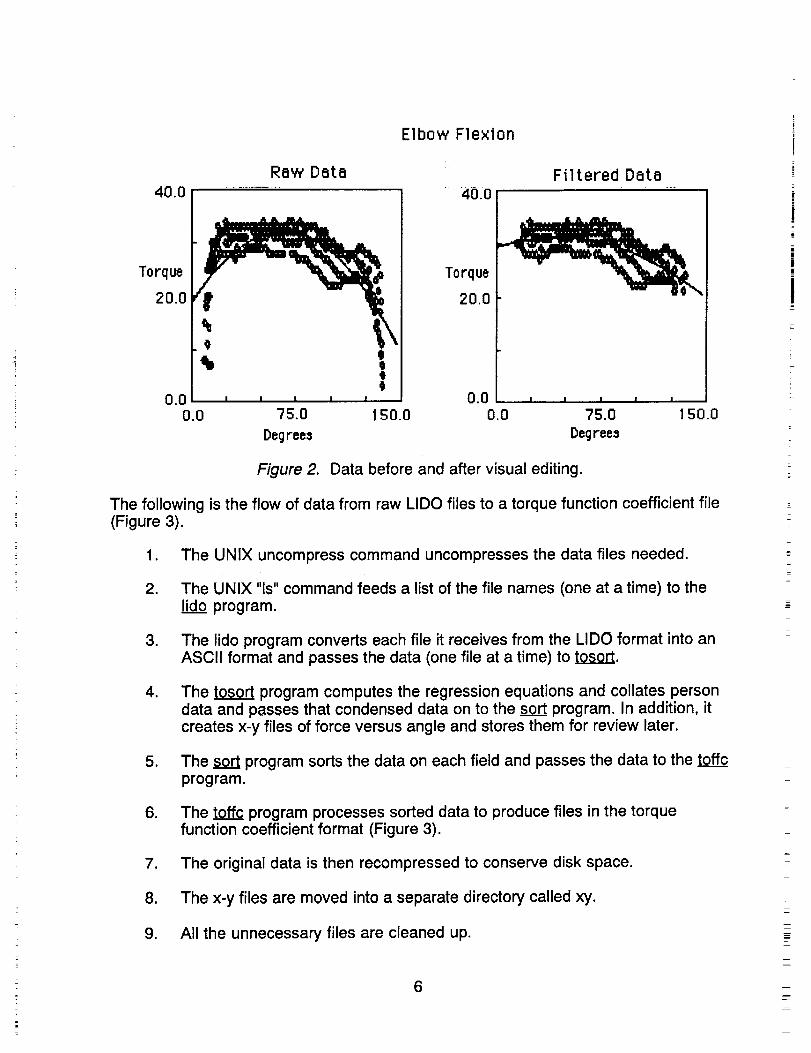
After being separated into files by subject, velocity, direction, and degree of freedomfor each joint, each torque versus angle data file was viewed graphically and edited forextraneous data points. Figure 2 shows that the initial and final portions of the curveswere edited out. The rationale for filtering out the initial and final portions of the torquecurves was that for all isolated joint motions there is a startup time during which thesubject is beginning to apply a maximum torque. At the end of a motion, the subjectwas anticipating the stopping and change of direction of the LIDO actuator arm. Thesetransition regions of torque were inconsistent and so were not part of our modelingeffort.
5
40.0
Torque
20.0
0.00.0
Raw Data
75.0 150.0
Degrees
Elbow Flexion
Filtered Data
"O'O lTorque
20.0
,0 I I I I I
0.0 75.0 150.0
Degrees
Figure 2. Data before and after visual editing.
The following is the flow of data from raw LIDO files to a torque function coefficient file(Figure 3).
•
2.
.
The UNIX uncompress command uncompresses the data files needed.
The UNIX "Is" command feeds a list of the file names (one at a time) to the
lid.._.ooprogram.
The lido program converts each file it receives from the LIDO format into anASCII format and passes the data (one file at a time) to tosort.
•
•
The tosort program computes the regression equations and collates persondata and passes that condensed data on to the sort program. In addition, itcreates x-y files of force versus angle and stores them for review later.
The sort program sorts the data on each field and passes the data to the toffcprogram.
6. The toffc program processes sorted data to produce files in the torquefunction coefficient format (Figure 3).
7. The original data is then recompressed to conserve disk space.
8. The x-y files are moved into a separate directory called xy.
9. All the unnecessary files are cleaned up.
6
w
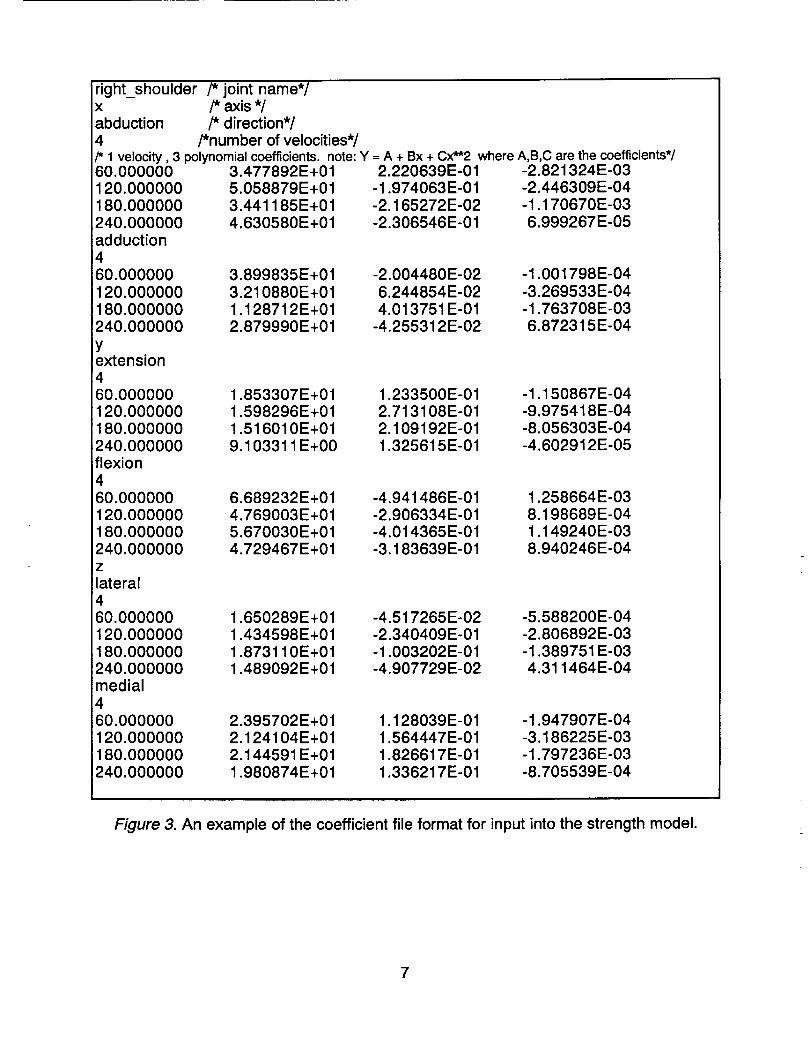
right_shoulder /* joint name*/x /* axis */abduction /* direction*/4 /*number of velocities*//* 1 velocity, 3 polynomial coefficients, note: Y = A + Bx + Cx**2 where A,B,C are the coefficients*/60.000000 3.477892E+01 2.220639E-01 -2.821324E-03120.000000180.000000240.000000adduction460.000000120.000000180.000000240.000000
Ye_ension460.000000120.000000180.000000240.000000flexion460.000000120.000000180.000000240.000000Z
lateral460.000000120.000000180.000000240.000000medial460.000000120.000000180.000000240.000000
5.058879E+013.441185E+014.630580E+01
3.899835E+013.210880E+011.128712E+012.879990E+01
1.853307E+011.598296E+011.516010E+019.103311E+00
6.689232E+014.769003E+015.670030E+014.729467E+01
1.650289E+011.434598E+011.873110E+011.489092E+01
2.395702E+012.124104E+012.144591E+011.980874E+01
-1.974063E-01-2.165272E-02-2.306546E-01
-2.004480E-026.244854E-024.013751E-01
-4.255312E-02
1.233500E-012.713108E-012.109192E-011.325615E-01
-4.941486E-01-2.906334E-01-4.014365E-01-3.183639E-01
-4.517265E-02-2.340409E-01-1.003202E-01-4.907729E-02
1.128039E-011.564447E-011.826617E-011.336217E-01
-2.446309E-04-1.170670E-036.999267E-05
-1.001798E-04-3.269533E-04-1.763708E-036.872315E-04
-1.150867E-04-9.975418E-04-8.056303E-04-4.602912E-05
1.258664E-038.198689E-041.149240E-038.940246E-04
-5.588200E-04-2.806892E-03-1.389751E-034.311464E-04
-1.947907E-04-3.186225E-03-1.797236E-03-8.705539E-04
Figure 3. An example of the coefficient file format for input into the strength model.
7

This process of transforming LIDO data files to force function coefficient files (ready formodel input) is completely automated with very little user intervention [4].
3.3 Anthropometrically Correct Figure Creation
To simulate physical tasks using the strength model it was necessary to createcomputer representations of the human bodies measured. The models were fullyarticulated human representations with proper segmentation of the body parts andstatistically determined joint limits. The body representations were based on thefigures developed by the University of Pennsylvania [7]. The human figurerepresentation has 22 body segments. Figure 4 shows the correlation between thehuman skeleton and the computer-generated figure.
foot!",,ji
Figure 4. Correlation between human skeleton and computer-generated figure.
Anthropometric measurements were made on 14 subjects. These subjects weremeasured while standing with arms at their sides and palms facing forward. Length,width, and depth measurements of the body segments were made using a clothmeasuring tape. From these measurements, a jointed computer model of each subjectwas generated. Figure 5 shows the eight male and six female computer-generatedfigures. In addition, for each subject, weight and skin fold measurements wererecorded. These data were used to calculate the lean body mass for each individual(Table 1).

Front view: male subjects.
Slde view: female subjects.
Figure 5. Computer-generated figures.
SUBJECT SEX AGE1. M 232. M 253. M 284. F 235. M 226. M 257. M 268. F 239. F 22
10. F 2111. F 2112. M 2113. F 2314. M 23
Height (cm) Weight (kg) %Body Fat Lean Body Mass (kg)173 64.9 10.4 58.2178 76.0 10.4 68.1188.3 84.5 14.5 72.2172.3 77.2 29.5 54.4185.0 88.2 10.7 78.8180.0 86.0 5.7 81.1176.3 95.2 19.0 77.1
74.0 60.6 18.6 49.3168.0 59.1 14.8 50.4158.5 46.4 17.2 38.4158.0 51.6 19.5 41.5178.5 80.7 8.9 73.5166.0 55.7 20.8 44.1162.5 68.5 11.3 60.8
TABLE 1. Summary of Subject Pool.
- 9

In general, the computer representation reproduces the differences in the subjects.However, there is an overall trend in the generated figures to be, on average, 5% tallerthan the actual height of the subjects. This was due]o accu_u]-ation of errors in themeasurements since each joint segmentwas measured_ndependently. To reducethis problem in the future, it is recommended that all segment length measures bemade from a common reference point (e.g., the floor).
To check for inconsistent measurements or to quickly obtair_ anthropometricmeasurements of a subject, an alternate measurement procedure was developed.Video images of the front and side views of a subject were taken. These images werethen processed with image processing software developed to extract segment length.Figure 6 shows the video images of one subject along with computer figuresgenerated from video images and measured data.
3.4 Environment Setup
Each individual was created in the graphics environment using that individual's
anthropometric data (Figure 3). The initial conditions of the ratcheting operation wereset to match, as closely as possible, the actual conditions. This was a critical step forvalidation. The main parameters of the initial conditions included the initial and
Video TapeScan Measured
Figure 6. Video image of subject with computer figures.
final joint angles for the ratcheting motion, the distance of the hip from the rotationpoint of the ratchet axis, the height of the end effector on the ratchet, and theorientation of the end effector (hand) on the ratchet handle. Using the graphics
environment, all these initial conditions were set for each individual prior to the
10 ORIGINAL PAGE
8LACK AND WHITE PHOTOGRAPh
h
F

execution of the computer simulation of the ratchet operation (Figure 7). There is anuncertainty with regard to the orientation of the end effector position. End effectororientation information was not collected at the time of measurement. Hence, videoimages and mockups of the ratcheting procedure were analyzed to extract theorientation. This orientation varies over the range of the ratchet motion and betweensubjects. Since the actual orientations were not measured, data were taken at2 orientations (120 and 140 degrees with respect to the ratchet handle). End effectororientation information, in retrospect, was very important because it affected the entirejoint chain and the kinematic solutions. It will be measured in all future experiments.
3.5 Modeling the Motion (Inverse Kinematics)
To model the reaching characteristic of the arm while operating the ratchet bar, aninverse kinematics algorithm was needed to solve the joint angles of the arm
Figure 7. Model versus actual ratcheting.
11 ORIGfNAL PAGEBLACK AND WHITE PHOTOGRAPH
[8, 9, 10, 11]. Also, the human model with its corresponding anthropometry needed tobe accessible to the force modeling software to integrate the torque functions with themotion of the arm. A software package named Jack [7], developed at the University ofPennsylvania, was used as a platform for our strength model. Although manyenhancements and modifications were required, the underlying inverse kinematiCsand anthropometrics implementation permitted us to model the required motion.
The simulation of the ratchet bar motion consisted of the following sequence of events.
1. The parameters of the motion (start angle, end angle, steps to take, andvelocity of the ratchet) were input.
o Time sequence information was computed which satisfied all the conditionsof the ratchet's motion.
.
.
The location of the joint chain forming the arm and the location of the point ofapplication on the ratchet bar were graphically selected.
Using the joint chain information, the torque functions for each component ofthe arm were loaded into the force model for use during the iterations of theratchet operations.
. The ratchet was moved to its initial or next position and the inverse kinematicmodule was invoked to grasp the point of application on the ratchet with thespecified end effector (palm) in the joint chain.
. The state of all the components of the arm, the joint angles of the arm, andthe state of the ratchet were extracted and input to the force model where thetorque prediction was computed and written to an output file.
1 Steps 4 and 5 were repeated until 5 iterations of pushing and pulling werecompleted (Figure 7).
To validate the reaching motion calculated by the inverse kinematics algorithm, a real-time magnetic tracking system was devised for input into the algorithm. The trackingsystem consisted of a Polhemus isotrack magnetic tracker (Polhemus NavigationSciences Company, Colchester, Vermont) connected to a Silicon Graphicsworkstation (Silicon Graphics Inc., Mountain View, California). The magnetic trackerwas linked to the end effector of the human-model representation. As the tracker wasmoved in space by a person, it fed the position and orientation information of the endeffector to the inverse kinematics algorithm. This information was then used to simulatethe motion of the person's arm in the computer model. The tracker of the Polhemusdevice was attached to a bar which could be rotated the same way the ratchet bar wasrotated. Comparison by visual inspection of the actual motion of a person's armperforming a ratcheting operation with the graphically emulated motion computed bythe inverse kinematics algorithm showed a strong correspondence (Figure 8).
Figure 9 shows a human-model representation operating a ratchet tool. Displayedalong with the figure are the force torque vectors and bar charts showing the torque ateach joint of the joint chain selected.
12
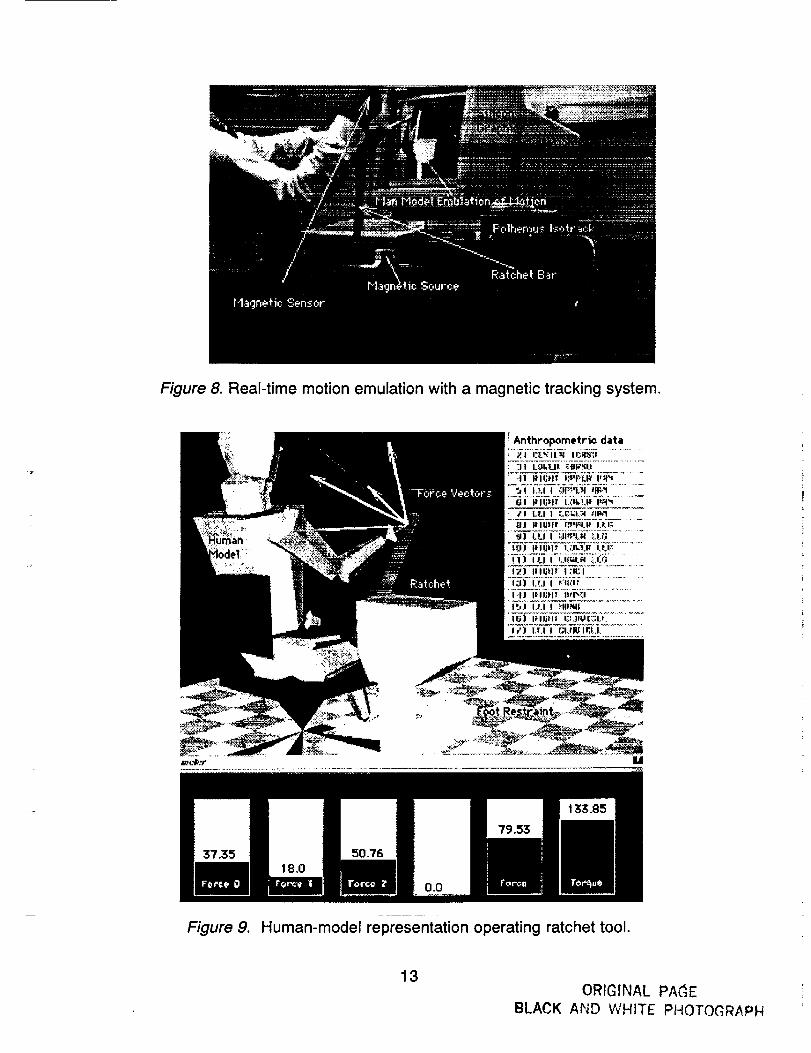
Figure 8. Real-time motion emulation with a magnetic tracking system.
U
F#gure 9. Human-model representation operating ratchet tool.
13ORIGINAL PAC_E
BLACK AND WHITE PHOTOC_RAPN

_=
:
z
3.6 Torque Vector Calculation
Each joint of the upper extremity was associated with a table of polynomial coefficientsdescribing its dynamic torque production potential [4] (Figure 3). In the modelingprocess, the tables were loaded into computer memory for use by a table look-upmodule. When a joint motion occurred in our test case, the axis of motion, direction ofmotion, angle of motion, and speed of motion were mapped to the appropriatepolynomial and a torque value returned.
Since it is assumed in our model that each axis of rotation for a particular joint isperpendicular to each other axis for that joint, the square root of the sum of the squareswas used to determine the available torque for each joint involved in that motion.
Ts = sqrt(tx*tx + ty*ty + tz*tz)
where
Ts = total torque for shouldertx = torque forxaxisty = torque foryaxistz = torque forz axis
The torque values at the other joints were similarly calculated.
For each joint, the lever arm to the point of application of the force, in this case thepalm, was determined (Figure 10). This is the Euclidean distance from the location ofthe center of rotation of that joint to the end effector. The torque values for each of thejoints were converted into forces at the end effector by dividing out the respective leverarm lengths for the shoulder, elbow, and wrist (Ls, Le, Lw).
Fs = Ts / LsFe = Te / LeFw = Tw / Lw
The direction vectors for each of these forces (<Fs>, <Fe>, <Fw>) were also computedat each iteration of the motion. Each vector was computed by taking the cross productof the current lever arm position with the lever arm position at the previous iterationand then crossing the resultant vector with the current lever arm position. Thiscomputation produces a direction vector of motion (<Fs>, <Fe>, <Fw>) for each of theindividual joints.
The force values were then applied to the respective direction vectors of rotation andvectorially added to produce the total end effector force vector, <Ft>. <Ft> representsthe total force at the end effector from the contributions of all joints in the chain.
For the test case, <Ft> needed to be resolved into a torque value at the ratchet axis.This was done by first projecting <Ft> onto the normalized direction vector of rotation,<Rt>, for the ratchet bar yielding a vector <Fproj> in the direction of rotation of theratchet bar with a magnitude representing the force applied in that direction. This force
14
D

was then multiplied by the lever arm length of the ratchet, the distance from the point ofrotation to the point of application (Lr), yielding a torque value, (Tr). This torque valueand the current angle of rotation of the ratchet bar were written to a file. In addition,<Ft> and <Fproj> were graphically displayed.
TorqueShoulder
Ts
upper arm
Ls
Shoulder Lever
<Fs> <F,#>
T_, Force Shoulder Force _.rist<Ft>
Torque Total ForoeWrist
<Rt>"-<Fproj>p-
PerpendicularForce
TorqIJe TrElbow Torque About
Te Ratchet Center
Figure 10. Diagram illustrating the force vector propagation.
15
F.
i
±
±
4.0 DATA ANALYSIS
All the subjects were run in the graphics environment with initial conditions andorientations closely matched to the actual runs (Figure 7). The ratcheting wasmodeled at the same velocities as the measured data (120 and 240 deg/sec). Outputsfrom the model were files of torque versus angle pairs in the same range of anglevalues as the measured ones. For both the model output data and the measured
ratcheting data, the average torque produced and the total work done per iterationwere computed. These data were the basis of the validation of the model. Statisticalanalysis was done in two forms: pairwise T tests and regression analysis [12, 13].Software was written to do these tests in an automated way without user intervention.
For the T test, the measured versus model files of the averages and total work doneover all subjects were read and a difference vector was created. This difference vectorwas the basis of the T test comparison. Our hypothesis was that there was nodifference between the model and the measured values when comparing either thetorque averages or total work done. The following explains the pairwise T test thatwas computed.
ud(difference) = u(model) - u(measured)(where u is the average torque or the total work done for each subject)
null hypothesis (H0): ud = 0 (u(model) = u(measured))alternate hypothesis (H1) • ud <> 0 (u(model) <> u(measured))
Hence, the decision rule is to reject H0 if:T(computed from the data) < critical value 2.46 (alpha = .01)
The regression test was simply a way to gauge the correlation between the actual andmeasured values. We plotted the model average torque versus the measured averagetorque for all subjects and did a linear regression on that data set. The same analysiswas done on model versus measured work. In addition, plots of actual versusmeasured raw torque values were also produced.
16

5.0 RESULTS AND DISCUSSION
Regression plots of model versus measured average torque and model versusmeasured total work are shown in Figures 11 and 12. The correlation coefficients(R**2 - 0.75) indicate a strong relationship between measured and model values.This result indicates that the model can be used as a good predictor of the ratchetwrench torque produced when the model versus measured values are compared forthe entire subject pool in terms of the average torque produced and the total workdone.
In addition to a regression comparison of the average torque and work done over therange of the motion, a pairwise T test was also performed on that data. The results(Table 2) indicate that for the ratcheting motion the model predicted and measuredtorque values show no statistical difference across the subjects at a level of alphaequal to 0.01.
Push Pull
Average torque T = 0.51 T = -1.69
Total work T = 1.23 T = -0.99
H0 is accepted because all T values calculated are within +/- 2.47 (the criticalvalue at alpha = 0.01).
See also the pairwise T test analysis on pacje 16.
TABLE 2. Pairwise T Statistic Results of Average and Total Work Across All Subjectsfor All Velocities.
17

Figure 11.
Ratchet Push- Model vs. Measured Average Torque
R**2 = 0.728 R = 0.85
20 40 60 80 1O0 120 140 160
Model Predicted Average Torque (ft-lbs)
Ratchet Pull- Model vs. Measured Average Torque
160
' R = 0.85 R**2 .= 0.72 •
< 6_O_m II; _1 240 _eg/sec I)x
20 40 60 80 100 120 140
Model Predicted Average Torque (ft-lbs)
Model versus measured average torque produced for the ratchet wrenchmotion.
18

Ratchet Push- Model vs. Measured Work
.D"3"4-1W1V
O
"10
tl
(11G
500_
400q • •
300_
200(
100(1000
I
R*'2=0.72 R=0.85
• •• •
• l 0
• 120 deg/sec
• 240 deg/sec
2000 3000 4000 5000 6000 7000Model Predicted Work (ft-lbs)
=
Figure 12.
6000
,_, 500E
400_
300(
200(
Ratchet Pull - Model vs. Measured Work.
R*'2=0.73 R=0.86
l • 120 deg/sec
_lI • 240 deg/sec
100( 000 20;0 30;0 40;0 sooo 6000Model Predicted Work (ft-lbs)
Model versus measured work produced for the ratchet wrench motion.
19
Figure 13 shows a plot of the actual versus model torques for a male and female fortwo extreme cases (strong male, weaker female). Trendsin the data indicate that themodel values are rnatched over a 5 to 40 degree range of the ratchet motion. Theinitial and final few degrees (0-5, 40-45 degrees) do not match our predicted results.These stages of the motion are related to the startup and slow-down processesinvolved [14] which are not currently part of our modeling effort. This result indicatesthat a similarity in magnitude and shape exists within most subjects. As shown inFigure 13 (part b, Male Push), some Of the predicted torques are outside the measuredrange. This was expected. These inaccuracies could be due to nonmaximum trials,incorrect anthropometric measures, or setup discrepancies.
To get an estimate of the deviation from the measured data, a comparison computationwas done. For each of the position torque data sets collected (Figure 13), acorresponding array of torque values was calcuiated from t_e rnodel-predictedpolynomial coefficients for that particular data set. A torque difference vector (adifference of the actual measured torque value at that angle and the computed valueat that point from the predicted polynomial coefficients) was then created. Apercentage absolute value (relative to the maximum) of the difference array wascalculated and plotted. This same analysis was done on the regression coefficientscomputed from the measured data set. The regression coefficients from the measureddata set represent the ideal curve through the collected data values.
Figure 14 represents a comparison of the error of the measured regression coefficientand the error from the predicted coefficients relative to the original data. Thedifference (% error) in the regression coefficients from the original data reflect thefluctuation in the measured data. On average, there was a 7% deviation from theregression curve calculated from measured data. For prediction of second orderregression coefficients, this is the best that one can hope to achieve because there isinherently that much variation in the measured data. As expected, the predictedcoefficients have a greater deviation than the regression coefficients calculated fromthe actual data. The model deviations have an average of about 20%. This measurerepresents how closely (in absolute terms) the computed curve matches the measureddata over the entire range.
m
20

200 200
100
0
I
m
O.
w
0 10 20 30 40 50
a. Male Pull
1O0
00 10 2O 30 4O 5O
b. Male Push
1O0
8O
6O
4O
20
00 10 20 30 40
c. Female Pull
• Plodel Predicted[] Measured Data
5O 6O
1O0
80
60
40
20
00 10 20 30 40 50 60
d. Female Push
x axls = angular displacement (deg)y axis = torque (ft-lbs).
Figure 13. Measured versus model values for ratchet wrench maneuver at a velocityof 120 deg/sec.
21

Model vs. Measured Polynomial: Absolute aAError as Compared to Measured Data
• Measured Error (2nd Order Polynomial)
• Model Error (2nd Order Polynomial)
b.(D
0
m>
0Ih
J_<c
Figure 14.
1 2 3 4 5 6 7 8 9 10 11 12 13 14
Subject. Number
Chart comparing errors of polynomial fit of measured versus model data.
=
22
D

6.0 CONCLUSIONS
Unlike earlier attempts at strength modeling (based on rotational spring and dampersystems) our model is based on empirical data. The shoulder, elbow, and wrist jointswere characterized in terms of maximum isolated torque produced, or position andvelocity, in all rotational planes for 14 subjects. This information was reduced by leastsquares regression into polynomial equations expressing torque as a function ofposition and velocity and tabularized for input to the strength model. This isolated jointinformation was used to compute (based on a vector sum algorithm and the subject'santhropometric measurements) forces resulting from composite motions--in this case,the ratchet wrench push-pull. Measured versus model output were compared.
Results indicate that forces derived from a composite motion of joints (ratcheting) canbe predicted from isolated joint measures. Model versus measured values for14 subjects were compared. T values calculated were well within the statisticallyacceptable limits (alpha = 0.01), and regression analysis revealed the coefficient ofvariation (R**2) between actual and measured to be within 0.72 to 0.80. An estimateof the deviation of the model-computed polynomial from the measured data (over theentire range of motion) showed an average absolute deviation of 20%. The sameanalysis for a computed second order polynomial for the measured data, whichrepresents the best case, showed a deviation of 7%.
These results indicate that the approach taken here at strength modeling is a viableone. Nevertheless, there are sources of error which need to be addressed.Anthropometric measurements and geometric figure creation, vital to the calculationand propagation of forces, need to be more accurate in terms of measurements taken,joint center location, and defined joint rotational axes. A more accurate velocityextrapolation mechanism is needed to remove the error of dynamic torque functionlook-up. Lastly, kinematic articulation of joints, which was used not only for properorientation of the joint chain but also for the calculation of joint velocities, needs to bemade more realistic.
23

7.0 FUTURE DIRECTIONS
Our overall objective is to incorporate into existing CAE capabilities a total bodystrength model of the NASA crewmember population for analytical physically basedanalysis. We will:
• Continue to cycle through the phases of yali_atjon and refinement of thestrength model with more complex motions.
,
t
Obtain additional isolated joint measures to extend our model to the wholebody.
Incorporate the strength model into current inverse kinematic algorithms toproduce more realistic reaching; i.e., strength guided motion [15, 16].
. Apply the strength model to generate multiple gravity reach envelopes in alldirections and axes and compare our results with measured data.
24
i
z

.
.
.
=
.
7.
.
.
12.
13.
14.
REFERENCES
Schanne, F.T.: Three Dimensional Hand Force Capability Model for a SeatedPerson. Ph.D. Thesis, University of Michigan, 1972.
Wooiford, B.; Pandya, A.; and Maida, J.: Development of Biomechanical Modelsfor Human Factors Evaluations. Space Operations Applications and Research,vol. 2 pp. 552-556, 1990.
Pandya, A.; Maida, J.; Aldridge, A.; Hasson, S.; and Woolford, B.: Development ofan Empirically Based Dynamic Biomechanical Strength Model. SpaceOperations Applications and Research, 1991.
Pandya, A.; Hasson, S.; Aldridge, A.; Maida, J.; and Woolford, B.: Correlation andPrediction of Dynamic Human Joint Strength from Lean Body Mass. NASATechnical Paper 3207.
Air Force Systems Command, Armstrong Laboratory: Human-CenteredTechnology for Maintainability: Workshop Proceedings. AL-TP-1991-0010.1991.
June
Man-Systems Integration Standards, NASA-STD-3000, vol 1, 1987.
Badler, N.; Lee, P.; Phillips, C.; and Otani, E.: The Jack Interactive Human Model.Proceedings of Mechanical System Design In a Concurrent EngineeringEnvironment, vol. 1, 1989.
Otani, E.: Software Tools for Dynamic and Kinematic Modeling of Human Motion.University of Pennsylvania (internal report), 1989.
Zhao, J. and Badler, N.: Real Time Inverse Kinematics With Joint Limits andSpatial Constraints. MS-CIS-89-09 University of Pennsylvania Technical Report,1989.
Lee, C.S.: Robot Arm Kinematics Dynamics and Control. IEEE- Computer, 1982.
Korein, James U: A Geometric Investigation of Reach. MIT Press, Cambridge,MA, 1985.
Rothman, E. and Ericson, W.: Statistics: Methods and Application. Kendall/HuntPublishing, Iowa, 1987.
Gerald, C.F.: Applied Numerical Analysis. Addison-Wesley PublishingCompany, Menlo Park, California, 1970.
Chaffin, D.B. and Anderson, G.B.: Occupational Biomechanics. John Wiley &Son, New York, 1984.
25

15.
16.
Lee, P.: A Model for Generating Human-Like Motion with Strength Constraints.University of Pennsylvania (internal report), 1989.
Phillips, C.; Wei, S.; Zhau, J.; and Badler, N.: Strength Guided Motion. ComputerGraphics, vol. 24, no. 4, pp. 253-262.
z-
26
z
m


REPORT DOCUMENTATION PAGE ro..,App.ov_OMB No. 0704-0188
Pubfk reporting burden for this collection of information is ,1situated to average I hour Def response, including the time for reviewing instructions, searching existing data sources, gat:he_lr, g and
maitttalnlng the data needed, and ¢ompleUng and reviewing _he collection of information. Send comments regarding this burden estimate or any other as_oect of this collection of information.
including suggestions for teducln 9 (his i0urden, to Washtf_:jton Headcluar%er$ Service% Directorate for Information Operations and Reports0 1215 Jefferson Davis Highway, Suite 120&, Ariin_lton, VA
22202-4302. and to the Office of Management and Budget. Paperwork ReduCtion Proje_ (0704.0188). washinclton. D( 2050].
1. AGENCY USE ONLY (Leave blankJ 2. REPORT DATE 3. REPORT TYPE AND DATES COVERED
Ju_e 1992 Technical Paper4. TITLE AND SUBTITLE 5. FUNDING NUMBERS
The Validation of a Human Force Model To Predict Dynamic C NAS9-17900Forces Resulting From Multi-Joint Motions PR 055-K3-G12
6. A! }THr)R/¢I
Abhilash K. Pandya, James C. Maida, Ann M. Aldridge,Scott M. Hasson, and Barbara j. Woolford
7 PERFORMINGORGANIZATIONNAME(S)ANDADDRESS(ES)Man-Systems DivisionNational Aeronautics and Space AdministrationLyndon B. Johnson Space CenterHouston, Texas 77058
9. SPONSORING / MONITORING AGENCY NAME(S) AND ADDRESS(ES)
National Aeronautics and Space AdministrationWashington, D.C. 20546-001
11. SUPPLEMENTARY NOTES
Abhilash K. Pandya and Ann M. Aldridge: Lockheed Engineering &Houston, TX; Scott M. Hasson: Texas Women's Univ., Denton, TX;and Barbara a. Woolford: Lyndon B.
12a. DISTRIBUTION /AVAILABILITY STATEMENT
Unclassified - Unlimited
Subject Category 54
13, AB_RACT (Maximum 2_ words)
8. PERFORMING ORGANIZATIONREPORT NUMBER
S-670
10. SPONSORING / MONITORINGAGENCY REPORT NUMBER
NASA TP-3206
Sciences Co.,James C. Haida
Johnson Space Center, Houston, TX.
12b. DISTRIBUTION CODE
The focus of this report is on the development and validation of a dynamic strengthmodel for humans. Unlike earlier attempts at strength modeling, which were based onrotational spring and damper systems, this model is based on empirical data. Theshoulder, elbow, and wrist Joints were characterized in terms of maximum isolatedtorque, or position and velocity, in all rotational planes. Thls information wasreduced by a least squares regression technique into a table of single variable seconddegree polynomial equations determining torque as a function of position and velocity.The isolated Joint torque equations were then used to compute forces resulting from acomposite motion, in this case, a ratchet wrench push and pull operation. A comparisonof the predicted results of the model with the actual measured values for the compositemotion indicates that forces derived from a composite motion of joints (ratcheting) canbe predicted from isolated joint measures. Calculated T values comparing model versusmeasured values for 14 subjects were well within the statistically acceptable limits(alpha = 0.01) and regression analysis revealed coefficient of variation (R**2) betweenactual and measured to be within 0.72 and 0.80.
14 SUBJECT TERMS
Computer Modeling, Human Modeling, Inverse Kinematics, Force,Torque, Dynamometer, Joint Strength
17 SECURITY CLASSIFICATIONOF REPORT
Unclassifled
Standard Form 2gi} (Rev 2-1]g)
Pr_Cflbe¢l i_f ANSI ¢_,td 239-!_298-_02
I5. NUMBER OF PAGES
32
16. PRICE CODE
A0318. SECURITY Ct_ASStFICATION 19 SECURITY CLASSIFICATION 20. LIMITATION OF ABSTRACT
OF THIS PAGE OF ABSTRACT
Unclassified Unclassified
NASA-Langley, 1992