the value of hedging
TRANSCRIPT

The Value of Hedging
“A study of currency derivatives usage and firm value on the Swedish market”
Advisor: Authors:
Maria Gårdängen André Bergstrand
Karl-Fredrik Hansson
Marcus Thorsheim

2
Title: The value of hedging - A study of currency derivatives usage and firm
value on the Swedish market
Authors: André Bergstrand, Karl-Fredrik Hansson and Marcus Thorsheim
Advisor: Maria Gårdängen
Course: Master Thesis in Corporate and Financial Management, Lund University
Seminar date: 2009-06-04
Keywords: Risk management, currency derivatives, exchange rate risk, exchange rate
risk exposure, value creation, underinvestment, financial distress, debt
capacity and managerial risk aversion.
Purpose: The purpose of this study is to investigate to what extent currency
derivatives is value creating for Swedish firms, and if so, we aim towards
determining the source of the value creation.
Theoretical
framework:
The theoretical framework covers risk management theories regarding
underinvestment, financial distress, tax incentives and managerial risk
aversion. Furthermore, we present a review of previous empirical studies
covering the applicability of risk management theories and proof of value
creation derived from risk management.
Empirical
framework:
A sample containing 108 listed firms on the Swedish market during 2005-
2008.
Methodology: Quantitative approach using multiple regression analysis.
Conclusions: Our findings show that Swedish firms hedging their foreign currency
exposure are assigned a premium of 4-21%. The value is independent of
short-term fluctuations in exchange rates and investors seem to value the
long-term benefits from risk management. The most significant source of
value is the use of hedging to relieve underinvestment problems, followed
by a lower probability of financial distress. Lastly, the findings suggest
that Swedish currency hedgers are not making use of the additional debt
capacity created through hedging and is therefore foregoing value
increasing tax-shields.

3
1 INTRODUCTION ............................................................................................................................. 5
1.1 Background ................................................................................................................................................ 5
1.2 Problem discussion ..................................................................................................................................... 5
1.3 Purpose and research questions ................................................................................................................. 7
1.4 Delimitations .............................................................................................................................................. 7
1.5 Thesis outline ............................................................................................................................................. 8
2 LITERATURE REVIEW .................................................................................................................. 9
2.1 Motives for risk management ..................................................................................................................... 9
2.1.1 Underinvestment and asset substitution problems ................................................................................ 10
2.1.2 Costs of financial distress ........................................................................................................................ 11
2.1.3 Tax incentive............................................................................................................................................ 12
2.1.4 Managerial wealth and risk aversion ...................................................................................................... 12
2.2 Empirical evidence on value creating risk management ........................................................................... 13
2.3 Empirical evidence from the Swedish market ........................................................................................... 16
2.4 Summary of previous empirical findings ................................................................................................... 18
2.5 Comments on prior research .................................................................................................................... 20
2.5.1 Determinants of risk management ......................................................................................................... 20
2.5.2 Value creation ......................................................................................................................................... 21
3 METHOD ........................................................................................................................................ 22
3.1 Research approach ................................................................................................................................... 22
3.2 Data .......................................................................................................................................................... 22
3.2.1 Sample ..................................................................................................................................................... 23
3.2.2 Observations excluded ............................................................................................................................ 23
3.3 Regression model ..................................................................................................................................... 24
3.4 Variables .................................................................................................................................................. 25
3.4.1 Dependent variables ............................................................................................................................... 25
3.4.2 Measuring exposure and hedging activities ............................................................................................ 27
3.4.3 Control variables ..................................................................................................................................... 28
3.4.4 Summary of the regression models and expectations ............................................................................ 30
3.5 Comments on the regression models ....................................................................................................... 31
4
3.6 Methodological discussion ....................................................................................................................... 32
3.6.1 Validity ..................................................................................................................................................... 32
3.6.2 Reliability ................................................................................................................................................. 33
4 EMPIRICAL FINDINGS ............................................................................................................... 34
4.1 Descriptive statistics ................................................................................................................................. 34
4.2 Comparison between groups .................................................................................................................... 36
4.2.1 Hedgers and non-hedgers ....................................................................................................................... 37
4.2.2 Exchange rate movements ...................................................................................................................... 37
4.3 Regressions .............................................................................................................................................. 38
4.3.1 Value creation ......................................................................................................................................... 39
4.3.2 Sources of value creation ........................................................................................................................ 41
5 ANALYSIS AND DISCUSSION .................................................................................................... 42
5.1 Value creation .......................................................................................................................................... 42 5.1.1 Control variables ..................................................................................................................................... 43 5.1.2 Robustness of the regression .................................................................................................................. 44
5.2 The sources of value creation ................................................................................................................... 44 5.2.1 Underinvestment .................................................................................................................................... 45 5.2.2 Financial distress ..................................................................................................................................... 46 5.2.3 Debt capacity ........................................................................................................................................... 46 5.2.4 Managerial risk aversion ......................................................................................................................... 47
6 CONCLUSIONS .............................................................................................................................. 48
6.1 Further research ....................................................................................................................................... 49
BIBLIOGRAPHY ............................................................................................................................... 50
Literature ....................................................................................................................................................... 50
Journals .......................................................................................................................................................... 50
Research papers ............................................................................................................................................. 53
Databases ...................................................................................................................................................... 53
Internet .......................................................................................................................................................... 53
Appendix 1, Costs of financial distress ........................................................................................................... 54
Appendix 2, Convex tax scheme ..................................................................................................................... 55
Appendix 3, Excluded firms ............................................................................................................................ 56
Appendix 4, Yearly regressions ....................................................................................................................... 57
Appendix 5, Pooled and fixed effects ............................................................................................................. 58

5
In this opening chapter we present the background and problem discussion that forms the
foundation for our purpose and research questions. We also present the delimitations and a
short thesis outline.
Risk introduces uncertainty into a specific situation and more importantly, risk is everywhere.
The term risk management refers to making an uncertain outcome less risky through
controlling the actual outcome beforehand. From a corporate perspective the main objective
with handling risk is to reduce various exposures towards risks and mitigate the volatility in
the cash flow stream. The most common risks originate from macroeconomic factors, such as
exchange rate risks, interest rate risks and commodity price risks. Sweden is a small country
with a volatile currency, and at the same time highly dependent on the international market.
Many of the Swedish firms are active on an international basis, facing multifaceted risks from
numerous sources. A multinational company (MNC) benefits from diversified markets, but is
at the same time more exposed than a firm active on the domestic market, indicating a need
for handling the increased exposure towards risks.
Managing financial price risk is not a new phenomenon, but there has been an increase in
derivatives usage, especially among Swedish firms. Alkebäck (2006) found an increase in the
use of derivatives from 52% in 1996 to 59% in 2003, whereas the use of currency derivatives
is the most common form of handling exposures. Additionally, many firms today actually
hedge the majority of their anticipated exposure denominated in foreign currency. In other
words, highly exposed firms manage their exposure to an increasing extent, suggesting that
the majority of their foreign sales are secured at the forward price. These arguments indicates
that risk management has increased in importance, but also that a larger part of the
companies‟ revenues are affected by the positions taken in derivatives. An individual firm
may perceive risk management as necessary, but does hedging increase the shareholder value?
The theory surrounding risk management is derived from the Miller and Modigliani (M&M)
irrelevance propositions (Miller and Modigliani, 1961). Their hypothesis suggests that the
firm value is independent of risk management because the actions could be replicated by
shareholders at a lower cost. This hypothesis holds when the following four assumptions are
fulfilled: perfect capital markets, symmetric information, given investment strategies and
equal access. But in the real world, frictions exist and these assumptions are violated, for
example through information asymmetries or taxes. The main source to value creation in risk
management theory is the reduction in volatility of cash flows. The theoretical framework
supporting the subject emphasizes four main areas where risk management affects value:

6
mitigating the underinvestment problem, decreasing financial costs of distress, decreasing
expected tax liabilities and through managerial risk aversion.
Within the research field there are a vast number of empirical studies investigating
determinants of hedging, trying to pinpoint the relationship between theory and practice. For
example, Géczy, Minton and Schrand (1997) found that firm´s with growth opportunities
hedge, supporting the theory about underinvestment. Graham and Rogers (2002) finds support
for the hypothesis that firms use hedging to decrease the expected costs of financial distress
and Graham and Smith (1999) strengthens the idea about reducing the expected tax liability.
Although, the findings regarding determinants of risk management is contradictive and do not
present a unified picture. Furthermore many of the studies do not present any evidence
between the determinant of risk management and the actual value creation.
The studies regarding value creation is more limited than the ones covering the determinants
and also provides rather indistinct conclusions. The most common financial price risk can be
divided into three categories, exchange rate risk, interest rate risk and commodity risk. The
majority of the existing studies focus on either countries, industries or the type of hedging.
Allayannis, Lel and Miller (2007) provides evidence that corporate governance is a
determinant of hedging premium, which suggests country specific attributes as an important
source to value creation. Moreover, various industries have been examined, such as the gold
industry by Jin and Jorion (2006) and the airline industry by Carter, Rogers and Simkins
(2002). Jin and Jorion (2006) found no value creating effects, while Carter, Rogers and
Simkins found a positive premium for fuel hedgers. When considering the type of hedging,
different studies focuses on either exchange rate risk, interest rate risk or commodity risk,
where positive hedging premiums have been found for all three types of hedging.
As mentioned before, exchange rate risk is the most prominent risk and also the most
managed. Allayannis and Weston (2001) were the first researches to actually examine the link
between firm value, exposure and hedging trough currency derivatives. They investigate 720
U.S. non-financial firms during 1990-1995 and find a positive premium associated with the
use of derivatives. Furthermore they argue that risk management should be the most valuable
when the home currency is appreciating and found supporting evidence, even if the
estimations were conducted on a rather facile basis. A number of studies have followed their
methodology to investigate various types of hedging activities in order to determine whether
risk management is value adding or not. One important aspect to stress is about the
universality of their results. The fact that significant differences exist between countries, for
example between the American and Swedish market, challenges the transferability of their
findings.
The Swedish market is less investigated than the U.S market, but studies have been conducted
regarding both determinants and value creation of risk management. Hagelin (2003)
conducted a study based on a survey covering listed Swedish firms 1997 to map the
determinants of hedging with currency derivatives on the Swedish market. The findings
indicate that Swedish firm‟s hedge currency risk in order to mitigate the underinvestment
problem and the indirect costs of financial distress. Moreover, Pramborg (2004) investigated

7
the hedging premium on the Swedish market based on a survey between the years 1997-2001
and found a positive hedging premium for firms using currency derivatives. These years was
characterized by a depreciation of the Swedish krona which in theory should undermine the
value creation for hedgers using currency derivatives. The overall result suggests a positive
premium for the total period, without being able to determine the yearly impact on the
premium in an assuring way. Moreover, Pramborg (2004) only provides a short discussion on
the sources of the value creation based on prior research.
Our study aims at filling in some of the gaps in previous research and to contribute to the
overall picture of the subject of risk management. Allayannis and Weston (2001) is the most
extensive article examining the use of currency derivatives. But there are several important
differences between the Swedish and the U.S. market. We would like to stress the importance
of two dimensions. First, Sweden is more dependent on the international trade markets, which
increases the overall exposure and therefore the need for risk management. Thence should
motivate a higher premium. Second, Sweden has a more volatile currency which increases the
possibility of mitigating deviations in cash flows and creating value through hedging.
Furthermore, prior research tries to determine time bound differences by rather facile methods
missing to account for important aspects. Therefore we study a period of both appreciation
and deprecation, where we take the yearly differences into consideration to highlight potential
disruptions. We hope to contribute through important and interesting distinctions between the
years and enlighten risk management in regards to the contextual developments during the
period. Many studies present either the determinants or the premium for the value creation
while few studies try to link these two aspects together over a combined time period using the
same sample. Therefore, we also aim towards increasing the knowledge about the sources of
value creation in direct relation to the period we have chosen to study.
The purpose of this study is to investigate to what extent currency derivatives is value creating
for Swedish firms, and if so, we aim towards determining the source of the value creation. We
have formulated two research questions to operationalize our purpose:
1. Does the use of currency derivatives increase firm value for Swedish firms during
2005-2008 and does the value differ between the years?
2. Given that the use of currency derivatives is value creating, what is the source of value
creation?
The most prominent delimitation in this study is whether a firm hedges or speculates in their
initiated currency hedging positions. The availability of this information is limited and
especially when a study is based on databases and annual reports where the disclosure
regarding this matter is very weak. Instead, we turn to previous research on the Swedish

8
market highlighting this aspect and rely on their findings (see, Alkebäck, Hagelin and
Pramborg 2006).
In Chapter two we present the literature review, introducing the reader to the theoretical and
empirical framework we built this thesis on. We describe the motives for risk management,
empirical research on value creation and specific studies covering the Swedish market. In
Chapter three we present the methodological framework supporting this study, exploring and
explaining the sample, statistical models and choice of variables. Lastly we provide a
discussion on the statistical models, validity and reliability of this study. Chapter four
discloses our findings through descriptive statistics and regression models. Chapter five
provides the reader with an extensive analysis of the statistics, where we try presenting a
multifaceted analysis based on both theoretical and empirical evidence. In the last Chapter we
summarize the findings and present the most eminent conclusions.

9
This chapter will provide a comprehensive summary of previous studies on the subject of
value creating risk management. Firstly, the theory behind value creating risk management
will be investigated followed by a review of the results of empirical studies trying to determine
whether or not these theories are applicable in reality. Secondly, a review of the results from
empirical studies trying to find proof of value creation deriving from risk management. This
chapter will be concluded by a review of the research done within this subject on the Swedish
market specifically.
All theory regarding value creation from doing risk management takes its beginnings in the
Miller and Modigliani (M&M) irrelevance propositions (Miller and Modigliani, 1961). M&M
makes four assumptions under which firm value is independent of risk management actions
undertaken by management, since these actions could as easily be managed by the
shareholders themselves. The four M&M assumptions are the following:
Perfect capital markets: Under this assumption there are no taxes, no transaction costs,
no institutional frictions and no costs of bankruptcy or financial distress.
Symmetric information: All investors and firms have equal access to information and
have identical perceptions about how this information will impact asset prices.
Given investment strategies: How firms decide to invest in real capital is taken as a
given and is assumed to be independent of how firms choose to finance themselves.
Equal access: All players, firms and individuals, have exactly the same access to
financial markets under the same terms (Culp, 2002).
However, these four assumptions do not hold in reality and it is these violations of the M&M
assumptions (capital market imperfections, unequal access of participants to the capital
market and asymmetric information) that create the possibility for shareholder value creation
through corporate risk management.
Normally, risk management reduces the volatility of cash flows which in turn reduces the
variance of firm value, and an important implication of this is that the probability of low firm
values decreases. In other words, when a firm faces a shortfall in cash they can either reduce
investment or increase outside financing, which means that variability in cash flows adds
costly disturbances to financing and investment plans (Froot, Scharfstein and Stein, 1993).
Furthermore, firm value is argued to be a concave objective function due to capital market
imperfections (Bartram, 2000). This implicates that lower cash flow volatility reduces costs
stemming from these capital market imperfections, which in turn generates higher cash flows
to the owners, hence creating a higher expected firm value.

10
For companies with high financial leverage and volatile firm value, managers may be inclined
to turn down positive net present value (NPV) projects, acting in the shareholders‟ interest,
since the increase in value would be used to satisfy debt holders in the event of bankruptcy
while being financed by equity (Myers, 1977). This underinvestment problem occurs in
situations of low firm value. As mentioned above, one implication of risk management is the
reduction of probability of low firm value situations, as a result agency costs are avoided
which increases shareholder value. According to Bessembinder (1991:531) “by shifting
individual future states from default to non-default outcomes, hedgers increase the proportion
of future states in which equity holders are the residual claimants”. Since hedging increases
the fraction of benefits accruing to shareholders derived from incremental investments,
shareholders should be less prone to underinvest. The underinvestment problem is more
pronounced in the presence of more investment opportunities and therefore should firms that
derive large portions of their market value from growth options rather than assets in place be
more inclined to hedge (Mian, 1996).
Another source of value is that a firm that is currently not at risk of experiencing
underinvestment problems can by engaging in risk management increases their leverage
without increasing the risk of incurring underinvestment costs, and thereby benefit from
additional tax shields (Bartram, 2000). Furthermore, high corporate leverage may induce
managers to engage in high risk projects (asset substitution problem or risk shifting problem)
since if they are successful the shareholders will enjoy most of the gains, whereas the
creditors would bear most of the costs if unsuccessful (Jensen and Meckling, 1976). These
acts can induce agency costs since creditors will demand higher interest rates and/or impose
debt covenants. Risk management will reduce the riskiness of these projects and hence reduce
or avoid the associated agency costs. (Bartram, 2000) In other words, hedging binds a firm‟s
ability to meet its obligations and therefore signals commitment to its creditors, which can
enable value-increasing contracting terms (Bessembinder, 1991).
Using a sample of 372 Fortune 500 non-financial companies in 1990, Géczy, Minton and
Schrand (1997) find that companies that have large growth opportunities but low access to
financing are more likely to hedge currency exposure. This result is line with theory that firms
hedge in order to reduce cash flow volatility which could otherwise lead to underinvestment.
A questionnaire survey of 169 US firms (31,6% response rate) made by Nance, Smith and
Smithson (1993) finds that firms using hedging derivatives have significantly larger R&D
expenditures and that firms with more investment opportunities hedge more often and have
lower leverage, pointing towards the avoidance of underinvestment as a determinant for
hedging. However, Mian (1996), using data disclosed in the 1992 annual reports for 543 US
firms, finds differing results. Using market-to-book-value ratio as a proxy for investment
opportunities, Mian (1996) finds a negative relation between investment opportunities and
hedging which contradicts the underinvestment hypothesis.
Graham and Rogers (2002) finds inconclusive results depending on what measure they use as
a proxy for investment opportunities. When using R&D expenses and book-market ratio they

11
reject the hypothesis that firm‟s hedge in response to underinvestment costs, but when using
the product of the debt and market-book ratios their results are consistent with firms hedging
to minimize underinvestment costs in the presence of growth options. Gay and Nam (1998)
extends previous research by examining the underinvestment hypothesis as a hedging
determinant more closely. They use various proxies for the firm‟s investment opportunity set
and finds consistent evidence for the relation between a firm‟s investment opportunities and
its use of hedging. They also find evidence suggesting that firms with large growth
opportunities hedges more when their liquidity is low and that there is a negative correlation
between derivatives use and the internal generation of cash flows. Gay and Nam‟s findings
strongly support the hypothesis that the willingness to avoid underinvestment problems drives
firms‟ use of hedging instruments. Gay and Nam (1998:68) conclude by saying: “Our results
show that firms can and do use derivatives as one strategy to maximize shareholder value”.
The volatility of cash flows can induce situations where a firm‟s available liquidity is not
enough to meet its obligations. These situations originates transaction costs of financial
distress and the expectation of such costs is determined by the size of these costs multiplied
by the probability of an illiquidity situation arising. (Myers, 1977) Risk management can
increase firm value by reducing the cash flow volatility which decreases the probability of an
illiquidity situation, thus lowering the expected costs of financial distress (Mayers and Smith,
1982). For an illustration, see Appendix 1. The reduction of probability of financial distress
has a second effect by increasing a firm‟s potential to carry debt, which creates further value
increasing tax shields (Smith and Stulz, 1985).
Also with regards to costs of financial distress as a determinant for corporate hedging are the
empirical findings mixed. Graham and Rogers (2002) and Howton and Perfect (1998), find
evidence consistent with firms using derivatives to avoid large expected costs of financial
distress. Mian (1996) does, however, not find any support for the hypothesis that hedging is
undertaken to minimize expected costs of financial distress. Purnanandam (2008) examines
costs of financial distress as a determinant for hedging by investigating more than 2,000 US
firms for the fiscal year 1996-1997. Firstly, he finds that the incentives for hedging increases
with the life of a project, since both the likelihood of financial distress, as well as the expected
losses of default increases with the life of assets. He also finds that firms with high leverage
hedge more, however, the incentives for hedging disappears for firms with very high leverage.
Furthermore, firms that increase their leverage moderately also increase their hedging
whereas firms that leverages up very much decrease their hedging. So, Purnanandam (2008)
finds a U-shaped relation between the level of hedging and expected costs of financial
distress. He also finds a positive relation between the concentration of a firm‟s industry and
the level of hedging when financially distressed.

12
If a firm is subject to a convex tax scheme, a reduction in the volatility of pre-tax income
through risk management can increase the expected after-tax firm value by reducing the
expected tax liability, see Appendix 2 (Smith and Stultz, 1985). A convex tax scheme exists
when the marginal tax rate increases progressively with the size of pre-tax income, but could
also be indirectly induced by tax rules and regulations (Bartram, 2000).
Graham and Smith (1999) analyzed more than 80,000 COMPUSTAT firm-year observations
(US firms) and found that firms face a convex effective tax function in 50% of the cases and
thus have tax-based incentives for hedging. Using a simulation method they find that for those
firms facing a convex tax schedule, a 5% reduction in the volatility of pre-tax income
generates, on average, tax savings of 5.4% of expected tax liabilities; in extreme cases these
savings reached 40%. However, the potential for tax savings is far from equally distributed
among firms. Graham and Smith (1999) find that for 75% of all firms there is little tax-based
incentives to hedge, but in the extreme cases the potential tax savings are substantial. They
also stress the point that the savings potential derived from tax-based hedging is not mutually
exclusive from other hedging incentives such as underinvestment and increased debt capacity.
Graham and Rogers (2002) test if firm‟s respond to two tax-related incentives to hedging.
They test the incentive to reduce income volatility by reducing expected tax liabilities and the
incentive to increase tax-shields and debt capacity through volatility reduction. By examining
442 US firms in 1994 and 1995, they find that, in general, large firms who faces large
expected costs of financial distress, but are not actually in severe distress, hedge more.
Graham and Rogers (2002) finds evidence supporting the theory that firms hedge to increase
debt capacity and tax-shields, but they find no evidence supporting the theory that firms
should hedge in order to reduce expected tax liability when they have a convex tax function.
They believe that the incentives to hedge in response to tax function convexity is to small
relative to other determinants.
However, Nance Smith and Smithson‟s (1993) results does show evidence supporting that
firms hedge to reduce expected tax liabilities, since firms hedge more if they have more
convex tax schedules. The firms that hedge in their study have plenty more tax credits and a
bigger part of their income in the progressive part of the tax schedule. These results are shared
by Howton and Perfect (1998), who also finds that firms hedges to decrease expected tax
liabilities. Contrary to these results, Mian (1996) finds no relation between the use of hedging
instruments and convex tax schedules or tax loss carry forwards.
Agency costs may also arise as a consequence of managers often having an undiversified
wealth position associated with their employment in the firm. This means that managers have
an incentive to secure the ongoing existence of the firm but also to reduce their personal
undiversified exposure through corporate hedging, which may be at the expense of well

13
diversified investors. (Bartram, 2000) On the other hand, if managers are not allowed to
hedge, their risk aversion may lead to underinvestment since managers may reject positive
NPV projects which increase variability (Smith and Stulz, 1985). So, risk management
derived from managerial risk aversion has a value creating dimension in it. Since managerial
risk aversion is derived from their personal utility function, Smith and Stulz (1985) argue that
the level of hedging will be dependent on how managers are compensated. Managers
compensated with stock are more prone to hedging, whereas option compensation may even
entice them to “reverse hedge”, which is why the devising of a managerial compensation plan
is correlated to the firm‟s hedging policy (Smith and Stulz, 1985).
Tufano‟s (1996) investigation of risk management in the North American gold mining
industry does not find any relationship between derivatives use and the theories of value
maximizing risk management. His findings are however in line with Smith and Stulz‟s (1985)
theories; in that his evidence shows that the more options the management own, the less risk
they manage and the more shares they own, the more risk they manage. Both Graham and
Rogers (2002) and Knopf, Nam and Thornton (2002) find a positive relation between the level
of hedging and the value of managers‟ stock and option portfolios. Furthermore, Knopf, Nam
and Thornton (2002) also find that as stock return volatility increase firms hedge less,
something that Graham and Rogers (2002) tests for but finds no supportive evidence. On the
other hand, neither Gay and Nam (1998) nor Géczy, Minton and Schrand (1997) find any
evidence that supports the theory of Smith and Stulz (1985).
Spanó (2007) gathered information on 443 UK non-financial firms over 1999 and 2000 from
financial statements. He looks at the relationship between hedging and managerial ownership
using a different hypothesis than previous research: “managerial risk aversion is an incentive
to deviate from optimal hedging position” (Spanó, 2007:1245). Spanó (2007) finds that the
actual decision to implement a hedging program is rather based on other factors, aimed at
enhancing shareholders‟ wealth (i.e. underinvestment costs, financial distress costs and
expected tax liabilities). However, his findings show evidence that managerial motivations are
central to decide the firm‟s risk profile, which lead to suboptimal derivatives usage. Where
managers‟ wealth is directly linked to firm value, the firm‟s hedging position often deviates
from perfect balance, systematically generating gains and losses. Furthermore, Spanó (2007)
provides empirical evidence showing that firm‟s who are exposed to takeover risk uses
hedging derivatives in a manner designed to prevent a takeover rather than increasing firm
value.
Allayannis and Weston (2001) are the first to empirically investigate if there is a direct
relation between hedging activities and firm value. Using Tobin‟s Q as a proxy for firm value,
they investigate 720 non-financial US firms between 1990 and 1995. Their focus lies on the
subsample that is constituted by firms having a foreign currency exposure through foreign
sales, in order to investigate differences in firm values depending on whether they hedge this
exposure or not. Indicative univariate tests show higher mean values of Q being awarded to

14
those firms who hedge their foreign currency exposure. Thereafter, Allayannis and Weston
(2001) conduct multivariate tests, in which other factors suggested by theory to influence the
Q value are controlled for. For those firms that are exposed to foreign exchange rate risk, they
find a positive relation between currency hedging and firm value which suggests that those
firms who actively manages their exposure are awarded a premium of 3.6%-5.3% of firm
value. Allayannis and Weston (2001) are also able to show that a value premium for currency
hedging is being awarded during times of dollar appreciation as well as during times of dollar
depreciation. The premium is however much larger during times of dollar appreciation.
Furthermore, their findings reveal that when firms initiate hedging programs their firm value
increases in relation to those firms who stay unhedged and when firms terminate their hedging
programs they are penalized by a reduction in value in relation to those firms who remain
hedged. This further strengthens their multivariate test findings of a value premium being
awarded for hedging currency exposure. Allayannis and Weston (2001) concludes that, on
average, for firms who are exposed to foreign exchange rate risk, investors awards those firms
that hedges this risk with a 4.87% value premium.
Carter, Rogers and Simkins (2002) aims to complement the study done by Allayannis and
Weston (2001) by not only showing that hedging adds value, but also trying to determine the
source of this added value. They do this by examining the effects of jet fuel hedging
(commodity price risk) on the value of US airlines. They choose the airline industry because
their investment spending is positively correlated with the costs of jet fuel and the fact that
airlines face significant costs of financial distress. This means that Carter, Rogers and Simkins
have chosen their sample industry because it fits the theory that hedging adds value through
the reduction of underinvestment. They follow the methodology in Allayannis and Weston
(2001) and their results show that hedging jet fuel adds value to airlines, a premium of 12-
16%. Carter Rogers and Simkins are also able to show a positive correlation between changes
in hedging policies and changes in firm value. Their results show that the added value from
hedging increases when firms increase capital investment; they therefore mean that jet fuel
hedging allows airlines to invest even in periods with high jet fuel prices, hence reduces
underinvestment.
Graham and Rogers (2002) tests two tax-related incentives to hedge and from there try to
derive the associated increase in firm value. More specifically, they aim to test if a sample of
442 US firms with assets greater $ 150 million respond to “the incentive to reduce volatility,
thereby increasing debt capacity and the tax benefits of debt, and the incentive to reduce
expected tax liabilities by reducing the volatility of taxable income” (Graham and Rogers,
2002:815). Graham and Rogers (2002) find that hedging leads to larger debt capacity, on
average by 3%. This translates to a capitalized value of the incremental tax shields of 1.1% of
the firm‟s market value of assets.
Traditional theories of risk management derive the usage of hedging instrument from various
market imperfections or managerial incentives and are aimed towards reducing cash flow
volatility. Nain (2005) says that in these theories, the determinants of why firms hedge is
15
studied in isolation from its industry. Nain argues that a firm‟s incentive to hedge is largely
affected by the hedging decisions made by its competitors, using the following rationale. If an
unhedged industry experiences a cost shock they will adjust their profit maximizing output,
meaning that industry output prices will co-vary with costs. This means that in an industry
where most firms hedge their input prices, output prices will not vary with cost shocks,
meaning that an unhedged firm in this industry will face the cost shock without being able to
offset the shock by adjusting output prices. On the other hand, in a largely unhedged industry
a hedging firm will face certain input costs but uncertain output prices since their competitors
will adjust prices according to costs. Thus, “unhedged firms in a largely hedged industry have
more volatile profits than hedged firms” and “in largely unhedged industries, hedged firms
have more volatile profits than unhedged firms” (Nain, 2005:2). Nain therefore argues that the
hedging decision made by a firm‟s competitors should be an important determinant for the
firm‟s own hedging decision. Nain‟s results show that in non-hedging industries, a 10%
depreciation of the dollar, increasing the costs of imported inputs, is passed through to output
prices which rise by 1,8%. However, if half of the industry hedges, the output prices only
increase by 0.9%. Based on these results, Nain finds that the foreign exchange rate exposure,
and therefore volatility, increase for unhedged firms and decreases for hedged firms as the
general industry level of hedging increases. Nain (2005) concludes by investigating the
hedging premium on firm value conditional on the level of hedging in the industry. In contrast
to earlier empirical research on the effects of currency hedging on firm value, Nain finds no
value effects for neither hedged nor unhedged firms in largely unhedged industries. However,
in industries where hedging is widespread Nain finds that unhedged firms are valued lower
than hedged firms, measured by Tobin‟s Q. Nain (2005) argues that unhedged firms in hedged
industries suffer value discounts and that the propensity to hedge foreign exchange rate risk is
greater if many competitors are hedging.
The paper written by Kim, Mathur and Nam (2006) examines the relation between operational
and financial hedging and their effect on firm value. They mean that an operational hedging
strategy will decrease the volatility of cash flows in much the same way as financial hedging
and should therefore increase firm value. They use a sample of 424 US firms during 1996-
2000 and find evidence that those firms that are not operationally hedged use more financial
hedging and that firms with foreign activity use less financial hedging than exporting firms.
Kim, Mathur and Nam (2006) further find a positive relation between operational and
financial hedging meaning that the different hedging strategies are complementary. Finally,
their regressions show positive firm value effects for both financial and operational hedging.
Specifically, they find a financial hedging premium of 5.4% and that operational hedging
increase firm value by 4.8-17.9%.
In Allayannis, Lel and Miller (2007), a broad sample of firms from 39 countries between 1990
and 1999 are examined as to whether hedging add value in this more international context and
more specifically if differences in corporate governance structures has an effect. Initially, they
present evidence suggesting a value premium being awarded to firms engaging in risk
management around the world. They find this premium to range between 9% and 20% for
firms that are exposed to exchange rate risk. This is substantially higher than the 4.8%

16
premium awarded to US firms in the findings of Allayannis and Weston (2001) and is
explained by the authors to be plausible since non-US firms face much higher exposure
caused by significantly higher exchange-rate volatility in non US currencies. Next,
Allayannis, Lel and Miller (2007) find that firms with strong internal corporate governance
are awarded higher premiums for their hedging, whereas firms with weak internal corporate
governance are not awarded any hedging premium but are not value-destroying either. In
terms of the external corporate governance system, Allayannis, Lel and Miller (2007) find
evidence suggesting that firms residing in countries with strong shareholder rights, strong
creditor rights, or Anglo-Saxon legal origins are creating more value from hedging than firms
residing in countries with weak external corporate governance. Lastly, they find that the
impacts of weak external corporate governance cannot be compensated for by good internal
governance, but the impacts of weak internal governance can be mitigated by having a strong
external corporate governance system. These findings therefore leads Allayannis, Lel and
Miller (2007) to draw the conclusion that a strong legal environment and country-level
governance hinders managers to conduct risk management activities that would only benefit
themselves. Furthermore, the results suggest that both firm-level and country-level corporate
governance play a significant role in understanding when risk management is associated with
higher value.
In 1996, Alkebäck and Hagelin (1999) sent out a questionnaire to all non-financial firms on
the Stockholm Stock Exchange, of which 76.6% (163 firms) responded, with the ambition to
investigate the derivatives use in Sweden. The survey was then compared to similar studies
conducted on the US and the New Zealand market. The first findings concluded that more
firms hedge in the smaller economies of Sweden (52%) and New Zealand (53%) than in the
USA (39%). Alkebäck and Hagelin (1999) find that these smaller open economies which
import and export more than the USA suffer from a higher macroeconomic exposure with
higher volatilities in both exchange rates and interest rates, providing larger incentives for
hedging. In all three countries it was found that larger firms hedge more than medium and
small ones. This relationship was, however, more pronounced in Sweden than in the USA and
could, according to the authors indicate that it is more costly to initiate a hedging program in
Sweden than in the USA. In Sweden, the biggest concern of the financial directors was that
the firm lacked knowledge about derivatives, and this concern was most widespread among
the smaller firms. Since this issue was of small concern to the American financial directors,
coupled with the more prevalent relationship between hedging and firm size in Sweden,
Alkebäck and Hagelin (1999) agues these are consequences of Sweden having a less mature
derivatives market. It was further found by Alkebäck and Hagelin (1999) that Swedish firms
mainly use derivatives for hedging purposes and in those cases where speculation or arbitrage
activity was ventured into, it was mostly conducted by large firms. Another interesting finding
by Alkebäck and Hagelin (1999) is that among the responding Swedish firms, it was almost
equally common to hedge translation exposure as it was hedging transaction exposure.
17
Hagelin (2003) sets out to investigate the determinants of hedging decisions on the Swedish
market as well as to analyze what type of foreign exchange exposure that firm‟s hedge. He
investigates the behavior of 101 (63% survey response rate) Swedish non-financial listed
firms in 1997. The first pattern that Hagelin (2003) notices is that larger firms hedge more
using currency derivatives, which suggests a presence of fixed costs associated with hedging
excluding small firms from the market. Hagelin‟s (2003) main findings show that Swedish
firms using currency derivatives to hedge transaction exposure do so in order to mitigate
indirect costs of financial distress and to diminish the underinvestment problem. He further
notes that there is no relation between the alleviation of these problems and hedging of
translation exposure. So, the results of Hagelin‟s survey is that Swedish firms use currency
derivatives to hedge transaction exposure in order to improve firm value whereas this reason
is not the answer as to why firms hedge translation exposure.
In 2003, Alkebäck, Hagelin and Pramborg (2006) conducted a very similar survey as the one
conducted by Alkebäck and Hagelin (1999) for 1996. The purpose is to investigate how the
use of derivatives in Swedish firms has developed over the seven years that separates the two
surveys. They achieved a 51.3% response rate by receiving answers from 134 non-financial
firms, all listed on the Stockholm Stock Exchange. The share of firms using derivatives
increased from 52% in 1996 to 59% in 2003. Increased use of hedging instruments by small
and medium sized firms accounted for the biggest part of the total increase. In 2003, foreign
exchange rate hedging is the most prevalent use of derivatives before hedging of interest rate
exposure, as was the case in 1996. The findings also show that almost all hedging firms use
currency derivatives, whereas interest rate hedging is limited to large firms. Alkebäck,
Hagelin and Pramborg (2006) find that in 2003, 53% of the hedging firms hedges translation
exposure, which is less than in 1996 but more frequent than in other countries. They see this
as evidence that the Swedish firms‟ derivatives use may be conforming to how firms in other
countries use derivatives. Furthermore, lack of knowledge about derivatives is no longer the
issue of greatest concern in 2003 for financial directors; instead they now mostly worry about
accounting treatment, transaction costs and liquidity. Alkebäck, Hagelin and Pramborg (2006)
interpret this as a sign of generally increased knowledge about derivatives amongst Swedish
firms.
Hagelin et al. (2007) further uses three questionnaire surveys concerning the years 1998-1999
and 2000-2001, sent to Swedish non-financial firms with an average response rate of 53%, in
order to examine the impact on firm value from hedging decisions based on management
stock option plans. Initially, Hagelin et al (2007) finds a positive relationship between
derivatives use and the price sensitivity of managerial stock options and also weak evidence
saying that as the sensitivity of managerial stock options to stock return volatility increase,
firms hedge less. These findings are in line with the findings of Knopf, Nam and Thornton
(2002) and the predicting theories of Smith and Stulz (1985).
Moreover, the results of Hagelin et al. (2007) shows that hedgers have higher valuations than
non-hedgers but are careful to draw the conclusion that it is hedging that causes an increase in
firm value. However they do find that managers who pursue hedging based on the price

18
sensitivity of managerial stock options significantly decrease firm value. Finally, Hagelin et al
(2007) looks at other determinants of hedging in Sweden and finds no support for the costs of
financial distress hypothesis, nor is evidence found supporting that Swedish firms are hedging
to increase debt capacity end thence interest tax-shields. Their conclusion is therefore that the
general relationship between firm value and hedging is yet to be proved, but that hedging on
the basis on management self-interest is clearly value reducing.
The paper written by Pramborg (2004) aims to investigate the effects on firm value from
geographical diversification, net exposure and hedging activity. Pramborg‟s paper further
wants to add to the findings of Allayannis and Weston (2001) by examining whether there is a
difference in value effects between transaction exposure and translation exposure. The sample
used in this study comes from three different questionnaires, the first used by Hagelin (2003),
the second used by Hagelin and Pramborg (2002), the third sent by Pramborg in 2001, and
contains Swedish non-financial firms listed on the Stockholm Stock Exchange for the period
1997 – 2001. The response rate was 63%, 47% and 49% respectively and sums up to 455 firm
year observations. Pramborg‟s results show a premium being awarded to firms that are
diversified geographically and hedges. He fails however to separate between geographical
diversification and hedging as being the source of value creation. His investigation further
shows that transaction exposure hedging adds value, whereas translation exposure hedging
may generate a value discount. Pramborg‟s last results show that firms with long positions in
foreign currency have higher value, something which may however be explained by a
depreciation of the Swedish krona during the sample period.
In Table 2.1 we present a summary of the findings on determinants of hedging, grouped on
the basis of the underlying theory. In Table 2.2, a summary covering the studies concerning
value creating risk management is presented.

19
Table 2.1: Determinants of risk management
Authors Time period Region of Study Methodology Sample size Relation to theory
Underinvestment
Géczy, Minton and
Schrand (1997)
1990 USA Multivariate
regression
372 Positive
Nance, Smith and
Smithson (1993)
1986 USA Questionnaire
survey
169 Positive
Mian (1996) 1992 USA Multivariate
regression
543 Negative
Graham and
Rogers (2002)
1994-1995 USA Multivariate
regression
442 Inconclusive
Gay and Nam
(1998)
1995 USA Multivariate
regression
325 Positive
Hagelin (2003) 1997 Sweden Questionnaire
survey/Regression
101 Positive
Costs of Financial Distress
Graham and
Rogers (2002)
1994-1995 USA Multivariate
regression
442 Positive
Howton and
Perfect (1998)
1994 USA Multivariate
regression
469 Positive
Mian (1996) 1992 USA Multivariate
regression
543 None
Purnanandam
(2008)
1996-1997 USA Simulation >2,000 U-shaped
Hagelin (2003) 1997 Sweden Questionnaire
survey/Regression
101 Positive
Hagelin et al.
(2007)
1998-2001 Sweden Questionnaire
survey/Regression
308 observations Negative
Tax Incentive
Graham and Smith
(1999)
1980-1994 USA Simulation >80,000 firm-
years
Positive
Graham and
Rogers (2002)
1994-1995 USA Multivariate
regression
442 Negative
Nance Smith and
Smithson (1993)
1986 USA Questionnaire
survey
169 Positive
Howton and
Perfect (1998)
1994 USA Multivariate
regression
469 Positive
Mian (1996) 1992 USA Multivariate
regression
543 Negative
Managerial wealth and risk aversion
Tufano (1996) 1990-1993 North America Multivariate
regression
45 Positive
Graham and
Rogers (2002)
1994-1995 USA Multivariate
regression
442 Positive
Knopf, Nam and
Thornton (2002)
1996 USA Multivariate
regression
260 Positive
Gay and Nam
(1998)
1995 USA Multivariate
regression
325 Negative
Géczy, Minton and
Schrand (1997)
1990 USA Multivariate
regression
372 Negative
Spanó (2007) 1999-2000 UK Multivariate
regression
443 Positive
Hagelin et al.
(2007)
1998-2001 Sweden Questionnaire
survey/Regression
308 observations Positive

20
Table 2.2: Value creation from risk management
Authors Period Region Methodology Sample size Exposure Value premium
Allayannis and Weston (2001)
1990-1995
USA Multivariate regression
720 Exchange rate 4.87%
Carter, Rogers and Simkins (2002)
1994-2000
USA Multivariate regression
27 Commodity price 12-16%
Graham and Rogers (2002)
1994-1995
USA Multivariate regression
442 Exchange rate and interest rate
1.1% of assets
Nain (2005) 1997-1999
USA Multivariate regression
3,080 observations
Exchange rate Conditional on industry
Kim, Mathur and Nam (2006)
1996-2000
USA Multivariate regression
424 Exchange rate 5.4% financial 4.8-17.9% operational
Allayannis, Lel and Miller (2007)
1990-1999
39 countries
Multivariate regression
378 Exchange rate 9-20%
Pramborg (2004) 1997-2001
Sweden Questionnaire survey
455 observations
Exchange rate 13.8%
The theories supporting risk management are solid frameworks that have provided a
foundation for prior studies. Researchers have conducted a large number of empirical studies,
but inconsistencies in findings still exist which to some extent may question the validity and
reliability of prior studies.
Regarding the determinants risk management the overall results points in the same direction
and supports underinvestment, cost of financial distress, tax incentives and managerial wealth
and risk aversion, as determinants of risk management (see Table 2.1). Even if the majority of
the results are unified, some studies still fail to support the theories with empirical findings.
The natural question arising from our perspective is why some studies manage to strengthen
the theories, while other fails. As the majority of the studies still strengthen the theories, the
most likely explanations lies in dissimilarities regarding the empirical methodology and proxy
variables used in the empirical research. For an example, the studies covering tax incentives
have differentiated methods of approaching the issue. Graham and Smith (1999) classify
companies based on convexity in the tax functions and use a simulation to determine the
potential effects, which supports the theory on tax incentives as a determinant of value
creation. Conversely, Graham and Rogers (2002) find no evidence that firm‟s hedge to reduce
the expected tax liability by using a random sample of 442 firms where the tax convexity is
tested explicitly through multiple regressions. The comparison between the two studies
illustrates that differences exists in sample selection and methodology, which would influence
the results and bias the findings.
Additionally, studies use different proxy variables which may be a source of divergence and
bias the results. Empirical studies covering underinvestment as a determinant of risk
management further strengthen the inconsistencies in findings, which may be affected by the
choice of variables. For an example, Géczy, Minton and Schrand (1997) measure investment
21
opportunities through market-to-book, whereas Nance, Smith and Smithson (1993) measure it
through R&D expenditures and come to the same conclusion. Conversely, Graham and
Rogers (2002) findings show opposing results for two different proxy variables, both
measuring investment opportunities. Different proxy variables may generate the same results
which indicate that different variables may converge, but could also be the source of
inconsistencies. In fact, the use of proxy variables is not a precise science, but rather rough
approximations to capture a phenomenon in practice.
The theories predict that risk management is value enhancing and the prior research confirms
that firms hedging exchange rate risk creates value (see Table 2.2). The overall findings from
the studies presented in the literature review suggest a premium ranging from 1.1% to 20%,
which is a large dispersion considering that all studies covers equivalent risk management
activities. The methodological approaches are very similar in the majority of the studies,
suggesting that the differences are attributed to other sources, e.g. sample, time period and
contextual setting.
The most prominent weakness is the wide dispersion of the premium size, which questions the
universality of the results and the underlying factors contributing to the premium. Most
studies have been conducted in the US and are dependent on the contextual prerequisites.
Studies covering other countries, such as Allayannis, Lel and Miller (2007) and Pramborg
(2004), find significantly higher premium. This enlightens the importance of distinguishing
between contextual settings in order to increase the predictability of when risk management is
value enhancing.
Moreover, prior studies measure the value creation from risk management over a combined
time period, which we consider as a limitation because of two reasons. First, time bound
differences in value creation may exist and previous research focus on determining the
influence from only appreciation and depreciation by rather simplistic methods (see
Allayannis and Weston (2001)). We argue that other influential sources may exist and that the
time bound differences has to be taken into account through more sophisticated models in
order to increase the accuracy and determining the influence from risk management.
Secondly, through bundling years with different characteristics and exchange rate movements,
the findings fail to show whether it is actually the decreased volatility that is value creating, or
if other factors influence. We argue that, in order to in a convenient manner prove that risk
management is value creating in the long-term, there is a need for filtering out distortions
from other factors through a more refined approach.
Few prior studies have tried to establish the link between value creation and the actual source.
Carter, Rogers and Simkins (2002) find a premium from hedging commodity price risk in the
airline industry which is derived from mitigation of the underinvestment problem. Besides
their findings, previous research focuses on either the determinants or the actual value
creation. We argue that there might be potential differences between the determinants and the
actual source of value creation.

22
The method provides a detailed description of the methodology used to conduct the study. We
describe the research approach, data collection, processing of data, regression models and
the variables used. Furthermore we provide an analysis of our regression model and
critically evaluate the validity and reliability of the study.
Researchers have examined both determinants of risk management and value creation, but
inconsistencies still exist. Allayannis and Weston (2001) performed their study in a different
context; while Pramborg (2004) based their findings on survey results. Neither of these
studies comprehensively elaborates on the difference between years or the sources of value.
Thus, suggesting further elaboration on the subject is necessary to reach consistency whether
risk management is rewarded with a value premium or not. The methodological process
behind this study rests on a rigorous literature review, regarding both theoretical and
empirical work. The research approach can be described as a deductive approach where the
hypothesis is derived from theoretical considerations and the empirical data collected in
accordance with the formulated hypothesis (Bryman, 2003). By deducting the hypothesis
from theory we aim for contribute to the empirical work on risk management theories and
provide insightful evidence regarding value creation and risk management in Sweden.
The primary research question, derived from theory, is whether risk management creates
value when hedging with currency derivatives and if differences exist over time. It is
important to stress early on that even if currency derivatives are the most commonly used
derivative, the use of other risk management activities may contribute to the hedging
premium. Other studies have concluded that the premium found from investigating the use of
currency derivatives could therefore be regarded as a proxy for the overall risk management,
see Allayannis and Weston (2001) and Allayannis, Lel and Miller (2007). The secondary
research question relates to the sources of why risk management enhances firm value, where
our intention is to identify the main sources of value creation, which may differ from the
reasons/determinants of why a firms use currency derivatives that has been thoroughly
examined by other researchers.
In order to examine the potential value creation from the usage of currency derivatives and the
source of the value, an extensive set of data is required. Previous studies examining
determinants of risk management and value creation and have relied on secondary data from
databases/annual reports (e.g. COMPUSTAT), primary data from surveys or a combined

23
approach.1 The main problem posed by previous researchers regarding data collection, is that
annual reports and databases do not disclose whether the companies are hedging or
speculating. A survey could reveal whether a firm hedges or speculates and enhance the
accuracy of the data. On the other hand, surveys have several deficiencies. The most
important aspect is respondents falling off and introducing skewness in the sample (Bryman,
2003). Alkebäck, Hagelin and Pramborg (2006) achieved a response rate of 51.3% on the
Swedish market which according to Bryman (2003) is weak. Pramborg (2004) also
experienced a rather moderate response rate. In regards to the large fall offs in previous
studies and the risk for systematic errors or skewness in the sample, a survey could undermine
the reliability of the results. Our method of collecting data is based on secondary sources. We
use DataStream and annual reports to collect key variables, enabling us to include the entire
population.2 Regarding the issue if firm´s use derivatives to speculate or hedge, we rely on
previous research, which suggests that firms are hedging with derivatives and not speculating
(Alkebäck, Hagelin and Pramborg, 2006) and (Allayannis and Ofek, 2001).
The sample in this study consists of the firms listed on the Large Cap and Mid Cap lists of the
Stockholm Stock Exchange. The total amount of listed stocks is 161 when including all
companies. However, Swedish companies are allowed to use multiple share classes, and in
order to filter out the duplicates, we eliminate the A-class shares which are traded on
somewhat different terms. This reduces our sample to 134 unique firms. Furthermore our
sample requires that disclosure standards are fulfilled and consistency within the chosen time
period, which constraints the available period to study. Disclosure requirements, accounting
techniques and valuation of derivatives changed with the introduction of IFRS/IAS in January
2005. The standard, IAS 39, changed the fundamentals of disclosure from nominal values to
fair values of derivatives. Furthermore the new standards require the company to account for
the fair values on the balance sheet and the net change in value has to be accounted for in the
income statement. The implications regarding disclosure, capital structure and earnings,
motivates our choice of studying 2005-2008. It constitutes a natural cut-off point in time.
Except from selecting our sample based on listing and time related aspects, several other
factors have to be taken into consideration. First off, we are interested in non-financial firms.
Financial firms and banks are market makers and have dissimilar objectives with their usage
of derivatives compared to non-financial firms (Allayannis and Weston, 2001). When
excluding banks and financial services, our sample shrinks to 118 firms. Other researchers
that conducted studies with the same approach excluded small firms based on the assumption
1 Older studies mostly used surveys due to the weak disclosure of appropriate information. Examples of studies
using surveys: Nance et al. (1993), Alkebäck and Hagelin (1999), Haushalter (2000) and Alkebäck et al. (2006).
Example of a study using secondary sources: Allayannis and Weston (2001). Example of a combined approach:
Hagelin (2003). 2 DataStream is a database from Thompson that provides company specific data.

24
that the fixed costs of initiating a risk management outweighs the benefits for small firms
(Géczy, Minton and Schrand (1997). Allayannis and Weston (2001) excluded firms with total
assets below $500m, which represents approximately a firm value of SEK 4,000m. However,
based on previous findings on the Swedish market we lower the requirement regarding market
value. The usage of derivatives in Sweden has increased among small and medium sized
firms, Alkebäck, Hagelin and Pramborg (2006) conclude that 89% of the large firms
(>$250m), 68% of the medium sized companies ($50m-$250m) and 34% of the small firms
(<$50m) use currency derivatives. Their research provides the empirical foundation for our
sample selection and motivates that our sample is applicable. The lowest market value on mid
cap should correspond to the medium sized firms, suggesting that all of the firms in our
sample should be able to deploy a risk management program, without any constraints. If
investors are recognizing this aspect, an exposed firm of sufficient size could be traded at a
discount for not having risk management activities. Moreover, we excluded 10 firms based on
missing information. The excluded companies have been examined individually and we do
not recognize any patterns that might distort the sample, see Appendix 3 for a complete list.
The sample ends up with 108 unique firms and 402 firm-years (unique observations), a total
of 15% drop off.
Building a regression model is a complex task. The dependent variables in the model must
correspond to the underlying theoretical framework, but at the same time meet the statistical
requirements (Brooks, 2008). With regards to measuring value creation, the regression models
used by Allayannis and Weston (2001) provide the foundation, even if the variables in the
model have been slightly modified to better suit our study. Regarding the source of value
creation, we develop our own framework through elaborations on the main model.
The data used in our investigation has the characteristics of panel data, the data consists of
both time-series and cross-sectional observations (Damodar, 2004). The use of panel data has
several distinct features which may be favorable. First, it takes the heterogeneity of the
observations into account and introduces techniques to control potential differences over time
and space. Second, it enhances the efficiency of extracting information from the data by
allowing for variability, decreasing multicollinearity among the explanatory variables and
increasing the degrees of freedom (Brooks, 2008). Although the benefits are appealing, panel
data also has drawbacks. Baltagi (2005) argues that short time-series is a limitation because
the results would heavily rely on the proportion of companies tending to infinity, thus
reducing the predictability into infinity. By using panel data we increase the explanatory
power, but at the same time many of the time-series are incomplete (missing yearly
observations) which may bias the results.
Moreover, Brooks (2008) argues that the easiest way to perform an analysis of panel data is
by pooling the data and run pooled regressions using ordinary least squares (OLS). Although,
pooling data does not take the autocorrelation into account. In financial econometrics this is a

25
common problem which has to be considered; otherwise the inferences may be invalid and
not pass the prerequisites for using OLS (Brooks, 2008).
The main research question is whether risk management is value creating or not and trying to
pinpoint differences between the years. Hence, we need an approach that accounts for the
problems with missing values in the time-series, industry effects, time effects and
autocorrelation. We use a two folded approach by conducting both yearly cross-sectional
regressions and panel data fixed effects regressions. The first set of regressions enlightens
dissimilarities between the years, while the second approach accounts for the heterogeneity of
the specific firms in the sample. The panel data regression also provides a robustness check to
the overall results.
Regarding the source of value creation, we use four different regressions with fixed effects,
where the dependent variables correspond with the theoretical assumptions on value creation
and risk management (underinvestment, financial distress, debt capacity and managerial risk
aversion).
An important aspect of this study is the variables we have chosen to examine if currency
hedging is value enhancing. When analyzing complex economical problems, the goal is to
obtain a high degree of determination in the models and significant results which corresponds
to the theory supporting the hypothesis. The variables included in our model correlates well
with similar previous studies, see Allayannis and Weston (2001) and Jin and Jorion (2006).
In the regression models concerning value creation, we use Tobin´s Q as the dependent
variable. In order to analyze the theoretical framework of why risk management is value
creating, we use four different dependent variables: R&D and capital expenditures (CAPEX)
divided by sales (underinvestment), net income divided by total assets (financial distress),
debt-to-equity (debt capacity) and CEO ownership (managerial risk aversion).
In order to examine the value creation of using currency derivatives we use Tobin´s Q as an
estimation of firm value, which is the dependent variable in the regressions. Tobin´s Q was
introduced by Tobin (1969) with the intention to capture a firm´s tendency to invest (Dadalt et
al, 2003). Tobin´s Q is a very functional measure and has been used in various purposes, such
as multinationality (Morck and Yeung, 1991), diversification effects (Lang and Stulz, 1994),
examining board sizes (Yermack, 1996) and hedging premiums (Allayannis and Weston,
2001).Tobin´s Q is defined as the market value of the firm in relation to the replacement cost
of assets (Perfect and Wiles, 1994), see Equation 1.

26
Tobin´s Q = Market Value of Assets
Replacement Value of Assets (1)
There are several approaches developed to calculate Tobin´s Q, either by using a simple
algorithm as Chung and Pruitt (1994) or a more comprehensive approach as Perfect and Wiles
(1994). We use the simple algorithm for measuring Q developed by Chung and Pruitt (1994).
This method has several advantages: relatively low computational cost, data availability and a
high correlation with other more comprehensive approaches (Chung and Pruitt, 1994).
Furthermore, Dadalt, Donaldson and Garner (2003) conclude that unless extreme precision is
required, the simple approach is more favorable. Chung and Pruitt (1994) formula is described
in Equation 2.
Tobin´s Q = MV Equity +Preferred Stock +BV Debt +Current liabilities −Current ass ets
BV Total Assets (2)
An important issue to stress is the interpretation of the Q. Tobin (1969) suggests that a firm
with a Q higher than 1 benefits from investing in new assets and will receive higher market
valuation, while firms with a Q lower than 1 disfavors from investing. A firm with a Q lower
than 1 implicitly suggests a low market value and a Q greater than 1 indicates that a firm has
profitable growth opportunities. The market value of equity is the main determinant in the
numerator, which highlights the importance of pinpointing factors influencing the market
value of a company in the regression model. Furthermore, we use the natural logarithm of the
Q to adjust the skewness and increase the linearity. Allayannis and Weston (2001) argue that
the natural logarithm of Q translates the slope coefficients in the regression model to
comparable figures, where the coefficient of hedging corresponds with the effect on Q
described as a percentage of Q.
The potential sources of value creation from risk management are tested through four separate
regressions. Regarding underinvestment, we use the natural logarithm of the sum of R&D
expenditures and CAPEX divided by total sales, see Equation 3 (for further motivation of this
ratio see „3.4.3 Control variables‟).
Underinvestment = ln R&𝐷+𝐶𝐴𝑃𝐸𝑋
Total sales (3)
Regarding the measurement of financial distress, there are a vast number of models available.
Shumway (2001) compares different credit scoring models, for example the Altman z-score
model and the hazard model. One interesting finding in his study is that net income divided by
total assets (NI/TA) is a fairly decent estimator of bankruptcy risk. The ratio classifies 56.7%
of the firms going bankrupted in the highest probability decile, while the Altman z-score only
classifies 42.3%. Based on Shumway´s findings, we measure the risk of financial distress
through NI/TA as the dependent variable, see Equation 4.
Risk of financial distress = Net income
Total assets (4)

27
Adding value through reduction of expected tax liability is not possible in Sweden (no
progressive tax scheme). On the contrary, risk management may increase the debt capacity
and affect the firm value positively through additional tax-shields. We use the D/E ratio as the
dependent variable to examine if companies that are hedging are utilizing this feature, see
Equation 5.
Debt capacity = Book value of debt
Book value of equity (5)
The last value creating aspect, or value destroying, is managerial risk aversion. The dependent
variable used to capture the impact of managerial risk aversion is the natural logarithm of
CEO ownership (number of shares times share price) divided by the market value of the
company, see Equation 6. With regards to the difficulties examining options, we refer to the
findings of Hagelin et al. (2007) and will not examine this aspect.
Managerial risk aversion = Number of shares owned by CEO ∙Share price
Market value of equity (6)
In order to create an understanding and motivation for how and why we define the variables
related to risk management and value creation, we thoroughly described the regressors
intended to capture these effects. To determine the exchange rate exposure of a company we
use foreign sales to total sales, see Equation 7.
Exchange rate exposure = Foreign sales
Total sales (7)
Allayannis and Ofek (2001) suggest that this ratio has a positive relation to a firm‟s exchange
rate exposure, which is supported by Géczy, Minton and Schrand (1997). To capture the
hedging activity by a company, most researchers use a foreign currency derivatives dummy,
only classifying hedgers and non-hedgers.3 Allayannis and Weston (2001) actually record the
notional principals of the derivatives, in order to measure hedging activity by dividing
notional value with foreign sales. However, this approach overstates the actual hedging ratio
(Guay and Kothari, 2003). Furthermore, Swedish firms complying with IAS 39 only report
the fair value which is considered to be a weak measurement of the level of hedging. To
approximate the actual level of risk management we use a foreign currency derivative (FCD)
dummy that equals one if the firm hedge with currency forwards, options, swaps or futures to
manage currency risk and zero otherwise. This allows us to distinguish hedgers from non-
hedgers with and without foreign exchange rate exposure. All the information needed to
examine the hedging activity has been collected by reviewing annual reports, along with
additional facts.4 The FCD dummy is also the main variable in the regressions aiming at
3 See, Allayannis and Weston (2001), Pramborg (2004) and Allayannis and Miller (2004).
4 Data from annual reports: currency derivatives, interest rate derivatives, segments, shares owned by CEO and
option program deployment. Company specific data from Datastream: book value of assets, capital expenditures,
current assets, current liabilities, book value of long-term debt, book value of debt, book value of equity, net

28
locating the source of value creation. The variable is expected to influence the dependent
variable positively, except for the regression covering managerial risk aversion.
The value of a firm is influenced by an extensive set of factors. In order examine if the use of
currency derivatives is value enhancing, we need to control for other factors influencing firm
value. The main framework used to establish which variables to include follows Allayannis
and Weston (2001), although with modifications. We use the same control variables in the
regressions examining the sources of value creation.
Firm size: Several studies have concluded that large firms are more likely to hedge compared
to smaller firms, because of the initial costs associated with a hedging program, see Mian
(1996) and Nance, Smith and Smithson (1993). The positive correlation between firm value
and hedging activity may be dependent on a positive correlation between firm value and size
(research is ambiguous regarding this matter). To capture the potential effect of size we use
the natural logarithm of total assets, see Equation 8.
Size = ln(total assets) (8)
Investment opportunities: Previous research has shown that firms actively hedging often
experience greater investment opportunities (Géczy, Minton and Schrand, 1997). A firm with
significant investment opportunities are perceived as attractive investments hence receives
higher valuations. Allayannis and Weston (2001) use the ratio CAPEX over sales and R&D
expenditures scaled by total sales, to measure investment opportunities. We bundle R&D and
CAPEX and divided it with total sales (R&DCAPEX ratio), see Equation 9. Another approach
to measure growth opportunities is to use market-to-book of assets. But this ratio is highly
correlated with Q and distorts the regressions and therefore we discard this approach.
Investment opportunities = R&𝐷 𝑒𝑥𝑝𝑒𝑛𝑑𝑖𝑡𝑢𝑟𝑒𝑠 +𝐶𝐴𝑃𝐸𝑋
Total sales (9)
Diversification effects: Lang and Stulz (1994) suggest that industrial diversification influences
firm value negatively. To control for diversification effects we use a diversification dummy
that equals 1 if the company is active in more than one segment (from annual reports).
Furthermore we control for geographic diversification effects through foreign sales divided by
total sales. Allayannis and Weston (2001) suggest that multinationality should be positively
related to firm value. A company that is geographically dispersed may benefit from lower risk
and greater potential for growth. Pramborg (2004) find that diversification is associated with a
higher valuation in the Swedish market.
income, book value of inventory, interest payments, net income, sales, foreign sales and R&D expenditures.
Furthermore we collect information about dividends, dividend yields, share prices and the market value of
equity. All values are year-end values

29
Accessibility to financial markets: Capital constraints in terms of weak accessibility to
external financing influence a firm‟s ability to undertake investments. A company with a
stabile dividend yield is less expected to experience any capital constraints (Fazzari, Hubbard
and Petersen, 1998). Moreover, a firm with excess cash flows is also more probable to
overinvest through undertaking negative net present value investments (Carter, Roger and
Simkins, 2002). With this reasoning a user of currency derivatives that is experiencing capital
constraints, may have greater incentives to only undertake positive net present value
investments. Hence, have a higher Q due to capital constraints and not hedging activity. On
the other hand, dividends also have signaling effects (Miller and Modigliani, 1961). A stable
dividend yield may motivate a higher Q due to positive expectations on future performance.
Firms with stable dividend yields are often regarded as more attractive investments and
receive more favorable valuations, which would suggest a positive coefficient. A dividend
dummy is used to capture the financing aspect which equals 1 if dividends have been paid out
the current year and 0 otherwise.
Leverage: According to the trade-off theory of capital structure, a firm‟s value is influenced
by the debt-to-equity (D/E) ratio. Leveraging a company increases the firm value through the
increasing value of tax-shields, but also increases the risk of financial distress and the present
value of expected costs of financial distress (Kraus and Litzenberger, 1973). Haushalter
(2000) provides evidence that the hedging activity increases with leverage, which corresponds
to the theory of financial distress as a determinant for hedging. In order to control for the
influence from capital structure on firm value, we use the book value of long-term debt over
book of equity, see Equation 10.
Leverage (D/E) = Book value of debt
Book value of equity (10)
Profitability: Valuations is based on profitability measures, which suggests that profitable
firms should be rewarded with higher valuations, hence a higher Q. To control the impact of
profitability we use return on assets (ROA), measured as net income divided by book value of
total assets, see Equation 11.
Profitability (ROA) = Net income
Total assets (11)
Industry effects: Our sample includes various industries which may have an impact on our
results. If currency derivatives users belong to an industry with relatively higher Q´s, our
results may be biased. Allayannis and Weston (2001) use an industry-adjusted Q to control for
industry specific effects on the firm value. Our approach is somewhat different and instead of
using an industry-adjusted Q, we control for industry effects with industry dummies. The
rationale behind this approach is the non-linearity of the normal Q values. When constructing
the industry-adjusted Qs, the majority of the companies in the sample end up with a negative
value which rules out the use of natural logarithms. If the industry-adjusted Q would have
been used, specification errors would have been apparent in the function, thus undermining
the regression model‟s prerequisites and the explanatory power of the results. Through the use
of dummies we account for the potential effect from industry belonging and dissimilarities
between industries, such as influence from industry cycles, macroeconomic variables or

30
disruptive technologies. In the table below we describe the dummy variables used and the
distribution in the categories for firms with a positive exposure (total of 351 observations).
Table 3.1: Industry dummies and sample description
Industry Value No. Firms No. Obs. Hedgers Non-hedgers
Energy 1 3 10 60% 40%
Materials 2 8 27 100% 0%
Machinery and engineering 3 41 151 86% 14%
Merchandising 4 18 63 68% 32%
Non-durables 5 5 18 77% 23%
Health and personal care 6 9 30 87% 13%
Real estate (financials) 7 13 10 80% 20%
IT 8 8 30 63% 37%
Telecom 9 3 12 75% 25%
Time effects: The firm value, Tobin´s Q, is dependent on the current point in time and the
fundamental expectations on the future. Therefore, the value of the firm naturally differs
between years. When running separate regressions, there is no need for controlling time
effects. However, we include year dummies when checking the robustness of our regressions
(comparable with fixed period effects).
Furthermore, Allayannis and Weston (2001) also use credit rating as a control variable. A
company with a low credit rating may be traded at a premium and determine the firm value.
Many Swedish companies do not have a credit rating. Because of this reason, we exclude this
variable.
The natural logarithm of Q constitutes our dependent variable in the regressions examining
value creation, and the main explanatory variable is the FCD dummy that represents whether
a firm deploys risk management through currency derivatives or not. Furthermore the
exposure is defined as foreign sales scaled by total sales. The control variables functions as
eliminators of other effects affecting the Q. The final regression model is defined below.
Tobin´s Q = α + β ∙ FCDDUMMY + β ∙ FOREIGNSALES/SALES + β ∙ CONTOLVARIABLES+ ε
Alfa represents the intercept, beta the coefficients and the sum of betas all the control
variables. In the regression model we only include n-1 industry dummies, where n denotes the
number of dummy variables. In the table shown below we summarize the expectations on the
variables included in the regression model.
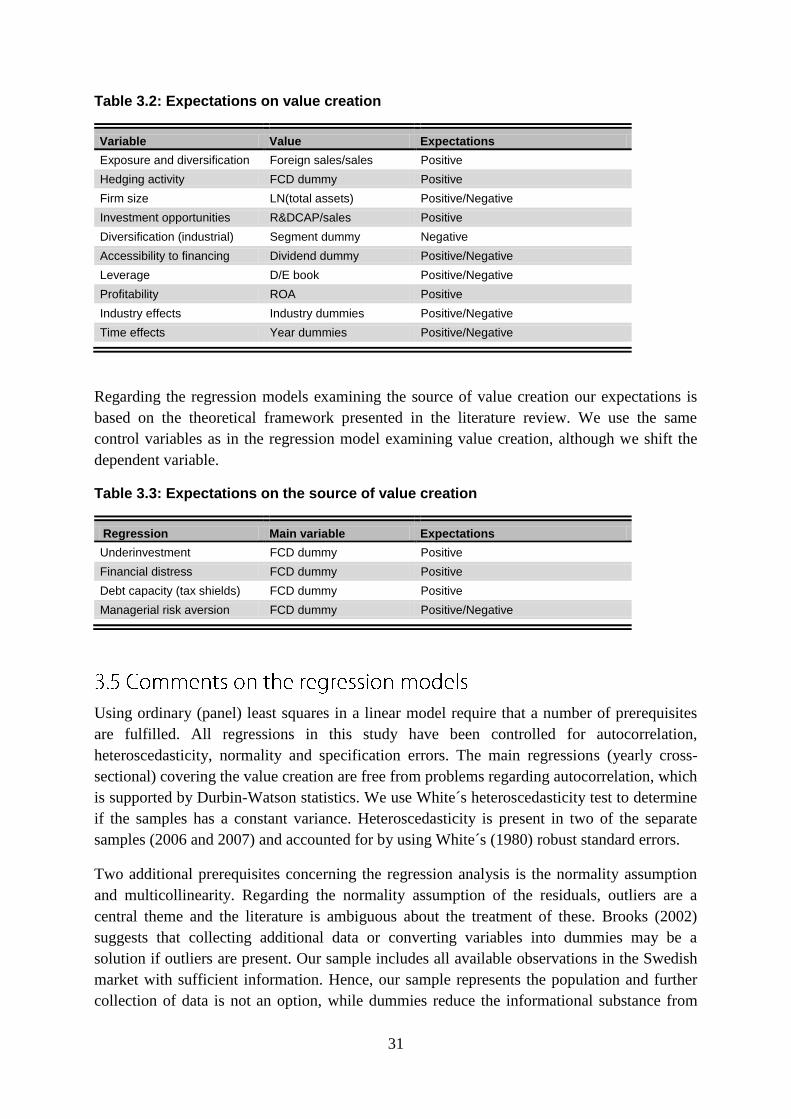
31
Table 3.2: Expectations on value creation
Variable Value Expectations
Exposure and diversification Foreign sales/sales Positive
Hedging activity FCD dummy Positive
Firm size LN(total assets) Positive/Negative
Investment opportunities R&DCAP/sales Positive
Diversification (industrial) Segment dummy Negative
Accessibility to financing Dividend dummy Positive/Negative
Leverage D/E book Positive/Negative
Profitability ROA Positive
Industry effects Industry dummies Positive/Negative
Time effects Year dummies Positive/Negative
Regarding the regression models examining the source of value creation our expectations is
based on the theoretical framework presented in the literature review. We use the same
control variables as in the regression model examining value creation, although we shift the
dependent variable.
Table 3.3: Expectations on the source of value creation
Regression Main variable Expectations
Underinvestment FCD dummy Positive
Financial distress FCD dummy Positive
Debt capacity (tax shields) FCD dummy Positive
Managerial risk aversion FCD dummy Positive/Negative
Using ordinary (panel) least squares in a linear model require that a number of prerequisites
are fulfilled. All regressions in this study have been controlled for autocorrelation,
heteroscedasticity, normality and specification errors. The main regressions (yearly cross-
sectional) covering the value creation are free from problems regarding autocorrelation, which
is supported by Durbin-Watson statistics. We use White´s heteroscedasticity test to determine
if the samples has a constant variance. Heteroscedasticity is present in two of the separate
samples (2006 and 2007) and accounted for by using White´s (1980) robust standard errors.
Two additional prerequisites concerning the regression analysis is the normality assumption
and multicollinearity. Regarding the normality assumption of the residuals, outliers are a
central theme and the literature is ambiguous about the treatment of these. Brooks (2002)
suggests that collecting additional data or converting variables into dummies may be a
solution if outliers are present. Our sample includes all available observations in the Swedish
market with sufficient information. Hence, our sample represents the population and further
collection of data is not an option, while dummies reduce the informational substance from

32
important variables. However, Brooks (2008) argues that the violation of the normality
assumption is negligible when the sample is sufficiently large; this corresponds well with our
sample. Outliers have only been removed when influencing the regressions in a substantial
manner (total of 5 observations). Moreover, we examine multicollinearity through correlation
matrixes and none of the variables have a correlation exceeding 0.8. With regards to these
tests, we conclude that the variables are not correlated, which indicates stable regression
models. Lastly, we examine linearity in the parameters through Ramsey´s RESET test and
none of the regressions indicates that non-linearity among the variables is present. Thus,
suggesting that the function is correctly specified.
In order to increase the robustness of our regressions covering value creation and to validate
the separately performed regressions, we perform a pooled panel data regression (with year
dummies) using panel least squares combined with White´s period/diagonal method. Through
the combined approach we control the standard errors in regards to autocorrelation and
heteroscedasticity, which is present in the combined sample (Eviews, User Guide 2).
Moreover, we also carry out a panel least regression with fixed effects (period and cross-
sectional) to check the robustness of our regressions. A Hausman test reveals that a random
effects model is not appropriate.
The regression models concerning the source of value creation are performed using panel data
and tested in the same manner as described above. All of the regressions show signs of
heteroscedasticity and are corrected with White´s diagonal method. Moreover, the regressions
covering underinvestment and managerial risk aversion are non-linear, which is corrected
through the use of the natural logarithm. All models are tested with a „Redundant fixed effects
test‟ and constructed accordingly with the results. The regression model concerning
underinvestment is cross-section fixed, financial distress is cross-section and time fixed, debt
capacity is cross-section fixed and managerial risk aversion through cross-section and time
fixed effects.
In this section we discuss the appropriateness of the study in terms of validity and reliability.
Validity enlightens the relationship between the objectives of the study and how well the
measurements in the study correspond with the objective, in other words, the correlation
between theory and the operationalized approach (Bryman, 2002). Reliability refers to the
repeatability of a study (Bryman, 2002). We briefly discuss these terms in order to evaluate
the study from a critical point of view.
The methodological framework used in this study, both regarding the dependent and
independent variables has been used in several other studies. In regards to this, the method is
considered to be applicable. Furthermore, Bryman (2003) stresses the importance of external
validity in a study, whether the results may support generalization beyond the actual context

33
examined. Allayannis and Weston (2001) study the US market, which is characterized by an
extensive domestic market and lower exposure towards exchange rates. Sweden is a small
country heavily dependent on export. This distinction between different types of economies
suggests that the results may only be applicable to comparable countries. Another important
aspect is the corporate governance system and the differences in disclosure standards; the
Swedish system is of Germanic character while the US system has Anglo-Saxon
characteristics. The requirements on disclosure are more evident in the US stock markets than
the Swedish. Thus, the availability of information may undermine the investor‟s possibility to
determine the actual hedging activities, or alternatively influence the perception of the actual
impact. This difference suggests that the results may not be useful in contexts with another
type of corporate governance system.
The reliability of this study concerns two dimensions, the data and methods used to analyze
the data. The procedure of collecting data is thoroughly described and subject to no
randomness. Furthermore the data is extracted from DataStream and annual reports, which are
reliable sources. The decision to exclude firms is based strictly on theoretical assumptions or
missing information. Consequently, we deem the reliability of the study as high due to the
formal process adopted when framing the final sample. Moreover, the regressions have been
conducted with Eviews, ensuring correct calculation methods. As already described, the data
has been processed accordingly to econometric standards. The overall judgment suggests a
high reliability.

34
In this chapter we present the results from our study, descriptive statistics of our sample and
the regression models. First, the descriptive statistics is presented for the total sample, then
the exposed firms and the unexposed firms. Secondly, comparison of means between hedgers
and non-hedgers, with and without the effect from exchange rate movements taken into
account. In the third part of this chapter the results from the regression models are presented,
both yearly and for the total period.
The total sample consists of 402 observations and 108 unique firms. To highlight the
differences between firms, with and without exposure we present the statistics divided into
three categories: all firms, firms with exposure through foreign sales and firms with no
exposure, where firms with exposure is our main sample in the analysis.
Table 4.1: All firms (n=402)
Variable Mean Median Std. Dev. Minimum Maximum
Tobin`s Q 1.71 1.13 1.68 0.10 14.63
Market value of equity 34 681 6371 90 248 168 640 031
Total assets 28 902 6540 56 093 122 361 239
Total sales 25 296 5008 48 325 9 303 667
FCD dummy 0.70 1 0.45 0 1
Foreign sales/sales 0.52 0.54 0.30 0.00 1.00
CAPEX and R&D/sales 0.31 0.06 1.21 0.00 16.89
Diversification dummy 0.44 0 0.49 0 1
Dividend dummy 0.82 1 0.38 0 1
D/E book 0.78 0.54 1.07 .00 13.94
Return on assets 0.07 0.07 0.09 -0.73 0.34
The total sample illustrates a wide dispersion in the variables, for an example Tobin´s Q
varying from a minimum of 0.10 to maximum of 14.63. The mean Q is 1.71, which is lower
compared to the previous study conducted on the Swedish market who recorded an average Q
of 2.17 (Pramborg, 2004). Another interesting detail is that the mean value of the Q is higher
than the median, indicating skewness in the variable (which is taken into account through
using the natural logarithm in the regressions). Furthermore, there is a great dispersion in size,
biased towards relatively smaller companies. The sample represents a great variety both in
terms of size and type of company. It covers everything from multinational companies with
vast product portfolios, to minor developing firm´s with a rather dry pipeline. In the method,
we stressed the importance of size in terms of market value of equity in order to cope with the
fixed costs associated with initiating a risk management program. As Table 4.1 shows, the
minimum requirement of SEK400M ($50M) is not met. During the four-year period, seven

35
observations do not fulfill these requirements. Despite this fact, this violation is not
considered to influence the possibility for initiating a risk management program when
reviewing the firms separately.
In our total sample, 70% of the companies use currency derivatives compared to 53% in 2003
(Alkebäck, Hagelin and Pramborg, 2006). The increase is rather drastic given the short time
period, but indicates that risk management has grown in importance.5 Allayannis and Weston
(2001) observed smaller numbers on the American market, an average exposure of 18% and
an average FCD dummy of 37%, which corresponds well with the expectations. The home
market is larger, hence weaker incentives to expand internationally. Furthermore Table 4.1
confirms Sweden´s reliance on exports through an average foreign sales ratio of 52%.
Pramborg (2004) recorded a slightly lower average exposure of 40%.6 Defined in absolute
measures, 87.3% of the firms in our sample are exposed through foreign sales. Regarding the
control variables in the model, we will describe these in more detail for the companies that are
exposed towards foreign currencies.
Table 4.2: Firms with exposure (n=351)
Variable Mean Median Std. Dev. Minimum Maximum
Tobin`s Q 1.76 1.26 1.71 0.10 14.63
Market value of equity 38 978 7893 95 826 168 640 031
Total assets 31 172 6326 59 568 122 361 239
Total sales 28 771 6645 50 791 39 303 667
FCD dummy 0.80 1 0.39 0 1
Foreign sales/sales 0.60 0.59 0.24 0.10 1.00
CAPEX and R&D/sales 0.10 0.05 0.22 0.00 2.84
Diversification dummy 0.50 1 0.50 0 1
Dividend dummy 0.80 1 0.39 0.00 1.00
D/E book 0.70 0.48 1.06 0.00 13.94
Return on assets 0.08 0.07 0.089 -0.73 0.33
The average Tobin´s Q is higher for exposed firms compared to the total sample and the firms
are larger in terms of market value of equity, total assets and total sales. Among the exposed
firms, 80% of the sample uses FCDs to manage exposure. Moreover, the average export
(foreign sales) exceeds more than half of the total sales, strengthening the arguments of why
firms engage in risk management activities. The investment opportunities ratio is considerably
lower in this sub-sample compared to the total sample in Table 4.1. The main reason is that
many of the unexposed firms belong to industries where heavy investment activity is normal,
such as biotech and real estate. Comparison regarding this ratio with prior studies is not
5 We include a larger part of the predefined population (listed firms of sufficient size). This aspect may explain
some of the differences in hedging activity. 6 Pramborg (2004) used total revenues and costs denominated in foreign currency to determine the foreign
exposure/activity. This approach is more accurate, but at the other hand this type of information requires a
survey study. Pramborg‟s figures are built upon three surveys with a total response rate of 51%, which may
contribute with an explanation to some of the differences in the figures, as we record the entire population.

36
possible because we are using different methods of measurement. Pramborg (2004) used
CAPEX/sales as an approximation and found an average of 11.7%, indicating a decline in
investment activity since 1997-2001. One crucial aspect to consider in regards to this theme is
that the IT boom took place during the years that study was conducted, which in part may
explain the somewhat higher figures (this effect is also present in the Q values).
The diversification mean is higher among the exposed firms, which is rather natural
considering the excluded companies are mainly one-segment firms operating locally. The
dividend average of 80% suggests that a large part of the firms pay dividends. Pramborg
(2004) records that 70% of the firms investigated pay dividends; while Allayannis and
Weston (2001) have an average of 86% on the American market. The differences between
Swedish and American firms are expected due to the higher dependence on the stock markets
(Anglo-American corporate governance system). The D/E ratio is lower for the exposed firms
and the ROA is very similar. Further comparison of these measures is not possible due to lack
of clarity of which variables other studies have used.
The last category is the firms with no exposure. In this category we mainly find real estate
firms and a few biotech firms. It is noticeable that this category actually includes one hedger.
The firm did not reveal any exposure in terms of foreign sales, but most probably the hedges
covers expenses denominated in foreign currency. The results are presented in Table 4.3, but
we have no further intention in discussing this category and the analysis will only cover the
firms with exposure, whereas a firm with no exposure has no self-preservation in hedging.
Table 4.3: Firms without exposure (n=51)
Variable Mean Median Std. Dev. Minimum Maximum
Tobin`s Q 1.31 0.92 1.43 0.20 7.56
Market value of equity 5103 3103 4491 397 18 459
Total assets 13 277 10 954 10 520 462 32 781
Total assets 1384 1225 1689 9 11 258
FCD dummy 0.01 0 0.14 0 1
Foreign sales/sales 0.00 0.00 0.00 0.00 0.00
CAPEX and R&D/sales 1.72 0.95 3.01 0.00 16.89
Diversification dummy 0.01 0 0.14 0 1.00
Dividend dummy 0.92 1 0.27 0 1.00
D/E book 1.35 1.29 0.94 0.00 5.94
Return on assets 0.03 0.06 0.12 -0.42 0.34
Allayannis and Weston (2001) test their hypothesis of whether hedgers have higher Qs
through comparison of mean values, without controlling for other factors influencing the Q.
We present these statistics followed by a short discussion about the results.

37
If investors recognize the difference in risk between a hedged firm and non-hedged firm with
foreign currency exposure, the hedger should receive a higher valuation based on the lower
perceived risk in the investment, hence a higher mean Q. In order to test this assumption we
examine the mean values for exposed firms and separate between hedgers and non-hedgers.
Table 4.4: Comparison of Q means between hedgers and non-hedgers (n=351)
Variable Hedgers (1) Non-hedgers (2) Difference (1) - (2) T-statistics
Mean 1.72 1.93 -0.21 -0.923
Std. Dev. 1.63 1.74
No. Obs. 282 69
The table shows that non-hedgers have higher average Q values than hedgers, even if the
findings are not of statistic significance. This finding is consistent with Pramborg (2004),
while Allayannis and Weston (2001) provides evidence that supports the hypothesis that
hedgers have higher average valuations than non-hedgers.
The impact of using currency derivatives is closely linked to exchange rate movements. In
this study, the most common currency derivative is forwards. Taking a position in a forward
contract obligates the parts to sell/buy. Therefore we would expect exchange rate movements
to influence the potential premium from hedging. When the domestic currency appreciates,
hedgers benefit from the use of currency derivatives given they are hedging, and not
speculating. On the contrary, hedgers may hurt when the domestic currency depreciates, in
other words, non-hedgers benefits. An important aspect to stress is that the losses induced by
a depreciating currency, may partly be offset by the gain in competitive position. Allayannis
and Weston (2001) find a statistically significant premium for hedgers during times of both
appreciation and depreciation, although the premium is larger during times of appreciation.
On the other hand, Pramborg (2004) finds no conclusive evidence of this hypothesis. In
Figure 4.1 we present the total competitiveness weight (TCW) index during this period. The
index is constructed through a basket of currencies weighted in relation to Swedish export and
import (Riksbanken). The Swedish krona appreciated 2006-2007 and depreciated during 2005
and 2008.

38
Figure 4.1: TCW-index 2005-2008
Source: Riksbanken
Accordingly to the graph we expect hedgers to benefit during 2006-2007 and experiencing
disadvantages during 2005 and 2008 due to the deprecation. Worth noting is that 2008 is an
exceptional year. In Table 4.5 we present the comparison divided into three periods, 2005,
2006-2007 and 2008.
Table 4.4: Comparison of Q means between hedgers and non-hedgers (n=351)
Time period Variable Hedgers (1) Non-hedgers (2) Difference (1) - (2) T-statistics
2005 Mean 1.85 2.26 -0.41 -0.89
Depreciation Std. Dev. 1.69 1.92
No Obs. 64 18
2006-2007 Mean 1.99 2.17 -0.18 -0.64
Appreciation Std. Dev. 1.88 1.70
No Obs. 213 56
2008 Mean 0.89 0.93 -0.04 -0.18
Depreciation Std. Dev. 0.74 0.59
No Obs. 69 13
The comparison of means is in contrast to Allayannis and Weston (2001), inconclusive and
provides no evidence that hedgers have a higher average value than non-hedgers. The findings
strengthen Pramborg‟s (2004) results from the time period 1997-2001 where no evidence was
found when comparing means. The yearly differences will be further elaborated in the
regression analysis and be presented through a more multifaceted lens.
Even if non-hedgers have higher mean Q values than hedgers, this measure is a rather weak
determinant of value creation since other factors also affects Q. In this section we present the
results from our yearly regressions and panel data regressions (pooled and fixed) with the
dependent variable Q, in order to view hedging from a more sophisticated point of view. We
also present the results from the regressions covering the sources of value creation.
100
110
120
130
140
150
2005-01-03 2006-01-03 2007-01-03 2008-01-03

39
In the multiple regressions we control for the factors considered to have an influence on firm
value. The yearly regression, 2005-2008, is presented in Table 4.6 including the coefficients
(top), standardized coefficients (middle) and t-statistics (bottom). The standardized
coefficients enables comparison among the regressors and their relative influence on the
dependent variable, Tobin‟s Q.7 Furthermore „***‟ denotes a significance of 0.01,‟**‟ denotes
a significance of 0.05 and „*‟ 0.10. We also present the R-squared and adjusted R-squared
obtained in the separate regressions. Overall, the separate regressions support the hypothesis
that hedging foreign currency exposure has a positive impact on firm value. The premium is
almost 40% in 2005, 31% in 2006, 13% in 2007 and -1% in 2008, and a total average of 21%.
These figures will be further elaborated in the analysis. The adjusted R-squared is lower
compared to Allayannis and Weston (2001), but in line with Pramborg (2004).
Table 4.6: Yearly regressions with the dependent variable Q
Variable 2005 2006 2007 2008 Mean
Constant 1.39
(2.30**) 2.39
(3.56) 1.31
(1.96*) -0.70
(-1.36) 1.09
FCD dummy 0.40 0.23
(2.23**)
0.31 0.18
(1.60)
0.14 0.07
(0.81)
-0.01 -0.01
(-0.09)
0.21
Foreign sales/sales 0.61 0.22
(2.24**)
0.40 0.15
(1.50)
0.57 0.19
(2.61)
0.47 0.18
(2.00**)
0.51
Assets (size) -0.14 -0.37
(-3.49***)
-0.17 -0.42
(-3,59***)
-0.12 -0.30
(-2.95***)
-0.02 -0.06
(-0.66)
-0.11
R&DCAPEX/sales 0.45 0.10
(0.63)
0.63 0.30
(2.34**)
0.97 0.23
(2.51**)
1.14 0.34
(2.19**)
0.80
Diversification dummy -0.25 -0.18
(-1.64)
-0.18 -0.13
(-1.48)
-0.17 -0.12
(-1.26)
-0.18 -0.15
(-1.50)
0.20
Dividend dummy 0.09 0.05
(0.53)
-0.01 -0.01
(-0.05)
0.06 0.03
(0.26)
0.06 0.03
(0.26)
0.05
D/E book 0.02 0.02
(0.16)
0.01 0.01
(0.07)
0.03 0.06
(1.18)
0.05 0.08
(0.92)
0.03
ROA 3.40 0.32
(2.75***)
2.56 0.43
(3.03***)
4.03 0.39
(3.33***)
4.30 0.62
(6.20***)
3.57
No. obs. 82 92 95 82 351
R-squared 0.53 0.48 0.48 0.62 0.53
Adj. R-squared 0.42 0.37 0.37 0.52 0.42
7 Standardized coefficients are expressed as changes in standard deviation units (Damodar, 2004). This enables
comparison between the explanatory variables coefficients and enables us to determine the economic influence.
A short example to simplify the interpretation follows. If the explanatory variable has a coefficient of 0.3β, an
increase of one standard deviation in this variable causes an increase of 0.3 standard deviations in the dependent
variable.

40
As mentioned before, the significance levels are important when trying to make inferences
about a population from a small sample. However, we have included all firms available in the
population, which is relaxing the requirements of statistical significance in order to draw
conclusions about the population. The complete regressions (including industry dummies) are
presented in Appendix 4.
In Table 4.7 we present a pooled and a fixed effects regression. The pooled regression is
performed using panel least squares controlling the autocorrelation. We reach the same
significance levels when controlling the heteroscedasticity. The FCD dummy for the period,
2005-2008, sums up to 17% with the pooled regression when controlling for both industry
effects and time effects. Allayannis and Weston (2001) found a premium of 5% using the
same regression model and Pramborg (2004) found a positive premium of 14% on the
Swedish market. When taking into account the unique characteristics (e.g. managerial quality)
and time effects in the fixed effects regression, we find a positive premium of 4%. The results
are similar to Allayannis and Weston (2001) in the matter that the premium using fixed effects
is lower compared to the pooled regression model approach, even if we experience a greater
dispersion between the values. The complete pooled regression, with industry and year
dummies included, is presented in Appendix 5.
Table 4.7: Pooled and fixed effects regressions with the dependent variable Q
Variable Pooled Fixed effects
Constant 1.32
(2.86***) 6.95
(3.74***)
FCD dummy 0.17 0.09
(1.16)
0.04 (0.30)
Foreign sales/sales 0.49 0.16
(2.59**)
0.08 (0.30)
Assets (size) -0.12 -0.27
(-3.58***)
-0.45 (-3.92***)
R&DCAPEX/sales 0.96 0.28
(5.01***)
0.48 (1.83*)
Diversification dummy -0.18 -0.11
(-1.91*)
0.00 (-0.11)
Dividend dummy 0.05 0.03
(0.37)
0.10 (0.85)
D/E book 0.04 0.06
(2.07**)
0.04 (2.30**)
ROA 3.43 0.40
(6.03***)
2.19 (3.74***)
No. obs. 351 351
R-squared 0.57 0.91
Adj. R-squared 0.54 0.87

41
In order to determine the source of value creation, we conduct four independent fixed effects
regressions (the effects fixed varies between the models, see 3.5). As mentioned before, we
examine underinvestment through the natural logarithm of R&DCAPEX/sales, financial
distress as NI/TA, debt capacity through D/E and managerial risk aversion as CEO ownership
divided by market cap. Table 8 shows that the FCD dummy is significant in the three first
regressions, while it is insignificant when examining managerial risk aversion. In the last
regression, covering managerial risk aversion, we experience a small loss of observations.
This is however not considered problematical when investigating the observations.
Table 4.8: Fixed effects regressions on sources to value creation
Variable Underinvestment Financial distress Debt capacity Managerial
Constant -4.58
(-2.78***) 0,56
(2.12**) -3.89
(-2.49**) -14.42
(-2.71***)
FCD dummy 0.27
(3.11***) 0,05
(2.80***) -0.22
(-2.56**) -1.58
(-1.42)
Foreign sales/sales -0.16
(-0.62) 0.12
(2.52**) 0.07
(0.28) 1.10
(1.31)
Assets (size) 0.10
(0.92) -0.04
(-2.04**) 0.30
(3.01***) 0.44
(1.32)
R&DCAPEX/sales - -
-0.27 (-4.14***)
-0.03 (-0.11)
1.05 (2.74***)
Diversification dummy -0.05
(-1.11) 0.002 (0.10)
0.13 (1.01)
0.47 (1.14)
Dividend dummy 0.04
(0.24) 0.002 (0.12)
0.02 (0.19)
0.05 (0.14)
D/E book 0.01
(0.70) -0.005 (-1.42)
- -
0.09 (1.95*)
ROA -1.12
(-2.46**) - -
-1.09 (-1.93*)
1.41 (1.32)
No. obs. 351 351 351 334
R-squared 0.94 0.81 0.67 0.91
Adj. R-squared 0.91 0.72 0.53 0.87
The FCD dummy is significant in all of the regressions except for managerial risk aversion.
The interpretation of the FCD dummy is that use of currency derivatives is positively related
to growth opportunities, companies that hedge has a lower bankruptcy risk and are not as
leveraged as non-hedgers. Furthermore, hedgers are more likely to have a CEO with less
stock compared to a non-hedging company. These findings will be further elaborated in the
analysis.

42
In this chapter we conduct our analysis covering the empirical results presented in chapter 4.
First, we discuss the results from the regressions covering value creation. Secondly, we
analyze the sources of value creation.
First, when comparing average Q values for hedgers and non-hedgers we find a value
discount for hedging and no evidence that the premium varies with exchange rate movements.
Previous research uses this approach for drawing conclusions about sub-samples and
differences over time. However, we would like to stress that comparing average Q values only
provide an indication of the possible relationship between hedging and firm value. We believe
that hedging will not affect the average Q and that it is required to remove other factors
potentially affecting the value of a firm. When isolating the hedging effect we find an average
premium of 21%, although only significant in 2005. As mentioned before, the sample used in
this study is as close to the entire population as possible, making statistic significance less
important. Since the hedging premium has a rather large economic influence (standardized
coefficients) on Q compared to other variables, we consider the value effect from hedging as
an important source of value.
The premium found, awarding hedging companies with an average value premium of 21%,
instinctively seem rather large and perhaps even doubtful. It is however imperative to stress
that the use of foreign currency derivatives serves as a proxy for risk management and should
therefore not be regarded as the premium for the use of currency derivatives alone. For an
example, 55.3% of the hedgers in the sample also hedges interest rate risk, which may
influence the size of the premium. In order to properly motivate the premium, it is important
to put the findings into perspective with prior studies. Allayannis and Weston (2001) found a
premium of 4.8% for the US market whereas Allayannis, Lel and Miller (2007) found a
premium of 9-20% for firms in 39 non-US countries around the world. The explanation for
the deviation in the premium is higher volatility in exchange rates, which increases the
exchange rate risk. This is certainly the case for Sweden, being a net exporting country with a
rather small currency. Furthermore, Pramborg (2004) show a positive hedging premium of
13.8% for the Swedish market. We conclude that the size of the value premium found is
implausibly high from a theoretical and logical standpoint, it is however comparable in size
range of previous research.
Allayannis and Weston (2001) found that the hedging premium increase in size during years
of domestic currency appreciation. The separate yearly hedging premiums show a positive
sign in 2005, 2006 and 2007, whereas it is slightly negative in 2008. Following Allayannis
and Weston‟s (2001) reasoning, it is unexpected that our results show the largest hedging
premium in 2005, a year in which the Swedish krona depreciated. This is however in line with

43
Pramborg (2004), who found positive hedging premiums being awarded on the Swedish
market despite domestic currency depreciation. Although, the premiums between 2005 and
2007 are in line with theory, investor‟s values the decreased volatility over time higher than
short-term currency gains, or losses.
In 2008, the hedging premium decreases substantially and even ends up being negative.
Considering the findings of 2005-2007, we do not attribute this decrease to the depreciating
krona alone, rather to the extraordinary macroeconomic events of that year. The global
financial crisis struck with a rapid pace, tightening the supply of funds. The ability to generate
internal funds and preserving liquidity therefore became more important, perhaps even to such
an extent that it can be considered a competitive advantage. As a consequence, the focus of
firms and investors changed from a long-term perspective to short-term survival. This
argument is further strengthened by the fact that ROA increases significantly in importance as
a determinant of Q during 2008. Showing that internal generation of funds is more highly
valued during this period when the threat of financial distress is more substantial and sources
of funds are scarce. A depreciating domestic currency presents advantages to firms with
foreign sales, in terms of increasing relative competitiveness and revenues, an advantage
which hedging firms forego. We conclude that a depreciating domestic currency alone is not
regarded by investors as a detrimental factor on firm value, but in combination with
macroeconomic events causing widespread financial distress and short termism hedging
discounts firm value.
The foreign sales ratio is significant three out of four years and has a high economic
importance. The variable is used, both to determine exposure and measure the geographical
diversification effects. Pramborg (2004) suggests that the influence of this variable can be
attributed to the diversification. Our regression is almost identical to Allayannis and Weston
(2001) and they find a lower impact from geographical diversification. We think this variable
is very important from an investor point of view. A company without foreign exposure is
automatically limited to the Swedish market and may be perceived as a less favorable
investment due the natural restrictions provided by the contextual barriers. Moreover, this
variable is also closely interconnected to risk management. Being geographically diversified
is rewarded with a higher value, but being diversified and unhedged would result in a lower
premium compared with a hedging diversified company.
Theory is ambiguous on the matter if company size influences value. Our results are
significant three out of four years and suggest that size influences Q negatively. The
standardized coefficient suggests that this variable is the main variable influencing Q
negatively. Our interpretation of these results is that flexibility is valued rather than scale of
economies. Another explanation is that smaller firms may have greater growth opportunities;
since there is a natural barrier to how fast a mature company may grow. Our findings are
consistent with both Allayannis and Weston (2001) and Pramborg (2004).

44
The R&DCAPEX ratio is the second most influential variable according to the standardized
coefficients and shows statistic significance three out of four years. The market-to-book of
assets is most likely a better approximation of investment opportunities, but not feasible in our
study. Furthermore, we find a negative influence from industrial diversification, which
indicates that firms active in many industrial segments receive lower firm values. Firms
focusing on one segment are rewarded. Although, we would like to stress that this measure do
not fully capture the dilemma of diversification. Our measure is based on segments and not
pure industrial diversification and it would be interesting to investigate whether or not our
results are accurate through further investigation.
With regards to the access to financial markets, the dividend dummy supports the Miller and
Modigliani (1961) arguments of a positive signaling effect. We do not find any support for the
ideas about capital constraints benefiting owners through investments in positive NPV
investments. The D/E ratio has a positive influence on Q, which supports Kraus and
Litzenberger (1973) about optimal leverage and the utilization of tax-shields. Another
explanation might be mitigation of agency costs due to the increased monitoring that is related
to debt. Moreover, ROA is the most influential variable. Considering that many valuation
techniques include some form of accounting based measure such as earnings, this finding is
consistent with the expectations.
As a robustness check we conduct both a pooled and a fixed effects regression. In the pooled
regression we find a significant hedging premium of 17%. However, the FCD dummy has less
economical influence on Q compared to the yearly regressions. The signs in the regressions
are the same, which adds reliability to our conclusions (size and industrial diversification is
negative). We also find significance in many of the industry dummies, suggesting that
industry belonging matters. The fixed effects regression also strengthens our results, but
shows more reasonable figures. The hedging premium is 4% when taking into account both
cross-sectional and yearly differences through dummy variables. Although, we consider
pooling industries a more convenient approach compared too introducing dummies for every
company. The reason is that many time-series is rather short and the yearly differences are
large, which influence the results and bias the premium. Therefore, we lean towards a higher
premium than 4%. The conclusion is that a premium is certainly found but its size is
questionable.
The analysis above provides evidence that hedging exchange rate exposure is value creating
when measuring value creation through the approximation of Q. The main source of value
creation is according to theory derived from the reduced volatility in cash flows. If thinking in
terms of the formula of the Q value, there are four factors influencing the numerator: the
market value of equity, long-term debt, current liabilities and current assets. In other words,
45
the value of Q could be enhanced by risk management in four different ways when
considering the variables included. First, hedging provides a company with a more stable cash
flow, which in return should yield a higher average market valuation when using cash flow
based valuation models. Second, hedging should according to theory enable an increase in
long-term debt through increased debt capacity. An increase in debt also increases the
denominator (same effect when current liabilities and current assets change), but in return the
tax-shields are increasing which affects the cash flow in a positive manner, hence a higher
market value of equity. Third, hedging reduces according to theory costs of financial distress
and may affect the current liabilities. More stable cash flows increase the predictability and
reliability, which should increase bargaining power towards suppliers and improve trade
credits. In other words, provide the company with a cheap source of financing and lowering
the cost of capital if efficiently used. Hence, a higher market value of equity. Fourth, hedging
provides a firm with a more stable cash flow which lowers the requirements on maintaining a
high liquidity level in order to retain financial flexibility. Lower cash reserves decreases the
current assets and reduces the working capital. An increase in operating performance is
valuable from an investor‟s point of view which should affect the market value of equity
positively.
The reasoning above strengthens one important aspect; the most influential variable in Q is
the market value of equity. But the question remain, what is the source of value and what
factors are influencing investors to trade non-hedged firms on a discount and paying a
premium for hedging firms?
The first theoretical foundation relates to the underinvestment problem. We have measured
the potential effect from currency hedging on investment opportunities through the
R&DCAPEX ratio as the dependent variable. The FCD dummy reveals a positive significant
relationship between investment activity and the use of currency derivatives. Our findings
indicate that an exposed firm that hedges is investing more in both tangible and intangible
assets. The evidence supports the findings of Géczy, Minton and Schrand (1997), who found
that investment opportunities are a determinant of hedging. We strengthen Hagelin´s (2003)
findings that Swedish firm‟s hedge to mitigate underinvestment problems.
The FCD dummy strengthens the hypothesis that currency derivatives mitigate the
underinvestment problem through the positive influence on the size of investments in relation
to sales. In order to determine if this can motivate a premium, we turn to the regressions and
the economical influence of the R&DCAPEX ratio (standardized coefficients). The control
variable for investment opportunities is the second most influential variable with regards to Q.
When combining the results from both value creation and underinvestment, we conclude that
investment opportunities may be regarded as an important source of value creation, given the
influence on Q. To conclude the reasoning, we find evidence that a firm with a risk
management program have greater investment opportunities, thus indicating that currency
hedging mitigates the underinvestment problem.

46
Theory predicts that the expected costs of financial distress can be mitigated by risk
management through minimizing the volatility of cash flows and thereby decreasing the
probability for ending up in a state of default. We measure the risk of bankruptcy through
NI/TA, based on Shumway´s (2001) research. As presented in the literature review, the
evidence regarding financial distress as a determinant to hedging is ambiguous. Our findings
indicate that the use of currency derivatives is positively related to a reduction in the
probability of financial distress, as the NI/TA increases with hedging. Our findings add to
Hagelin (2003) who found evidence for indirect costs of financial distress as a determinant of
hedging, whereas we find proof that hedgers decreases the probability of financial distress.
The lower probability for hedgers ending up in state where necessary investments can‟t be
carried out has clear connection to the underinvestment problem, which strengthens the
conclusion about mitigating underinvestment as an important source of value.
A troubling aspect surrounding the NI/TA ratio is that it is hard to separate between value
effects from the decreased risk of financial distress and the impact from NI/TA as a
profitability measure. The ratio NI/TA has a great influence on a Q and it is impossible to
separate the specific value effects. However, the expected costs of financial distress can be
defined through two components, the probability of default and the present value of financial
distress costs. According to our analysis the hedging firm decreases the probability of default,
while the costs remain the same. The implications of the lower probability should affect the
market value of equity in a positive direction and result in a value creating effect, caused by
currency hedging.
According to the trade-off theory the capital structure of a company is an important
determinant of market value. A firm has to carefully consider the D/E ratio in order to
efficiently benefit from the increased value provided by increased tax-shields, without
increasing the present value of expected costs of financial distress. A firm hedging currency
risk and mitigating the fluctuations in cash flows should be able to carry more debt without
increasing the risk at the same rate. We used the D/E ratio as the dependent variable in order
to analyze how hedging influences the choice of capital structure. The FCD dummy suggests
a negative relationship between hedging and the use of debt. This serves as an indicator that
hedging companies may be underleveraged compared to non-hedgers. Risk management
decreases the volatility in cash flows and according to our analysis reduces the probability of
financial distress, which in theory motivates a firm to increase leverage. Thus, the conclusion
about using hedging to increase debt capacity and benefit from the positive value effect from
tax-shields does not seem to be related to the firms in our sample. Instead our analysis
suggests that the firms are underleveraged compared to non-hedgers. On the contrary, the
value effect from an increase in debt to equity seems modest when considering the
standardized coefficients in the regression models regarding Q in Table 4.6 or Table 4.7. The
D/E ratio is one of the variables with the smallest economical influence on Q, indicating that

47
an increase in D/E may not influence firm value in a substantial matter. For example, Graham
and Rogers (2002) found that the increase in debt capacity increases firm value with 1%,
which is a rather modest figure compared to the suggested hedging premium.
As described in the literature review, managerial risk aversion is dependent on how a manager
is compensated. We test explicitly for risk aversion through examining the natural logarithm
of CEO ownership divided by the total market value of equity as the dependent variable. We
find that hedging and CEO ownership is negatively related. According to these results the
CEO in a hedging firm owns a smaller fraction of the company compared with non-hedging
firms. These results do not support the theoretical framework that suggests that CEO
ownership should be positively related to hedging activities. One potential explanation is that
Sweden has a rather developed corporate governance system in place, enforcing managers to
work in the best interest of the shareholders. Another important aspect that makes this
measure difficult to investigate is the presence of option programs. In our sample 72% of the
hedgers have an option program in place, which may affect the choice to hedge differently
dependent on if the options are in-the-money or out-of-the-money. We do not intend to
investigate this aspect further; instead we refer to Hagelin et al. (2007) regarding this matter.
Nevertheless, the measure we have chosen may not be representative. The most convenient
ratio would be the amount of private wealth tied up in the company compared to total wealth,
which would reveal how exposed the manager actually is. To conclude, our evidence is not
surprising with regards to the empirical studies done on managerial risk aversion, since they
present a rather inconclusive picture of the problem.

48
In this chapter we present our conclusions regarding the findings in our study, covering value
creation and the sources thereof.
This study has two main purposes. First, investigate if hedging foreign exchange rate risks is
value creating for Swedish firms and if yearly differences exist. Second, examine the potential
sources supporting the value creation.
Our findings show that Swedish firms hedging their foreign currency exposure are assigned a
premium of 4-21%. Hedging exchange rate risk is more valuable in a small economy like
Sweden that is dependent on exports, has a more volatile currency and therefore a large
macroeconomic exposure. We show that the value effect of hedging can differ between years
and that depreciation in the domestic currency not necessarily diminishes the premium of
hedging. However, we find that when deprecation in the domestic currency is combined with
macroeconomic events causing widespread financial distress and short-termism, the value of
hedging firms is discounted. The overall evidence supports theory on risk management as a
value creating activity, independent of short-term fluctuations in exchange rates. Investors
seem to value the long-term benefits from risk management activities.
We examine the following four potential sources of value creation: mitigation of the
underinvestment problem, reduction in expected financial distress costs, increased debt
capacity and managerial risk aversion. The source that is the most significant is the use of
hedging to relieve underinvestment problems. Our findings show that hedging firms have
more investment opportunities compared to non-hedgers, which is an important source of
value creation. Furthermore, we find a positive relation between hedging and a reduction in
the probability of financial distress, indicating that Swedish firm‟s hedge currency risk in
order to increase their value by lowering the probability of incurring costs associated with
financial distress situations. Our evidence with regards to how hedging influence the capital
structure decision indicates a negative relation between hedging and leverage. This may
suggest that hedging firms in Sweden have an averse attitude towards risk overall. We
therefore suggest that Swedish exchange rate hedgers are not making use of the additional
debt capacity created through hedging and is therefore foregoing value increasing tax-shields.
The final source of value creation is managerial risk aversion, where we do not find a positive
relation between CEO share ownership and hedging.
We conclude that Swedish firms are hedging for the right reasons and therefore manage to
enhance firm value, but are not utilizing the interest tax-shield fully.

49
We provide evidence that risk management activities are value enhancing in the long-term,
which supports the theories on risk management. On the other hand, we find distinctive yearly
deviations of the premium within the time period. Previous studies use rather simplistic
methods to determine the yearly impact from risk management, which might be misguiding
due to possible inherent differences over time. In order to increase the understanding of when
risk management is valuable, we propose that further research should elaborate on potential
differences over time. In other words, pinpoint time bound differences in value creation and
determining underlying causes through even more refined methodological approaches. An
approach of this manner would benefit the actual predictability of the theories and provide
guidance in practical situations.
Furthermore, Swedish firms that are hedging through currency derivatives seem to be
underleveraged. According to theory a hedging firm should be able to increase leverage
through decreased volatility without increasing the risk of financial distress. An interesting
question is why hedging firms are underleveraged? There may be different possible
explanations, such as risk aversion, financial flexibility, increased dependence on equity
markets, hybrid financing, ownership structure etc. We therefore encourage further research
on the topic to bring clarity to the underlying causes, both in regards to risk management and
capital structure in general.

50
Baltagi, B. H., (1995), ‟Econometric Analysis of Panel Data’, John Wiley & Sons, Chichester
Brooks, C., (2005), ’Introductory Econometrics for Finance’, Cambridge University Press,
Cambridge
Bryman, A., (2002). „Samhällsvetenskapliga Forskningsmetoder’, Liber, Malmö.
Culp, C., (2002), „The ART of Risk Management’, John Wiley & Sons, New York
Damodar, G., (2004), ‟Basic Econometrics’, McGraw-Hill/Irwin, New York
Allayannis, G. and Weston, J.P., (2001), „The Use of Foreign Currency Derivatives and Firm
Market Value‟, The Review of Financial Studies, vol. 14, no. 1, pp. 243-276
Allayannis, G. and Ofek, E., (2001), „Exchange Rate Exposure, Hedging, And The Use Of
Foreign Currency Derivatives‟, Journal of International Money and Finance, vol. 20, no. 2,
pp. 273-296
Alkebäck P. and Hagelin N., (1999), „Derivative Usage by Nonfinancial Firms in Sweden
with an International Comparison‟, Journal of International Financial Management and
Accounting, vol. 10, no.2, pp. 105-120
Alkebäck P., Hagelin N. and Pramborg B., (2006), „Derivative Usage by Non-financial Firms
in Sweden 1996 and 2003: What Has Changed?‟, Managerial Finance, vol. 32, no. 2, pp.
101-114
Bartram, S.M., (2000), „Corporate Risk Management as a Lever for Shareholder Value
Creation‟, Financial Markets, Institutions &Instruments, vol. 9, no. 5, December, pp 279-324
Bessembinder, H., (1991), „Forward Contracts and Firm Value: Investment Incentive and
Contracting Effects‟, Journal of Financial and Quantitative Analysis, vol. 26, no. 4, pp 519-
532
Chung, K. H. and Pruitt S.W., (1994), ‟A Simple Approximation of Tobin‟s Q‟, Financial
Management, Vol. 23, No. 3, pp. 70-74
Dadalt, P., Donaldson, J. and Garner, J., (2003), „Will Any Q Do‟, The Journal of Financial
Research, vol. 26, no. 4, pp. 535-551

51
Fazzari, S. R., Hubbard, G. and Petersen, B., (1998), „Financing Constraints and Corporate
Investment‟, Brookings Papers on Economic Activity, pp. 141-207
Froot K.A, Scharfstein D.S, Stein J.C., (1993) „ Risk Management: Coordinating Corporate
Investment and Financing Policies‟, The Journal of Finance, vol. 48, no. 5 December, pp.
1629-1658
Gay G.D. and Nam J., (1998), „The Underinvestment Problem and Corporate Derivatives
Use‟, Financial Management, vol. 27, no. 4, pp53-69
Géczy, C., Minton B.A. and Schrand C., (1997), „Why Firms Use Currency Derivatives‟, The
Journal of Finance, Vol. 52, no. 4, pp. 1323-1354
Graham J.R. and Rogers D.A., (2002), „Do Firms Hedge in Response to Tax Incentives?‟, The
Journal of Finance, vol. 57, no. 2, pp.815-839
Graham J.R. and Rogers D.A., (2002), „Do Firms Hedge in Response to Tax Incentives?‟, The
Journal of Finance, vol. 57, no. 2, pp. 815-839
Graham J.R. and Smith JR. C.W., (1999) „Tax Incentives to Hedge‟, The Journal of Finance,
vol. 54, no. 6, pp. 2241-2262
Guay, W. and Kothari, S., (2003), „How Much Do Firms Hedge With Derivatives‟, Journal of
Financial Economics, vol. 70, no. 3, pp. 423-41
Hagelin N., (2003), „Why Firms Hedge with Currency Derivatives: An Examination of
Transaction and Translation Exposure‟, Applied Financial Economics, vol. 13, no. 1, pp. 55-
69
Hagelin N., Holmén M., Knopf J.D. and Pramborg B., (2007), „Managerial Stock Options and
the Hedging Premium‟, European Financial Management, vol. 13, no. 4, pp. 721-741
Haushalter, D., (2000), „Financing Policy, Basis Risk and Corporate Hedging: Evidence from
Oil and Gas Producers‟, Journal of Finance, vol. 55, no. 1, pp. 107-152
Howton S.D. and Perfect S.B., (1998), „Currency and Interest-Rate Derivatives use in US
Firms‟, Financial Management, vol.27, no. 4
Jensen, M.C., and Meckling, W.H., (1976), „Theory of the Firm: Managerial Behavior,
Agency Costs and Ownership Structure‟, Journal of Financial Economics, 3, pp 305-360
Jin, Y. and Jorion, P., (2006), „Firm Value and Hedging, Evidence from U.S. Oil and Gas
Producers‟, The Journal of Finance, vol. 61, no. 2, pp. 893-919
Kim Y.S., Mathur I. and Nam J., (2006), „Is Operational Hedging a Substitute for or a
Complement to Financial Hedging?‟, Journal of Corporate Finance, vol. 12 pp.834-853
52
Knopf J.D., Nam J. and Thornton Jr. J.H., (2002), „The Volatility and Price Sensitivities of
Managerial Stock Option Portfolios and Corporate Hedging‟, The Journal of Finance, vol. 57,
no. 2, pp. 801-813
Kraus, A. and Litzenberger, R. H., (1973), „A State-preference Model of Optimal Financial
Leverage‟, Journal of Finance, vol. 28, pp. 911-927
Lang, L. and Stulz, R., (1994), „Tobin´s Q, Corporate Diversification and Firm Performance‟,
Journal of Political Economy, vol. 102, no. 6, pp. 1248-1280
Mayers D. and Smith Jr. C.W., (1982) „On the Corporate Demand for Insurance‟, The Journal
of Business, vol. 55, no. 2, April, pp. 281-296
Mian, S., (1996), „Evidence on Corporate Hedging Policy‟, Journal of Financial and
Quantitative Analysis, vol. 31, no. 3, pp. 419-439
Miller, M. H. and Modigliani, F., (1961), „Dividend Policy, Growth, and the Valuation of
Shares‟, The Journal of Business, vol. 34, no. 4, pp. 411-433
Morck, R. and Yeung, B., (1991), „Why Investors Value Multinationality‟, Journal of
Business, vol. 64, no. 2, pp. 165-187
Myers, S.C., (1977), „Determinants of Corporate Borrowing‟, Journal of Financial
Economics, vol. 5, no. 2, pp. 147-175
Nance D.R., Smith C.W. and Smithson C.W., (1993), „On the Determinants of Corporate
Hedging‟, The Journal of Finance, vol. 48, no. 1, pp. 267-284
Peltzman, S., (1977), „The gains and losses from industrial concentration‟, Journal of Law
and Economics, vol. 20, no. 2, pp. 229-263
Perfect, S. and Wiles, K., (1994), „Alternative Constructions of Tobin's q: An Empirical
Comparison‟, Journal of Empirical, vol. 1, no. 3-4, pp. 313-341
Pramborg, B., (2004), „Derivatives Hedging, Geographical Diversification and Firm Value‟
Journal of Multinational Financial Management, vol. 14, pp. 117-133
Purnanandam A., (2008), „Financial Distress and Corporate Risk Management: Theory and
evidence‟, Journal of Financial Economics, vol. 87, pp. 706-739
Shumway, T., (2001), „Forecasting Bankruptcy More Accurately: A Simple Hazard Model‟,
The Journal of Business, vol. 74, no. 1, pp. 101-124
Smith C.W. and Stulz R.M., (1985), „The Determinants of Firm‟s Hedging Policies‟ The
Journal of Financial and Quantitative Analysis, vol. 20, no. 4, December, pp. 391-405
Spanó M., (2007), „Managerial Ownership and Corporate Hedging‟ Journal of Business
Finance & Accounting, vol. 34, no. 8, pp. 1245-1280

53
Stulz R.M., (1984), „Optimal Hedging Policies‟ The Journal of Financial and Quantitative
Analysis, vol. 19, no. 2, June, pp.127-140
Stulz R.M., (1996), „Rethinking Risk Management‟, Journal of Applied Corporate Finance,
vol. 9, no. 3, pp. 8-24
Tobin, J., (1969), ‘A General Equilibrium Approach to Monetary Theory’ Journal of
Money,
Credit and Banking, vol. 1, no. 1, pp. 15-29
Tufano P., (1996), „Who Manages Risk? An Empirical Examination of Risk Management
Practices in the Gold Mining Industry‟, The Journal of Finance, vol. 51, no. 4, pp. 1097-1137
Yermack, D., (1996), ,‟Higher Market Valuation of Companies With a Small Board of
Directors‟, Journal of Financial Economics, vol. 40, no. 2, pp. 185-211
Allayannis G., Lel U. and Miller D.P., (2007), „Corporate Governance and the Hedging
Premium around the World’
Bartram, S., Brown G. and Fehle, F., (2004), „International Evidence on Financial Derivative
Usage‟, Working Paper Series
Carter D.A., Rogers D.A. and Simkins B.J., (2002), „Does Fuel Hedging Make Economic
Sense‟, The Case of the US Airline Industry, Working Paper Series
Nain A., (2005), January, „The Strategic Motives for Corporate Risk Management‟
DataStream
Eviews User´s Guide, Part 2, www.eviews.com/, 2009-05-25
Riksbanken, URL: http://www.riksbanken.se/, 2009-05-25

54
Source: Smith and Stulz, 1985:397.

55
Source: Smith and Stulz, 1985:393

56
Firm
Duni
Hexpol
Industrivärden
Investor
Lawson Software(Stockholm)
Metro International SDB
Millicom International Cellular SDB
Rezidor
SÄKI
Whilborgs

57
Variables (TOBQ) 2005 (82) 2006 (92) 2007 (95) 2008 (82) Mean (351)
Constant 1.39
(2.30**) 2.39
(3.56***) 1.31
(1.96*) -0.70
(-1.36) 1.09
FCD dummy 0.40 0.23
(2.23**)
0.31 0.18
(1.60)
0.14 0.07
(0.81)
-0.01 -0.01
(-0.09)
0.21
Foreign sales/sales 0.61 0.22
(2.24**)
0.40 0.15
(1.50)
0.57 0.19
(2.61)
0.47 0.18
(2.00**)
0.51
Assets (size) -0.14 -0.37
(-3.49***)
-0.17 -0.42
(-3.59***)
-0.12 -0.30
(-2.95***)
-0.02 -0.06
(-0.66)
-0.11
RDCAPEX/sales 0.45 0.10
(0.63)
0.63 0.30
(2.34**)
0.97 0.23
(2.51**)
1.14 0.34
(2.19**)
0.80
Diversification dummy -0.25 -0.18
(-1.64)
-0.18 -0.13
(-1.48)
-0.17 -0.12
(-1.26)
-0.18 -0.15
(-1.50)
0.20
Dividend dummy 0.09 0.05
(0.53)
-0.01 -0.01
(-0.05)
0.06 0.03
(0.26)
0.06 0.03
(0.26)
0.05
D/E book 0.02 0.02
(0.16)
0.01 0.01
(0.07)
0.03 0.06
(1.18)
0.05 0.08
(0.92)
0.03
ROA 3.40 0.32
(2.75***)
2.56 0.43
(3.03***)
4.03 0.39
(3.33***)
4.30 0.62
(6.20***)
3.57
Industry dummy 1 0.55 0.12
(0.70)
-0.26 -0.07
(-0.73)
-0.73 -0.18
(-2.29**)
-0.94 -0.23
(-1.78*)
-0.35
Industry dummy 2 0.54 0.21
(2.23**)
0.33 0.13
(0.98)
0.23 0.09
(0.58)
0.16 0.06
(0.76)
0.32
Industry dummy 4 0.49 0.27
(2.58**)
0.32 0.18
(1.77*)
0.26 0.14
(1.44)
0.22 0.13
(1.46)
0.32
Industry dummy 5 0.07 0.03
(0.29)
0.23 0.08
(1.61)
0.19 0.06
(0.78)
0.53 0.16
(1.87*)
0.26
Industry dummy 6 0.60 0.22
(2.40**)
0.50 0.20
(3.30***)
0.31 0.12
(1.91*)
0.40 0.19
(1.89*)
0.45
Industry dummy 7 -0.59 -0.13
(-1.39)
-0.80 -0.17
(-5.92***)
-0.94 -0.23
(-4.63***)
-0.20 -0.06
(-0.71)
-0.63
Industry dummy 8 0.49 0.19
(1.96*)
0.38 0.15
(1.18)
0.23 0.09
(0.97)
0.14 0.06
(0.68)
0.31
Industry dummy 9 0.97 0.26
(2.91***)
0.35 0.09
(2.03**)
0.57 0.14
(3.29***)
0.29 0.09
(1.08)
0.55
R-squared 0.53 0.48 0.48 0.62 0.53
Adj. R-squared 0.42 0.37 0.37 0.52 0.42

58
Variables Pooled Fixed effects
Constant 1.32
(2.86***) 6.95
(3.74***)
FCD dummy 0.17 0.09
(1.16)
0.04 (0.30)
Foreign sales/sales 0.49 0.16
(2.59**)
0.08 (0.30)
Assets (size) -0.12 -0.27
(-3.58***)
-0.45 (-3.92***)
R&DCAPEX/sales 0.96 0.28
(5.01***)
0.48 (1.83*)
Diversification dummy -0.18 -0.11
(-1.91*)
0.00 (-0.11)
Dividend dummy 0.05 0.03
(0.37)
0.10 (0.85)
D/E book 0.04 0.06
(2.07**)
0.04 (2.30**)
ROA 3.43 0.40
(6.03***)
2.19 (3.74***)
Industry dummy 1 -0.52 -0.11
(-1.94*) -
Industry dummy 2 0.30 0.10
(1.01) -
Industry dummy 4 0.32 0.16
(2.21**) -
Industry dummy 5 0.20 0.06
(1.52) -
Industry dummy 6 0.43 0.16
(4.24***) -
Industry dummy 7 -0.63 -0.14
(-6.98***) -
Industry dummy 8 0.31 0.11
(1.51) -
Industry dummy 9 0.53 0.13
(3.51***) -
2006 dummy 0.17 0.10
(3.62***) -
2007 dummy -0.08 -0.05
(-1.73*) -
2008 dummy -0.62 -0.34
(-10.4***) -
No. obs. 351 351
R-squared 0.57 0.91
Adj. R-squared 0.54 0.87