theenergyaccesssituation indevelopingcountries and energy... ·...
TRANSCRIPT
United Nations Development Programme
THE ENERGY ACCESS SITUATIONIN DEVELOPING COUNTRIES
A Review Focusing on theLeast Developed Countriesand Sub-Saharan Africa

The United Nations Development Programme (UNDP) is the UN's global development network,advocating for change and connecting countries to knowledge, experience and resources to helppeople build a better life. We are on the ground in 166 countries, working with them on their ownsolutions to global and national development challenges. As they develop local capacity, they drawon the people of UNDP and our wide range of partners. World leaders have pledged to achieve theMillennium Development Goals, including the overarching goal of cutting poverty in half by 2015.UNDP's network links and coordinates global and national efforts to reach these Goals. Our focusis helping countries build and share solutions to the challenges of: Democratic Governance, PovertyReduction, Crisis Prevention and Recovery, and Environment and Sustainable Development. UNDPhelps developing countries attract and use aid effectively. In all our activities, we encourage theprotection of human rights, the empowerment of women and capacity development.
The World Health Organization is the directing and coordinating authority for health within theUnited Nations system. It is responsible for providing leadership on global health matters, shapingthe health research agenda, setting norms and standards, articulating evidence-based policy op-tions, providing technical support to countries and monitoring and assessing health trends. WHOis present in 147 country offices, six regional offices and at the headquarters in Geneva, Switzerland.WHO and its Member States work with many partners, including UN agencies, donors, non-governmental organizations, WHO collaborating centres and the private sector.
Lead Authors: Gwénaëlle Legros, Ines Havet, Nigel Bruce, and Sophie BonjourContributors: Kamal Rijal, Minoru Takada, and Carlos Dora
November 2009
United Nations Development Programme
THE ENERGY ACCESS SITUATIONin developing countries
A Review Focusing on theLeast Developed Countriesand Sub-Saharan Africa

© Copyright UNDP and World Health Organization 2009
All rights reserved.
United Nations Development ProgrammeEnvironment and Energy GroupBureau for Development Policy304 East 45th Street, New York, NY 10017, USAWebsite: www.undp.org/energyandenvironment
The views expressed in this publication do not necessarily represent those of the member countries of the UNDPExecutive Board or of those of the World Health Organization. The designations and terminology employed andthe presentation of material do not imply any expression or opinion whatsoever on the part of the United Nationsand the World Health Organization concerning the legal status of any country, territory, city or area, or of itsauthorities, or of its frontiers or boundaries. Dotted lines on maps represent approximate border lines for whichthere may not yet be full agreement.
Photographs: Cover background image: World Bank, Curt Carnemark, 1996Small squares: World Bank, Dominic Sansoni, 2002; World Bank, John Isaac, 2002;World Bank, Curt Carnemark, 1993; World Bank, Dominic Sansoni, 2002;World Bank, Dominic Sansoni, 2002
Design and layout: Kimberly Koserowski
Editing: Karen Holmes

foreword
The Energy Access Situation in Developing Countries: A Review Focusing on the Least Developed Countries and Sub-Saharan Africa
�
Energy is arguably one of the major challenges the world faces today, touching all aspects of our lives. For thoseliving in extreme poverty, a lack of access to modern energy services dramatically affects health, limitsopportunities and widens the gap between the haves and have nots. The vulnerability of the poor is onlyworsened with recent challenges from climate change, a global ynancial crisis, and volatile energy prices.
The global target date for achieving the Millennium Development Goals is only 6 years away. While there is noMDG on energy, the global aspirations embodied in the goals will not become a reality without massiveincreases in the quantity and quality of energy services. This is needed to meet the most basic needs of poormen and women, especially heat for cooking, and mechanical power. Also, improved household energytechnologies for the very poor can prevent the almost 2 millions deaths a year attributable to indoor air pollutionfrom solid fuel use. These have been central messages of UNDP and of WHO. However, this report shows thatprogress has been painfully slow in expanding access to modern energy services, particularly in poorercountries, presenting a major roadblock to meeting the MDGs.
Policies and national programmes must be drastically enhanced to tackle in any signiycant way energy poverty.This cannot be done effectively without a clear understanding of the energy access situation in countries,including understanding regional and national trends, rural/urban disparities, and the range of energy sourcestypically used in the households of the poor.Yet, existing global data sets and reports often provide insufficientinformation on energy access, focusing instead mostly on energy production and consumption.
This report was commissioned to begin bridging this gap, especially for the Least Developed Countries (LDCs)and sub-Saharan Africa, where energy access is especially constrained. In addition to compiling statistics fromcountries on access to electricity and modern fuels, as well as drawing on the forthcoming WHO HouseholdEnergy database and the International Energy Agency’s World Energy Outlook 2009, this report supplementsexisting global reports with available statistics (which, in some cases, are sorely lacking) on fuel types, improvedstoves used for cooking, and mechanical power. It summarises as well the latest evidence on the health impactsattributable to indoor air pollution resulting from household use of solid fuels for cooking and heating. It alsoestimates the number of additional people that would have to gain access to modern energy services by 2015under different scenarios, including scenarios that are compatible with meeting national targets and the MDGsand are disaggregated for LDCs and sub-Saharan Africa.
We believe that this report paints a relevant and timely picture of the global energy access situation and theirhealth and development implications for developing countries. Much more still needs to be done for a morefulsome understanding, including further disaggregating data and supplementing them with qualitativeinformation. Paying particular attention to issues such as fuel types, end-use equipment, gender, and rural andremote areas will go a long way to inzuencing policy and strengthening efforts by the international communityand national governments to address the challenge of energy poverty.
Maria Neira Veerle VandeweerdDirector, Public Health and Environment Director, Environment and Energy GroupHealth Security and Environment Bureau for Development PolicyWHO UNDP
��
acknowledgements
The Energy Access Situation in Developing Countries: A Review Focusing on the Least Developed Countries and Sub-Saharan Africa
This paper was initiated by the Sustainable Energy Programme, part of the Environment and EnergyGroup (EEG) of the Bureau for Development Policy (BDP), United Nations Development Programme(UNDP) in cooperation with the WHO Programme on Household Energy and Health. It beneyted fromvaluable contributions and collaborative efforts of many people, including the lead and contributingauthors and UNDP and WHO staff as well as peer-reviewers both internal and external to UNDP and WHO.
UNDP and WHO are very grateful to the lead authors Gwénaëlle Legros and Ines Havet. Their expertisein the yeld of energy for sustainable development, speciycally on statistical data and analysis related toenergy access, provided the foundation for this publication. They also thank Nigel Bruce (Public Healthand Environment, HSE, WHO) and Sophie Bonjour (Public Health and Environment, HSE, WHO) for theirexpertise in environmental epidemiology and public health, and the development of the chapter on thehealth impacts.
UNDP and WHO would also like to express sincere gratitude to Kamal Rijal (Sustainable EnergyProgramme, EEG, UNDP), Minoru Takada (Sustainable Energy Programme, EEG, UNDP) and Carlos Dora(Public Health and Environment, HSE, WHO) for their contributions and for providing guidance for theoverall orientation of the paper.
We are very grateful to Minoru Takada for initiating this study, and to Veerle Vanderweerd (Director,Environment and Energy Group, UNDP) for her ongoing guidance and encouragement, and the timecontributed to ynalising this publication.
We would like to thank Eva Rehfuess (former WHO responsible officer for the Programme on HouseholdEnergy and Health) for initiating the collaboration between UNDP and WHO, Philipp Lambach (HealthSecurity and Environment, WHO) for his contribution to the development of the WHO household energydatabase, and Annette Prüss-Üstün (Public Health and Environment, HSE, WHO) for her expertise inburden of disease assessment and her input to the WHO Household energy database.
We are grateful to Fatih Birol, Chief Economist of the International Energy Agency (IEA), and his team—Raffaella Centurelli, Teresa Malyshev, and Paweł Olejarnik—for providing the IEA database onelectriycation rates published in the World Energy Outlook 2009.
The study was subjected to a rigourous process of peer review. Grateful thanks are extended to thefollowing development practitioners for their thoughtful and insightful comments: Akanksha Chaurey(TERI), Elisabeth Clemens (UNDP), Stephen Gitonga (UNDP), Conrad Heruela (UNEP Consultant), StevenHunt (Practical Action), Thomas Jensen (UNDP Paciyc Centre), Sivanappan Kumar (Asian Institute ofTechnology), Benoit Lebot (UNDP Regional Centre in Dakar), Teresa Malysher (IEA), Eric Muynck (UNDPRegional Centre in Dakar), Abdulrahman Olhaye (UNDP), Theo Sanchez (Practical Action), Shireen Sayeed(UNDP Bangladesh), Bahareh Seyedi (UNDP), Thiyagarajan Velumail (UNDP Regional Centre in Bangkok),and Gregory Woodsworth (UNDP).
UNDP and WHO would also like to thank Phil Pelter (Administrative Assistant, EEG, UNDP) for logisticalsupport, Kimberly Koserowski for graphic design, and Karen Holmes for editorial support.
table of contents
The Energy Access Situation in Developing Countries: A Review Focusing on the Least Developed Countries and Sub-Saharan Africa
���
Foreward i
Acknowledgements
Table of Contents ii
List of Boxes, Maps, Figures, and Tables iv
Abbreviations vi
Executive Summary 1
I. Purpose 3
II. Methodology 5
A. Data collection 5B. Indicators used to measure energy access 6C. Methods used to estimate energy access 7D. Consideration in using and interpreting estimates 8E. Method used to assess the health impacts from solid fuel use 8
III. Energy access situation in LDCs and Sub-Saharan Africa 10
A. Access to electricity 10B. Access to modern fuels 13
IV. Fuels and improved stoves used for cooking in developing countries 16
A. Fuels used for cooking 16B. Improved cooking stoves 19
V. Health impacts of household energy use 22
A. Health problems linked to solid fuel use 22B. Another burden on the poor and women 26
C. Effects on global warming: an opportunity to secure health and climate ‘co-beneyts’ 28
VI. Developing countries with energy access targets 29
VII. Energy access in 2015 under different scenarios 31
A. Access to electricity 31B. Access to modern fuels 32
VIII. Conclusions 34
References 35
Appendix 1: Energy Access and Development Measures 37Appendix 2: Country ClassiUcations 40Appendix 3: Health Impacts of Household Energy Use 46Appendix 4: Global and Regional MDG-Related Energy Targets 61Appendix 5: Comparison of Scenarios of Energy Access in 2015 64Appendix 6: Tables on Energy Access in Developing Countries 66Appendix 7: Sources Consulted 102

l�st of boxes, maps, tables and figures
��
Boxes
Box 1. Additional factors relevant to energy access 7
Box 2. Diseases with good evidence of a link with solid fuel use 23
Box 3. Description of scenarios 31
Box 4. What is a Least Developed Country? 44
Maps
Map 1. Share of people without electricity access for developing countries, 2008 11
Map 2. Share of population without access to modern fuels for developing countries, 2007 13
Map 3. Number of deaths per 1000 capita per year, attributable to indoor air pollution fromsolid fuel use, 2004 25
Map 4. Number of DALYs per 1000 capita per year, attributable to indoor air pollution fromsolid fuel use, 2004 26
Map 5. Map of the Least Developed Countries 45
Figures
Figure 1. Distribution of people without electricity access by developing regions, 2008 12
Figure 2. Share of population without electricity access for LDCs and SSA countries, 2008 12
Figure 3. Share of population without electricity access in rural and urban areas for LDCs and SSA, 2008 12
Figure 4. Share of population with access to different types of modern fuels in LDCs and SSA, 2007 14
Figure 5. Share of population with access to modern fuels in rural and urban areas of LDCs and SSA, 2007 14
Figure 6. Share of population with access to modern fuels in LDCs and SSA countries, 2007 14
Figure 7. Distribution of people relying on solid fuels for cooking by developing regions, 2007 16
Figure 8. Share of population relying on different types of solid fuels for cooking by developingregions, 2007 17
Figure 9. Share of population in developing countries relying on different types of cooking fuels, 2007 17
Figure 10. Share of population relying on different types of cooking fuels in LDCs and SSA, 2007 18
Figure 11. Share of population relying on different types of modern fuels for cooking for selected LDCsand SSA countries, 2007 18
Figure 12. Share of population relying on different types of cooking fuels in rural and urban areas of LDCsand SSA countries, 2007 19
Figure 13. Distribution of people with access to ICS by developing regions, 2007 21
Figure 14. Share of population relying on solid fuels for cooking with access to ICS, 2007 21
Figure 15. Share of population relying on solid fuels for cooking with access to ICS for selected LDCs andSSA countries, 2007 21
list of boXes, maps, figures, and tables
The Energy Access Situation in Developing Countries: A Review Focusing on the Least Developed Countries and Sub-Saharan Africa
Figure 16. Number of deaths attributable to indoor air pollution from solid fuel use, by diseases, 2004 24
Figure 17. Number of DALYs attributable to indoor air pollution from solid fuel use, by diseases, 2004 24
Figure 18. Share by gender of COPD and lung cancer deaths attributable to solid fuel use in adults >30y 27
Figure 19. Number of COPD deaths per 1 million population attributable to solid fuel use, by gender 27
Figure 20. Number of lung cancer deaths per 1 million population attributable to solid fuel use, by gender 28
Figure 21. Share of countries with electricity access targets by region 30
Figure 22. Share of countries with targets on access to modern fuels by region 30
Figure 23. Share of countries with targets on access to ICS by region 30
Figure 24. Share of population with electricity access in 2015 under different scenarios 32
Figure 25. Share of population with access to modern fuels in 2015 under different scenarios 33
Figure 26. Development measures and energy access (a-d) / (e-h) 38/39
Figure 27. (a) Attributable deaths from pneumonia < 5 years / 1000 capita, and (b) attributable DALYsfrom pneumonia < 5 years / 1000 capita 49
Figure 28. (a) Attributable deaths from COPD > 30 years / 1000 capita, and (b) attributable DALYs fromCOPD > 30 years / 1000 capita 49
Figure 29. (a) Attributable deaths and (b) DALYs from lung cancer, in adults > 30 years / 1 million population 50
Figure 30. Human Development Index 2007 versus attributable death rates (all causes) from solid fuel use 50
Figure 31. Human Development Index 2007 versus attributable death rates to pneumonia fromsolid fuel use 50
Figure 32. Human Development Index 2007 versus attributable COPD deaths from solid fuel use 51
Tables
Table 1. Number of countries with data available on access to electricity 10
Table 2. Access to electricity in the world, 2008 10
Table 3. Number of people without electricity access in LDCs and SSA, 2008 11
Table 4. Number of countries with data available on access to modern fuels 13
Table 5. Number of people relying on solid and modern fuels for cooking for LDCs and SSA, 2007 16
Table 6. Number of countries with data available on improved cooking stoves 20
Table 7. Number of people relying on solid fuels with access to ICS, 2007 20
Table 8. Numbers and rates of deaths and DALYs per million population attributable to indoor airpollution from solid fuel use, for all causes (pneumonia, COPD, lung cancer), 2004 23
Table 9. Share of deaths attributable to solid fuel use, by disease 26
Table 10. Number of developing countries with energy access targets 29
Table 11. Additional number of people with electricity access in 2015 under different scenarios 31
Table 12. Additional number of people with access to modern fuels in 2015 under different scenarios 33
Table 13. Developing country classiycation (as of early 2007) 40
Table 14. Indoor levels of PM10 and CO from household combustion of solid fuels, compared withWHO air quality guidelines 47
�
The Energy Access Situation in Developing Countries: A Review Focusing on the Least Developed Countries and Sub-Saharan Africa
Table 15. Status of evidence linking household combustion of biomass fuels and coal with child andadult health outcomes 48
Table 16. Numbers of deaths for pneumonia, COPD and lung cancer attributable to solid fuel use,by country, 2004 51
Table 17. Number of DALYs per 1000 capita for pneumonia, COPD and lung cancer attributable tosolid fuel use, by country, 2004 56
Table 18. Electricity access, by country 66
Table 19. Fuels used for cooking and access to modern fuels, by country (national population) 71
Table 20. Fuels used for cooking and access to modern fuels, by country (rural population) 78
Table 21. Fuels used for cooking and access to modern fuels, by country (urban population) 84
Table 22. Use of improved cooking stoves, by country 90
Table 23. Access to mechanical power, by country 93
Table 24. Number of countries with available data on energy access 94
Table 25. Percentage of population represented by available data on energy access 94
Table 26. Number of countries with data available on cooking fuels 95
Table 27. Percentage of population represented by available data on cooking fuels 95
Table 28. Targets for electricity access, by country 96
Table 29. Targets for access to modern fuels, by country 99
Table 30. Targets for improved cooking stoves, by country 99
Table 31. Targets for mechanical power, by country 100
Table 32. Number of developing countries with energy access targets 101
Table 33. Population of developing regions, 2007 and 2015 101
��
The Energy Access Situation in Developing Countries: A Review Focusing on the Least Developed Countries and Sub-Saharan Africa

abbreviations and acronYms
The Energy Access Situation in Developing Countries: A Review Focusing on the Least Developed Countries and Sub-Saharan Africa
���
AQGs Air Quality Guidelines
BoD Burden of Disease
CEMAC Economic and Monetary Community of Central Africa
CO Carbon monoxide
COPD Chronic Obstructive Pulmonary Disease
DALY Disability-Adjusted Life Year
DC Developing Country
EAC East African Community
EAP East Asia and the Paciyc
ECOWAS Economic Community of West African States
FEMA Forum of Energy Ministers of Africa
GTZ Gesellschaft für Technische Zusammenarbeit (German Agency for Technical Cooperation)
HDI Human Development Index
ICS Improved Cooking Stove
IEA International Energy Agency
IMF International Monetary Fund
LAC Latin America and the Caribbean
LDC Least Developed Country
LPG Liqueyed Petroleum Gas
MDG Millennium Development Goals
MDGR Millennium Development Goals Report
OECD Organization for Economic Co-operation and Development
PM10 Particulate Matter with an aerodynamic diameter of 10 micrometers
PRSP Poverty Reduction Strategy Paper
SADC Southern African Development Community
SFU Solid Fuel Use
SSA Sub-Saharan Africa
UN United Nations
UNICEF United Nations Children's Fund
UNDP United Nations Development Programme
USAID United States Agency for International Development
WHO World Health Organization

�
Expanding access to modern energy services is an enormous challenge for developing countries,especially in the poorest countries. This report takes stock of the current energy access situation indeveloping countries. It covers a range of energy access data available from developing countries thatis not currently accessible in one report and, at the same time, is also often neglected in global energydiscussions. A broad range of energy access data is critical not only to understand countries’ energyaccess situation but also for developing policies and programmes that address energy poverty and forynancing the expansion of access to modern energy services.
This report is aimed at drawing attention to the energy access situation beyond the conventional focuson electricity, especially in poorer developing countries where access is the most constrained. It alsoraises some issues related to the availability of statistical data on energy access. The report speciycallydraws attention to the:
� Energy access situation in LDCs and sub-Saharan Africa, including access to electricity and modern fuels,� Fuels and improved stoves used for cooking in developing countries,� Health impacts attributable to indoor air pollution from household use of solid fuels for cooking
and heating,� Developing countries with modern energy access targets, and� Energy access situation in 2015 under different scenarios, to estimate the progress in energy access that
will be needed for the achievement of the Millennium Development Goals (MDGs).
The main yndings are as follows:
Currently, about 1.5 billion people in developing countries lack access to electricity and about 3 billionpeople rely on solid fuels for cooking. In sub-Saharan Africa, the number of people without access toelectricity and modern fuels is similar (respectively 560 and 625 million people). In Asian regions, while peoplemay have access to electricity, they often lack access to modern fuels. In East Asia and Paciyc, less than 200million people lack electricity access, but almost 1.1 billion people rely on solid fuels for cooking.
Although energy access varies widely across developing countries, it is much lower in poorer developingcountries than in other developing countries, placing poorer countries at a huge disadvantage. Seventy-nine percent of people lack access to electricity in the LDCs and 74 percent in sub-Saharan Africa, comparedto 28 percent of those in developing countries as a whole. Access to modern fuels is equally constrained inLDCs and sub-Saharan Africa, where 91 percent and 83 percent, respectively, lack access to modern fuels.
Modern fuels and improved stoves to meet people’s most basic cooking needs are out of the reach of themajority of people living in developing countries, especially for those in rural areas. Fifty-six percent ofpeople in developing countries rely primarily on solid fuels—coal and traditional biomass—for their cookingneeds, with little or no access to more efficient, modern forms of energy. Their access to improved cookingstoves is also very limited. Only 27 percent of those who rely on solid fuels—roughly 800 million people—are estimated to use improved cooking stoves. Access to improved cooking stoves is even more limited inLDCs and sub-Saharan Africa, where only 6 percent of those who use traditional biomass are using suchoptions. Traditional biomass such as wood, charcoal, and dung is much more commonly used in rural areas
eXecutive summarY
The Energy Access Situation in Developing Countries: A Review Focusing on the Least Developed Countries and Sub-Saharan Africa
�
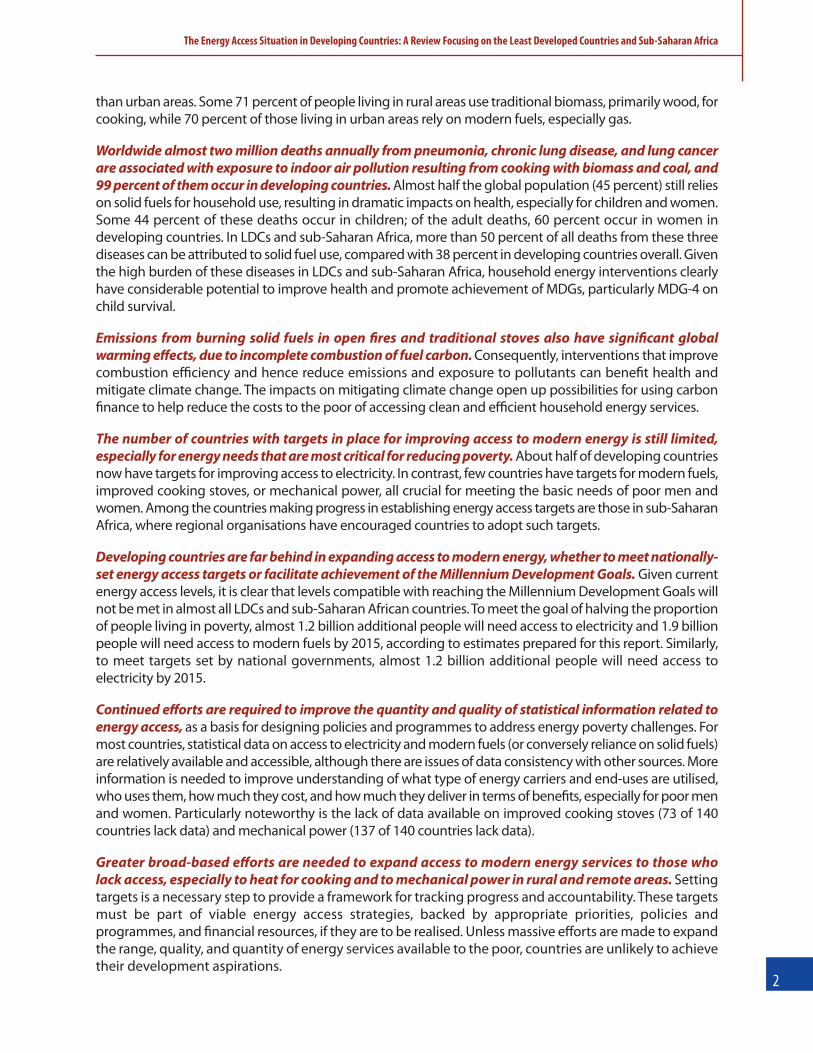
than urban areas. Some 71 percent of people living in rural areas use traditional biomass, primarily wood, forcooking, while 70 percent of those living in urban areas rely on modern fuels, especially gas.
Worldwide almost two million deaths annually from pneumonia, chronic lung disease, and lung cancerare associated with exposure to indoor air pollution resulting from cooking with biomass and coal, and99 percent of them occur in developing countries. Almost half the global population (45 percent) still relieson solid fuels for household use, resulting in dramatic impacts on health, especially for children and women.Some 44 percent of these deaths occur in children; of the adult deaths, 60 percent occur in women indeveloping countries. In LDCs and sub-Saharan Africa, more than 50 percent of all deaths from these threediseases can be attributed to solid fuel use, compared with 38 percent in developing countries overall. Giventhe high burden of these diseases in LDCs and sub-Saharan Africa, household energy interventions clearlyhave considerable potential to improve health and promote achievement of MDGs, particularly MDG-4 onchild survival.
Emissions from burning solid fuels in open Ares and traditional stoves also have signiAcant globalwarming effects, due to incomplete combustion of fuel carbon. Consequently, interventions that improvecombustion efficiency and hence reduce emissions and exposure to pollutants can beneyt health andmitigate climate change. The impacts on mitigating climate change open up possibilities for using carbonynance to help reduce the costs to the poor of accessing clean and efficient household energy services.
The number of countries with targets in place for improving access to modern energy is still limited,especially for energy needs that are most critical for reducing poverty. About half of developing countriesnow have targets for improving access to electricity. In contrast, few countries have targets for modern fuels,improved cooking stoves, or mechanical power, all crucial for meeting the basic needs of poor men andwomen. Among the countries making progress in establishing energy access targets are those in sub-SaharanAfrica, where regional organisations have encouraged countries to adopt such targets.
Developing countries are far behind in expanding access to modern energy, whether to meet nationally-set energy access targets or facilitate achievement of the Millennium Development Goals. Given currentenergy access levels, it is clear that levels compatible with reaching the Millennium Development Goals willnot be met in almost all LDCs and sub-Saharan African countries. To meet the goal of halving the proportionof people living in poverty, almost 1.2 billion additional people will need access to electricity and 1.9 billionpeople will need access to modern fuels by 2015, according to estimates prepared for this report. Similarly,to meet targets set by national governments, almost 1.2 billion additional people will need access toelectricity by 2015.
Continued efforts are required to improve the quantity and quality of statistical information related toenergy access, as a basis for designing policies and programmes to address energy poverty challenges. Formost countries, statistical data on access to electricity and modern fuels (or conversely reliance on solid fuels)are relatively available and accessible, although there are issues of data consistency with other sources. Moreinformation is needed to improve understanding of what type of energy carriers and end-uses are utilised,who uses them, how much they cost, and how much they deliver in terms of beneyts, especially for poor menand women. Particularly noteworthy is the lack of data available on improved cooking stoves (73 of 140countries lack data) and mechanical power (137 of 140 countries lack data).
Greater broad-based efforts are needed to expand access to modern energy services to those wholack access, especially to heat for cooking and to mechanical power in rural and remote areas. Settingtargets is a necessary step to provide a framework for tracking progress and accountability. These targetsmust be part of viable energy access strategies, backed by appropriate priorities, policies andprogrammes, and ynancial resources, if they are to be realised. Unless massive efforts are made to expandthe range, quality, and quantity of energy services available to the poor, countries are unlikely to achievetheir development aspirations.
The Energy Access Situation in Developing Countries: A Review Focusing on the Least Developed Countries and Sub-Saharan Africa
�
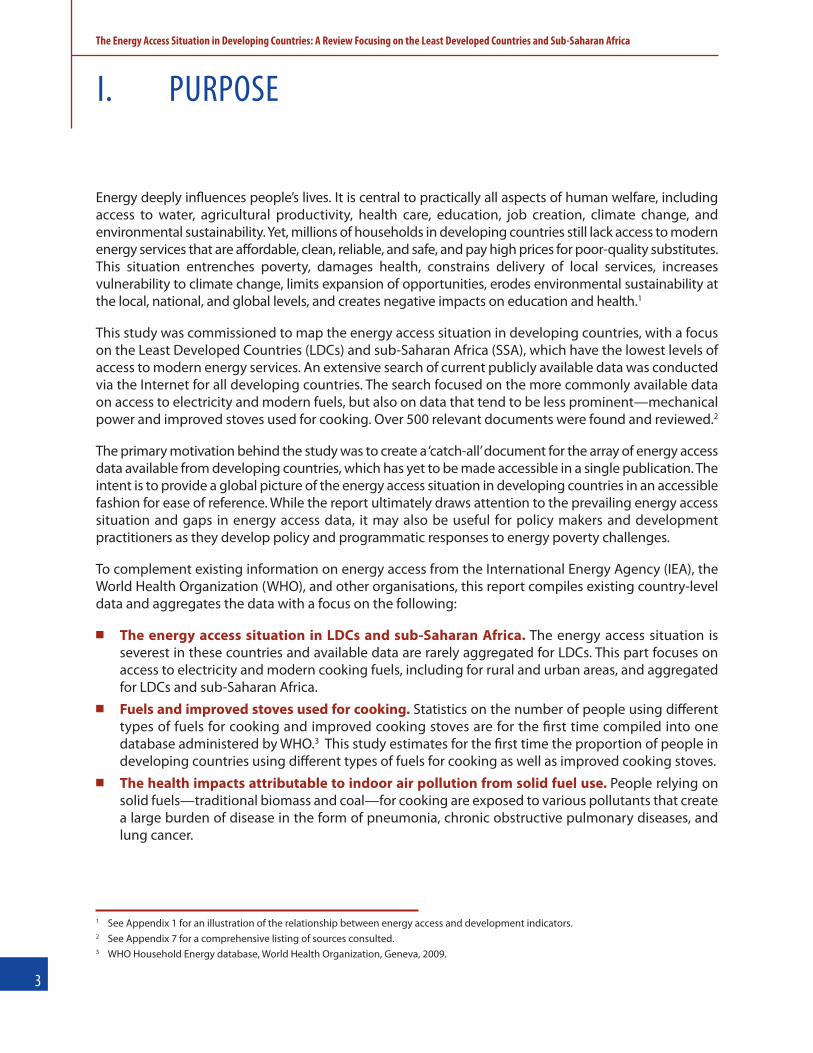
Energy deeply inzuences people’s lives. It is central to practically all aspects of human welfare, includingaccess to water, agricultural productivity, health care, education, job creation, climate change, andenvironmental sustainability. Yet, millions of households in developing countries still lack access to modernenergy services that are affordable, clean, reliable, and safe, and pay high prices for poor-quality substitutes.This situation entrenches poverty, damages health, constrains delivery of local services, increasesvulnerability to climate change, limits expansion of opportunities, erodes environmental sustainability atthe local, national, and global levels, and creates negative impacts on education and health.1
This study was commissioned to map the energy access situation in developing countries, with a focuson the Least Developed Countries (LDCs) and sub-Saharan Africa (SSA), which have the lowest levels ofaccess to modern energy services. An extensive search of current publicly available data was conductedvia the Internet for all developing countries. The search focused on the more commonly available dataon access to electricity and modern fuels, but also on data that tend to be less prominent—mechanicalpower and improved stoves used for cooking. Over 500 relevant documents were found and reviewed.2
The primary motivation behind the study was to create a‘catch-all’document for the array of energy accessdata available from developing countries, which has yet to be made accessible in a single publication. Theintent is to provide a global picture of the energy access situation in developing countries in an accessiblefashion for ease of reference. While the report ultimately draws attention to the prevailing energy accesssituation and gaps in energy access data, it may also be useful for policy makers and developmentpractitioners as they develop policy and programmatic responses to energy poverty challenges.
To complement existing information on energy access from the International Energy Agency (IEA), theWorld Health Organization (WHO), and other organisations, this report compiles existing country-leveldata and aggregates the data with a focus on the following:
� The energy access situation in LDCs and sub-Saharan Africa. The energy access situation isseverest in these countries and available data are rarely aggregated for LDCs. This part focuses onaccess to electricity and modern cooking fuels, including for rural and urban areas, and aggregatedfor LDCs and sub-Saharan Africa.
� Fuels and improved stoves used for cooking. Statistics on the number of people using differenttypes of fuels for cooking and improved cooking stoves are for the yrst time compiled into onedatabase administered by WHO.3 This study estimates for the yrst time the proportion of people indeveloping countries using different types of fuels for cooking as well as improved cooking stoves.
� The health impacts attributable to indoor air pollution from solid fuel use. People relying onsolid fuels—traditional biomass and coal—for cooking are exposed to various pollutants that createa large burden of disease in the form of pneumonia, chronic obstructive pulmonary diseases, andlung cancer.
1 See Appendix 1 for an illustration of the relationship between energy access and development indicators.2 See Appendix 7 for a comprehensive listing of sources consulted.3 WHO Household Energy database, World Health Organization, Geneva, 2009.
i. purpose
The Energy Access Situation in Developing Countries: A Review Focusing on the Least Developed Countries and Sub-Saharan Africa
� National targets on modern energy access. Past reviews by UNDP of poverty reduction strategiesand national MDG reports showed that countries’ commitments to expanding access to energyservices vary signiycantly.4 As a follow-up to these studies, this report attempts to map out countries’commitments as expressed in nationally agreed energy access targets. It focuses on targets for accessto electricity, modern fuels, improved cooking stoves, and mechanical power for rural productive uses.
� Additional number of people with modern-energy access in 2015 under different scenarios.This report estimates the number of additional people that will gain access to electricity and moderncooking fuels in 2015 under three different scenarios: Base Case Scenario, National Energy AccessTargets-Compatible Scenario, and MDG-Compatible Scenario. While the IEA has developed similarscenarios, those in this report are disaggregated for LDCs and sub-Saharan Africa.
�
4 See the reports A Review of Energy in National MDG Reports (UNDP 2007a) and Energizing Poverty Reduction A Review of the Energy-PovertyNexus in Poverty Reduction Strategy Papers (UNDP 2007b).
The Energy Access Situation in Developing Countries: A Review Focusing on the Least Developed Countries and Sub-Saharan Africa
11 In itsWorld EnergyOutlook (2006 and 2009), IEA produced global and regional estimates of access to electricity as well as reliance on traditional fuels for developingcountries as deyned by the OECD. However, the estimates provided in this report are based on the UNDP classiycation of developing countries. In Fuels for Life(2006), WHO produced an estimate of the worldwide use of solid fuels for cooking, broken out by WHO regions, which are different than the regional groupingsused in this report.
5 The country data are available in tabular form in Appendix 6 and a comprehensive listing of sources consulted in Appendix 7.6 Some data relative to Demographic and Health Surveys were obtained via personal communication from Alexander T. Izmukhambetov,
MEASURE DHS, Macro International Inc., 2008-09. Some data relative to Multiple Indicator Cluster Surveys (MICS) were obtained via personalcommunication from Ngagne Diakhate, UNICEF, New York, 2008-09.
7 A list of developing countries and their regional classiycations is provided in Appendix 2.8 World Energy Outlook 2009 (OECD/IEA 2009).9 Data on improved cooking stoves were rarely available from national statistical agencies and were primarily collected from World Health
Surveys and Multiple Indicators Cluster Surveys.10 Targets may also be in place for improving energy access at a sub-national, localised level. For instance, Cape Verde aims to bring electricity
to 10 rural localities each year (IMF 2006), and Guinea plans to equip 500 large villages with multi-functional platforms by 2015 (UNDP 2006).These targets were not included in this study.
�
A. Data collection
This report is based mainly on current, publicly accessible documents, as well as energy access data madeavailable by IEA and WHO. Over 500 documents in English, French, or Spanish were found, providingstatistical data on energy access for countries.5 In addition, some data were collected through requestsand personal communications with relevant organisations.6
Data on energy access were collected for all 140 countries deyned as developing countries by UNDP(2007c). Fifty of these countries were considered to be LDCs according to the UN’s classiycation system(UN 2007) as of early 2007. Thirty-one of the LDCs are located in sub-Saharan Africa.7
The following procedure was used to decide which data to use when competing data were found:
� Where possible, international databases using a common methodology were used, such as the WHO-sponsored World Health Surveys, the USAID-sponsored Demographic and Health Surveys, and theUNICEF-sponsored Multiple Indicators Cluster Surveys. For electricity access, country data reportedin the IEA database on electricity access featured in the World Energy Outlook 20098 were used.
� When country data were not available from international databases, national statistical sources weresearched. Data were obtained from statistical surveys, such as Living Condition Surveys, HouseholdIncome and Expenditure Surveys, Social and Living Standards Measurement Surveys, and censuses.9
� Where country data were not available from international or national statistical sources, data wereobtained from government websites, policy documents, and other reports. A few policy and MDG-related documents also provide statistics on improved cooking stoves and mechanical power.
Information on energy access targets was also collected and was obtained from Poverty ReductionStrategy Papers (PRSPs), MDG reports, national planning documents, sectoral master plans and policydocuments, and global and regional review documents.10
B. Indicators used to measure energy access
Statistics were gathered on indicators of access to modern forms of energy—electricity, modern fuels,and mechanical power11—as described below:
ii. methodologY
The Energy Access Situation in Developing Countries: A Review Focusing on the Least Developed Countries and Sub-Saharan Africa
� Access to electricity, measured as the percent of people that have a household electricityconnection. The electricity connection may vary by quantity (e.g., hours of availability in a day),quality (e.g., rated voltage and frequency), and use (e.g., light bulb to a wide range of end-uses).
� Access to modern fuels, measured as the percent of people that use electricity, liquid fuels, orgaseous fuels as their primary fuel to satisfy their cooking needs. These fuels include liqueyedpetroleum gas (LPG), natural gas, kerosene (including paraffin), ethanol, and biofuels, but exclude alltraditional biomass (e.g., yrewood, charcoal, dung, and crop residues) and coal (including coal dustand lignite).12 Access to modern fuels is also needed for heating. In most cases, populations withoutaccess to modern fuels for cooking also rely on solid fuels for heating. However, available data refermainly to fuels used for cooking.
� Access to mechanical power, measured as the percent of people that use mechanical power forproductive, non-industrial applications, such as water pumping, agricultural mechanisation, andsmall-scale agro processing (e.g., grinding, milling). It refers to the transmission of energy through asolid structure to impart motion, such as for pumping, pushing, and other similar needs, and isobtained from energy carriers (e.g., electricity, modern fuels, traditional biomass) or energy sourcestransmitted directly (e.g., wind, hydroelectric power).13
To better understand energy-related cooking practices, data were also collected on improved cookingstoves and the different types of fuels used for cooking. These are described as follows:
� Access to improved cooking stoves, measured as the percent of people relying on solid fuels—traditional biomass and coal—that use improved stoves for their cooking needs.14 This categoryincludes closed stoves with chimney, as well as open stoves or yres with chimney or hood, butexcludes open stoves or yre with no chimney or hood. Stoves that use electricity, liquid fuels, orgaseous fuels are not included.
� Access to cooking fuels, measured as the percent of people that use different types of cooking fuelsas their primary cooking fuel, including both modern and solid forms of energy.15 The types ofcooking fuels for which data are available and were collected are:
– Electricity
– Gas, including LPG, natural gas, and biogas
– Kerosene, including paraffin
– Charcoal, including char-briquettes
– Coal, including coal dust and lignite
– Wood, including wood chips, straw, shrub, grass, and crop and agricultural residues
– Dung
For this report, energy access is deyned broadly to encompass access to various forms of modern energyas described above. However, in reality the scope of ’energy access‘ can be much more complex andnuanced, as described in Box 1.
12 The terms ‘traditional’ and ‘modern’ are used here because they are widely used in the literature. However, traditional biomass can be transformed into modernbiomass, where more efficient end-use technology is used.
13 Only three countries—Benin, Central African Republic, and Mali—provide estimates of access to mechanical power and these are for rural areas only.14 REN21, in its report Renewables 2007Global Status Report (2007), estimated the number of improved cooking stoves disseminated, while the measure used in this
study is the population relying on improved cooking stoves in use.15 FAO produced a number of studies on fuelwood statistics, especially for Africa and Asia. See, for instance, Wood Energy Information in Africa (2001).
The Energy Access Situation in Developing Countries: A Review Focusing on the Least Developed Countries and Sub-Saharan Africa
�

�
The Energy Access Situation in Developing Countries: A Review Focusing on the Least Developed Countries and Sub-Saharan Africa
C. Methods used to estimate energy access
Data were sought, but not always found, for all developing countries. As a result, certain estimationswere made, as described below.
Estimates of energy access. For electricity access, the year 2008 was chosen as the base year, as most ofthe data are from the World Energy Outlook 2009,16 which references electriycation rates for 2008 (or thelatest year available). Data relating to access to modern fuels, mechanical power, and improved cookingstoves were collected for 2007. Where these data were unavailable, data for the year closest to 2007 wereused to produce an estimate of access in 2007, using population data for 2007 obtained from the UNPopulation Division.
Data collected on access to electricity ranged from 2000 to 2008. For cooking fuels, data ranged from1996 to 2008; for improved cooking stoves, data ranged from 2003 to 2007; and for mechanical power,data ranged from 2000 to 2005.
Data were sought for energy access at the national, urban, and rural levels. Where data were available fortwo of the three, estimates were made for the third using the available information. When the access rateat the national level was 97 percent or greater, then access was assumed to be 100 percent in urban areas.
Estimates of global and regional energy access. Where data from some countries were missing,estimates of global and regional energy access for developing countries were produced using a simpleextrapolation process. The extrapolation involved aggregating the data from countries for which data
8 World Energy Outlook 2009 (OECD/IEA 2009).
Box 1. Additional factors relevant to energy access
Understanding what type of energy carriers and end uses are available, who uses them, how muchthey cost, and the beneyts they provide to users, are factors to consider when assessing energyaccess. For instance, energy access can include measures related to:
The quality and quantity of energy provided. Statistical data regularly collected by statisticalagencies generally do not provide detailed data on the quantity (e.g., hours of use/availability) andquality (e.g., rated voltage and frequency) of the energy services provided, although these may beavailable from utilities and other sources.
Energy end-use appliances and equipment and the services they provide. Data on theavailability of certain household and agricultural equipment—lighting using different energysources, water pumps, refrigerators, and different types of stoves—are available from someinternational surveys, and would be useful to collect, but were beyond the scope of this report.
Socioeconomic proUle of energy users and energy affordability. Data on income levels andgeographical location of energy users are often available from statistical agencies, but othersocioeconomic data on users—prices of energy services, gender-disaggregated data, disaggregationfor key sectors such as businesses, schools, and health centres—may not be.

were available, and assuming that the level of access is the same in countries without data.17 This wasdone only where data represented at least 75 percent of the relevant population. In cases where the datarepresented fewer than 75 percent of the population, global or regional estimates were generally notproduced.18 The exception is improved cooking stoves, where some regional estimates are based ondata representing less than 75 percent of the population. Global or regional estimates could not beproduced for mechanical power, since data were found for only three countries.
Estimates of energy access in 2015 under different scenarios. The target year of 2015 was selectedbecause it is the year established by intergovernmental agreement for achieving the MDGs. The scenarioscreated for this report take into account population increases as estimated by the UN Population Division.To produce scenarios based on meeting national energy access targets, information on such targets wascollected at the country level (see Appendix 6).
The scenarios assume that progress towards energy access targets occurs at a constant, linear ratebetween 2007 and 2015. This is necessary because not all country targets are pegged to the year 2015.Where current access is 97 percent or more, it was assumed that there will be full access in 2015. Fornational targets of 90 percent or more, full access in urban areas was assumed.
The country targets for electricity access were pegged to years ranging from 2010 to 2027. For access tomodern fuels, the target years ranged from 2010 to 2030, and for access to improved cooking stoves, thetarget years ranged from 2010 to 2017. For access to mechanical power, all targets were pegged to 2015.
D. Considerations in using and interpreting estimates
As noted, this report compiles publicly available statistical data from a wide variety of sources. Therefore,statistical data collected on energy access may not be directly comparable from one country to another.
First, within a country, different estimates may exist for the same indicator. While every effort was madeto use country data that were collected from multi-country databases that use a similar methodology,this was not always possible (see section II.A for an explanation of the process used to select data availablefrom different sources).
Second, the data collected from national governments are based on the country’s own deynitions,methods, and coverage, which may differ from country to country. For instance, deynitions of whatconstitutes a rural or urban area may differ; data from national surveys will depend on the sampleselection; data from national utilities do not include illegal connections, but data from surveys mayinclude them; and some data are based on the proportion of households with energy access, while othersreference the proportion of the population with access.
E. Method used to assess the health impacts of solid fuel use
The amount of disease that results from the widespread use of solid fuels has been determined as part ofthe Global Burden of Disease Project (WHO 2009a). This burden is expressed in two main ways, yrst as'Premature Deaths' (commonly referred as deaths in this publication), and second as 'Disability Adjusted Life
�
17 Another possible method is regression analysis, which is used by the IEA (2006) and relies on available data to model trends.18 For information on the proportion of the population represented by available data, see Appendix 6.
The Energy Access Situation in Developing Countries: A Review Focusing on the Least Developed Countries and Sub-Saharan Africa

Years' (DALYs). DALYs combine (i) the years of life lost as a result of premature death and (ii) the years livedwith a disease, which are adjusted using an internationally agreed system of‘disability’weights. For example,for an acute condition, such as child pneumonia, the majority of the DALYs result from years of life lost dueto death in childhood, while for a chronic disease, such as chronic obstructive pulmonary disease (COPD),the years lived with illness are more important. For lung cancer, the situation is intermediate, as the yearslived with illness are relatively short due to the very poor survival with this disease.
Burden of disease is calculated by yrst combining information on the increased (or relative) risk19 of adisease resulting from exposure, with information on how widespread the exposure is in the population(in this case, the percentage of people using solid fuels). This allows calculation of the 'populationattributable fraction' (PAF), which is the fraction of the disease seen in a given population that can beattributed to the exposure, in this case solid fuel use. Applying this fraction to the total burden of disease(e.g., child pneumonia expressed as deaths or DALYs), gives the total number of deaths or DALYs thatresult from use of solid fuels. These calculations have also allowed for the fact that in some countries (forexample, China) a substantial proportion of the population use improved chimney stoves which reducebut do not eliminate smoke exposure, although—as will be shown in Chapter IV—only a small minorityof the poorest developing country households have access to improved stoves.
A detailed description of the methods mentioned above has been published elsewhere (WHO 2004a,2004b). The deaths and DALYs ygures presented in this report have been computed by WHO to ensurecompatibility; thus they do not necessarily rezect the official statistics of the countries, which may usealternative rigourous methods. Also, using methodology currently recommended by the Global Burdenof Disease Project,20 the number of deaths and DALYs attributable to indoor air pollution from solid fueluse were calculated without the prior removal of chronic obstructive pulmonary disease and lung cancerdeaths and DALYs attributable to smoking, and therefore lead to higher ygures than previously reported(WHO 2002, 2004a, and 2006).
�
The Energy Access Situation in Developing Countries: A Review Focusing on the Least Developed Countries and Sub-Saharan Africa
19 The 'relative risk' indicates how much more likely it is that a person will get the disease if exposed to smoke from solid fuel use, compared withsomeone who is not.
20 Recent epidemiological evidence shows that the method used previously (excluding the deaths attributable to smoking) was too conservative.
A. Access to electricity
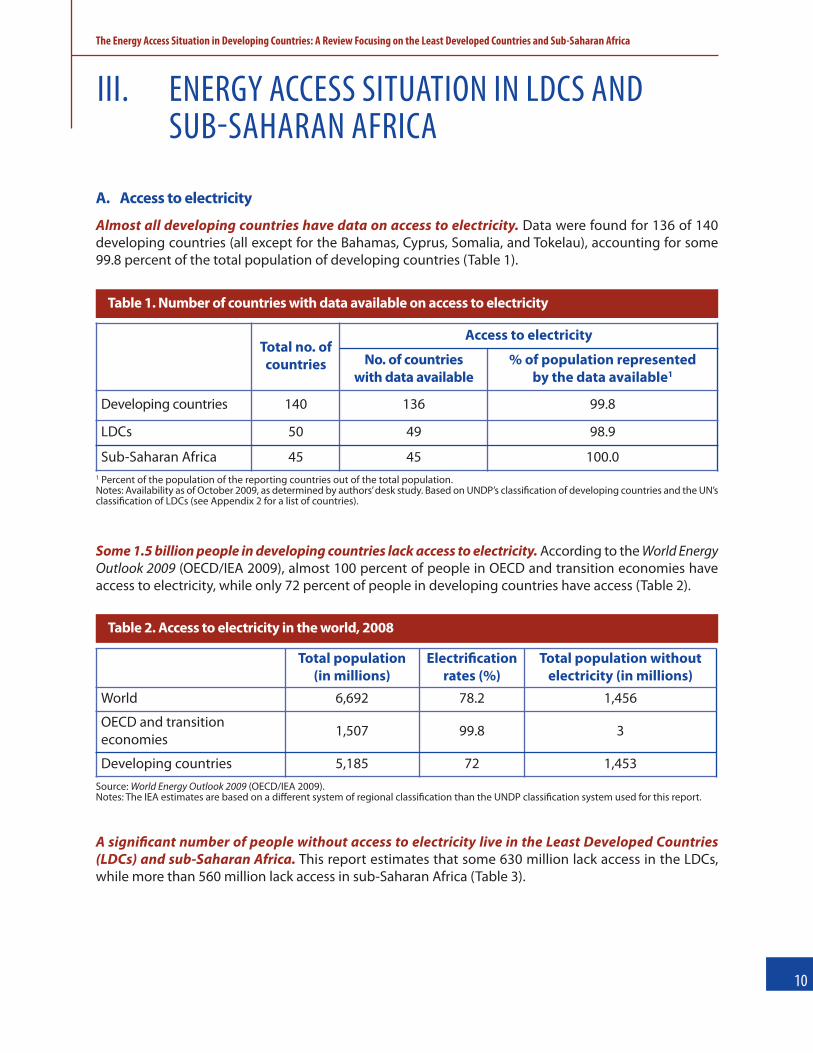
Almost all developing countries have data on access to electricity. Data were found for 136 of 140developing countries (all except for the Bahamas, Cyprus, Somalia, and Tokelau), accounting for some99.8 percent of the total population of developing countries (Table 1).
Some 1.5 billion people in developing countries lack access to electricity. According to theWorld EnergyOutlook 2009 (OECD/IEA 2009), almost 100 percent of people in OECD and transition economies haveaccess to electricity, while only 72 percent of people in developing countries have access (Table 2).
A signiAcant number of people without access to electricity live in the Least Developed Countries(LDCs) and sub-Saharan Africa. This report estimates that some 630 million lack access in the LDCs,while more than 560 million lack access in sub-Saharan Africa (Table 3).
iii. energY access situation in ldcs andsub-saharan africa
The Energy Access Situation in Developing Countries: A Review Focusing on the Least Developed Countries and Sub-Saharan Africa
��
Total no. ofcountries
Access to electricity
No. of countrieswith data available
% of population representedby the data available1
Developing countries 140 136 99.8
LDCs 50 49 98.9
Sub-Saharan Africa 45 45 100.01 Percent of the population of the reporting countries out of the total population.Notes: Availability as of October 2009, as determined by authors’desk study. Based on UNDP’s classiycation of developing countries and the UN’sclassiycation of LDCs (see Appendix 2 for a list of countries).
Total population(in millions)
ElectriUcationrates (%)
Total population withoutelectricity (in millions)
World 6,692 78.2 1,456
OECD and transitioneconomies 1,507 99.8 3
Developing countries 5,185 72 1,453Source: World Energy Outlook 2009 (OECD/IEA 2009).Notes: The IEA estimates are based on a different system of regional classiycation than the UNDP classiycation system used for this report.
Table 1. Number of countries with data available on access to electricity
Table 2. Access to electricity in the world, 2008
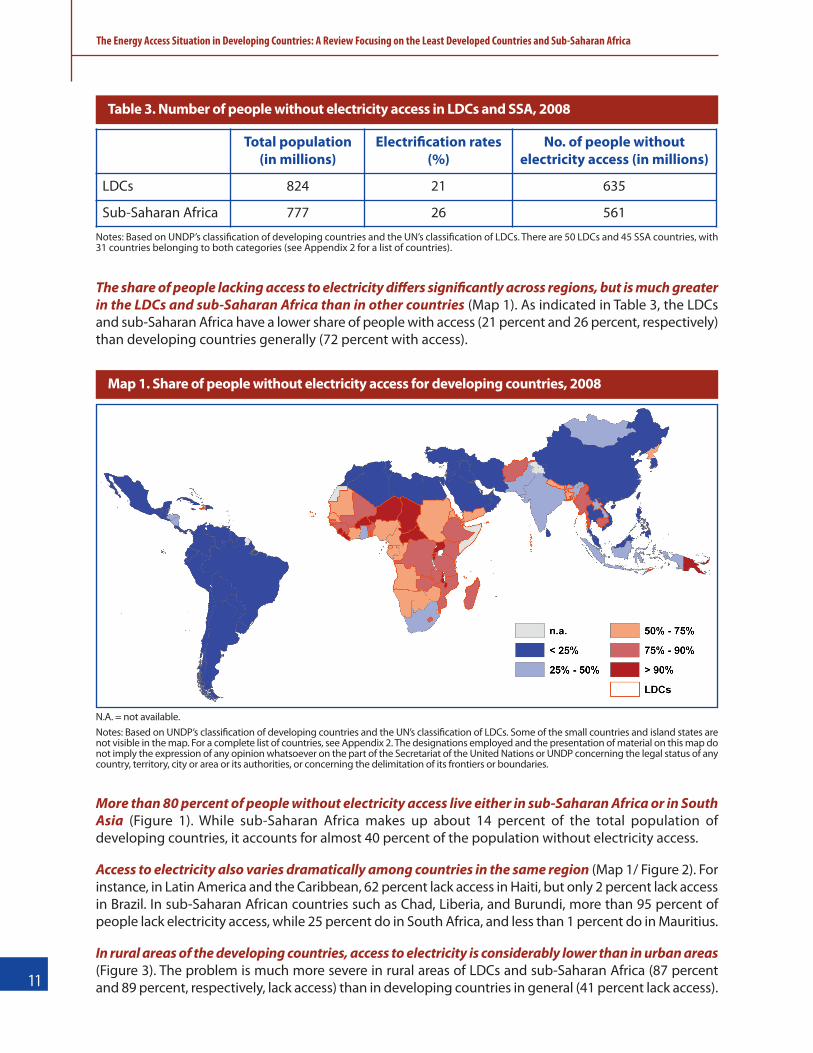
The share of people lacking access to electricity differs signiAcantly across regions, but is much greaterin the LDCs and sub-Saharan Africa than in other countries (Map 1). As indicated in Table 3, the LDCsand sub-Saharan Africa have a lower share of people with access (21 percent and 26 percent, respectively)than developing countries generally (72 percent with access).
More than 80 percent of people without electricity access live either in sub-Saharan Africa or in SouthAsia (Figure 1). While sub-Saharan Africa makes up about 14 percent of the total population ofdeveloping countries, it accounts for almost 40 percent of the population without electricity access.
Access to electricity also varies dramatically among countries in the same region (Map 1/ Figure 2). Forinstance, in Latin America and the Caribbean, 62 percent lack access in Haiti, but only 2 percent lack accessin Brazil. In sub-Saharan African countries such as Chad, Liberia, and Burundi, more than 95 percent ofpeople lack electricity access, while 25 percent do in South Africa, and less than 1 percent do in Mauritius.
In rural areas of the developing countries, access to electricity is considerably lower than in urban areas(Figure 3). The problem is much more severe in rural areas of LDCs and sub-Saharan Africa (87 percentand 89 percent, respectively, lack access) than in developing countries in general (41 percent lack access).��
The Energy Access Situation in Developing Countries: A Review Focusing on the Least Developed Countries and Sub-Saharan Africa
Map 1. Share of people without electricity access for developing countries, 2008
N.A. = not available.Notes: Based on UNDP’s classiycation of developing countries and the UN’s classiycation of LDCs. Some of the small countries and island states arenot visible in the map. For a complete list of countries, see Appendix 2. The designations employed and the presentation of material on this map donot imply the expression of any opinion whatsoever on the part of the Secretariat of the United Nations or UNDP concerning the legal status of anycountry, territory, city or area or its authorities, or concerning the delimitation of its frontiers or boundaries.
Total population(in millions)
ElectriUcation rates(%)
No. of people withoutelectricity access (in millions)
LDCs 824 21 635
Sub-Saharan Africa 777 26 561
Notes: Based on UNDP’s classiycation of developing countries and the UN’s classiycation of LDCs. There are 50 LDCs and 45 SSA countries, with31 countries belonging to both categories (see Appendix 2 for a list of countries).
Table 3. Number of people without electricity access in LDCs and SSA, 2008

��
However, even among urban populations, lack ofaccess to electricity is a signiycant problem for LDCsand sub-Saharan Africa, where about 46 percent and56 percent of urban dwellers, respectively, lackaccess, compared with only 10 percent lackingaccess in developing countries generally.
The Energy Access Situation in Developing Countries: A Review Focusing on the Least Developed Countries and Sub-Saharan Africa
Arab States3%
EAP(less China)
13%China
1%
South Asia(less India)
14%
India28%
LAC2%
SSA39%
Figure 1. Distribution of people withoutelectricity access by developing regions,2008
Note: DC regions based on UNDP’s classiycation of countries.
0 20 40 60 80 100
DCs
LDCs
SSA
41
87
46
10
56
Rural Urban
89
Percent
Figure 3. Share of population withoutelectricity access in rural and urban areasfor LDCs and SSA, 2008
Notes: Based on UNDP’s classiycation of developing countries andthe UN’s classiycation of LDCs. There are 50 LDCs and 45 SSAcountries, with 31 countries belonging to both categories (seeAppendix 2 for a list of countries).
0 20 40 60 80 100
MaldivesMauritius
TuvaluSamoa
SeychellesTonga
South AfricaCape Verde
BhutanKiribati
Lao PDRGhana
DjiboutiSao Tome and Principe
Côte d’IvoireNigeria
BotswanaNepal
SenegalZimbabwe
BangladeshComoros
HaitiYemenGabon
NamibiaEritreaSudan
MauritaniaCongo
SwazilandCameroon
Equatorial GuineaAngola
BeninCambodia
GuineaTogo
VanuatuMadagascar
ZambiaMali
LesothoEthiopia
KenyaSolomon Islands
AfghanistanMyanmar
MozambiqueTanzania
Guinea-BissauCongo DR
Burkina FasoNiger
UgandaMalawi
GambiaSierra Leone
Central African Rep.Rwanda
ChadLiberia
Burundi
01234
825
3032
404546
50525353555658595960626263
6668697070707173747576
808081818183848585868687888989899091919192
959595979797
Percent
Figure 2. Share of population withoutelectricity access for LDCs and SSAcountries, 2008
Notes: Based on UNDP’s classiycation of developing countries andthe UN’s classiycation of LDCs. There are 50 LDCs and 45 SSAcountries, with 31 countries belonging to both categories (seeAppendix 2 for a list of countries).
B. Access to modern fuels
Some 129 countries have data on access to modern fuels (see Table 4). The term modern fuels refers toelectricity, liquid fuels (such as kerosene), and gaseous fuels (such as liqueyed petroleum gas (LPG),natural gas), and excludes traditional biomass and coal.
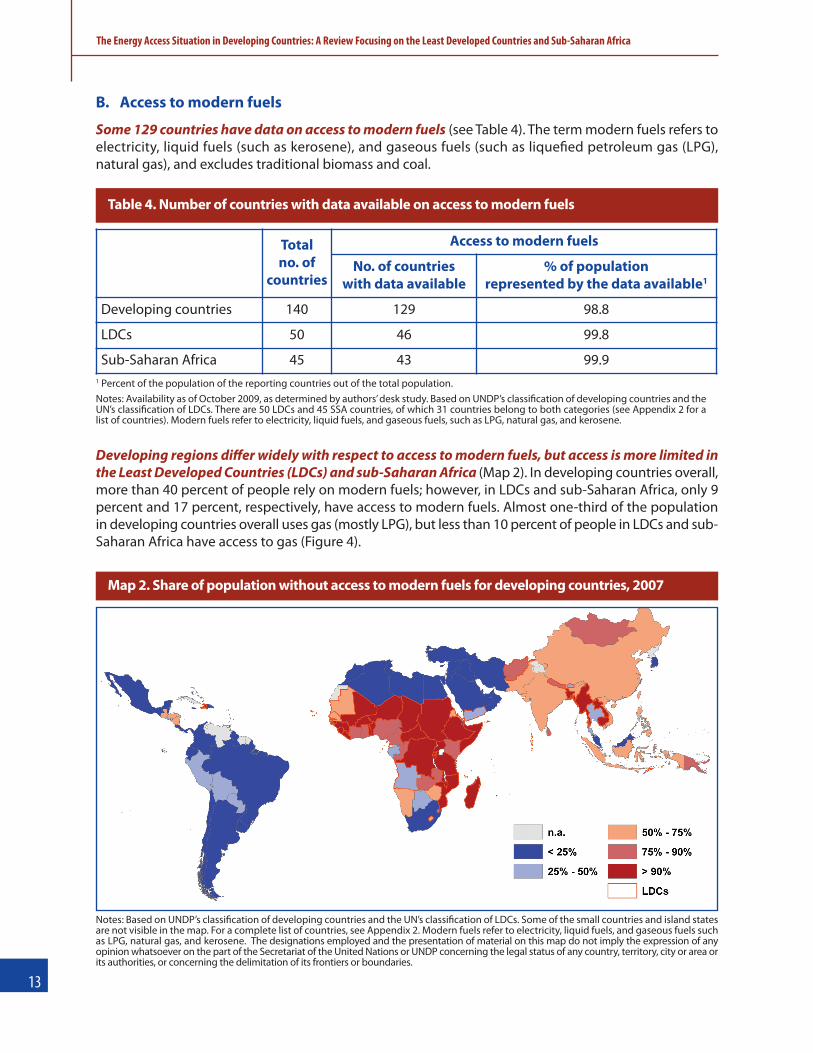
Developing regions differ widely with respect to access to modern fuels, but access is more limited inthe Least Developed Countries (LDCs) and sub-Saharan Africa (Map 2). In developing countries overall,more than 40 percent of people rely on modern fuels; however, in LDCs and sub-Saharan Africa, only 9percent and 17 percent, respectively, have access to modern fuels. Almost one-third of the populationin developing countries overall uses gas (mostly LPG), but less than 10 percent of people in LDCs and sub-Saharan Africa have access to gas (Figure 4).
��
The Energy Access Situation in Developing Countries: A Review Focusing on the Least Developed Countries and Sub-Saharan Africa
Table 4. Number of countries with data available on access to modern fuels
Totalno. of
countries
Access to modern fuels
No. of countrieswith data available
% of populationrepresented by the data available1
Developing countries 140 129 98.8
LDCs 50 46 99.8
Sub-Saharan Africa 45 43 99.91 Percent of the population of the reporting countries out of the total population.Notes: Availability as of October 2009, as determined by authors’desk study. Based on UNDP’s classiycation of developing countries and theUN’s classiycation of LDCs. There are 50 LDCs and 45 SSA countries, of which 31 countries belong to both categories (see Appendix 2 for alist of countries). Modern fuels refer to electricity, liquid fuels, and gaseous fuels, such as LPG, natural gas, and kerosene.
Map 2. Share of population without access to modern fuels for developing countries, 2007
Notes: Based on UNDP’s classiycation of developing countries and the UN’s classiycation of LDCs. Some of the small countries and island statesare not visible in the map. For a complete list of countries, see Appendix 2. Modern fuels refer to electricity, liquid fuels, and gaseous fuels suchas LPG, natural gas, and kerosene. The designations employed and the presentation of material on this map do not imply the expression of anyopinion whatsoever on the part of the Secretariat of the United Nations or UNDP concerning the legal status of any country, territory, city or area orits authorities, or concerning the delimitation of its frontiers or boundaries.

Access to modern fuels for cooking also variesdramatically among developing countries in thesame region (Map 2/Figure 6). For instance, in theAsia-Paciyc region, less than 10 percent of peoplein Bangladesh have access to modern fuels, but
��
The Energy Access Situation in Developing Countries: A Review Focusing on the Least Developed Countries and Sub-Saharan Africa
0 10 20 30 40 50
DCs
LDCs
SSA
4
1
6
33 4
7 1
4 7
Electricity
Percent
Gas Kerosene
Figure 4. Share of population with accessto different types of modern fuels in LDCsand SSA, 2007
Notes: Based on UNDP’s classiycation of developing countries andthe UN’s classiycation of LDCs. There are 50 LDCs and 45 SSAcountries, of which 31 countries belong to both categories (seeAppendix 2 for a list of countries).
0 10 20 30 40 50 60 70 80
DCs
LDCs
SSA
19
3
5
70
27
42
Rural Urban
Percent
Figure 5. Share of population with accessto modern fuels in rural and urban areas ofLDCs and SSA, 2007
Notes: Based on UNDP’s classiycation of developing countries andthe UN’s classiycation of LDCs. There are 50 LDCs and 45 SSAcountries, of which 31 countries belong to both categories (seeAppendix 2 for a list of countries). Modern fuels refer to electricity,liquid fuels, and gaseous fuels such as LPG, natural gas, and kerosene.
0 20 40 60 80 100
LiberiaRwanda
MaliSomaliaBurundiUgandaGuinea
MadagascarCentral African Rep
Sierra LeoneNiger
MalawiGuinea-Bissau
TogoChad
Lao PDRMozambique
TanzaniaMyanmar
EthiopiaCongo DR
GambiaBenin
HaitiBurkina Faso
SudanSolomon Islands
CambodiaBangladesh
GhanaAfghanistan
Côte d’IvoireVanuatuZambia
NepalCongoKenya
SamoaCameroonSwaziland
NigeriaComoros
ZimbabweEritrea
NamibiaMauritania
LesothoSenegalAngola
BotswanaBhutan
TongaCape Verde
YemenGabonTuvalu
MaldivesSouth Africa
DjiboutiMauritius
00000011111112233334556677789121214151616171719
21242425
3333353737
4152
565759
6363
6871
8183
8696
Percent
Figure 6. Share of population with accessto modern fuels in LDCs and SSA countries,2007
Notes: Based on UNDP’s classiycation of developing countries, andthe UN’s classiycation of LDCs. There are 50 LDCs and 45 SSAcountries, of which 31 countries belong to both categories (seeAppendix 2 for a list of countries). Modern fuels refer to electricity,liquid fuels, and gaseous fuels such as LPG, natural gas, and kerosene.
access is almost universal in Malaysia. In sub-Saharan Africa, less than 1 percent of people in Burundi,Liberia, Mali, Rwanda, Somalia, or Uganda have access to modern fuels, but 83 percent of people in SouthAfrica have access.
There is a large gap between access to modern fuels in rural and urban areas of developing countries(Figure 5). While about 70 percent of urban people in developing countries overall rely on modern fuelsas primary cooking fuels, only about 19 percent of rural people use modern fuels as a their primary fuel.In LDCs and sub-Saharan Africa, rural access to modern fuels is even lower, at 3 percent and 5 percent,respectively. Even in urban areas of LDCs and sub-Saharan Africa, most people still lack access to modernfuels (27 percent and 42 percent, respectively, have access).
��
The Energy Access Situation in Developing Countries: A Review Focusing on the Least Developed Countries and Sub-Saharan Africa
A. Fuels used for cooking
In developing countries, 3 billion people rely on solid fuels—traditional biomass and coal—to meettheir cooking needs. Around 2.6 billion rely on traditional biomass, while 400 million use coal as theirprimary cooking fuel. Over 700 million people without access to modern fuels for cooking live in theLeast Developed Countries (LDCs) and over 600 million in sub-Saharan Africa (Table 5).
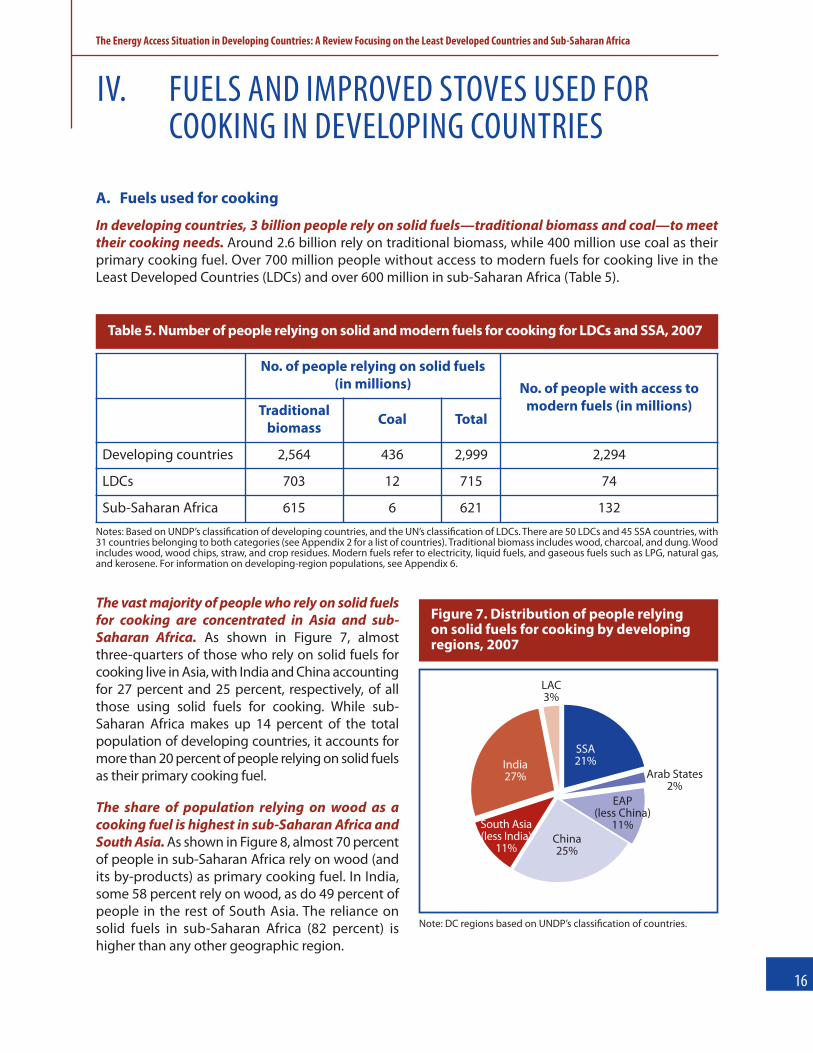
The vast majority of people who rely on solid fuelsfor cooking are concentrated in Asia and sub-Saharan Africa. As shown in Figure 7, almostthree-quarters of those who rely on solid fuels forcooking live in Asia, with India and China accountingfor 27 percent and 25 percent, respectively, of allthose using solid fuels for cooking. While sub-Saharan Africa makes up 14 percent of the totalpopulation of developing countries, it accounts formore than 20 percent of people relying on solid fuelsas their primary cooking fuel.
The share of population relying on wood as acooking fuel is highest in sub-Saharan Africa andSouth Asia. As shown in Figure 8, almost 70 percentof people in sub-Saharan Africa rely on wood (andits by-products) as primary cooking fuel. In India,some 58 percent rely on wood, as do 49 percent ofpeople in the rest of South Asia. The reliance onsolid fuels in sub-Saharan Africa (82 percent) ishigher than any other geographic region.
iv. fuels and improved stoves used forcooking in developing countries
The Energy Access Situation in Developing Countries: A Review Focusing on the Least Developed Countries and Sub-Saharan Africa
��
Table 5. Number of people relying on solid and modern fuels for cooking for LDCs and SSA, 2007
Notes: Based on UNDP’s classiycation of developing countries, and the UN’s classiycation of LDCs. There are 50 LDCs and 45 SSA countries, with31 countries belonging to both categories (see Appendix 2 for a list of countries). Traditional biomass includes wood, charcoal, and dung. Woodincludes wood, wood chips, straw, and crop residues. Modern fuels refer to electricity, liquid fuels, and gaseous fuels such as LPG, natural gas,and kerosene. For information on developing-region populations, see Appendix 6.
Arab States2%
EAP(less China)
11%China25%
South Asia(less India)
11%
India27%
LAC3%
SSA21%
Figure 7. Distribution of people relyingon solid fuels for cooking by developingregions, 2007
Note: DC regions based on UNDP’s classiycation of countries.
No. of people relying on solid fuels(in millions) No. of people with access to
modern fuels (in millions)Traditionalbiomass Coal Total
Developing countries 2,564 436 2,999 2,294
LDCs 703 12 715 74
Sub-Saharan Africa 615 6 621 132

Fewer people rely on charcoal, coal, and dung as primary cooking fuels, and the use of these fuels isconcentrated in certain countries. Charcoal is used by over 10 percent of people in sub-Saharan Africa,while almost 30 percent of people in China use coal, and 11 percent in India use dung.
The majority of people in developing countries use either wood or gas as their primary fuel forcooking. More than 40 percent of people living in developing countries rely primarily on wood forcooking, which also includes wood chips, straw, and agricultural residue. Almost one-third of people usegaseous fuels (including natural gas, LPG, and biogas) as their primary cooking fuel (Figure 9). Use of gasis much less common in the LDCs and sub-Saharan Africa, where only 7 percent and 4 percent of thepopulation, respectively, rely on gas as their main cooking fuel (Figure 10).
Overall, some 40 percent of people in developing countries have access to modern fuels for cooking(Figure 10). In contrast, the share of population in LDCs and sub-Saharan Africa with access to electricity,gas, or kerosene is only 9 percent and 17 percent, respectively.
Developing countries differ widely in their reliance on fuels used for cooking and in the types ofmodern fuels used. Figure 11 shows the reliance on different types of modern fuels for selected LDCs andsub-Saharan countries. Of the countries considered, only South Africa and Namibia rely heavily onelectricity for cooking. Use of kerosene as a cooking fuel is concentrated in a few countries, especiallyDjibouti, where it is used by 81 percent of the population as a primary cooking fuel. Gas is a principal fuelin several countries, including Angola, Cape Verde, and the Maldives.
��
The Energy Access Situation in Developing Countries: A Review Focusing on the Least Developed Countries and Sub-Saharan Africa
Coal Charcoal Wood Dung
0 20 40 60 80
India
South Asia(less India)
China
EAP(less China)
LAC
Arab States
SSA 1
22 12
12 15
52 43
29 27
49 6
58
Percent
2 11
11 69 1
Figure 8. Share of population relying ondifferent types of solid fuels for cooking bydeveloping regions, 2007
Notes: Based on UNDP’s classiycation of developing countries. China’sestimates are calculations based on rural and urban estimations. Coalincludes coal dust and lignite. Wood includes wood, wood chips,straw, and crop residues.
Kerosene4%
Charcoal3%
Wood42%
Dung3%
Coal8%
Other3%
Electricity4%
Gas33%
Figure 9. Share of population in developingcountries relying on different types ofcooking fuels, 2007
Notes: Gas includes natural gas, LPG, biogas, and ethanol. Keroseneincludes kerosene and paraffin. Coal includes coal dust and lignite.Wood includes wood, wood chips, straw, and crop residues. Otherincludes missing data, ‘no cooking in the house’, and other fuels.

��
The Energy Access Situation in Developing Countries: A Review Focusing on the Least Developed Countries and Sub-Saharan Africa
Coal
Percent
Charcoal WoodElectricity Gas Kerosene Dung Other
0 10 20 30 40 50 60 70 80 90 100
SSA
LDC
DCs 4 33 4 8 3 42 3 3
1 7 11 11 73 4 2
6 4 7 1 11 69 11
Figure 10. Share of population relying on different types of cooking fuels in LDCs and SSA, 2007
Notes: Based on UNDP’s classiycation of developing countries, and the UN’s classiycation of LDCs. There are 50 LDCs and 45 SSA countries, ofwhich 31 countries belong to both categories (see Appendix 2 for a list of countries). Gas includes natural gas, LPG, biogas, and ethanol. Keroseneincludes kerosene and paraffin. Coal includes coal dust and lignite. Wood includes wood, wood chips, straw, and crop residues. Other includesmissing data, ‘no cooking in the house’, and other fuels.
Electricity Gas Kerosene
0 10 20 30 40 50 60 70 80 90 100
RwandaTogoLaos
Congo DRHaiti
SudanGhanaKenya
CameroonComorosNamibia
AngolaCape Verde
MaldivesSouthAfrica
Djibouti
Percent
5 81266
629
1577
6352
2 2216 5
4 1311
63 3
51 110
1
4
Figure 11. Share of population relying on different types of modern fuels for cooking forselected LDCs and SSA countries, 2007
Notes: Based on UNDP’s classiycation of developing countries, and the UN’s classiycation of LDCs. There are 50 LDCs and 45 SSA countries, ofwhich 31 countries belong to both categories (see Appendix 2 for a list of countries). Gas includes natural gas, LPG, biogas, and ethanol. Keroseneincludes paraffin (mainly used in Kenya and South Africa).
21 Analyses related to ICSs were conducted taking into account only the share of population relying on solid fuels. That is, statistics exclude the share ofpopulation using electric or gas stoves for cooking.
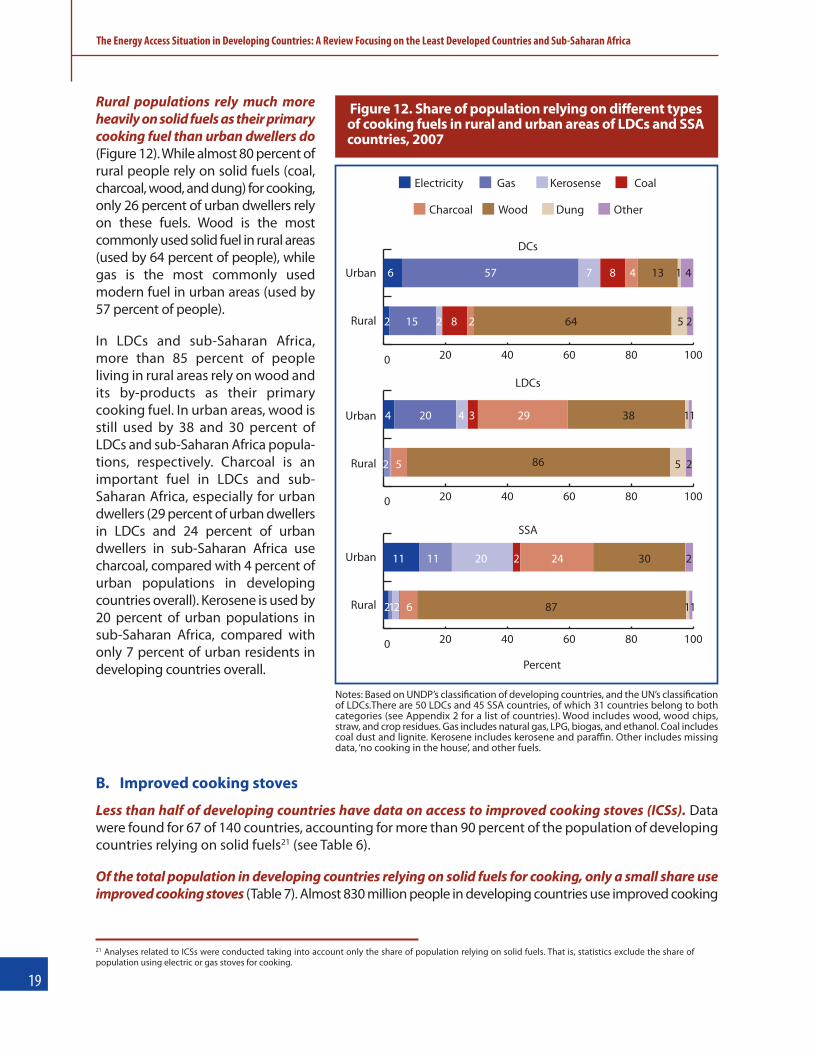
Rural populations rely much moreheavily on solid fuels as their primarycooking fuel than urban dwellers do(Figure 12). While almost 80 percent ofrural people rely on solid fuels (coal,charcoal, wood, and dung) for cooking,only 26 percent of urban dwellers relyon these fuels. Wood is the mostcommonly used solid fuel in rural areas(used by 64 percent of people), whilegas is the most commonly usedmodern fuel in urban areas (used by57 percent of people).
In LDCs and sub-Saharan Africa,more than 85 percent of peopleliving in rural areas rely on wood andits by-products as their primarycooking fuel. In urban areas, wood isstill used by 38 and 30 percent ofLDCs and sub-Saharan Africa popula-tions, respectively. Charcoal is animportant fuel in LDCs and sub-Saharan Africa, especially for urbandwellers (29 percent of urban dwellersin LDCs and 24 percent of urbandwellers in sub-Saharan Africa usecharcoal, compared with 4 percent ofurban populations in developingcountries overall). Kerosene is used by20 percent of urban populations insub-Saharan Africa, compared withonly 7 percent of urban residents indeveloping countries overall.
B. Improved cooking stoves
Less than half of developing countries have data on access to improved cooking stoves (ICSs). Datawere found for 67 of 140 countries, accounting for more than 90 percent of the population of developingcountries relying on solid fuels21 (see Table 6).
Of the total population in developing countries relying on solid fuels for cooking, only a small share useimproved cooking stoves (Table 7). Almost 830 million people in developing countries use improved cooking
��
The Energy Access Situation in Developing Countries: A Review Focusing on the Least Developed Countries and Sub-Saharan Africa
0 20 40 60 80 100
Rural
Urban
DCs
LDCs
Percent
SSA
2 15 82 2 64 5 2
6 57 7 8 4 13 1 4
0 20 40 60 80 100
Rural
Urban
0 20 40 60 80 100
Rural
Urban
Electricity Gas CoalKerosense
Charcoal DungWood Other
2 5 5 2
4 20 4 3 29 38
86
11
212 6 87 11
11 11 20 2 24 30 2
Figure 12. Share of population relying on different typesof cooking fuels in rural and urban areas of LDCs and SSAcountries, 2007
Notes: Based on UNDP’s classiycation of developing countries, and the UN’s classiycationof LDCs.There are 50 LDCs and 45 SSA countries, of which 31 countries belong to bothcategories (see Appendix 2 for a list of countries). Wood includes wood, wood chips,straw, and crop residues. Gas includes natural gas, LPG, biogas, and ethanol. Coal includescoal dust and lignite. Kerosene includes kerosene and paraffin. Other includes missingdata, ‘no cooking in the house’, and other fuels.
stoves for their cooking needs. Of these, only 44 million live in LDCs and 34 million in sub-Saharan Africa, theareas most heavily dependent on traditional biomass fuels for cooking.
In its report Renewables 2007 Global Status Report (2007), REN21 estimates the number of ICSsdisseminated to be 220 million, covering about 38 percent of households worldwide. However, the reportnotes that some of the disseminated stoves may no longer be in use. However, in this publication, themeasure of access is estimated based on the number of people who use ICSs at present.
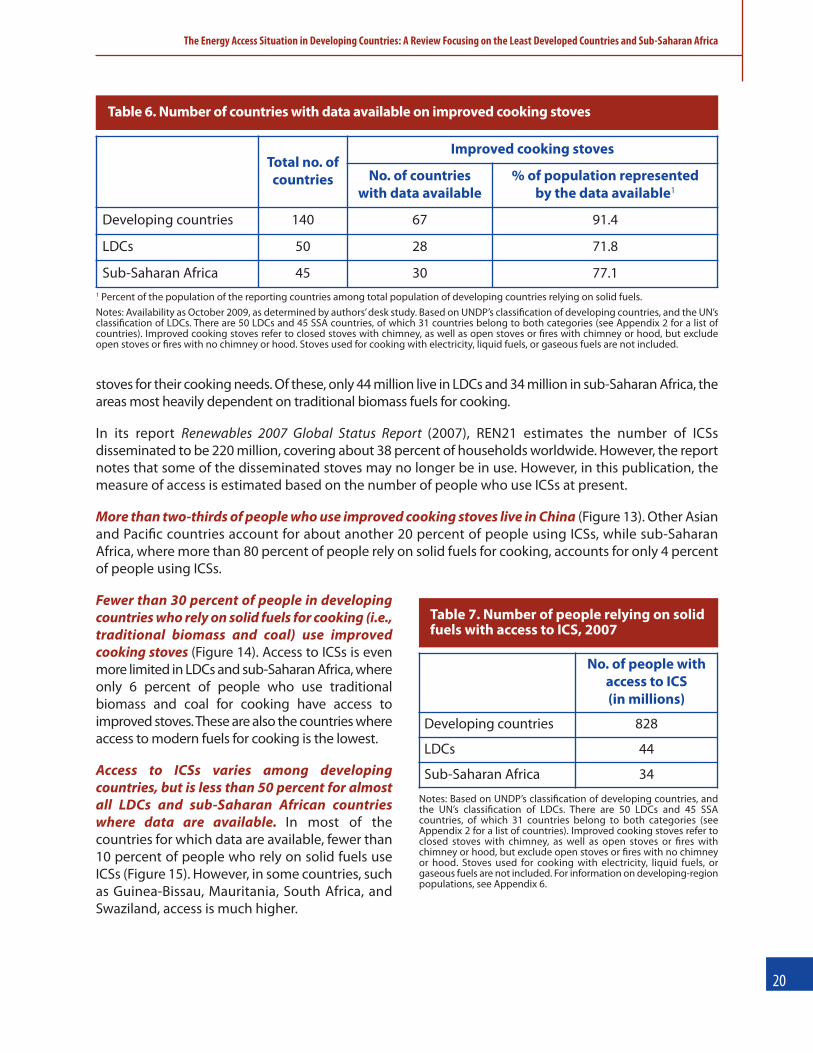
More than two-thirds of people who use improved cooking stoves live in China (Figure 13). Other Asianand Paciyc countries account for about another 20 percent of people using ICSs, while sub-SaharanAfrica, where more than 80 percent of people rely on solid fuels for cooking, accounts for only 4 percentof people using ICSs.
Fewer than 30 percent of people in developingcountries who rely on solid fuels for cooking (i.e.,traditional biomass and coal) use improvedcooking stoves (Figure 14). Access to ICSs is evenmore limited in LDCs and sub-Saharan Africa, whereonly 6 percent of people who use traditionalbiomass and coal for cooking have access toimproved stoves.These are also the countries whereaccess to modern fuels for cooking is the lowest.
Access to ICSs varies among developingcountries, but is less than 50 percent for almostall LDCs and sub-Saharan African countrieswhere data are available. In most of thecountries for which data are available, fewer than10 percent of people who rely on solid fuels useICSs (Figure 15). However, in some countries, suchas Guinea-Bissau, Mauritania, South Africa, andSwaziland, access is much higher.
��
The Energy Access Situation in Developing Countries: A Review Focusing on the Least Developed Countries and Sub-Saharan Africa
Table 6. Number of countries with data available on improved cooking stoves
Total no. ofcountries
Improved cooking stoves
No. of countrieswith data available
% of population representedby the data available1
Developing countries 140 67 91.4
LDCs 50 28 71.8
Sub-Saharan Africa 45 30 77.11 Percent of the population of the reporting countries among total population of developing countries relying on solid fuels.Notes: Availability as October 2009, as determined by authors’desk study. Based on UNDP’s classiycation of developing countries, and the UN’sclassiycation of LDCs. There are 50 LDCs and 45 SSA countries, of which 31 countries belong to both categories (see Appendix 2 for a list ofcountries). Improved cooking stoves refer to closed stoves with chimney, as well as open stoves or yres with chimney or hood, but excludeopen stoves or yres with no chimney or hood. Stoves used for cooking with electricity, liquid fuels, or gaseous fuels are not included.
Table 7. Number of people relying on solidfuels with access to ICS, 2007
No. of people withaccess to ICS(in millions)
Developing countries 828
LDCs 44
Sub-Saharan Africa 34
Notes: Based on UNDP’s classiycation of developing countries, andthe UN’s classiycation of LDCs. There are 50 LDCs and 45 SSAcountries, of which 31 countries belong to both categories (seeAppendix 2 for a list of countries). Improved cooking stoves refer toclosed stoves with chimney, as well as open stoves or yres withchimney or hood, but exclude open stoves or yres with no chimneyor hood. Stoves used for cooking with electricity, liquid fuels, orgaseous fuels are not included. For information on developing-regionpopulations, see Appendix 6.
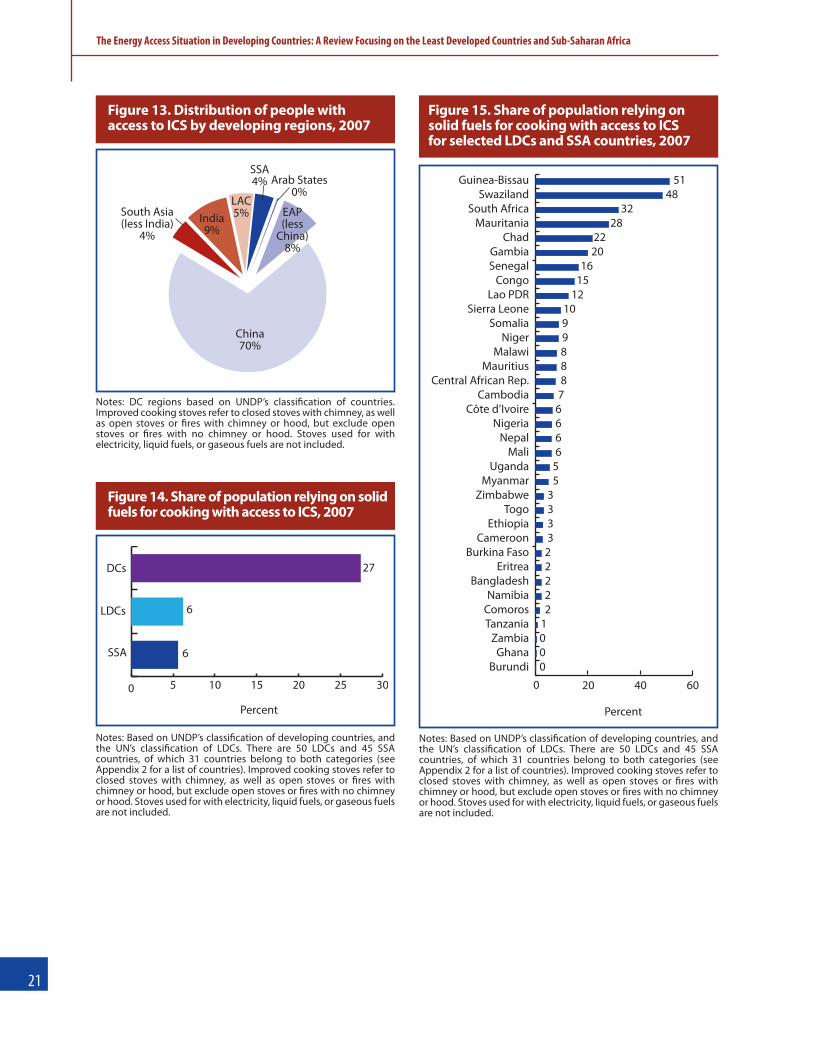
��
The Energy Access Situation in Developing Countries: A Review Focusing on the Least Developed Countries and Sub-Saharan Africa
China70%
South Asia(less India)
4%India9%
LAC5%
SSA4% Arab States
0%
EAP(less
China)8%
Figure 13. Distribution of people withaccess to ICS by developing regions, 2007
Notes: DC regions based on UNDP’s classiycation of countries.Improved cooking stoves refer to closed stoves with chimney, as wellas open stoves or yres with chimney or hood, but exclude openstoves or yres with no chimney or hood. Stoves used for withelectricity, liquid fuels, or gaseous fuels are not included.
0 5 10 15 20 25 30
DCs
LDCs
SSA
27
6
Percent
6
Figure 14. Share of population relying on solidfuels for cooking with access to ICS, 2007
Notes: Based on UNDP’s classiycation of developing countries, andthe UN’s classiycation of LDCs. There are 50 LDCs and 45 SSAcountries, of which 31 countries belong to both categories (seeAppendix 2 for a list of countries). Improved cooking stoves refer toclosed stoves with chimney, as well as open stoves or yres withchimney or hood, but exclude open stoves or yres with no chimneyor hood. Stoves used for with electricity, liquid fuels, or gaseous fuelsare not included.
0 20 40 60
BurundiGhana
ZambiaTanzaniaComorosNamibia
BangladeshEritrea
Burkina FasoCameroon
EthiopiaTogo
ZimbabweMyanmar
UgandaMali
NepalNigeria
Côte d’IvoireCambodia
Central African Rep.Mauritius
MalawiNiger
SomaliaSierra Leone
Lao PDRCongo
SenegalGambia
ChadMauritania
South AfricaSwaziland
Guinea-Bissau
0001222223333
55666678889910
121516
2022
2832
4851
Percent
Figure 15. Share of population relying onsolid fuels for cooking with access to ICSfor selected LDCs and SSA countries, 2007
Notes: Based on UNDP’s classiycation of developing countries, andthe UN’s classiycation of LDCs. There are 50 LDCs and 45 SSAcountries, of which 31 countries belong to both categories (seeAppendix 2 for a list of countries). Improved cooking stoves refer toclosed stoves with chimney, as well as open stoves or yres withchimney or hood, but exclude open stoves or yres with no chimneyor hood. Stoves used for with electricity, liquid fuels, or gaseous fuelsare not included.
Lack of access to clean, efficient, modern energy in the home can impact health in many ways. Themost important direct health effects result from the air pollution caused by burning solid fuels, oftenindoors on open Ares and simple stoves (Bruce et al. 2000; WHO 2006). The indoor use of open yres orinefficient stoves in households releases large amounts of smoke from incomplete combustion of solidfuels—primarily wood, but in many cases coal, animal dung, and/or crop wastes. Breathing this smokeaffects the health of all members of the family, but especially that of women and their young children.
The communities that are most reliant on solid fuels typically have very limited access to efficient cookingstoves (see Chapter 4). Even when households have access to improved stoves, they may result in onlysmall improvements to indoor air quality, and may be poorly maintained (Albalak et al. 2001).
Besides the health effects of indoor smoke released by incomplete combustion of solid fuels, otherhealth-related impacts associated with household fuel use in poor countries include: burns and scaldsfrom open yres or semi-open stoves; poisoning of children who drink kerosene fuel stored in soft drinkbottles; risk of injury and violence (primarily to women) while collecting wood and other solid fuels; andmissed time from school for older children involved in fuel collection. The time spent collecting solidfuel also imposes opportunity costs that constrain socio-economic development generally. While allthese issues are important, this chapter focuses on the health impacts arising from smoke pollution, thelargest and best-documented effect.
A. Health problems linked to solid fuel use
There is good evidence linking smoke from solid fuel use in developing countries with three importantdiseases—child pneumonia, chronic obstructive pulmonary disease (COPD), and lung cancer (Dheraniet al. 2008; WHO 2004a). Smoke from incomplete combustion of solid fuels contains many substancesknown to be toxic to human health through a variety of mechanisms.22 Among these pollutants, smallparticulate matter23 and carbon monoxide have been most commonly measured in homes using solidfuels.24 Box 2 indicates the additional risks of these diseases, known as the 'relative risk',25 resulting fromexposure to smoke from solid fuel use. There are indications that smoke from solid fuel use increases therisk of other serious diseases; however, the evidence for these has so far not been considered conclusiveenough for inclusion in WHO’s Global Burden of Disease assessment. (For a more detailed summary ofthe available evidence, see Annex 3.)
Worldwide, almost 2 million deaths per year are attributable to solid fuel use, with more than 99percent of these deaths occurring in developing countries (Table 8). This is equivalent to 3.3 percent ofall deaths globally. These deaths are concentrated in particular developing regions. For instance, whilethe LDCs make up about 12 percent of total population, they account for almost 30 percent of deathsattributed to solid fuel use. The death rate per million of population in LDCs and sub-Saharan Africa ismore than twice that of other developing regions (771 and 781 per million per year, respectively, versus378 per million per year for developing countries overall).
22 These mechanisms include airway irritation, damage to immune and other defences against bacteria, oxidative stress, impairing oxygen supply to theplacenta and fetus, and increasing the risk of cancer.
23 Particulate matter are airborne particles of complex mixtures of chemicals and carbon, some of which are small enough to be breathed deep into thelungs and absorbed into the blood stream.
24 See Annex 3, Table 14.25 A relative risk is indicates how much more likely it is that a person will get the disease if exposed to solid fuel smoke, compared with someone who is not.
v. health impacts of household energY use
The Energy Access Situation in Developing Countries: A Review Focusing on the Least Developed Countries and Sub-Saharan Africa
��

A broader measure of the burden of disease (‘disability-adjusted life years’, known as DALYs26)attributable to solid fuel use indicates an even more concentrated impact on particular developingregions. The DALY measure includes the years of life lost as a result of premature death caused by adisease as well as the years lived with a disease. As shown in Table 8, of the approximately 40 millionDALYs worldwide attributable to solid fuel use, some 18.4 million (45 percent) occur in LDCs and some18.0 million (44 percent) occur in sub-Saharan Africa. Because the DALY measure captures the many yearsof life lost due to deaths from child pneumonia, it shows an even stronger impact of solid fuel use on healthin the poorest countries, where pneumonia is a major cause of death in children under 5 years of age.
Developing regions differ with respect to the pattern of premature deaths from the three diseaseconditions attributable to smoke from solid fuel use. In developing countries overall, COPD accounts forslightly more than half of all deaths attributable to solid fuel use, while pneumonia accounts for slightly lessthan half (Figure 16). In the poorest countries, the LDCs and sub-Saharan Africa, however, child pneumoniamakes up a far larger share, because the disease is most common in these countries. On the other hand,
26 For a detailed description of the DALY, see chapter 2 on methodology.27 The year 2004 is the latest for which WHO has country health statistics, and therefore all deaths and DALYs are for 2004 (WHO 2009b).
��
The Energy Access Situation in Developing Countries: A Review Focusing on the Least Developed Countries and Sub-Saharan Africa
Box 2. Diseases with good evidence of a link with solid fuel use
Table 8. Numbers and rates of deaths and DALYs per million population attributable to indoorair pollution from solid fuel use, for all causes (pneumonia, COPD, lung cancer), 200427
� Child pneumonia (up to age 5 yr): risk for exposed children increased 2.3 times.� Chronic obstructive pulmonary disease (COPD) (30 yr and above): risk for exposed people
increased 3.2 times for women, 1.8 times for men.� Lung cancer (30 yr and above): where coal is used (mainly China), risk for exposed people
increased 1.9 times for women, 1.5 times for men.
Source: WHO 2004a.
Attributable deaths per year Attributable DALYs per year
Number('000)
Per 1 millionpopulation
Number(in millions)
Per 1 millionpopulation
Developing countries 1,944 378 40.5 7,878
LDCs 577 771 18.4 24,606
Sub-Saharan Africa 551 781 18 25,590
South Asia 662 423 14.2 9,075
Arab States 35 114 1.1 3,489
East Asia and Paciyc 665 341 6.5 3,308
Latin America and Caribbean 29 54 0.7 1,334
World 1,961 305 41 6,374
Notes: Based on UNDP’s classiycation of developing countries and the UN’s classiycation of LDCs. There are 50 LDCs and 45 SSA countries, ofwhich 31 countries belong to both categories (see Appendix 2 for a list of countries).

COPD predominates in China and India, mainly because the underlying rate of COPD is relatively higher inthose countries. Deaths from lung cancer, linked to coal exposure, represent a relatively small share of totaldeaths attributable to solid fuel use, since the use of coal for cooking is limited to a few countries.
Differences between regions in disease-speciAc burden attributable to solid fuel use are morepronounced when expressed as DALYs. As shown in Figure 17, child pneumonia accounts for some 75percent of DALYs attributable to solid fuel use in developing countries overall (compared with less thanhalf of all premature deaths, as shown in Figure 16), and an even greater share of DALYs in LDCs and sub-Saharan Africa. In India, pneumonia accounts for more than half of all DALYs attributable to solid fuel use(but only about a third of premature deaths). As indicated earlier, this difference is due mainly to the fact thatthe DALY measure captures the many years of life lost due to premature death from pneumonia early in life.
��
The Energy Access Situation in Developing Countries: A Review Focusing on the Least Developed Countries and Sub-Saharan Africa
Pneumonia
Deaths (’000)
COPD Lung Cancers
0 200 400 600 800 1000 1200 1400 1600 1800 2000LAC
India
South Asia (less India)
China
EAP (less China)
Arab States
SSA
LDCs
DCs
Figure 16. Number of deaths attributable to indoor air pollution from solid fuel use, bydiseases, 2004
Notes: Based on UNDP’s classiycation of developing countries and the UN’s classiycation of LDCs. There are 50 LDCs and 45 SSA countries, ofwhich 31 countries belong to both categories (see Appendix 2 for a list of countries).
Figure 17. Number of DALYs attributable to indoor air pollution from solid fuel use, bydiseases, 2004
Notes: Based on UNDP’s classiycation of developing countries and the UN’s classiycation of LDCs. There are 50 LDCs and 45 SSA countries, ofwhich 31 countries belong to both categories (see Appendix 2 for a list of countries).
Pneumonia COPD Lung Cancers
0 5000 10000 15000 20000 25000 30000 35000 40000LAC
India
South Asia (less India)
China
EAP (less China)
Arab States
SSA
LDCs
DCs
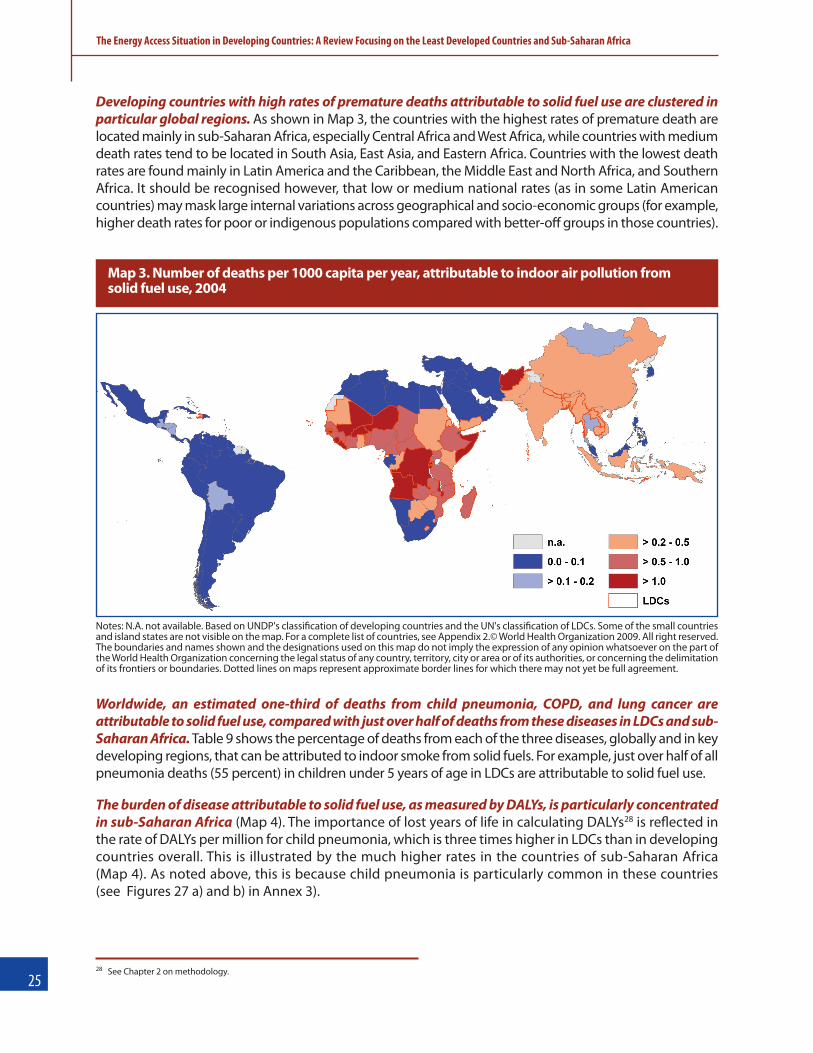
28 See Chapter 2 on methodology.
Developing countries with high rates of premature deaths attributable to solid fuel use are clustered inparticular global regions. As shown in Map 3, the countries with the highest rates of premature death arelocated mainly in sub-Saharan Africa, especially Central Africa and West Africa, while countries with mediumdeath rates tend to be located in South Asia, East Asia, and Eastern Africa. Countries with the lowest deathrates are found mainly in Latin America and the Caribbean, the Middle East and North Africa, and SouthernAfrica. It should be recognised however, that low or medium national rates (as in some Latin Americancountries) may mask large internal variations across geographical and socio-economic groups (for example,higher death rates for poor or indigenous populations compared with better-off groups in those countries).
Worldwide, an estimated one-third of deaths from child pneumonia, COPD, and lung cancer areattributable to solid fuel use, compared with just over half of deaths from these diseases in LDCs and sub-Saharan Africa. Table 9 shows the percentage of deaths from each of the three diseases, globally and in keydeveloping regions, that can be attributed to indoor smoke from solid fuels. For example, just over half of allpneumonia deaths (55 percent) in children under 5 years of age in LDCs are attributable to solid fuel use.
The burden of disease attributable to solid fuel use, as measured by DALYs, is particularly concentratedin sub-Saharan Africa (Map 4). The importance of lost years of life in calculating DALYs28 is rezected inthe rate of DALYs per million for child pneumonia, which is three times higher in LDCs than in developingcountries overall. This is illustrated by the much higher rates in the countries of sub-Saharan Africa(Map 4). As noted above, this is because child pneumonia is particularly common in these countries(see Figures 27 a) and b) in Annex 3).
��
The Energy Access Situation in Developing Countries: A Review Focusing on the Least Developed Countries and Sub-Saharan Africa
Map 3. Number of deaths per 1000 capita per year, attributable to indoor air pollution fromsolid fuel use, 2004
Notes: N.A. not available. Based on UNDP's classiycation of developing countries and the UN's classiycation of LDCs. Some of the small countriesand island states are not visible on the map. For a complete list of countries, see Appendix 2.© World Health Organization 2009. All right reserved.The boundaries and names shown and the designations used on this map do not imply the expression of any opinion whatsoever on the part ofthe World Health Organization concerning the legal status of any country, territory, city or area or of its authorities, or concerning the delimitationof its frontiers or boundaries. Dotted lines on maps represent approximate border lines for which there may not yet be full agreement.
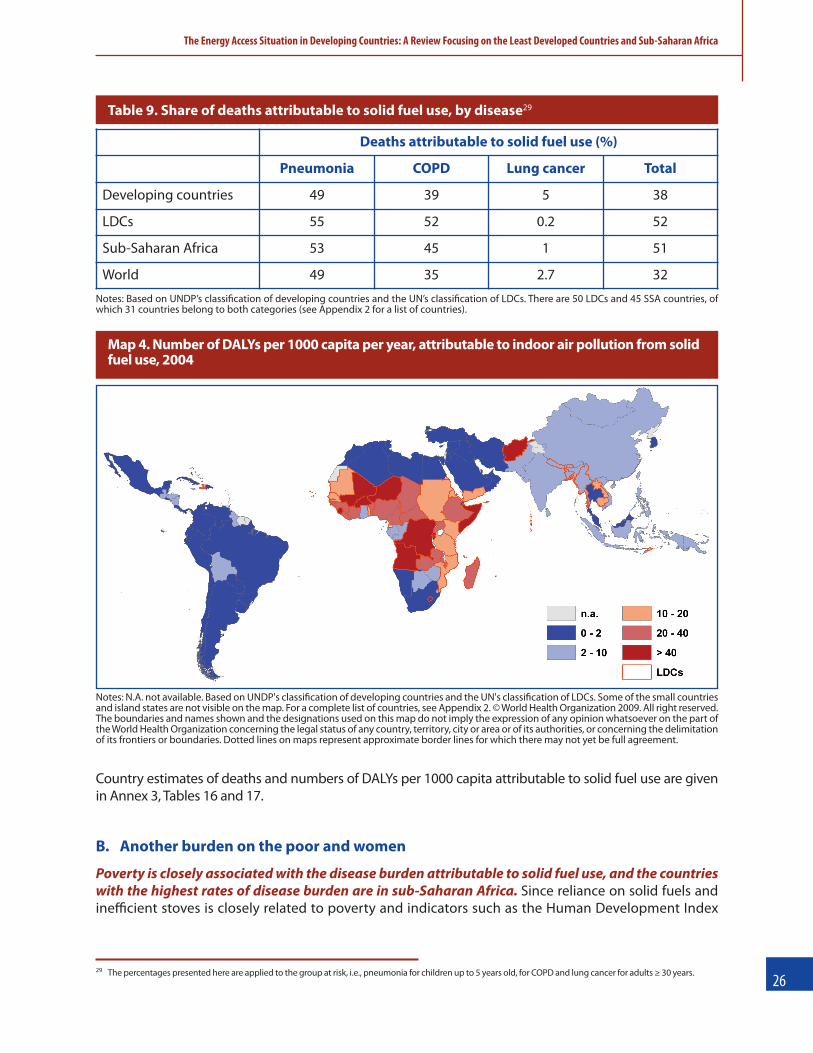
Country estimates of deaths and numbers of DALYs per 1000 capita attributable to solid fuel use are givenin Annex 3, Tables 16 and 17.
B. Another burden on the poor and women
Poverty is closely associated with the disease burden attributable to solid fuel use, and the countrieswith the highest rates of disease burden are in sub-Saharan Africa. Since reliance on solid fuels andinefficient stoves is closely related to poverty and indicators such as the Human Development Index
��29 The percentages presented here are applied to the group at risk, i.e., pneumonia for children up to 5 years old, for COPD and lung cancer for adults ≥ 30 years.
The Energy Access Situation in Developing Countries: A Review Focusing on the Least Developed Countries and Sub-Saharan Africa
Deaths attributable to solid fuel use (%)
Pneumonia COPD Lung cancer Total
Developing countries 49 39 5 38
LDCs 55 52 0.2 52
Sub-Saharan Africa 53 45 1 51
World 49 35 2.7 32
Table 9. Share of deaths attributable to solid fuel use, by disease29
Map 4. Number of DALYs per 1000 capita per year, attributable to indoor air pollution from solidfuel use, 2004
Notes: N.A. not available. Based on UNDP's classiycation of developing countries and the UN's classiycation of LDCs. Some of the small countriesand island states are not visible on the map. For a complete list of countries, see Appendix 2. © World Health Organization 2009. All right reserved.The boundaries and names shown and the designations used on this map do not imply the expression of any opinion whatsoever on the part ofthe World Health Organization concerning the legal status of any country, territory, city or area or of its authorities, or concerning the delimitationof its frontiers or boundaries. Dotted lines on maps represent approximate border lines for which there may not yet be full agreement.
Notes: Based on UNDP’s classiycation of developing countries and the UN’s classiycation of LDCs. There are 50 LDCs and 45 SSA countries, ofwhich 31 countries belong to both categories (see Appendix 2 for a list of countries).

(HDI), we would expect the burden of disease associated with household energy use to show a similarassociation. This is the case, although modiyed by the relationships between poverty and the underlyingrates for the three diseases concerned, and in the case of lung cancer also the concentration of householdcoal use in a few countries, mainly China. Overall, for all three diseases together, poverty—expressed by theHDI—is closely associated with the disease burden attributable to solid fuel use (Figures 30, 31 and 32 inAnnex 3). This association is particularly strong for child pneumonia. For a more detailed discussion on thelinks between poverty and health impacts, see Annex 3.
In developing countries, 60 percent of all deaths from COPD and lung cancers attributable to solidfuels are amongst women (Figure 18). Since women are generally in charge of cooking and spend alarge amount of time in the kitchen, they bear a larger burden of disease as a result of their higherexposure to indoor air pollution. The ratio of death rates in women compared to men are highest in EastAsia and the Paciyc, where women account for 64 percent of all deaths from COPD and lung cancerattributable to solid fuel use. For child pneumonia, no analysis by gender was performed as the availablestudies do not allow separate estimation of the risk of child pneumonia for boys and girls.
For each cause of death, rates of mortality attributable to solid fuel use differ by gender anddeveloping region. For developing countries overall, women experience substantially more of the COPDdeaths attributable to solid fuels than men (Figure 19). This is not the case in the poorest countries,however. As shown in Figure 19, the attributable death rates for COPD are similar for men and womenin the LDCs and actually lower for women in sub-Saharan Africa. These patterns are due to the lowerunderlying death rates for COPD in women compared with men in LDCs, as compared with the situation
��
The Energy Access Situation in Developing Countries: A Review Focusing on the Least Developed Countries and Sub-Saharan Africa
Men Women
0 10 20 30 40 50 60 70 80 90 100World
LAC
South Asia
EAP
Arab States
SSA
LDCs
DCs
Percent
60
44
53
64
51
40
56
47
36
57 43
62 38
60 40
49
Figure 18. Share by gender of COPD andlung cancer deaths attributable to solidfuel use in adults >30 years
Men Women
COPD deaths/1 million population0 100 200 300 400 500 600 700
SSA
LDCs
DCs
219
296
347
345
597
381
Figure 19. Number of COPD deaths per1 million population attributable to solidfuel use, by gender
Notes: Based on UNDP’s classiycation of developing countries andthe UN’s classiycation of LDCs. There are 50 LDCs and 45 SSAcountries, of which 31 countries belong to both categories (seeAppendix 2 for a list of countries).
Notes: Based on UNDP’s classiycation of developing countries andthe UN’s classiycation of LDCs. There are 50 LDCs and 45 SSAcountries, of which 31 countries belong to both categories (seeAppendix 2 for a list of countries).

in East Asia and the Paciyc. This does not meanthat we should be less concerned about theimpact on women’s health in the poorestcountries, as women have considerably greaterexposure to solid fuel smoke than men, and willexperience more COPD as this disease becomesincreasingly common in these countries.
For lung cancers, resulting from exposure to coalcombustion, the picture is rather different (Figure 20).Indeed, men are more affected across the develop-ing countries. This is explained by the higherprevalence of smoking in men, resulting in higherunderlying death rates from lung cancer in themale population.
C. Effects on global warming: an opportunity to secure health and climate ‘co-beneUts’
Many of the same pollutants that damage health—notably black carbon, (non-methane) volatile organiccompounds, and carbon monoxide, plus methane—also have global warming effects. Even when biomassfuels are renewably harvested, thereby avoiding a net increase of atmospheric CO2, these other greenhousepollutants still contribute to signiycant climate warming as a result of the very incomplete combustion ofcarbon-based fuels achieved in traditional stoves.
Compared to the power generation, transport, and other energy-intensive activities of developedcountries, the climate warming effect of household energy use in poor countries is not great; however,it is signiycant. Consequently, interventions that improve solid fuel combustion efficiency and hencereduce both emissions and exposure to pollutants can beneyt health and mitigate climate change,opening up possibilities for using carbon ynance to help reduce the costs to the poor of accessing cleanand efficient household energy. Indeed, initial efforts to take advantage of the climate beneyts ofhousehold energy interventions, have shown that the resulting carbon ynance can make an importantcontribution to program funding.
��
The Energy Access Situation in Developing Countries: A Review Focusing on the Least Developed Countries and Sub-Saharan Africa
Men Women
Lung cancer deaths/1 million population
0 2 4 6 8 10 12 14 16 18 20
SSA
LDCs
DCs
0.7
1.4
0.3
0.3
14.9
18.5
Figure 20. Number of lung cancer deathsper 1 million population attributable tosolid fuel use, by gender
Notes: Based on UNDP’s classiycation of developing countries andthe UN’s classiycation of LDCs. There are 50 LDCs and 45 SSAcountries, of which 31 countries belong to both categories (seeAppendix 2 for a list of countries).

30 The number of countries with energy access targets presented in this study refers to countries with national, rural, or urban targets.��
Almost half of developing countries (68 of 140) have established targets for access to electricity. Ofthese, 35 are in sub-Saharan Africa (Table 10). This represents a signiycant increase in the number ofcountries with electricity access targets as reported by an earlier UNDP study, based on 2005 data, whichfound that only 21 percent of national MDG reports contained energy targets disaggregated by fueland/or source (UNDP 2007a).
Regions vary considerably with respect to the proportion of countries having targets for electricityaccess (Figure 21). For instance, more than three-quarters of sub-Saharan countries (35 of 45) have settargets for electricity access, compared with only half of developing countries generally. A largeproportion of South Asian countries (67 percent) have also established targets for electricity access.
In contrast, very few countries have set targets for access to modern fuels (17 countries), access toimproved cooking stoves (11 countries), or access to mechanical power (5 countries).30 Some29 percent of sub-Saharan countries have established targets for access to modern fuels, compared withonly 12 percent of developing countries generally and only 16 percent of LDCs (Figure 22).
Sub-Saharan countries also lead in setting targets for access to improved cooking stoves (ICSs), with16 percent having established targets, compared with only 8 percent of developing countries generally(Figure 23).
The yve countries that have established targets on access to mechanical power—Benin, Cameroon,Central African Republic, Mali, and Togo—are all located in sub-Saharan Africa.
vi. developing countries with energYaccess targets
The Energy Access Situation in Developing Countries: A Review Focusing on the Least Developed Countries and Sub-Saharan Africa
Developing Countries LDCs Sub-Saharan Africa
Electricity 68 25 35
Modern fuels 17 8 13
Improved cooking stoves 11 4 7
Mechanical power 5 0 5
Total no. of countries 140 50 45
Table 10. Number of developing countries with energy access targets
Notes: Includes countries with a target at the national level or for rural or urban areas, as of October 2009, as determined by the authors’desk study.Based on UNDP’s classiycation of developing countries, and the UN’s classiycation of LDCs.There are 50 LDCs and 45 SSA countries, with 31 countriesbelonging to both categories (see Appendix 2 for a list of countries). Modern fuels refer to electricity, liquid fuels, and gaseous fuels such as LPG, naturalgas, and kerosene, and exclude traditional biomass (e.g., yrewood, charcoal, dung) and coal (including coal dust and lignite). Improved cookingstoves refer to closed stoves with chimney, as well as open stoves or yres with chimney or hood, but exclude open stoves or yres with no chimneyor hood. Stoves used for cooking with electricity, liquid fuels, or gaseous fuels are not included. Mechanical power refers to the transmission of energythrough a solid structure to impart motion, such as for pumping, pushing, and other similar needs (e.g., for milling, grinding, water pumping) and isobtained from energy carriers (e.g., electricity, traditional fuels) or energy sources transmitted directly (e.g., wind, hydraulic, geothermal).
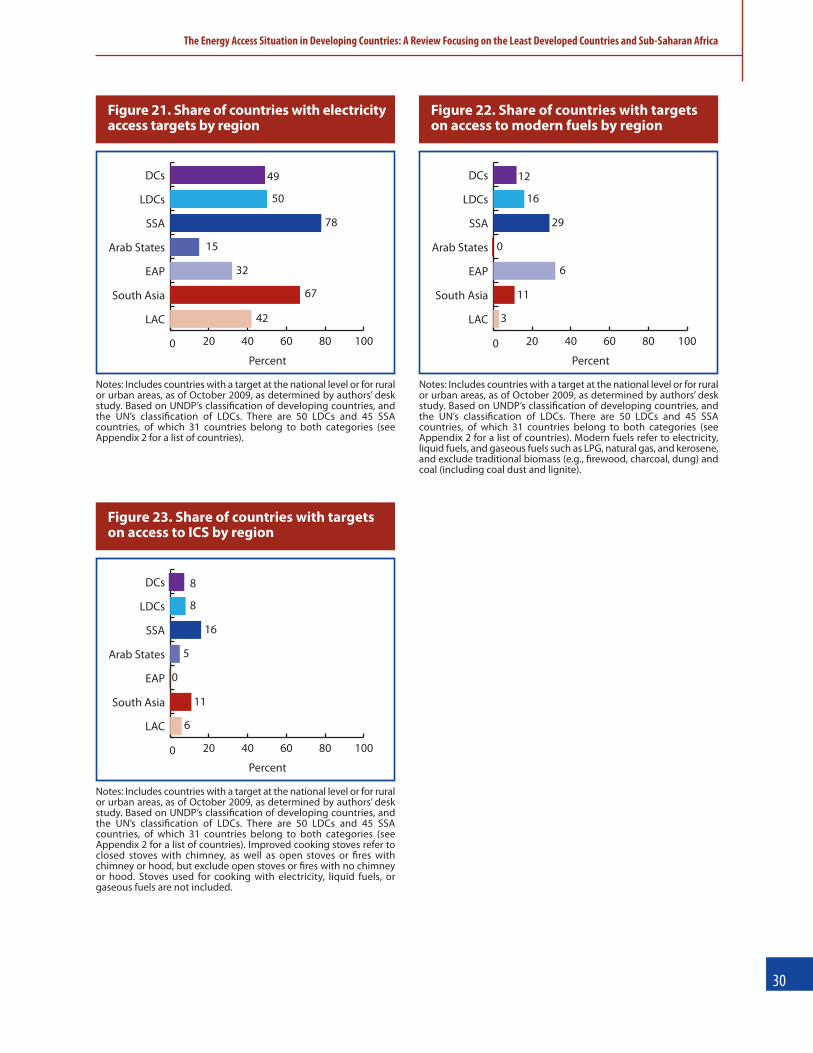
��
The Energy Access Situation in Developing Countries: A Review Focusing on the Least Developed Countries and Sub-Saharan Africa
Percent0 20 40 60 80 100
LAC
South Asia
EAP
Arab States
SSA
LDCs
DCs 49
50
78
32
15
67
42
Figure 21. Share of countries with electricityaccess targets by region
Notes: Includes countries with a target at the national level or for ruralor urban areas, as of October 2009, as determined by authors’ deskstudy. Based on UNDP’s classiycation of developing countries, andthe UN’s classiycation of LDCs. There are 50 LDCs and 45 SSAcountries, of which 31 countries belong to both categories (seeAppendix 2 for a list of countries).
Percent0 20 40 60 80 100
LAC
South Asia
EAP
Arab States
SSA
LDCs
DCs 12
16
29
6
0
11
3
Figure 22. Share of countries with targetson access to modern fuels by region
Notes: Includes countries with a target at the national level or for ruralor urban areas, as of October 2009, as determined by authors’ deskstudy. Based on UNDP’s classiycation of developing countries, andthe UN’s classiycation of LDCs. There are 50 LDCs and 45 SSAcountries, of which 31 countries belong to both categories (seeAppendix 2 for a list of countries). Modern fuels refer to electricity,liquid fuels, and gaseous fuels such as LPG, natural gas, and kerosene,and exclude traditional biomass (e.g., yrewood, charcoal, dung) andcoal (including coal dust and lignite).
Percent0 20 40 60 80 100
LAC
South Asia
EAP
Arab States
SSA
LDCs
DCs 8
8
16
0
5
11
6
Figure 23. Share of countries with targetson access to ICS by region
Notes: Includes countries with a target at the national level or for ruralor urban areas, as of October 2009, as determined by authors’ deskstudy. Based on UNDP’s classiycation of developing countries, andthe UN’s classiycation of LDCs. There are 50 LDCs and 45 SSAcountries, of which 31 countries belong to both categories (seeAppendix 2 for a list of countries). Improved cooking stoves refer toclosed stoves with chimney, as well as open stoves or yres withchimney or hood, but exclude open stoves or yres with no chimneyor hood. Stoves used for cooking with electricity, liquid fuels, orgaseous fuels are not included.

��
Scenarios were developed to estimate energy access in 2015 under different assumptions about progressin achieving national targets or in reaching the millennium development goals (see Box 3).31
A. Access to electricity
To keep pace with population growth and maintain the 2008 level of electricity access in developingcountries (Base Case Scenario) will entail providing access for an additional 350 million people by2015 (Table 11). Given the present low level of electricity access in the Least Developed Countries (LDCs)and sub-Saharan Africa, only about one-tenth of the new connections needed to maintain current levelsof electricity access are in these countries.
31 Assumptions made to estimate access in 2015 are described in the methodology section (II).32 The scenario assumes that national targets are achieved such that there is a constant rate of progress to 2015. For countries with no national targets in place,
energy access rates in 2015 are assumed to be the same as current access rates. Because relatively few countries have set national targets for access to modernfuels, Scenario 2 was produced for access to electricity only.
33 Since the Millennium Project (2005) has not proposed a goal for access to electricity in 2015, Scenario 3 (i.e., the MDG-Compatible Scenario) assumes a simple50 percent reduction in the number of people without electricity access. This will bring the number of those without access to under 1 billion, as proposed inIEA’s World Energy Outlook 2006. For further information about global and regional MDG-related energy targets, see Appendix 4.
vii. energY access in ���� underdifferent scenarios
The Energy Access Situation in Developing Countries: A Review Focusing on the Least Developed Countries and Sub-Saharan Africa
Box 3. Description of scenarios
Table 11. Additional number of people with electricity access in 2015 under different scenarios
� The Base Case Scenario assumes that the proportion of the population with energy accessremains the same as currently (2008 for electricity and 2007 for modern fuels). Given populationgrowth, this will entail large increases in the absolute number of people with energy access, evenwith no growth in the proportion of the population with energy access.
� A second scenario, the National Energy Access Targets-Compatible Scenario, assumes nationaltargets, for those countries that have set them, are achieved in such a way that there is a constantrate of progress to 2015.32
� A third scenario, the MDG-Compatible Scenario, assumes that global MDG-related targets forenergy access are achieved in 2015. It is based on a 50 percent decrease in the proportion ofpeople without access to modern fuels, as well as a 50 percent decrease in the proportion ofpeople without access to electricity.33
Additional no. of people (in millions) in 2015 over 2008
Base Case ScenarioNational Targets-
CompatibleScenario
MDG-CompatibleScenario
Developing countries 353 1,187 1,194
LDCs 34 262 408
Sub-Saharan Africa 35 223 368
Notes: Based on UNDP’s classiycation of developing countries, and the UN’s classiycation of LDCs (see Appendix 2 for a list of countries). Thereare 50 LDCs and 45 SSA countries, of which 31 countries belong to both categories (see Appendix 2 for a list of countries). The Base-Case Scenarioassumes the 2007 proportion of the population with access remains constant; the National Targets-Compatible Scenario assumes that nationaltargets, where they are in place, are met; and the MDG-Compatible Scenario assumes that a 50 percent reduction occurs for those without access.
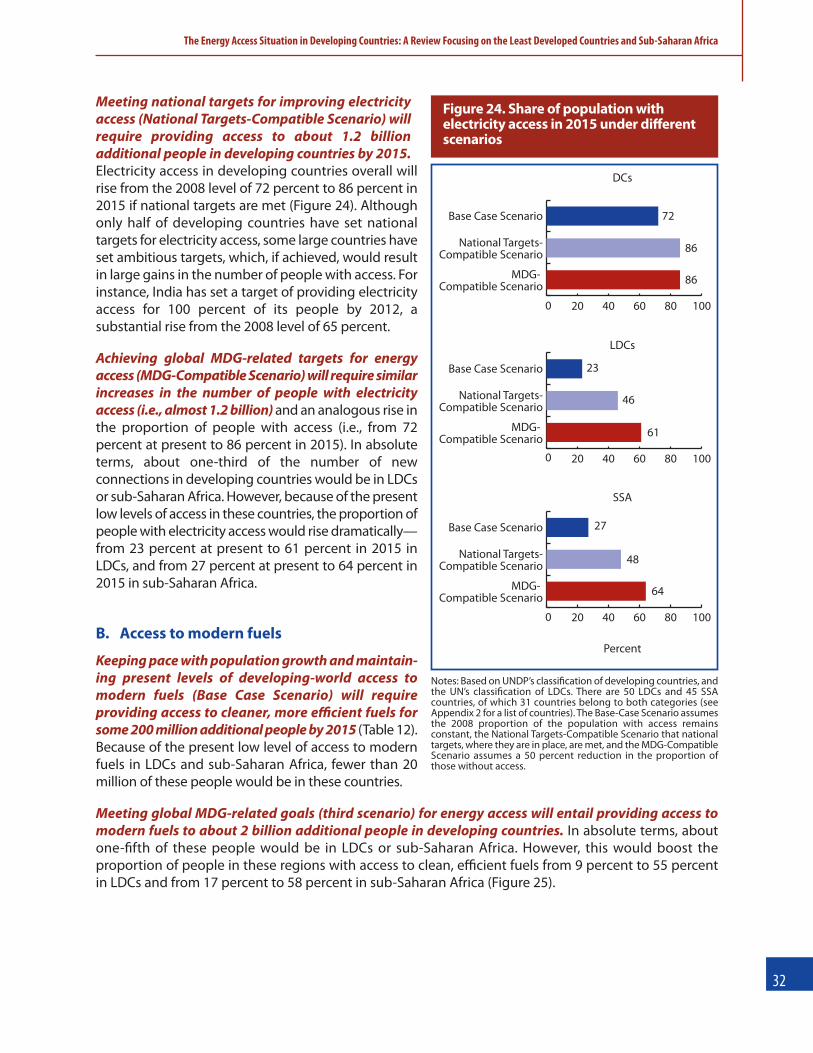
��
The Energy Access Situation in Developing Countries: A Review Focusing on the Least Developed Countries and Sub-Saharan Africa
Meeting national targets for improving electricityaccess (National Targets-Compatible Scenario) willrequire providing access to about 1.2 billionadditional people in developing countries by 2015.Electricity access in developing countries overall willrise from the 2008 level of 72 percent to 86 percent in2015 if national targets are met (Figure 24). Althoughonly half of developing countries have set nationaltargets for electricity access, some large countries haveset ambitious targets, which, if achieved, would resultin large gains in the number of people with access. Forinstance, India has set a target of providing electricityaccess for 100 percent of its people by 2012, asubstantial rise from the 2008 level of 65 percent.
Achieving global MDG-related targets for energyaccess (MDG-Compatible Scenario) will require similarincreases in the number of people with electricityaccess (i.e., almost 1.2 billion) and an analogous rise inthe proportion of people with access (i.e., from 72percent at present to 86 percent in 2015). In absoluteterms, about one-third of the number of newconnections in developing countries would be in LDCsor sub-Saharan Africa. However, because of the presentlow levels of access in these countries, the proportion ofpeople with electricity access would rise dramatically—from 23 percent at present to 61 percent in 2015 inLDCs, and from 27 percent at present to 64 percent in2015 in sub-Saharan Africa.
B. Access to modern fuels
Keeping pace with population growth and maintain-ing present levels of developing-world access tomodern fuels (Base Case Scenario) will requireproviding access to cleaner, more efficient fuels forsome 200 million additional people by 2015 (Table 12).Because of the present low level of access to modernfuels in LDCs and sub-Saharan Africa, fewer than 20million of these people would be in these countries.
Meeting global MDG-related goals (third scenario) for energy access will entail providing access tomodern fuels to about 2 billion additional people in developing countries. In absolute terms, aboutone-yfth of these people would be in LDCs or sub-Saharan Africa. However, this would boost theproportion of people in these regions with access to clean, efficient fuels from 9 percent to 55 percentin LDCs and from 17 percent to 58 percent in sub-Saharan Africa (Figure 25).
0 20 40 60 80 100
MDG-Compatible Scenario
National Targets-Compatible Scenario
Base Case Scenario
0 20 40 60 80 100
MDG-Compatible Scenario
National Targets-Compatible Scenario
Base Case Scenario
0 20 40 60 80 100
MDG-Compatible Scenario
National Targets-Compatible Scenario
Base Case Scenario
DCs
LDCs
Percent
SSA
72
86
86
23
46
61
27
48
64
Figure 24. Share of population withelectricity access in 2015 under differentscenarios
Notes: Based on UNDP’s classiycation of developing countries, andthe UN’s classiycation of LDCs. There are 50 LDCs and 45 SSAcountries, of which 31 countries belong to both categories (seeAppendix 2 for a list of countries). The Base-Case Scenario assumesthe 2008 proportion of the population with access remainsconstant, the National Targets-Compatible Scenario that nationaltargets, where they are in place, are met, and the MDG-CompatibleScenario assumes a 50 percent reduction in the proportion ofthose without access.

��
The Energy Access Situation in Developing Countries: A Review Focusing on the Least Developed Countries and Sub-Saharan Africa
Table 12. Additional number of peoplewith access to modern fuels in 2015 underdifferent scenarios
Notes: Based on UNDP’s classiycation of developing countries, and theUN’s classiycation of LDCs. There are 50 LDCs and 45 SSA countries, ofwhich 31 countries belong to both categories (see Appendix 2 for a listof countries). Modern fuels refer to electricity, liquid fuels, and gaseousfuels such as LPG, natural gas, and kerosene. The Base Case Scenarioassumes that the 2007 proportion of the population with access remainsconstant, and the MDG-Compatible Scenario assumes a 50 percentreduction in the proportion of those without access. The NationalTargets-Compatible Scenario is not provided due to an insufficientnumber of countries with targets.
Additional no. of people in2015 (in millions) over 2007
Base CaseScenario
MDG-Compatible
Scenario
Developingcountries 214 1,931
LDCs 15 454
Sub-SaharanAfrica 19 400
0 20 40 60 80 100
MDG-Compatible Scenario
Base Case Scenario
0 20 40 60 80 100
MDG-Compatible Scenario
Base Case Scenario
0 20 40 60 80 100
MDG-Compatible Scenario
Base Case Scenario
DCs
42
LDCs
Percent
SSA
71
9
55
17
58
Figure 25. Share of population withaccess to modern fuels in 2015 underdifferent scenarios
Notes: Based on UNDP’s classiycation of developing countries, andthe UN’s classiycation of LDCs. There are 50 LDCs and 45 SSAcountries, of which 31 countries belong to both categories (seeAppendix 2 for a list of countries). Modern fuels refer to electricity,liquid fuels, and gaseous fuels such as LPG, natural gas, andkerosene. The Base Case Scenario assumes that the 2007proportion of the population with access remains constant, andthe MDG-Compatible Scenario assumes a 50 percent reduction inthe proportion of those without access. The National Targets-Compatible Scenario is not provided due to an insufficient numberof countries with targets.

This report aims to draw attention to key areas relevant to tracking progress on energy access.
First, this report sought out data on energy access, which includes not only access to energy carriers, butalso the services provided by energy end uses. Data on access to electricity are almost universallyavailable. Data on type of fuels used for cooking and improved cooking stoves are available for a goodnumber of countries. While access to mechanical power is critical for poverty reduction, information isavailable for only three countries.
Second, a large number of countries do not have energy access targets in place, particularly for thoseaspects of energy access that are most crucial for reducing poverty. A growing number of countries,especially in sub-Saharan Africa, have set energy access targets, mostly for electricity. However, fewcountries have targets for improving access to energy for meeting basic needs, including modern fuelsfor cooking, improved cooking stoves, and mechanical power.
Third, the efficiency, utility, and cleanliness of household energy systems in developing countries impactson health in many ways. Indoor air pollution arising from poor combustion of biomass and coal isresponsible for nearly 2 million deaths globally each year, almost all in developing countries. Nearly half(44 percent) of these deaths are from child pneumonia, and the remainder from chronic lung diseaseand lung cancer, of which women bear a larger share (60 percent). Of all deaths from these three causes,38 percent in developing countries and 52 percent in LDCs, can be attributed to solid fuel use, providinga clear indication of the potential that household energy interventions have for health improvement.The poorest countries also have the highest burden of disease from solid fuels, particularly in the caseof child pneumonia, which remains the single most important cause of deaths in children under yveyears. This combination of poor access to clean and efficient energy and high rates of disease amonghouseholds living in great poverty emphasises the importance of coordinated policy and action onhousehold energy, health, and development.
Fourth, developing countries overall are behind in making progress toward improving access to modernenergy services. Given current trends, levels of modern energy access compatible with reaching theMillennium Development Goals will in many instances not be met, nor will many nationally establishedtargets be attained. This lack of progress in providing access to modern energy services will act as abottleneck, severely constraining many countries’ ability to meet their overall development aspirations.
Greater broad-based efforts are needed to expand access to modern energy services to those who lackaccess, especially to heat for cooking, and mechanical power in rural and remote areas. Setting targets is anecessary step in providing a framework for tracking progress and accountability, but is only one piece ofthe broader effort needed to expand energy access. Political leadership, appropriate priorities and policies,and the massive scaling up of programmes are also needed to enhance opportunities for investment.
viii. conclusions
The Energy Access Situation in Developing Countries: A Review Focusing on the Least Developed Countries and Sub-Saharan Africa
��
��
Albalak, R., Bruce, N. G., McCracken, J. P., & Smith, K. R. 2001. ‘Indoor respirable particulate matterconcentrations from an open yre, improved cookstove, and LPG/open yre combination in a ruralGuatemalan community’, Environmental Science and Technology, vol. 35, pp. 2650-2655
Bangladesh Bureau of Statistics. 2007. Key 7nding of HIES – 2005.
Bruce, N. G., Perez-Padilla, R., & Albalak, R. 2000. ‘Indoor air pollution in developing countries: a majorenvironmental and public health challenge.’ Bulletin of the World Health Organisation, vol. 78,pp. 1078-1092.
Bruce, N. G., Rehfuess, E., Mehta, S., Hutton, G., & Smith, K. R. 2006. ‘Indoor Air Pollution’ in DiseaseControl Priorities in Developing Countries - Second Edition, D. T. Jamison et al., eds., OxfordUniversity Press/The World Bank, New York, pp. 793-815.
CEMAC. 2006. Cadre d’analyse logique du Plan d'Action CEMAC.
Dherani, M., Pope, D., Mascarenhas, M., Smith, K. R., Weber, M., & Bruce, N. G. 2008. ‘Indoor air pollutionfrom unprocessed solid fuel use and pneumonia risk in under-5 children: systematic review andmeta-analysis’, Bulletin of the World Health Organisation, vol. 86, no. 5, pp. 390-398.
EAC. 2007. Strategy on Scaling Up Access to Modern Energy Services in Order to Achieve theMillennium Development Goals.
ECOWAS (UEMOA). 2006. White Paper for a regional policy, geared towards increasing access to energyservices for rural and peri-urban populations in order to achieve the Millennium Developments Goals.
FAO. 2001. Wood energy information in Africa.
FEMA. 2005. FEMA Position Paper: Energy and theMDGs.
GNESD. 2007. Reaching the Millennium Development Goals and Beyond. Global Network on Energyfor Sustainable Development.
IEA/OECD. 2004. World Energy Outlook 2004.
IEA/OECD. 2006. World Energy Outlook 2006.
IEA/OECD. 2009. World Energy Outlook 2009.
IMF. 2005. Bangladesh: Unlocking the Potential National Strategy for Accelerated Poverty Reduction.
IMF. 2006. Implementation of the Growth and Poverty Reduction Strategy Cape Verde. PRSPProgress Report.
IMF. 2007. Senegal: Poverty Reduction Strategy Paper, IMF Country Report No. 07/316.
Millennium Project, UNDP, World Bank, and ESMAP. 2005. Energy Services for theMillenniumDevelopment Goals.
references
The Energy Access Situation in Developing Countries: A Review Focusing on the Least Developed Countries and Sub-Saharan Africa
REN21. 2007. Renewables 2007 Global Status Report. Renewable Energy Policy Network for the 21stCentury.
SADC, undated. Regional Indicative Strategic Development Plan.
Uganda, Republic of. 2007. The Renewable Energy Policy for Uganda. Ministry of Energy and MineralDevelopment.
UN. 2007. Least Developed Countries: List (accessed December 2007).
UNDP. 2005a. MDG Monitoring and Reporting: A Review of Good Practices.
UNDP. 2005b. Millennium Development Goals Bangladesh Progress Report.
UNDP. 2006. OMD Présentation du Rapport Diagnostic Secteur Energie.
UNDP. 2007a. A Review of Energy in National MDG Reports.
UNDP. 2007b. Energizing Poverty Reduction A Review of the Energy-Poverty Nexus in PovertyReduction Strategy Papers.
UNDP. 2007c. Human Development Report 2007.
UNPD. 2006. World Population Prospect: The 2006 Revision Population Database.
WHO 2000. Air quality guidelines for Europe, 2nd ed. Copenhagen, WHO Regional Office for Europe,2000.
WHO 2002. WHO (2002b). World Health Report, ‘Reducing risks, promoting healthy life’.
WHO. 2004a. Smith K, Mehta S, Maeusezahl-Feuz M (2004). Indoor air pollution from household use ofsolid fuel. In: Ezzati M, Lopez AD, Rodgers A, Murray CJL, eds. Comparative quantiycation of healthrisks: global and regional burden of disease attributable to selected major risk factors. Geneva,World Health Organization, Vol. 2.
WHO. 2004b. Desai M, Mehta S, Smith K (2004) Indoor smoke from solid fuels - Assessing theenvironmental burden of disease at national and local levels. World Health Organization, Geneva.Environmental Burden of Disease Series No. 4.
WHO. 2005. WHO Air quality guidelines global update 2005, World Health Organisation, Copenhagen,EUR/05/5046029.
WHO. 2006. Fuel for Life.
WHO. 2009a. Global burden of disease project, accessible at www.who.int/evidence/gbd.
WHO. 2009b. Country proyles of environmental burden of disease, World Health Organization. Access:www.who.int/quantifying_ehimpacts/countryproyles.
WHO. 2009c. Global health risks - Mortality and burden of disease attributable to selected major risks,Access: www.who.int/healthinfo/global_burden_disease/GlobalHealthRisks_report_full.pdf
��
The Energy Access Situation in Developing Countries: A Review Focusing on the Least Developed Countries and Sub-Saharan Africa
��
Energy’s importance to development is not a matter of mere supposition. There is considerable empiricalevidence to suggest a signiycant relationship between access to modern energy and humandevelopment. This is illustrated below via four distinct measures of development, all of which show acorrelation between energy access and human development.
Figure 26 displays the relationship between a country’s energy access and human development measures.The graphs illustrate the link between energy access and measures of poverty reduction. Energy access ispositively correlated with human development, as evidenced by the upward sloping trend in the graphson the Human Development Index (HDI)34 and educational enrolment ratios. Access to energy isnegatively correlated with measures of poverty and deprivation, as evidenced by the downward slopingtrend in the graphs on people living on less than $1 a day, as well as child and maternal mortality rates.35
The graphs also illustrate that countries that develop do so in tandem with improvements in energyaccess. In fact, no country in modern times has substantially reduced poverty without a massive increasein its use of modern energy services.
While access to modern energy services alone is not sufficient to eradicate extreme poverty, it is anecessary condition for improving economic and social opportunities for poor men and women. Accessto modern energy services improves productivity and enables local income generation by freeing uppeople’s money and time for more productive uses that can improve human welfare.
34 The HDI is a composite index produced by UNDP that measures a country's achievements in three key aspects of human development: longevity, knowledge,and a decent standard of living.
35 These development measures are also embodied in the Millennium Development Goals. Improving access to modern energy services has positive effects onpeople’s ability to generate income and reduce hunger (MDG 1), improve educational opportunities and health outcomes (MDGs 2, 4, and 5), and reduce genderequities (MDGs 2 and 3), all of which affect human development. Information on the MDGs is available at http://www.un.org.
appendiX �: energY accessand development measures
The Energy Access Situation in Developing Countries: A Review Focusing on the Least Developed Countries and Sub-Saharan Africa
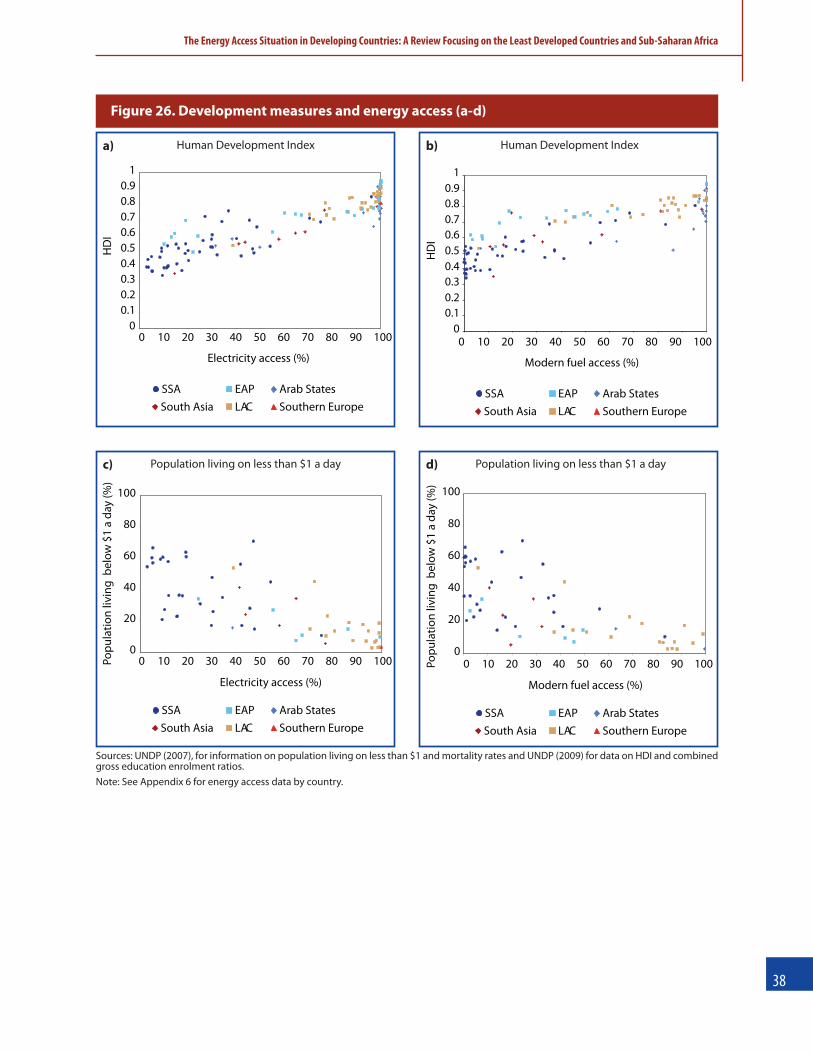
��
The Energy Access Situation in Developing Countries: A Review Focusing on the Least Developed Countries and Sub-Saharan Africa
Figure 26. Development measures and energy access (a-d)
Sources: UNDP (2007), for information on population living on less than $1 and mortality rates and UNDP (2009) for data on HDI and combinedgross education enrolment ratios.Note: See Appendix 6 for energy access data by country.
Electricity access (%)
HD
I
00 10 20 30 40 50 60 70 80 90 100
0.10.20.30.40.50.60.70.80.9
1
South AsiaArab StatesSSA
LACEAP
Southern Europe
Modern fuel access (%)
HD
I
0 10 20 30 40 50 60 70 80 90 100
South AsiaArab StatesSSA
LACEAP
Southern Europe
00.10.20.30.40.50.60.70.80.9
1
a) b)Human Development Index
Electricity access (%)
Popu
latio
nliv
ing
belo
w$1
ada
y(%
)
0 10 20 30 40 50 60 70 80 90 100
South AsiaArab StatesSSA
LACEAP
Southern Europe
0
20
40
60
80
100
Modern fuel access (%)
Popu
latio
nliv
ing
belo
w$1
ada
y(%
)
0 10 20 30 40 50 60 70 80 90 100
South AsiaArab StatesSSA
LACEAP
Southern Europe
0
20
40
60
80
100
c) d)Population living on less than $1 a day Population living on less than $1 a day
Human Development Index

��
The Energy Access Situation in Developing Countries: A Review Focusing on the Least Developed Countries and Sub-Saharan Africa
Figure 26. Development measures and energy access (e-h)
Sources: UNDP (2007), for information on population living on less than $1 and mortality rates and UNDP (2009) for data on HDI and combinedgross education enrolment ratios.Note: See Appendix 6 for energy access data by country.
Electricity access (%)
Com
bine
dgr
oss
enro
lmen
trat
iofo
rprim
ary,
seco
ndar
,ter
tiary
educ
atio
n(%
)
0 10 20 30 40 50 60 70 80 90 1000
20
40
60
80
100
South AsiaArab StatesSSA
LACEAP
Southern Europe
Modern fuel access (%)
Com
bine
dgr
oss
enro
lmen
trat
iofo
rprim
ary,
seco
ndar
,ter
tiary
educ
atio
n(%
)
0 10 20 30 40 50 60 70 80 90 1000
20
40
60
80
100
South AsiaArab StatesSSA
LACEAP
Southern Europe
e) f)Education enrolment ratio Education enrolment ratio
Electricity access (%)
Und
er-�
vem
orta
lity
rate
(per
1,00
0liv
ebi
rths
)
0 10 20 30 40 50 60 70 80 90 1000
50
100
150
200
250
300
South AsiaArab StatesSSA
LACEAP
Southern Europe
Electricity access (%)
Mat
erna
lmor
talit
yra
tio(p
er10
0,00
0liv
ebi
rth)
0 10 20 30 40 50 60 70 80 90 1000
500
1000
1500
2000
2500
South AsiaArab StatesSSA
LACEAP
Southern Europe
g) h)Child and maternal mortality rates Child and maternal mortality rates
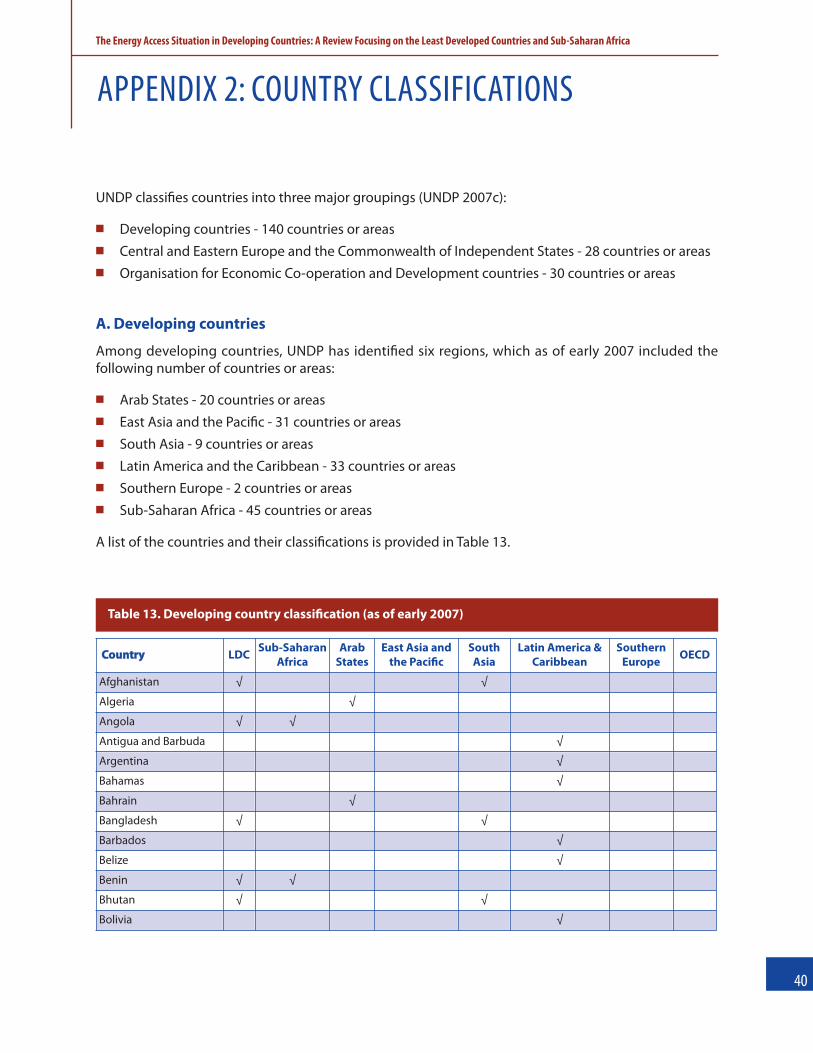
The Energy Access Situation in Developing Countries: A Review Focusing on the Least Developed Countries and Sub-Saharan Africa
��
UNDP classiyes countries into three major groupings (UNDP 2007c):
� Developing countries - 140 countries or areas� Central and Eastern Europe and the Commonwealth of Independent States - 28 countries or areas� Organisation for Economic Co-operation and Development countries - 30 countries or areas
A. Developing countries
Among developing countries, UNDP has identiyed six regions, which as of early 2007 included thefollowing number of countries or areas:
� Arab States - 20 countries or areas� East Asia and the Paciyc - 31 countries or areas� South Asia - 9 countries or areas� Latin America and the Caribbean - 33 countries or areas� Southern Europe - 2 countries or areas� Sub-Saharan Africa - 45 countries or areas
A list of the countries and their classiycations is provided in Table 13.
appendiX �: countrY classifications
Table 13. Developing country classiUcation (as of early 2007)
CCoouunnttrryy LDC Sub-SaharanAfrica
ArabStates
East Asia andthe PaciUc
SouthAsia
Latin America &Caribbean
SouthernEurope OECD
Afghanistan √ √
Algeria √
Angola √ √
Antigua and Barbuda √
Argentina √
Bahamas √
Bahrain √
Bangladesh √ √
Barbados √
Belize √
Benin √ √
Bhutan √ √
Bolivia √

��
The Energy Access Situation in Developing Countries: A Review Focusing on the Least Developed Countries and Sub-Saharan Africa
CCoouunnttrryy LDC Sub-SaharanAfrica
ArabStates
East Asia andthe PaciUc
SouthAsia
Latin America &Caribbean
SouthernEurope OECD
Botswana √
Brazil √
Brunei Darussalam √
Burkina Faso √ √
Burundi √ √
Cambodia √ √
Cameroon √
Cape Verde √ √
Central African Republic √ √
Chad √ √
Chile √
China √
Colombia √
Comoros √ √
Congo √
Congo (Dem. Rep. ofthe) √ √
Cook Islands √
Costa Rica √
Côte d’Ivoire √
Cuba √
Cyprus √
Djibouti √ √
Dominica √
Dominican Republic √
Ecuador √
Egypt √
El Salvador √
Equatorial Guinea √ √
Eritrea √ √
Ethiopia √ √
Fiji √
Gabon √
Gambia √ √
Ghana √
Grenada √
Guatemala √
Guinea √ √
Guinea-Bissau √ √
Guyana √
Haiti √ √
Honduras √
Hong Kong, China (SAR) √
India √

��
The Energy Access Situation in Developing Countries: A Review Focusing on the Least Developed Countries and Sub-Saharan Africa
CCoouunnttrryy LDC Sub-SaharanAfrica
ArabStates
East Asia andthe PaciUc
SouthAsia
Latin America &Caribbean
SouthernEurope OECD
Indonesia √
Iran (Islamic Republic of ) √
Iraq √
Jamaica √
Jordan √
Kenya √
Kiribati √ √
Korea (Dem People’sRepublic of ) √
Korea (Republic of ) √ √
Kuwait √
Lao People’s Democratic Republic √ √
Lebanon √
Lesotho √ √
Liberia √ √
Libya √
Madagascar √ √
Malawi √ √
Malaysia √
Maldives √ √
Mali √ √
Marshall Islands √
Mauritania √ √
Mauritius √
Mexico √ √
Micronesia (Federated States of ) √
Mongolia √
Morocco √
Mozambique √ √
Myanmar √ √
Namibia √
Nauru √
Nepal √
Nicaragua √
Niue √
Niger √ √
Nigeria √
Occupied Palestinian Territories √
Oman √
Pakistan √
Palau √
Panama √
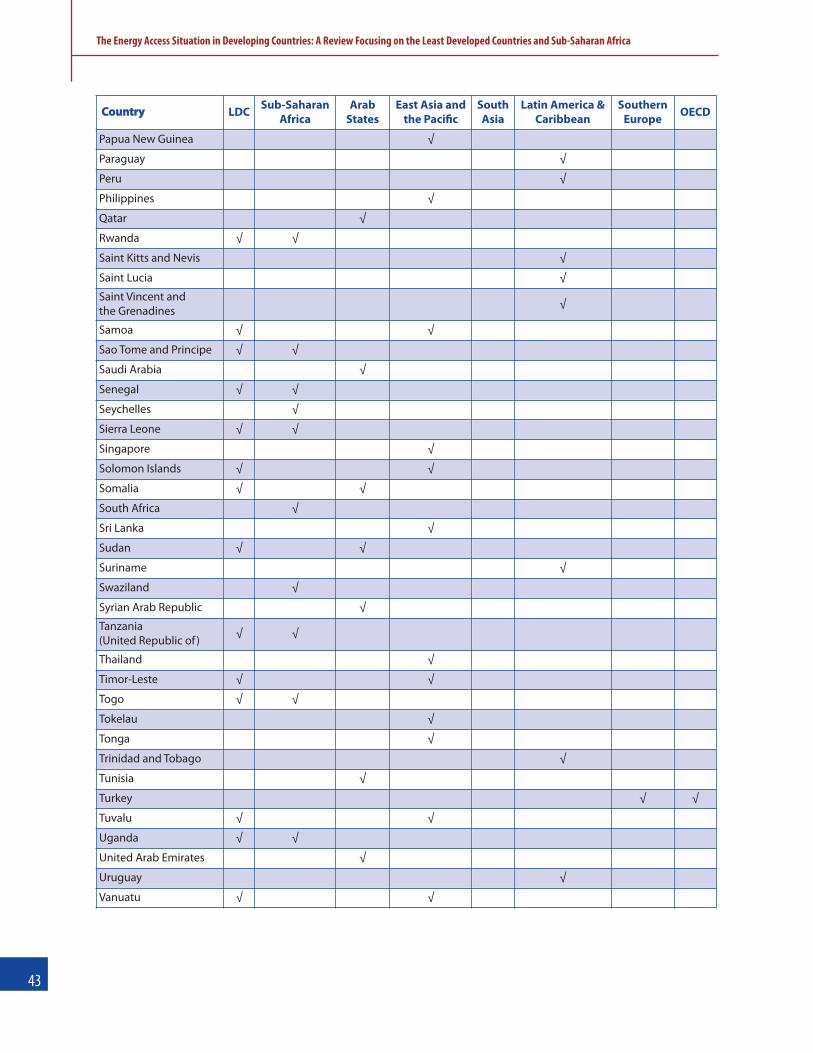
��
The Energy Access Situation in Developing Countries: A Review Focusing on the Least Developed Countries and Sub-Saharan Africa
CCoouunnttrryy LDC Sub-SaharanAfrica
ArabStates
East Asia andthe PaciUc
SouthAsia
Latin America &Caribbean
SouthernEurope OECD
Papua New Guinea √
Paraguay √
Peru √
Philippines √
Qatar √
Rwanda √ √
Saint Kitts and Nevis √
Saint Lucia √
Saint Vincent and the Grenadines √
Samoa √ √
Sao Tome and Principe √ √
Saudi Arabia √
Senegal √ √
Seychelles √
Sierra Leone √ √
Singapore √
Solomon Islands √ √
Somalia √ √
South Africa √
Sri Lanka √
Sudan √ √
Suriname √
Swaziland √
Syrian Arab Republic √
Tanzania (United Republic of ) √ √
Thailand √
Timor-Leste √ √
Togo √ √
Tokelau √
Tonga √
Trinidad and Tobago √
Tunisia √
Turkey √ √
Tuvalu √ √
Uganda √ √
United Arab Emirates √
Uruguay √
Vanuatu √ √

B. Least Developed Countries
In 2007, about 15 percent of the world’s population (some 804 million people) lived in the LeastDeveloped Countries (LDCs), the 50 poorest countries in the world. Countries are designated as LDCs ifthey fulyl the criteria described in Box 4.
��
The Energy Access Situation in Developing Countries: A Review Focusing on the Least Developed Countries and Sub-Saharan Africa
CCoouunnttrryy LDC Sub-SaharanAfrica
ArabStates
East Asia andthe PaciUc
SouthAsia
Latin America &Caribbean
SouthernEurope OECD
Venezuela (Bolivarian Republic) √
Viet Nam √
Yemen √ √
Zambia √ √
Zimbabwe √
Total number of countries 50 45 20 31 9 33 2 3
Box 4. What is a Least Developed Country?
The list of Least Developed Countries (LDCs) is established by the UN’s Economic and Social Council(ECOSOC), which reviews the list every 3 years. In classifying countries as LDCs, the Council usescriteria in three key areas: low income; weakness of human resources; and economic vulnerability.
Indicators used to assess countries relative to these criteria are:
(1) for the low-income criterion, a 3-year average estimate of the gross national income (GNI) percapita (i.e., under $750 for inclusion; above $900 for graduation)
(2) for the human resource weakness criterion, a composite Human Assets Index (HAI), composed ofindicators related to nutrition, health, education, and adult literacy
(3) for the economic vulnerability criterion, a composite Economic Vulnerability Index (EVI),composed of indicators related to: instability of agricultural production; instability of exports ofgoods and services; economic importance of non-traditional activities (e.g., share ofmanufacturing and modern services in GDP); merchandise export concentration; handicap ofeconomic smallness (as measured through the population in logarithm); and percentage ofpopulation displaced by natural disasters
In addition, the population must not exceed 75 million, since ‘the fundamental meaning of the LDCcategory, i.e., the recognition of structural handicaps, excludes large economies’.
To qualify for graduation, a country must meet the thresholds for two of the three criteria in twoconsecutive triennial reviews.
Source: UN (2007).
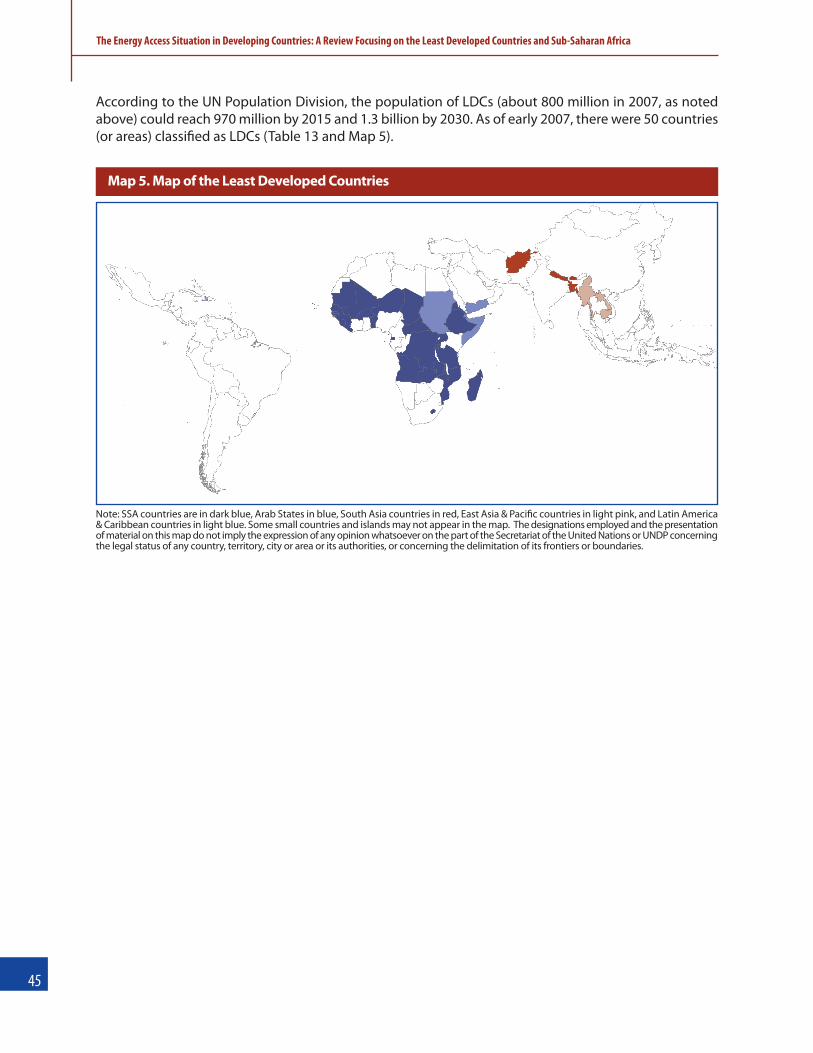
According to the UN Population Division, the population of LDCs (about 800 million in 2007, as notedabove) could reach 970 million by 2015 and 1.3 billion by 2030. As of early 2007, there were 50 countries(or areas) classiyed as LDCs (Table 13 and Map 5).
��
The Energy Access Situation in Developing Countries: A Review Focusing on the Least Developed Countries and Sub-Saharan Africa
Map 5. Map of the Least Developed Countries
Note: SSA countries are in dark blue, Arab States in blue, South Asia countries in red, East Asia & Paciyc countries in light pink, and Latin America& Caribbean countries in light blue. Some small countries and islands may not appear in the map. The designations employed and the presentationof material on this map do not imply the expression of any opinion whatsoever on the part of the Secretariat of the United Nations or UNDP concerningthe legal status of any country, territory, city or area or its authorities, or concerning the delimitation of its frontiers or boundaries.

A. Exposure to smoke and other risks
Numerous studies carried out in homes in developing countries of Asia, Africa, and the Americas haveshown extremely high levels of indoor smoke pollution. Table 14 summarises the range of levels reportedfrom these studies for particulate matter (PM10) and carbon monoxide (CO), compared to WHO air qualityguidelines for these substances (WHO 2000, 2005).
The concentrations of particulate matter are typically at least 10 to 20 times higher than current WHOguidelines, and indeed much higher than the upper intermediate target (IT-1) proposed by WHO as aninitial level for poorer countries to aim for (WHO 2005). Particulate matter damages human health in anumber of ways, rezecting its chemical complexity. These include direct injury and irritation throughdeposition in the lungs, impairment of defences by disruption of immune cell functions, and so-calledoxidative stress in the lungs and throughout the body due to absorption of the very smallest particlesinto the blood stream.
Although the current air quality guidelines are intended primarily for outdoor air quality management,there is no reason, based on the scientiyc evidence, for not applying these to air quality in homes pollutedby smoke from solid fuel use (WHO 2005).
For carbon monoxide, recorded concentrations are generally near or somewhat higher than the guidelinelevels. Studies of blood levels of CO (measured by carboxy-haemoglobin) indicate exposures that areequivalent to light- to medium levels of active smoking or heavy levels of passive tobacco smoking. Oneof the main concerns with CO is exposure among pregnant women. In most societies, women continuetheir cooking duties throughout pregnancy and therefore continue to be exposed (along with theirunborn child).
appendiX �: health impacts of household energY use
The Energy Access Situation in Developing Countries: A Review Focusing on the Least Developed Countries and Sub-Saharan Africa
��

36 WHO Guidelines for Europe (WHO 2000) for CO and AQG Global Update (WHO 2005) for PM10. IT = Intermediate target (see text).��
The Energy Access Situation in Developing Countries: A Review Focusing on the Least Developed Countries and Sub-Saharan Africa
Pollutant
Range of measured pollution levels in homes (usuallykitchens) in developing-country studies of solid fuel use insimple stoves
WHO Air Quality Guidelines36
Period Level Period Level
Small particles(PM10) [µg/m3]
Annual No studies have measured pollution levelsover this long a period however, averagelevels over the course of a year are ex-pected to be similar to measured 24-hourlevels (i.e., most stoves are used daily).
Annual mean Guideline 20
IT-3 30
IT-2 50
IT-1 70
24 hour Wide range of recorded levels, fromaround 300 µg/m3 to 3,000 µg/m3 ormore. Most range from 500 to 1,000µg/m3.
24 hour mean(99th percentile:3 days/year)
Guideline 50
IT-3 75
IT-2 100
IT-1 150
During stove use Mostly range from 300 to 20,000+ µg/m3although levels of 30,000+ µg/m3 havebeen recorded.
Carbon monoxide [partsper million]
24 hour Generally up to 10 ppm, but can exceed 50ppm.
8 hour 10ppm
During stove use Can exceed 100 ppm. 1 hour 30ppm
15 minutes 100ppm
Carboxy-haemoglobin(COHb) %
Level measured in range 1.5 - 13% Recommended that COHb should not exceed 2.5%. Typicalnon-smoker 0.5 - 1.5%. Typicalsmoker 10%.
Table 14. Indoor levels of PM10 and CO from household combustion of solid fuels, comparedwith WHO air quality guidelines
Source: Updated from (Bruce et al. 2006)

��
The Energy Access Situation in Developing Countries: A review focusing on the Least Developed Countries and Sub-Saharan Africa
Table 15. Status of evidence linking household combustion of biomass fuels and coal with childand adult health outcomesa
Note: a. Based on the systematic reviews and standardised assessment of evidence employed for the WHO 2002 Comparative Risk Assessment.Reviews of many of these outcomes are currently underway for the 2005 GBD update, and the status of this evidence will be revised by WHOwhen these reviews are available.
Health outcome Age group Status of evidence
Sufficient evidence for burden-of-disease calculation
Pneumonia < 5 years StrongSome 15–20 observational studies for each condition and onerandomised controlled trial for child pneumonia, fromdeveloping countries. Evidence is consistent (i.e., signiycantlyelevated risk in most, though not all, studies); effects are sizable,plausible, and supported by evidence from outdoor air pollutionand smoking.
Chronic obstructive pulmonarydisease
Adultwomen
Lung cancer (coal exposure) Adultwomen
Chronic obstructive pulmonarydisease
Adult men Moderate-I Smaller number of studies, but consistent and plausible.
Lung cancer (coal exposure) Adult men
Not yet sufficient evidence for burden-of-disease calculation
Lung cancer (biomass exposure) Adultwomen
Moderate-IIAdverse pregnancy outcomes include low birth weight andincreased risk of stillbirth. Small number of studies not allconsistent for all of these outcomes, but supported by studies ofoutdoor air pollution, smoking, and laboratory animals.
Tuberculosis Adult
Adverse pregnancy outcomes Perinatal
Cataracts Adult
Asthma Adult andchild
TentativeOne or a few studies at most for each of these conditions not allconsistent (especially for asthma, which may rezect variations indeynitions and condition by age), but some support fromoutdoor air pollution and passive smoking studies.
Cancer of upper aero-digestive tract Adult
Interstitial lung disease Adult
Ischaemic heart disease Adult Dozens of studies covering other combustion smoke mixtures(ambient air pollution, active smoking, and passive smoking) yndconsistent risks at higher and lower dose levels, but none so far indeveloping countries, other than one showing impact on bloodpressure.
Strong evidence: Many studies of solid fuel use in developing countries, supported by evidence from studies of activeand passive smoking, urban air pollution, and biochemical or laboratory studies.
Moderate evidence: At least three studies of solid fuel use in developing countries, supported by evidence from studieson active smoking and on animals. Moderate I: strong evidence for speciyc age/sex groups. Moderate II: limited evidence.

Disease burden in developing regions, by cause
For the three conditions—child pneumonia, COPD, and lung cancer—patterns of disease burden resultingfrom solid fuel use are strongly inzuenced by variations among regions and countries in underlying diseaserates, as well as (in the case lung cancer) the use of coal as a common household fuel in a few countries.
For child pneumonia, which is most common in LDCs, Figure 27 shows that solid fuel use is responsiblefor much higher rates of deaths and DALYs in LDCs and sub-Saharan Africa than elsewhere. Among theother regions, South Asia has the next highest rates.
For COPD, Figure 28 shows that solid fuel use has the greatest impact on rates of COPD deaths and DALYsin South Asia and East Asia & the Paciyc (EAP), where this disease is more common than in otherdeveloping regions.
The situation for lung cancer is rather different, due to the concentration of coal use as a household fuelin relatively few developing countries, including in one very large country, China. Consequently, thehighest rates by far of deaths and DALYs resulting from solid fuel use occur in EAP (Figure 29).��
The Energy Access Situation in Developing Countries: A Review Focusing on the Least Developed Countries and Sub-Saharan Africa
Pneumonia deaths/1000 population
0.0 0.5 1.0 1.5 2.0 2.5 3.0 3.5 4.0 4.5
LAC
South Asia
EAP
Arab States
SSA
LDCs
DCs
0.2
0.3
0.8
4.2
1.6
4.2
1.8
Figure 27. (a) Attributable deaths from pneumonia < 5 years / 1000 capita, and (b) attributableDALYs from pneumonia < 5 years / 1000 capita
Pneumonia DALYs/population0 20 40 60 80 100 120 140 160
LAC
South Asia
EAP
Arab States
SSA
LDCs
DCs
9
11
26
147
55
148
56
COPD deaths/per 1000 population0.0 0.1 0.2 0.3 0.4 0.5 0.6
LAC
South Asia
EAP
Arab States
SSA
LDCs
DCs
0.1
0.6
0.1
0.3
0.6
0.3
0.5
Figure 28. (a) Attributable deaths from COPD > 30 years / 1000 capita, and (b) attributable DALYsfrom COPD > 30 years / 1000 capita
COPD DALYs/per 1000 population
0.0 1.0 2.0 3.0 4.0 5.0 6.0 7.0 8.0
LAC
South Asia
EAP
Arab States
SSA
LDCs
DCs
1.0
4.7
0.7
2.8
7.1
4.1
4.5
a) b)
a) b)

Disease burden and poverty
Overall, for all three diseases together, poverty—expressed by the HDI—is closely associated with diseaseburden attributable to solid fuel use (Figure 30), and the countries with the highest burdens are mainlythose in sub-Saharan Africa.
For child pneumonia (Figure 31), a similar association is seen, but somewhat stronger and with much higherattributable death rates in the poorest countries, particularly in sub-Saharan Africa. This is a consequence ofseveral factors, including high underlying incidence of child pneumonia, high mortality rate for cases ofpneumonia (case fatality), and the very high reliance on solid fuels for household use in the poorest countries.
��
The Energy Access Situation in Developing Countries: A Review Focusing on the Least Developed Countries and Sub-Saharan Africa
Lung cancer deaths/ 1 million population
0 5 10 15 20 25 30 35 40
LAC
South Asia
EAP
Arab States
SSA
LDCs
DCs
1.2
35.3
0.1
1.0
1.1
0.3
16.7
Figure 29. (a) Attributable deaths and (b) DALYs from lung cancer, in adults > 30 years / 1 million population
Lung cancer DALYs/ 1 million population
0 50 100 150 200 250 300 350
LAC
South Asia
EAP
Arab States
SSA
LDCs
DCs
12
331
1
11
10
3
157a) b)
00.1
0.2
0.3
0.4
0.5
0.6
0.7
0.8
0.9
1.0
0.0 0.50 1.00 1.50 2.00 2.50Total deaths per 1000 capita
HD
I
South AsiaArab StatesSSA
LACEAP
Southern Europe
Figure 30. Human Development Index2007 versus death rates attributable tosolid fuel use (all causes)
00.1
0.2
0.3
0.4
0.5
0.6
0.7
0.8
0.9
1.0
Pneumonia deaths per 1000 capita
HD
I
0.00 2.00 4.00 6.00 8.00 10.00 12.00
South AsiaArab StatesSSA
LACEAP
Southern Europe
Figure 31. Human Development Index 2007versus death rates attributable to pneumoniafrom solid fuel use
Source: UNDP (2009) for data on HDI 2007 Source: UNDP (2009) for data on HDI 2007

37 From WHO 2009, Country proyles of environmental burden of disease, accessible at www.who.int/quantifying_ehimpacts/countryproyles .
The relationship between attributableburden of COPD and poverty (Figure 32) ismore complex, due to the fact that thepoorest countries (LDCs, sub-Saharan Africa)do not have the highest underlying rates ofCOPD, particularly for women. This contrastswith the situation for child pneumonia.Consequently, the countries with the highestCOPD death rates attributable to solid fueluse have mid-range HDI values, and are inEAP and South Asia.
Disease burden in developing countries, by cause
For the three conditions, child pneumonia, COPD and lung cancer, patterns of health burden resultingfrom solid fuel use are strongly inzuenced by variations between regions and countries in disease ratesand additionally - for lung cancer – the countries where coal is used commonly as a household fuel.
��
The Energy Access Situation in Developing Countries: A Review Focusing on the Least Developed Countries and Sub-Saharan Africa
0
0.1
0.2
0.3
0.4
0.5
0.6
0.7
0.8
0.9
1.0
COPD deaths per 1000 capitaH
DI
0 0.20 0.40 0.60 0.80
South AsiaArab StatesSSA
LACEAP
Southern Europe
Figure 32. Human Development Index 2007 versusattributable COPD deaths from solid fuel use
Table 16. Numbers of deaths for pneumonia, COPD and lung cancer attributable to solid fueluse, by country, 200437a
Country
Pneumonia Chronic Obstructive Pulmonary disease
Lung cancerc
All deaths
Children <5 years Adults >30 years Adults >30 years
Afghanistan 52,400 1,600 — 54,000
Algeria 200 200 — 400
Angola 32,100 1,400 — 33,500
Antigua and Barbuda — — — —
Argentina — — — —
Bahamas — — — —
Bahrain — — — —
Bangladesh 25,000 24,400 — 49,400
Source: UNDP (2009) for data on HDI 2007
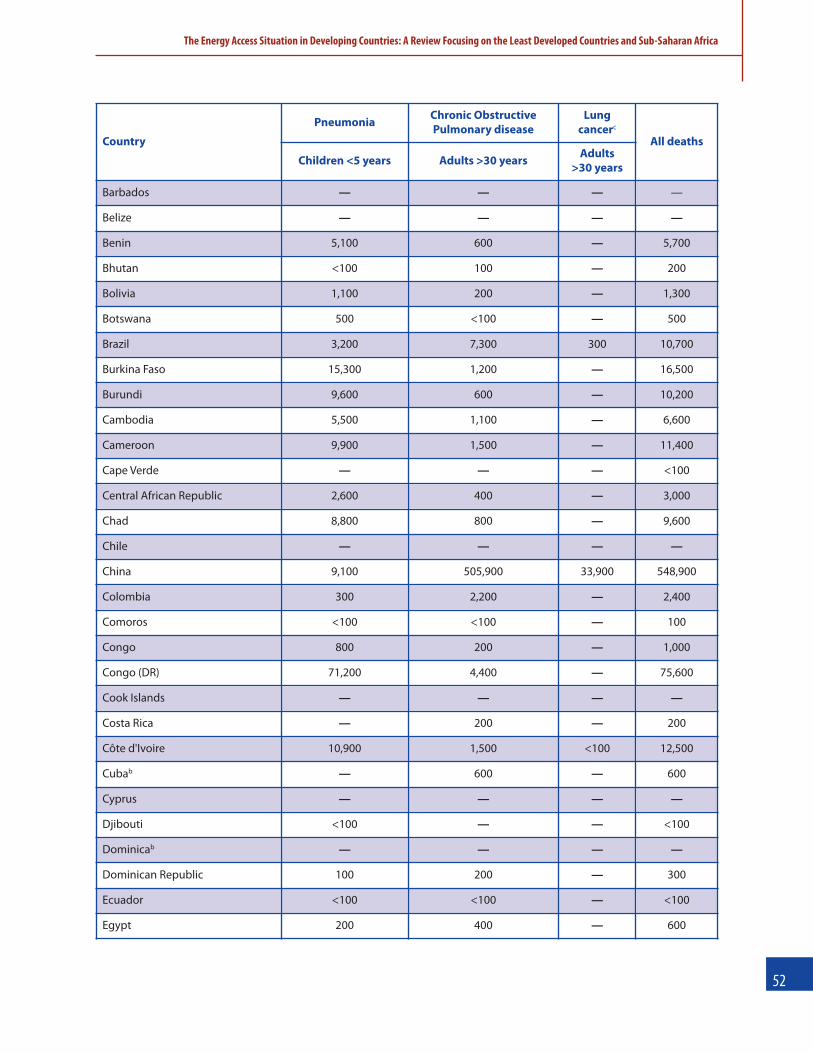
��
The Energy Access Situation in Developing Countries: A Review Focusing on the Least Developed Countries and Sub-Saharan Africa
Country
Pneumonia Chronic Obstructive Pulmonary disease
Lung cancerc
All deaths
Children <5 years Adults >30 years Adults >30 years
Barbados — — — —
Belize — — — —
Benin 5,100 600 — 5,700
Bhutan <100 100 — 200
Bolivia 1,100 200 — 1,300
Botswana 500 <100 — 500
Brazil 3,200 7,300 300 10,700
Burkina Faso 15,300 1,200 — 16,500
Burundi 9,600 600 — 10,200
Cambodia 5,500 1,100 — 6,600
Cameroon 9,900 1,500 — 11,400
Cape Verde — — — <100
Central African Republic 2,600 400 — 3,000
Chad 8,800 800 — 9,600
Chile — — — —
China 9,100 505,900 33,900 548,900
Colombia 300 2,200 — 2,400
Comoros <100 <100 — 100
Congo 800 200 — 1,000
Congo (DR) 71,200 4,400 — 75,600
Cook Islands — — — —
Costa Rica — 200 — 200
Côte d'Ivoire 10,900 1,500 <100 12,500
Cubab — 600 — 600
Cyprus — — — —
Djibouti <100 — — <100
Dominicab — — — —
Dominican Republic 100 200 — 300
Ecuador <100 <100 — <100
Egypt 200 400 — 600
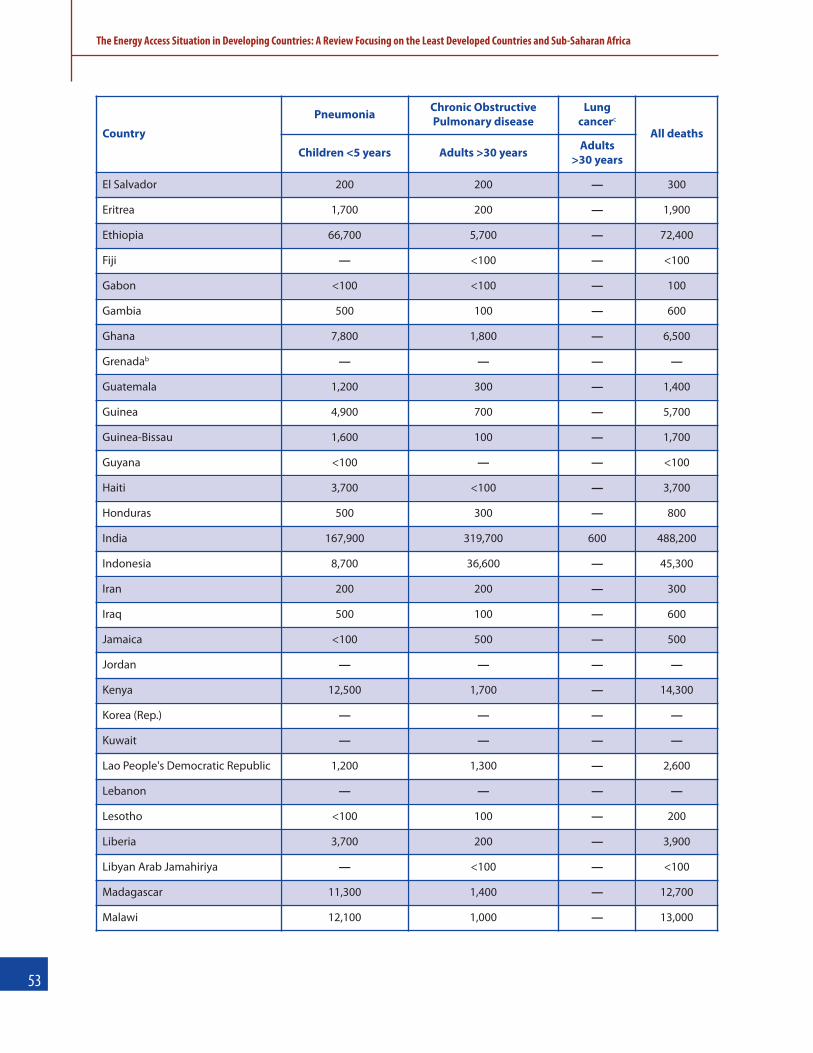
��
The Energy Access Situation in Developing Countries: A Review Focusing on the Least Developed Countries and Sub-Saharan Africa
Country
Pneumonia Chronic Obstructive Pulmonary disease
Lung cancerc
All deaths
Children <5 years Adults >30 years Adults >30 years
El Salvador 200 200 — 300
Eritrea 1,700 200 — 1,900
Ethiopia 66,700 5,700 — 72,400
Fiji — <100 — <100
Gabon <100 <100 — 100
Gambia 500 100 — 600
Ghana 7,800 1,800 — 6,500
Grenadab — — — —
Guatemala 1,200 300 — 1,400
Guinea 4,900 700 — 5,700
Guinea-Bissau 1,600 100 — 1,700
Guyana <100 — — <100
Haiti 3,700 <100 — 3,700
Honduras 500 300 — 800
India 167,900 319,700 600 488,200
Indonesia 8,700 36,600 — 45,300
Iran 200 200 — 300
Iraq 500 100 — 600
Jamaica <100 500 — 500
Jordan — — — —
Kenya 12,500 1,700 — 14,300
Korea (Rep.) — — — —
Kuwait — — — —
Lao People's Democratic Republic 1,200 1,300 — 2,600
Lebanon — — — —
Lesotho <100 100 — 200
Liberia 3,700 200 — 3,900
Libyan Arab Jamahiriya — <100 — <100
Madagascar 11,300 1,400 — 12,700
Malawi 12,100 1,000 — 13,000

��
The Energy Access Situation in Developing Countries: A Review Focusing on the Least Developed Countries and Sub-Saharan Africa
Country
Pneumonia Chronic Obstructive Pulmonary disease
Lung cancerc
All deaths
Children <5 years Adults >30 years Adults >30 years
Malaysia — <100 — <100
Maldives — — — <100
Mali 14,100 1,200 — 15,300
Marshall Islands — — — —
Mauritania 1,000 200 — 1,200
Mauritius — — — —
Mexico 900 3,400 — 4,300
Micronesia — — — —
Mongolia 200 100 — 300
Morocco 200 300 — 500
Mozambique 9,700 1,400 — 11,100
Myanmar 8,300 9,800 — 18,100
Namibia <100 <100 — 100
Nauru — — — —
Nepal 5,100 3,600 — 8,700
Nicaragua 300 400 — 700
Niger 26,100 1,400 — 27,500
Nigeria 85,600 9,600 — 95,300
Niue — — — —
Oman — — — —
Pakistan 29,800 26,300 <100 56,100
Palau — — — —
Panamab <100 100 — 200
Papua New Guinea 1,000 600 — 1,600
Paraguay 200 100 — 300
Peru 600 400 — 1,000
Philippines 3,800 3,300 <100 7,200
Qatar — — — —
Rwanda 11,900 600 — 12,500
Saint Kitts and Nevis — — — —

��
The Energy Access Situation in Developing Countries: A Review Focusing on the Least Developed Countries and Sub-Saharan Africa
Country
Pneumonia Chronic Obstructive Pulmonary disease
Lung cancerc
All deaths
Children <5 years Adults >30 years Adults >30 years
Saint Lucia — — — —
Saint Vincent and the Grenadinesb — — — —
Samoa — <100 — <100
Sao Tome and Principeb <100 — — <100
Saudi Arabia — — — —
Senegal 5,400 900 — 6,300
Seychelles — — — —
Sierra Leone 10,200 600 — 10,800
Singapore — — — —
Solomon Islands <100 <100 — <100
Somaliab 10,600 700 — 11,300
South Africa 1,200 1,900 <100 3,200
Sri Lanka 100 4,200 — 4,300
Sudan 10,300 3,600 — 13,900
Swaziland 200 <100 — 300
Syrian Arab Republic 300 400 — 700
Tanzania 15,900 3,000 — 18,900
Thailand 1,000 9,500 — 10,500
Togo 2,700 400 — 3,200
Tonga — — — —
Trinidad and Tobago — — — —
Tunisia <100 <100 — 100
Turkeyb 700 2,700 — 3,400
Tuvalu — — — —
Uganda 17,900 1,800 <100 19,700
United Arab Emirates — — — —
Uruguay — — — —
Vanuatu — <100 — <100
Venezuelab <100 200 — 200
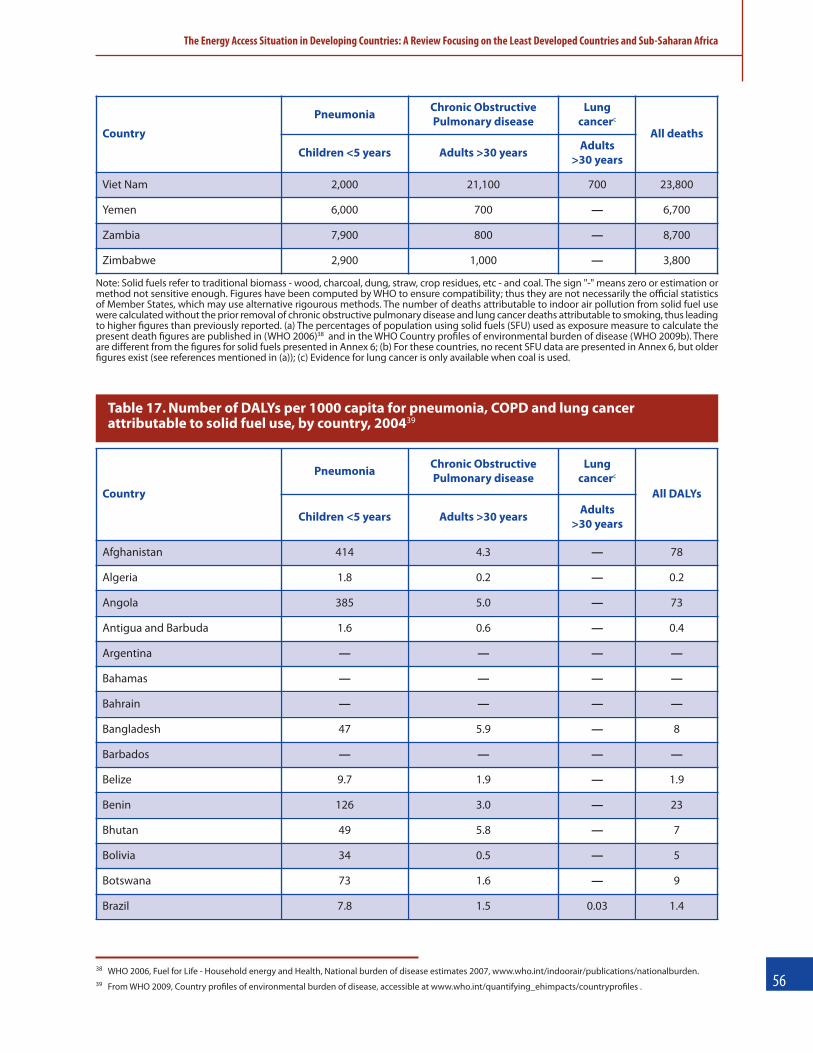
��38 WHO 2006, Fuel for Life - Household energy and Health, National burden of disease estimates 2007, www.who.int/indoorair/publications/nationalburden. 39 From WHO 2009, Country proyles of environmental burden of disease, accessible at www.who.int/quantifying_ehimpacts/countryproyles .
The Energy Access Situation in Developing Countries: A Review Focusing on the Least Developed Countries and Sub-Saharan Africa
Country
Pneumonia Chronic Obstructive Pulmonary disease
Lung cancerc
All deaths
Children <5 years Adults >30 years Adults >30 years
Viet Nam 2,000 21,100 700 23,800
Yemen 6,000 700 — 6,700
Zambia 7,900 800 — 8,700
Zimbabwe 2,900 1,000 — 3,800
Note: Solid fuels refer to traditional biomass - wood, charcoal, dung, straw, crop residues, etc - and coal. The sign "-" means zero or estimation ormethod not sensitive enough. Figures have been computed by WHO to ensure compatibility; thus they are not necessarily the official statisticsof Member States, which may use alternative rigourous methods. The number of deaths attributable to indoor air pollution from solid fuel usewere calculated without the prior removal of chronic obstructive pulmonary disease and lung cancer deaths attributable to smoking, thus leadingto higher ygures than previously reported. (a) The percentages of population using solid fuels (SFU) used as exposure measure to calculate thepresent death ygures are published in (WHO 2006)38 and in the WHO Country proyles of environmental burden of disease (WHO 2009b). Thereare different from the ygures for solid fuels presented in Annex 6; (b) For these countries, no recent SFU data are presented in Annex 6, but olderygures exist (see references mentioned in (a)); (c) Evidence for lung cancer is only available when coal is used.
Table 17. Number of DALYs per 1000 capita for pneumonia, COPD and lung cancerattributable to solid fuel use, by country, 200439
Country
Pneumonia Chronic Obstructive Pulmonary disease
Lung cancerc
All DALYs
Children <5 years Adults >30 years Adults >30 years
Afghanistan 414 4.3 — 78
Algeria 1.8 0.2 — 0.2
Angola 385 5.0 — 73
Antigua and Barbuda 1.6 0.6 — 0.4
Argentina — — — —
Bahamas — — — —
Bahrain — — — —
Bangladesh 47 5.9 — 8
Barbados — — — —
Belize 9.7 1.9 — 1.9
Benin 126 3.0 — 23
Bhutan 49 5.8 — 7
Bolivia 34 0.5 — 5
Botswana 73 1.6 — 9
Brazil 7.8 1.5 0.03 1.4
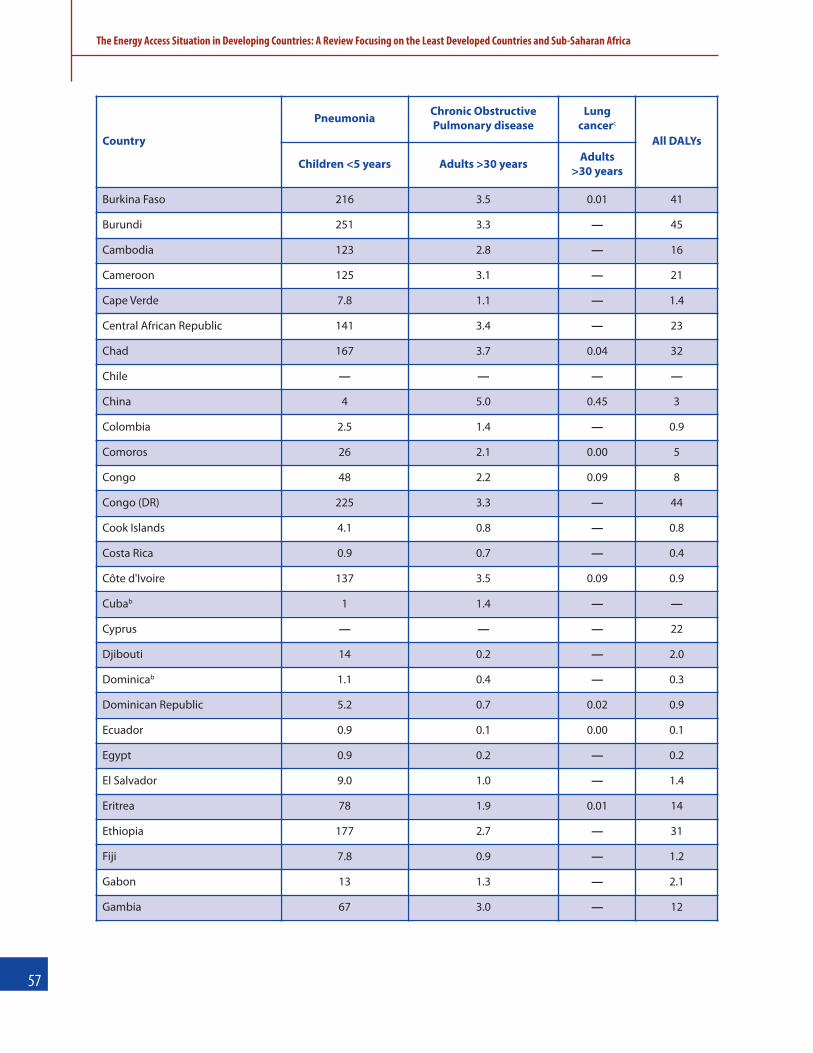
��
The Energy Access Situation in Developing Countries: A Review Focusing on the Least Developed Countries and Sub-Saharan Africa
Country
Pneumonia Chronic Obstructive Pulmonary disease
Lung cancerc
All DALYs
Children <5 years Adults >30 years Adults >30 years
Burkina Faso 216 3.5 0.01 41
Burundi 251 3.3 — 45
Cambodia 123 2.8 — 16
Cameroon 125 3.1 — 21
Cape Verde 7.8 1.1 — 1.4
Central African Republic 141 3.4 — 23
Chad 167 3.7 0.04 32
Chile — — — —
China 4 5.0 0.45 3
Colombia 2.5 1.4 — 0.9
Comoros 26 2.1 0.00 5
Congo 48 2.2 0.09 8
Congo (DR) 225 3.3 — 44
Cook Islands 4.1 0.8 — 0.8
Costa Rica 0.9 0.7 — 0.4
Côte d'Ivoire 137 3.5 0.09 0.9
Cubab 1 1.4 — —
Cyprus — — — 22
Djibouti 14 0.2 — 2.0
Dominicab 1.1 0.4 — 0.3
Dominican Republic 5.2 0.7 0.02 0.9
Ecuador 0.9 0.1 0.00 0.1
Egypt 0.9 0.2 — 0.2
El Salvador 9.0 1.0 — 1.4
Eritrea 78 1.9 0.01 14
Ethiopia 177 2.7 — 31
Fiji 7.8 0.9 — 1.2
Gabon 13 1.3 — 2.1
Gambia 67 3.0 — 12

��
The Energy Access Situation in Developing Countries: A Review Focusing on the Least Developed Countries and Sub-Saharan Africa
Country
Pneumonia Chronic Obstructive Pulmonary disease
Lung cancerc
All DALYs
Children <5 years Adults >30 years Adults >30 years
Ghana 54 2.4 0.00 8
Grenadab 6.2 2.4 — 1.5
Guatemala 21 0.9 0.00 4
Guinea 114 3.4 — 20
Guinea-Bissau 183 3.6 — 37
Guyana 17 1.2 — 2.4
Haiti 111 0.6 — 15
Honduras 22 2.4 — 4
India 47 7.9 0.01 8
Indonesia 16 5.9 — 4
Iran 1.1 0.1 — 0.1
Iraq 4.5 0.2 — 0.8
Jamaica 6.5 3.8 — 2.3
Jordan — — — —
Kenya 76 1.7 — 13
Korea (Rep.) — — — —
Kuwait — — — —
Lao People's Democratic Republic 62 9.2 0.00 11
Lebanon — — — —
Lesotho 6.8 2.1 — 1.5
Liberia 200 3.4 — 39
Libyan Arab Jamahiriya 0.7 0.2 — 0.2
Madagascar 130 2.9 — 23
Malawi 178 2.7 0.00 33
Malaysia 0.1 0.1 — 0.0
Maldives 13 0.9 — 1.6
Mali 232 3.9 0.00 45
Marshall Islands 20 2.7 — 3
Mauritania 78 2.1 0.06 13

��
The Energy Access Situation in Developing Countries: A Review Focusing on the Least Developed Countries and Sub-Saharan Africa
Country
Pneumonia Chronic Obstructive Pulmonary disease
Lung cancerc
All DALYs
Children <5 years Adults >30 years Adults >30 years
Mauritius 0.1 0.0 — 0.0
Mexico 3.7 0.8 0.00 0.7
Micronesia 13 2.8 — 2.7
Mongolia 27 1.9 — 3
Morocco 2.8 0.3 0.00 0.4
Mozambique 95 2.5 — 17
Myanmar 74 6.0 — 9
Namibia 4.0 1.3 0.00 0.9
Nauru 0.3 0.0 — 0.0
Nepal 50 5.2 — 8
Nicaragua 18 1.6 — 3
Niger 355 4.2 — 72
Nigeria 128 3.0 — 23
Niue 8.4 1.2 — 1.5
Oman — — — —
Pakistan 56 6.0 0.00 9
Palau — — — —
Panamab 7.4 1.0 — 1.2
Papua New Guinea 48 4.3 — 9
Paraguay 9.3 0.8 0.00 1.4
Peru 7.9 0.3 — 1.0
Philippines 14.0 1.9 0.03 2.5
Qatar — — — —
Rwanda 274 3.1 0.00 46
Saint Kitts and Nevis — — — —
Saint Lucia 2.1 2.4 — 1.2
Saint Vincent and the Grenadinesb 1.5 0.7 — 0.4
Samoa 12 3.8 — 3
Sao Tome and Principeb 77 3.1 — 13
Saudi Arabia — — — —
Senegal 104 2.4 0.01 17

��
The Energy Access Situation in Developing Countries: A Review Focusing on the Least Developed Countries and Sub-Saharan Africa
Country
Pneumonia Chronic Obstructive Pulmonary disease
Lung cancerc
All DALYs
Children <5 years Adults >30 years Adults >30 years
Seychelles — — — —
Sierra Leone 380 4.5 — 67
Singapore — — — —
Solomon Islands 23 3.4 — 5
Somaliab 256 3.9 — 48
South Africa 7.9 1.2 0.05 1.3
Sri Lanka 4 6.0 — 3
Sudan 66 3.1 — 11
Swaziland 55 2.0 0.01 8
Syrian Arab Republic 4.8 1.4 — 1.1
Tanzania 84 3.1 — 16
Thailand 8.7 2.3 — 1.9
Togo 95 2.9 — 17
Tonga 8.6 3.6 — 2.2
Trinidad and Tobago 0.4 0.2 — 0.1
Tunisia 1.2 0.3 0.02 0.2
Turkeyb 3.6 0.9 — 0.7
Tuvalu 11 3.0 — 2.5
Uganda 114 2.7 0.07 23
United Arab Emirates — 0.0 — —
Uruguay 0.1 0.1 — 0.0
Vanuatu 4.4 3.5 — 1.8
Venezuelab 0.7 0.3 — 0.2
Viet Nam 10 4.6 0.17 3
Yemen 61 2.3 — 11
Zambia 142 2.8 0.00 26
Zimbabwe 59 2.7 — 8
Note: Solid fuels refer to traditional biomass - wood, charcoal, dung, straw, crop residues, etc - and coal. The sign "-" means zero or estimation or methodnot sensitive enough. Figures have been computed by WHO to ensure compatibility; thus they are not necessarily the official statistics of MemberStates, which may use alternative rigourous methods. The number of DALYs attributable to indoor air pollution from solid fuel use were calculatedwithout the prior removal of chronic obstructive pulmonary disease and lung cancer DALYs attributable to smoking, thus leading to higher ygures thanpreviously reported. (a) The percentages of population using solid fuels (SFU) used as exposure measure to calculate the present DALYs ygures arepublished in (WHO 2006)40 and in the WHO Country proyles of environmental burden of disease (WHO 2009b). There are different from the yguresfor solid fuels presented in Annex 6; (b) For these countries, no recent SFU data are presented in Annex 6, but older ygures exist (see referencesmentioned in (a)); (c) Evidence for lung cancer is only available when coal is used; d) The rates are calculated for the total population (all ages).
40 WHO 2006, Fuel for Life - Household energy and Health, National burden of disease estimates 2007, www.who.int/indoorair/publications/nationalburden.

��
A. Global targets
Various organisations and institutions have made suggestions for global MDG-related energy accesstargets, which are listed below and were obtained from GNESD (2007). They are:
UN Millennium Project
� Enable the use of modern fuels for 50 percent of those who at pres¬ent use traditional biomass forcooking. In addition, support (a) efforts to develop and adopt the use of improved cooking stoves,(b) measures to reduce the adverse health impacts from cooking with biomass, and (c) measures toincrease sustainable biomass production.
� Ensure reliable access to electricity to all in urban and peri-urban areas. � Provide access to modern energy services (in the form of mechanical power and electricity) at the
community level for all rural communities.
International Energy Agency
� Reduce the number of people without access to electricity to no more than 1 billion by 2015.� Reduce the number of people reliant on traditional biomass to 1.85 billion by 2015.
GTZ
� Double consumption of modern energy services, especially for productive uses.� Provide access to modern cooking energy services for 50 percent of the African people living in rural
areas and using traditional biomass for cooking.� Enable access to reliable and affordable modern energy services for basic energy needs for 75 percent
of the urban and peri-urban poor.� Provide access to 75 percent environment-friendly electricity for schools, health facilities, and
community centres. � Promote motive power for productive uses within all major rural communities.
McKinsey and Company
� Reduce by half, between 2005 and 2015, the proportion of urban and rural households withoutaccess to adequate lighting.
� Reduce by half, between 2005 and 2015, the proportion of urban and rural households reliant oncooking methods that are not MDG-compatible.
� Provide adequate, clean, and efficient energy services by 2015 to all educational and health facilities.
Stockholm Environment Institute
� The Stockholm Environment Institute elaborated on the McKinsey and Company targets and deynedthe following targets to be achieved by 2015:
appendiX �: global and regional mdg-relatedenergY targets
The Energy Access Situation in Developing Countries: A Review Focusing on the Least Developed Countries and Sub-Saharan Africa

� Enable use of modern fuels for 50 percent of those who at present use traditional biomass for cooking.� Enable access to reliable modern energy services for all urban and peri-urban poor.� Provide electricity for all schools, clinics, hospitals, and community centres.� Enable access to mechanised power for all communities.
B. Regional targets for sub-Saharan Africa
Regional organisations for sub-Saharan Africa have also proposed targets for countries in their regionsto adopt. These are:
Forum of Energy Ministers of Africa (FEMA) Position Paper (2005)
� 50 percent of Africans living in rural areas and using traditional biomass for cooking should haveaccess to modern energy services such as improved cook stoves which reduce indoor air pollutionas well as efficient kerosene and gas stoves.
� 50 percent of urban and peri-urban poor should have access to reliable and affordable modernenergy services for their basic energy needs such as cooking and lighting; and productive uses suchas agro processing and general value addition.
� 50 percent of schools, clinics, and community centres should have access to modern electricityservices for provision of lighting, refrigeration, information and communication technology.
Economic Community of West African States (ECOWAS) White Paper (2006)
� 100 percent of the total populations or 325 million people will have access to a modern cooking fuel.� At least 60 percent of people living in rural areas will have access to productive energy services in
villages, in particular motive power to boost the productivity of economic activities.� 66 percent of the population, or 214 million people, will have access to an individual electricity supply,
or 100 percent of urban and peri-urban areas, 36 percent of rural populations, and moreover, 60percent of the rural population will live in localities with:
– modernised basic social services: health care, drinking water, communication, etc.
– access to lighting, audiovisual and telecommunication service, etc. and
– the coverage of isolated populations with decentralised approaches.
East African Community (EAC) Energy Access Strategy (2007)
� 55 percent of the total population in the region will have access to LPG or improved stoves and tosustained biomass supply. This is the equivalent of an additional 50 percent of the population thatcurrently does not have access to modern cooking practices.
� 100 percent of urban and peri-urban households will be provided with an electricity service.� 100 percent of the rural population will live in a locality where social service centres are equipped
with modern energy services.� 100 percent of administrative headquarters and localities with more than 3,500 inhabitants will be
equipped with mechanical power and heating technology.
��
The Energy Access Situation in Developing Countries: A Review Focusing on the Least Developed Countries and Sub-Saharan Africa
Southern African Development Community (SADC) Regional Indicative Strategic DevelopmentPlan (undated)
� 70 percent of rural communities have access to electricity (by 2018), or � 70 percent of rural communities have access to modern forms of energy supplies (by 2018).
Economic and Monetary Community of Central Africa (CEMAC) Energy Plan Action (2006)
� 50 percent of the population have electricity access, with at least 35 percent of the rural populationhaving access.
� 80 percent of the peri-urban and rural population have improved access to modern fuels for cookingand heating.
��
The Energy Access Situation in Developing Countries: A Review Focusing on the Least Developed Countries and Sub-Saharan Africa

In the 2004 and 2006 editions of its World Energy Outlook, the International Energy Agency (IEA) estimatedenergy access in 2015. Those projections differ somewhat from the estimates developed for this report.As noted earlier, this report focuses on the Least Developed Countries (LDCs) and sub-Saharan Africa, amain distinction. The following presents an overview of the IEA’s estimates, noting other key similaritiesand differences with the estimates developed for this report.
The IEA estimates the number of people in developing countries relying on traditional biomass and thenumber with access to electricity in 2015 and 2030. These projections take into account fuel substitutionand market penetration of more efficient technologies that would occur as a result of rising per capitaincomes, as well as fuel availability and other factors, a key difference from the scenarios developed forthis report. In addition, the IEA’s estimates are based on the agency’s own deynition of developingcountries (i.e., all countries that are not OECD countries or transition economies), which differs from theUNDP system of country and regional classiycation used for this report.41 The IEA’s estimates also makeuse of different baseline years.
Electricity. In the IEA’s Reference Scenario, which estimates energy access under continuation of presentpolicies through 2015, the number of people without access to electricity in 2015 is projected to be justunder 1.6 billion. This is roughly the same as the number of people currently lacking access to electricity;however, given increased population, this translates roughly into an additional 600 million people withelectricity access.
To achieve the Millennium Development Goal of halving the number of people living on less than $1 aday, the IEA estimates that the number of people without electricity access needs to be reduced to 1billion or less. Given population growth, this translates into about 1.2 billion people who gain access toelectricity by 2015, according to our calculations. This result is similar to the estimate of 1.2 billionadditional people that will require electricity access by 2015 under the MDG-Compatible Scenariodeveloped for this report.
Traditional biomass and modern fuels. In the IEA’s Reference Scenario, the number of people in developingcountries who rely on traditional biomass for cooking rises from 2.5 billion in 2004 to 2.6 billion in 2015.Given population increases, this translates roughly to 500 million people who no longer rely on traditionalbiomass in 2015.
According to the IEA’s analysis, meeting the 2015 target of reducing by half the number of people relyingon traditional biomass would mean that 1.3 billion people in developing countries switch from traditionalbiomass to LPG for cooking and heating (IEA 2006). In this report, we estimate that 1.9 billion additionalpeople will require access to modern fuels (excluding traditional biomass and coal) in 2015 if the numberof those without access is to be halved.
appendiX �: comparison of scenarios of energY access in ����
The Energy Access Situation in Developing Countries: A Review Focusing on the Least Developed Countries and Sub-Saharan Africa
��
41 See Appendix 2 for a complete listing of the UNDP country and regional classiycations used in this report.

There are several reasons for the large difference (i.e., 600 million) in the two estimates. First, the IEA’sestimate uses LPG used as a proxy for all modern fuels. In this report, we deyne modern fuels to includeelectricity and all liquid and gaseous fuels used for cooking. Moreover, our analysis includes a largenumber of people currently using coal (a solid fuel) for cooking who make the switch to modern, non-solid fuels, while the IEA focuses on those relying on traditional biomass. This accounts for most of thedivergence in estimates.
The differing country classiycations also account for some of the divergence in the estimates. TheUN/UNDP classiycation system used for this report includes some relatively large countries, such asMexico and Turkey, which are excluded (along with other OECD countries) from the IEA’s analysis.Considering the methodological differences, the two estimates are broadly consistent.
��
The Energy Access Situation in Developing Countries: A Review Focusing on the Least Developed Countries and Sub-Saharan Africa

appendiX �: tables on energY access in developing countries
The Energy Access Situation in Developing Countries: A Review Focusing on the Least Developed Countries and Sub-Saharan Africa
��
Table 18. Electricity access, by country
Country% of population with electricity access
Source(s)National Year Rural Year Urban Year
Afghanistan 14.4 2008 12 2008 22 2008 IEA, 20092
Algeria 99.3 2008 98 2008 100 2008 IEA, 20092
Angola 26.2 2008 10.7 2008 38 2008 IEA, 20092
Antigua and Barbuda >95 2006 >95 2006 >95 2006 Antigua & Barbuda StatisticsDivision of the Ministry of Financeand The Economy, 2004, Estimates
Argentina 97.2 2008 70 2008 99.6 2008 IEA, 20092
Bahamas 94 2001 Mycoo M. (not dated)
Bahrain 99.4 2008 95 2008 100 2008 IEA, 20092
Bangladesh 41 2008 28 2008 76 2008 IEA, 20092
Barbados 100 2004 100 2004 100 2004 Castalia, 2004
Belize 91.7 2007 68 2000 95.4 2000 Statistical Institute of Belize, 2007;Central Statistical Office (not dated)
Benin 24.8 2008 8.5 2008 48 2008 IEA, 20092
Bhutan 68.5 2007 56.1 2007 97.4 2007 National Statistics Bureau, RoyalGovernment of Bhutan, 2007
Bolivia 77.5 2008 38 2008 98.2 2008 IEA, 20092
Botswana 45.4 2008 12 2008 68 2008 IEA, 20092
Brazil 97.8 2008 88 2008 99.5 2008 IEA, 20092
Brunei 99.7 2008 98.6 2008 100 2008 IEA, 20092
Burkina Faso 10 2008 6.3 2008 25 2008 IEA, 20092
Burundi 2.8 2006 0.1 2006 25.6 2006 African Development Bank Group,2007
Cambodia 24 2008 12.5 2008 66 2008 IEA, 20092
Cameroon 29.4 2008 9 2008 45 2008 IEA, 20092
Cape Verde 70.4 2006 44.9 2006 87.5 2006 Republic of Cape Verde, Ministry ofFinance and Public Administration,2008
Central African Rep. 5.1 2003 0.3 2003 14.7 2003 République Centrafricaine, DirectionGénérale de la Statistique, des ÉtudesÉconomiques et Sociales, 2005
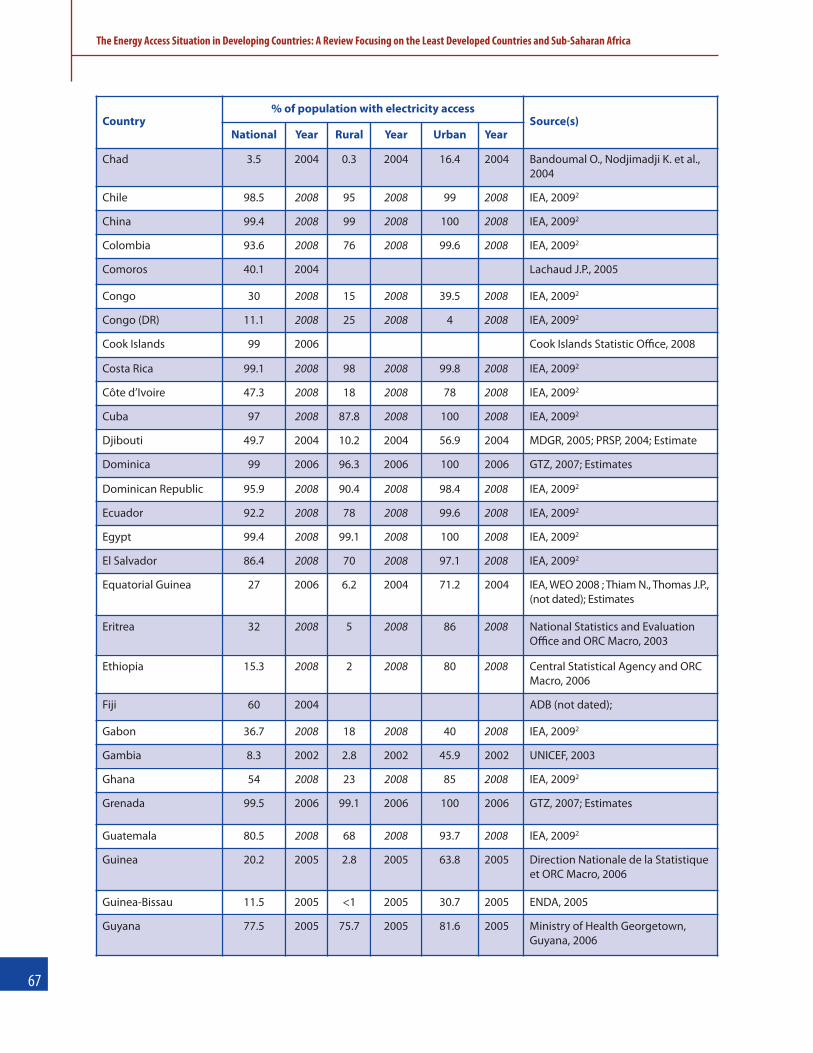
��
The Energy Access Situation in Developing Countries: A Review Focusing on the Least Developed Countries and Sub-Saharan Africa
Country% of population with electricity access
Source(s)National Year Rural Year Urban Year
Chad 3.5 2004 0.3 2004 16.4 2004 Bandoumal O., Nodjimadji K. et al.,2004
Chile 98.5 2008 95 2008 99 2008 IEA, 20092
China 99.4 2008 99 2008 100 2008 IEA, 20092
Colombia 93.6 2008 76 2008 99.6 2008 IEA, 20092
Comoros 40.1 2004 Lachaud J.P., 2005
Congo 30 2008 15 2008 39.5 2008 IEA, 20092
Congo (DR) 11.1 2008 25 2008 4 2008 IEA, 20092
Cook Islands 99 2006 Cook Islands Statistic Office, 2008
Costa Rica 99.1 2008 98 2008 99.8 2008 IEA, 20092
Côte d’Ivoire 47.3 2008 18 2008 78 2008 IEA, 20092
Cuba 97 2008 87.8 2008 100 2008 IEA, 20092
Djibouti 49.7 2004 10.2 2004 56.9 2004 MDGR, 2005; PRSP, 2004; Estimate
Dominica 99 2006 96.3 2006 100 2006 GTZ, 2007; Estimates
Dominican Republic 95.9 2008 90.4 2008 98.4 2008 IEA, 20092
Ecuador 92.2 2008 78 2008 99.6 2008 IEA, 20092
Egypt 99.4 2008 99.1 2008 100 2008 IEA, 20092
El Salvador 86.4 2008 70 2008 97.1 2008 IEA, 20092
Equatorial Guinea 27 2006 6.2 2004 71.2 2004 IEA, WEO 2008 ; Thiam N., Thomas J.P.,(not dated); Estimates
Eritrea 32 2008 5 2008 86 2008 National Statistics and EvaluationOffice and ORC Macro, 2003
Ethiopia 15.3 2008 2 2008 80 2008 Central Statistical Agency and ORCMacro, 2006
Fiji 60 2004 ADB (not dated);
Gabon 36.7 2008 18 2008 40 2008 IEA, 20092
Gambia 8.3 2002 2.8 2002 45.9 2002 UNICEF, 2003
Ghana 54 2008 23 2008 85 2008 IEA, 20092
Grenada 99.5 2006 99.1 2006 100 2006 GTZ, 2007; Estimates
Guatemala 80.5 2008 68 2008 93.7 2008 IEA, 20092
Guinea 20.2 2005 2.8 2005 63.8 2005 Direction Nationale de la Statistiqueet ORC Macro, 2006
Guinea-Bissau 11.5 2005 <1 2005 30.7 2005 ENDA, 2005
Guyana 77.5 2005 75.7 2005 81.6 2005 Ministry of Health Georgetown,Guyana, 2006

��
The Energy Access Situation in Developing Countries: A Review Focusing on the Least Developed Countries and Sub-Saharan Africa
Country% of population with electricity access
Source(s)National Year Rural Year Urban Year
Haiti 38.5 2008 11.7 2008 68.9 2008 IEA, 20092
Honduras 70.3 2008 45 2008 97.9 2008 IEA, 20092
Hong Kong, China 100 2005 100 2005 100 2005 UNESCAP,http://www.unescap.org/esd/energy/information/ElectricPower/1999-2000/html/Table%206-Access%20to%20electricity.xls
India 64.5 2008 52.5 2008 93.1 2008 IEA, 20092
Indonesia 64.5 2008 32 2008 94 2008 IEA, 20092
Iran 98.4 2008 95 2008 100 2008 IEA, 20092
Iraq 85 2008 57 2008 99 2008 IEA, 20092
Jamaica 92 2008 83.4 2008 99.5 2008 IEA, 20092
Jordan 99.9 2008 100 2008 99.5 2008 IEA, 20092
Kenya 15 2008 5 2008 51.3 2008 IEA, 20092
Kiribati 60 2005 UNDP, 2005
Korea (DPR) 26 2008 10 2008 36 2008 IEA, 20092
Korea (Rep) 100 2007 100 2007 100 2007 UNDP, 2007
Kuwait 100 2008 100 2008 100 2008 IEA, 20092
Lao PDR 55 2008 42 2008 84 2008 IEA, 20092
Lebanon 99.9 2008 99.3 2008 100 2008 IEA, 20092
Lesotho 16 2008 6 2008 44 2008 IEA, 20092
Liberia1 3.3 2007 1 2007 7 2007 Liberia Institute of Statistics andGeo-Information Services, Ministryof Health and Social Welfare,National AIDS Control Program, andMacro International Inc, 2008
Libya 99.8 2008 99 2008 100 2008 IEA, 20092
Madagascar 19 2008 5 2008 53 2008 IEA, 20092
Malawi 9 2008 5.3 2008 25 2008 IEA, 20092
Malaysia 99.4 2008 98 2008 100 2008 IEA, 20092
Maldives 100 2006 100 2006 100 2006 Ministry of Planning and NationalDevelopment
Mali1 17.4 2006 3.7 2006 48.7 2006 Cellule de Planiycation et deStatistique du Ministère de la Santéet al., 2007
Marshall Islands3 74.5 2007 32.3 2007 92.1 2007 EPPSO, SPC and Macro International Inc., 2008

��
The Energy Access Situation in Developing Countries: A Review Focusing on the Least Developed Countries and Sub-Saharan Africa
Country% of population with electricity access
Source(s)National Year Rural Year Urban Year
Mauritania 30.1 2005 2 2005 47 2005 Interview de Zeïdane Ould H’Meyda,le ministre du Pétrole et de l'Énergie,at http://www.jeuneafrique.com;Estimate
Mauritius 99.4 2008 99 2008 100 2008 IEA, 20092
Mexico 98.5 2006 96.1 2006 99.7 2006 ECLAC, 2008
Micronesia 54 2000 PIREP, 2004
Mongolia 67 2008 36 2008 90 2008 IEA, 20092
Morocco 97 2008 96 2008 98 2008 IEA, 20092
Mozambique 11.7 2008 6.3 2008 21 2008 IEA, 20092
Myanmar 13 2008 10 2008 19 2008 IEA, 20092
Namibia 34 2008 13 2008 70 2008 IEA, 20092
Nauru3 99.9 2007 99.9 2007 Nauru Bureau of Statistics, SPC andMacro International Inc. 2007
Nepal 43.6 2008 34 2008 89.7 2008 IEA, 20092
Nicaragua 72.1 2008 42 2008 95 2008 IEA, 20092
Niger 9.3 2006 1.5 2006 47.2 2006 Institut National de la Statistique etMacro International Inc, 2007
Nigeria 46.8 2008 26 2008 69 2008 IEA, 20092
Niue 99 2006 Secretariat of the PaciycCommunity, National Planning andDevelopment Office, Niue, 2008
Occupied PalestinianTerritories
99.7 2006 99.4 2006 99.8 2006 Palestinian Central Bureau ofStatistics, www.pcbs.gov.ps
Oman 98 2008 93 2008 99.9 2008 IEA, 20092
Pakistan 57.6 2008 46 2008 78 2008 IEA, 20092
Palau 99.5 2006 98.4 2006 100 2006 Palau Office of Planning andStatistics, UNDP, 2008; Estimates
Panama 88.1 2008 72 2008 94 2008 IEA, 20092
Papua New Guinea 10 2004 5 2004 42.8 2004 PIREP, 2004
Paraguay 94.5 2008 88 2008 98.8 2008 IEA, 20092
Peru 76.9 2008 28 2008 96.4 2008 IEA, 20092
Philippines 86 2008 65 2008 97 2008 IEA, 20092
Qatar 98.7 2008 70 2008 100 2008 IEA, 20092
Rwanda 4.8 2005 1.3 2005 25.1 2005 Institut National de la Statistique duRwanda and ORC Macro, 2006

��
The Energy Access Situation in Developing Countries: A Review Focusing on the Least Developed Countries and Sub-Saharan Africa
Country% of population with electricity access
Source(s)National Year Rural Year Urban Year
Saint Kitts and Nevis 87 2003 ESMAP, 2005
Saint Lucia 99 2006 98.5 2006 100 2006 GTZ, 2007; Estimates
St Vincent &Grenadines
99 2006 97.5 2006 100 2006 GTZ, 2007; Estimates
Samoa 97 2006 Samoa Bureau of Statistics, 2008
Sao Tome and Principe 48.5 2005 33.7 2005 61.6 2005 Instituto Nacional de Estatistica SaoTome, 2005, QUIBB 2005 – DadosPreliminares(http://www.ine.st/quadro_resumo_quibb.htm)
Saudi Arabia 99 2008 95 2008 100 2008 IEA, 20092
Senegal 42 2008 18 2008 74.7 2008 IEA, 20092
Seychelles 96 2002 Seychelles National StatisticsBureau, 2007
Sierra Leone 5.1 2007 0.1 2007 12.7 2007 Government of Sierra Leone, 2007
Singapore 100 2008 100 2008 100 2008 IEA, 20092
Solomon Islands3 14.4 2007 5.1 2007 70.6 2007 SISO, SPC and Macro International Inc., 2007
South Africa 75 2008 55 2008 88 2008 IEA, 20092
Sri Lanka 76.6 2008 75 2008 85.8 2008 IEA, 20092
Sudan 31.4 2008 19 2008 47.5 2008 IEA, 20092
Suriname 78.6 2007 Bureau voor de Statistiek inSuriname, 2007
Swaziland1 29.7 2007 20.2 2007 65.2 2007 Central Statistical Office and MacroInternational Inc, 2008
Syrian Arab Republic 92.7 2008 84 2008 100 2008 IEA, 20092
Tanzania 11.5 2008 2 2008 39 2008 IEA, 20092
Thailand 99.3 2008 99 2008 100 2008 IEA, 20092
Timor-Leste 22 2008 10.5 2008 52 2008 IEA, 20092
Togo 20 2008 4 2008 42 2008 IEA, 20092
Tonga 92.3 2006 90.7 2006 97.7 2006 Tonga Statistics Department, 2008
Trinidad and Tobago 99 2008 99 2008 99.9 2008 IEA, 20092
Tunisia 99.5 2008 98.5 2008 100 2008 IEA, 20092
Turkey 100 2007 100 2007 100 2007 UNESCAP,http://www.unescap.org/esd/energy/information/ElectricPower/1999-2000/ Estimates
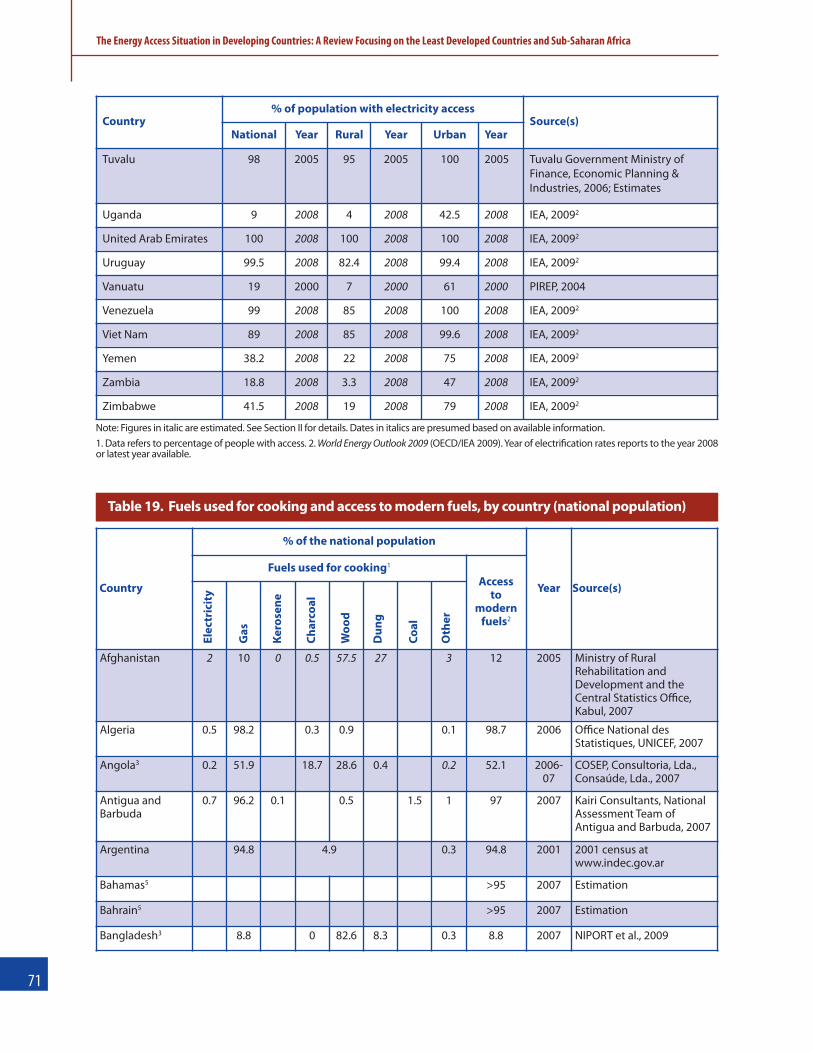
��
The Energy Access Situation in Developing Countries: A Review Focusing on the Least Developed Countries and Sub-Saharan Africa
Country% of population with electricity access
Source(s)National Year Rural Year Urban Year
Tuvalu 98 2005 95 2005 100 2005 Tuvalu Government Ministry ofFinance, Economic Planning &Industries, 2006; Estimates
Uganda 9 2008 4 2008 42.5 2008 IEA, 20092
United Arab Emirates 100 2008 100 2008 100 2008 IEA, 20092
Uruguay 99.5 2008 82.4 2008 99.4 2008 IEA, 20092
Vanuatu 19 2000 7 2000 61 2000 PIREP, 2004
Venezuela 99 2008 85 2008 100 2008 IEA, 20092
Viet Nam 89 2008 85 2008 99.6 2008 IEA, 20092
Yemen 38.2 2008 22 2008 75 2008 IEA, 20092
Zambia 18.8 2008 3.3 2008 47 2008 IEA, 20092
Zimbabwe 41.5 2008 19 2008 79 2008 IEA, 20092
Note: Figures in italic are estimated. See Section II for details. Dates in italics are presumed based on available information.1. Data refers to percentage of people with access. 2.World Energy Outlook 2009 (OECD/IEA 2009). Year of electriycation rates reports to the year 2008or latest year available.
Country
% of the national population
Year Source(s)
Fuels used for cooking1
Access to
modernfuels2
Afghanistan 2 10 0 0.5 57.5 27 3 12 2005 Ministry of RuralRehabilitation andDevelopment and theCentral Statistics Office,Kabul, 2007
Algeria 0.5 98.2 0.3 0.9 0.1 98.7 2006 Office National desStatistiques, UNICEF, 2007
Angola3 0.2 51.9 18.7 28.6 0.4 0.2 52.1 2006-07
COSEP, Consultoria, Lda.,Consaúde, Lda., 2007
Antigua andBarbuda
0.7 96.2 0.1 0.5 1.5 1 97 2007 Kairi Consultants, NationalAssessment Team ofAntigua and Barbuda, 2007
Argentina 94.8 4.9 0.3 94.8 2001 2001 census atwww.indec.gov.ar
Bahamas5 >95 2007 Estimation
Bahrain5 >95 2007 Estimation
Bangladesh3 8.8 0 82.6 8.3 0.3 8.8 2007 NIPORT et al., 2009
Table 19. Fuels used for cooking and access to modern fuels, by country (national population)
Elec
tric
ity
Oth
er
Coal
Woo
d
Dun
g
Char
coal
Kero
sene
Gas

��
The Energy Access Situation in Developing Countries: A Review Focusing on the Least Developed Countries and Sub-Saharan Africa
Country
% of the national population
Year Source(s)
Fuels used for cooking1
Access to
modernfuels2
Barbados5 >95 2007 Estimation
Belize 1.1 81.7 1 0.1 13.6 2.5 83.8 2006 MICS and MDG Indicators,Belize, 2006
Benin 0 3.7 1.9 21.2 72.2 1 5.6 2006 INSAE, République duBénin, 2007
Bhutan 34.2 22.6 0.1 40.7 2.4 56.9 2007 National Statistics Bureau,Royal Government ofBhutan, 2007
Bolivia 0.7 68 0 28.4 0 2.6 68.7 2007 Instituto Nacional de Estadistica, 2009
Botswana 7.2 45.8 3.3 43.4 0.1 0.1 0.2 56.2 2006 Central Statistics Office, 2009
Brazil 0.5 86.7 0 0.4 10.2 1.8 0.3 87.2 2003 WHO, 2003
Burkina Faso 0.1 6.3 0.4 4.3 88.5 0 0.4 6.8 2007 Ministère de l'Economie etdes Finances, Institut National de la Statistique et de la Démographie, 2007
Burundi 0.1 0.2 0 5.1 94.2 0.2 0.2 0.3 2005 ISTEEBU and UNICEF, 2008
Cambodia 0.2 7.3 0 7.9 84.4 0.1 0 0.1 7.5 2005 National Institute of PublicHealth, National Institute ofStatistics and ORC Macro,2006
Cameroon 0.1 16.1 5.2 1.7 73.5 3.4 21.4 2006 Ministère de l’Economie, Dela Planiycation et de L’Amé-nagement du Territoire, In-stitut National de lastatistique, UNICEF, 2007
Cape Verde 62.5 35.1 2.4 62.5 2006 Republic of Cape Verde,Ministry of Finance andPublic Administration, 2008
Central AfricanRepublic
0.3 0.1 0.2 2.2 96.9 0 0 0.3 0.6 2006 Institut Centrafricain desStatistiques, et des EtudesEconomiques et Sociales,2007
Chad 0.7 1.5 0.3 15.4 70.8 0.1 4.9 6.3 2.5 2003 WHO, 2003
Chile5 > 95 2007 Estimation
China 10.6 31.1 0.3 0 26.7 28.9 2.5 42 2007 Author’s calculation basedon rural and urban data
Colombia 7.2 74.5 0.8 14.8 0.4 2.3 82.5 2005 Asociación Probienestar dela Familia Colombiana Pro-familia, 2005
Comoros 0.1 2.3 22.1 0.7 74.6 0.2 24.5 2004 Lachaud J.P., 2005
Elec
tric
ity
Oth
er
Coal
Woo
d
Dun
g
Char
coal
Kero
sene
Gas
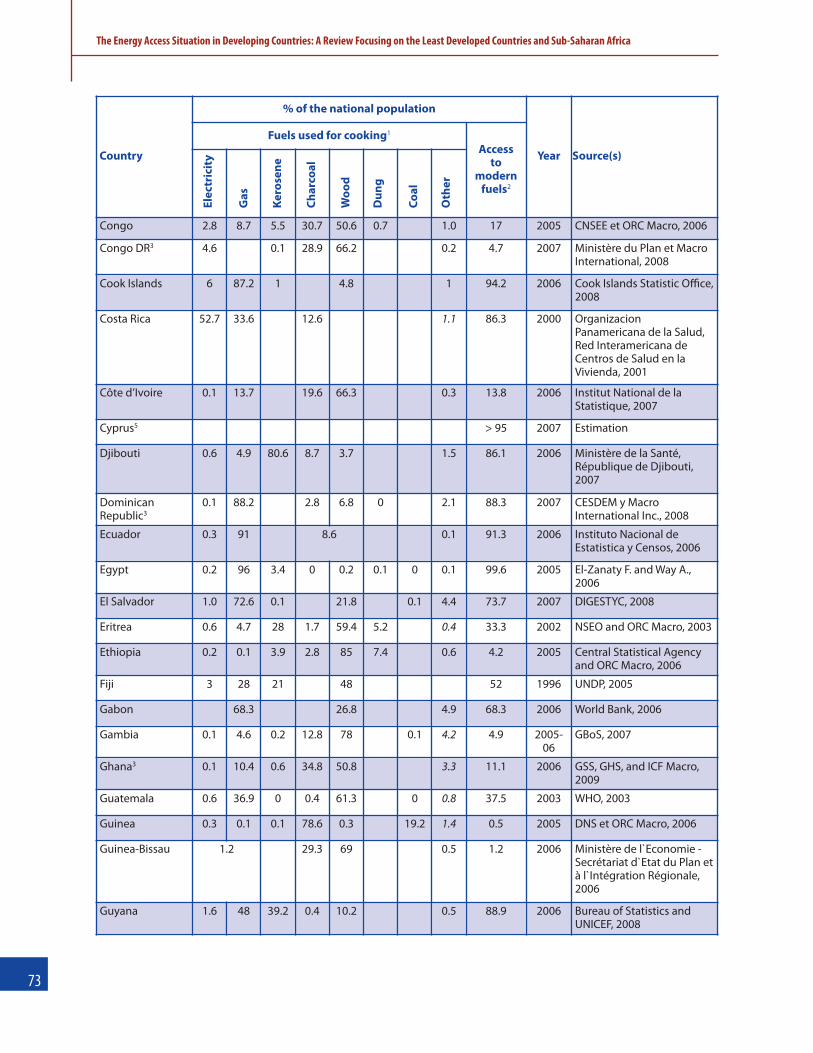
��
The Energy Access Situation in Developing Countries: A Review Focusing on the Least Developed Countries and Sub-Saharan Africa
Country
% of the national population
Year Source(s)
Fuels used for cooking1
Access to
modernfuels2
Congo 2.8 8.7 5.5 30.7 50.6 0.7 1.0 17 2005 CNSEE et ORC Macro, 2006
Congo DR3 4.6 0.1 28.9 66.2 0.2 4.7 2007 Ministère du Plan et MacroInternational, 2008
Cook Islands 6 87.2 1 4.8 1 94.2 2006 Cook Islands Statistic Office,2008
Costa Rica 52.7 33.6 12.6 1.1 86.3 2000 OrganizacionPanamericana de la Salud,Red Interamericana deCentros de Salud en laVivienda, 2001
Côte d’Ivoire 0.1 13.7 19.6 66.3 0.3 13.8 2006 Institut National de laStatistique, 2007
Cyprus5 > 95 2007 Estimation
Djibouti 0.6 4.9 80.6 8.7 3.7 1.5 86.1 2006 Ministère de la Santé,République de Djibouti,2007
DominicanRepublic3
0.1 88.2 2.8 6.8 0 2.1 88.3 2007 CESDEM y MacroInternational Inc., 2008
Ecuador 0.3 91 8.6 0.1 91.3 2006 Instituto Nacional deEstatistica y Censos, 2006
Egypt 0.2 96 3.4 0 0.2 0.1 0 0.1 99.6 2005 El-Zanaty F. and Way A.,2006
El Salvador 1.0 72.6 0.1 21.8 0.1 4.4 73.7 2007 DIGESTYC, 2008
Eritrea 0.6 4.7 28 1.7 59.4 5.2 0.4 33.3 2002 NSEO and ORC Macro, 2003
Ethiopia 0.2 0.1 3.9 2.8 85 7.4 0.6 4.2 2005 Central Statistical Agencyand ORC Macro, 2006
Fiji 3 28 21 48 52 1996 UNDP, 2005
Gabon 68.3 26.8 4.9 68.3 2006 World Bank, 2006
Gambia 0.1 4.6 0.2 12.8 78 0.1 4.2 4.9 2005-06
GBoS, 2007
Ghana3 0.1 10.4 0.6 34.8 50.8 3.3 11.1 2006 GSS, GHS, and ICF Macro,2009
Guatemala 0.6 36.9 0 0.4 61.3 0 0.8 37.5 2003 WHO, 2003
Guinea 0.3 0.1 0.1 78.6 0.3 19.2 1.4 0.5 2005 DNS et ORC Macro, 2006
Guinea-Bissau 1.2 29.3 69 0.5 1.2 2006 Ministère de l`Economie -Secrétariat d`Etat du Plan età l`Intégration Régionale,2006
Guyana 1.6 48 39.2 0.4 10.2 0.5 88.9 2006 Bureau of Statistics andUNICEF, 2008
Elec
tric
ity
Oth
er
Coal
Woo
d
Dun
g
Char
coal
Kero
sene
Gas

��
The Energy Access Situation in Developing Countries: A Review Focusing on the Least Developed Countries and Sub-Saharan Africa
Country
% of the national population
Year Source(s)
Fuels used for cooking1
Access to
modernfuels2
\Haiti 0 3.1 2.9 41.6 51.8 0.3 0.3 6 2005-06
Cayemittes, M. et al., 2007
Honduras 19.5 19.9 5.8 52.2 0.1 2.5 45.2 2005-06
Secretaría de Salud, INE yMacro International, 2006
Hong Kong,China5
>95 2007 Estimation
India 0.4 25.2 3.2 0.4 57.9 10.6 1.9 0.4 28.8 2005-06
IIPS and Macro International,2007
Indonesia 0.2 11.2 34.2 0.4 53.4 0 0 0.6 45.6 2007 Statistics Indonesia (BadanPusat Statistik—BPS) andMacro International, 2008
Iraq 0.2 86.3 8.9 3.8 0.7 0.1 0.0 95.4 2006 Central Organization forStatistics & InformationTechnology, Kurdistan Regional Statistics Office,2007
Jamaica 1.6 79.8 0.4 15.6 2.5 81.8 2001 Personal communication,Census 2001
Jordan 0.2 99.5 0.1 0.1 0.1 99.8 2007 Department of Statisticsand Macro International Inc,2008
Kenya 0.6 3.5 13.2 13.3 68.7 0.7 17.3 2005-06
Kenya National Bureau ofStatistics, 2009
Korea (Rep.) 0.1 99.7 0.1 0.1 99.9 1998 UNESCAP, athttp://www.unescap.org/esd/energy/ publications/psec/tables/guidelines-table-112.jpg
Kuwait5 >95 2007 Estimation
Lao PDR 1.5 1.1 0 1.5 74.8 0 21.2 2.6 2006 Department of Statisticsand UNICEF, 2008
Lebanon4 1.2 99.6 0.1 1.3 0 0 0 ≥99.6 2004 Lebanese Republic Ministryof Social Affairs, UNDP, 2006
Lesotho 1.8 22 13.5 0.1 56.6 5.7 0 0.3 37.3 2004 MOHSW, BOS and ORCMacro, 2005
Liberia3 0 0 0 40.5* 58.9 * 0.6 0 2007 LISGIS, et al., 2008
Libya5 >95 2007 Estimation
Madagascar 0.2 0.3 0.1 17.4 81.7 0.3 0.6 2005 INSTAT, Ministère de l'Economie, des Finances etdu Budget, 2006
Malawi 1.2 0 0 7.2 91.4 0 0 0.2 1.2 2006 National Statistical Officeand UNICEF, 2008
Malaysia 0.5 95.8 0.3 0.1 0.8 2.5 2.5 96.7 2003 WHO, 2003
Elec
tric
ity
Oth
er
Coal
Woo
d
Dun
g
Char
coal
Kero
sene
Gas

��
The Energy Access Situation in Developing Countries: A Review Focusing on the Least Developed Countries and Sub-Saharan Africa
Country
% of the national population
Year Source(s)
Fuels used for cooking1
Access to
modernfuels2
Maldives 76.8 4.39 13.62 5.2 81.19 2006 Ministry of Planning and National Development, 2006
Mali3 0 0.2 14.5 82.6 2 0.7 0.2 2006 CPS/MS, DNSI/MEIC et MacroInternational Inc., 2007
Marshall Islands3 17.3 18.6 29.9 0.1 33.5 0.6 65.8 2007 EPPSO, SPC and MacroInternational Inc., 2008
Mauritania 1.3 36 23.2 38.9 0.6 37.3 2007 Office National de laStatistique and UNICEF, 2008
Mauritius 2.2 91 2.6 4.1 0.1 95.8 2004 Central Statistics Office,Ministry of Finance andEconomic Development,2004
Mexico 0.5 85 0 0.5 13.2 0 0.3 0.5 85.6 2003 WHO, 2003
Micronesia 10.6 3.6 44.1 41.5 0.2 58.3 2005 Government of theFederated States ofMicronesia, 2008
Mongolia 22.9 0.3 0.2 34 23.3 19.4 0.0 23.2 2005 National Statistical Office,UNICEF, 2007
Morocco 0.1 91.1 0 0.4 7.8 0.2 0.4 91.2 2003-04
Measure DHS, Personalcommunication
Mozambique 0.8 1.4 0.5 0.4 84 0.2 12.6 0.1 2.7 2003 Instituto Nacional deEstatística, Ministério daSaúde, ORC Macro, 2005
Myanmar 3 0.3 0.1 22.4 70.2 0 4 3.4 2003 WHO, 2003
Namibia3 29.3 5.7 0.1 0.6 62.3 0.3 0 1.7 35.1 2006-07
MoHSS, Macro International Inc., 2008
Nauru3 81.8 4.1 5.2 8.3 0.6 91.1 2007 Nauru Bureau of Statistics,SPC and MacroInternational Inc., 2007
Nepal 0.1 12.6 3.5 0.1 75.2 8 0 0.5 16.2 2006 MOHP, New ERA, and MacroInternational Inc., 2007
Nicaragua 0.6 41 0.1 56.5 0.6 1.2 41.7 2006-07
INIDE, MINSA, 2008
Niger 0.2 0.7 2.8 94.2 2 0.1 0.9 2006 INS et Macro InternationalInc., 2007
Nigeria 0.3 1 23 2.2 72.3 0.5 0.1 0.6 24.3 2007 National Bureau ofStatistics, UNICEF, 2007
Niue 56 31 1 5 7 0 0 0.0 88 2006 Secretariat of the PaciycCommunity, NationalPlanning and DevelopmentOffice, Niue, 2008
OccupiedPalestinianTerritories
0.5 99 0.5 0.0 99.5 2006 Palestinian Central Bureauof Statistics, 2007;Estimations
Elec
tric
ity
Oth
er
Coal
Woo
d
Dun
g
Char
coal
Kero
sene
Gas
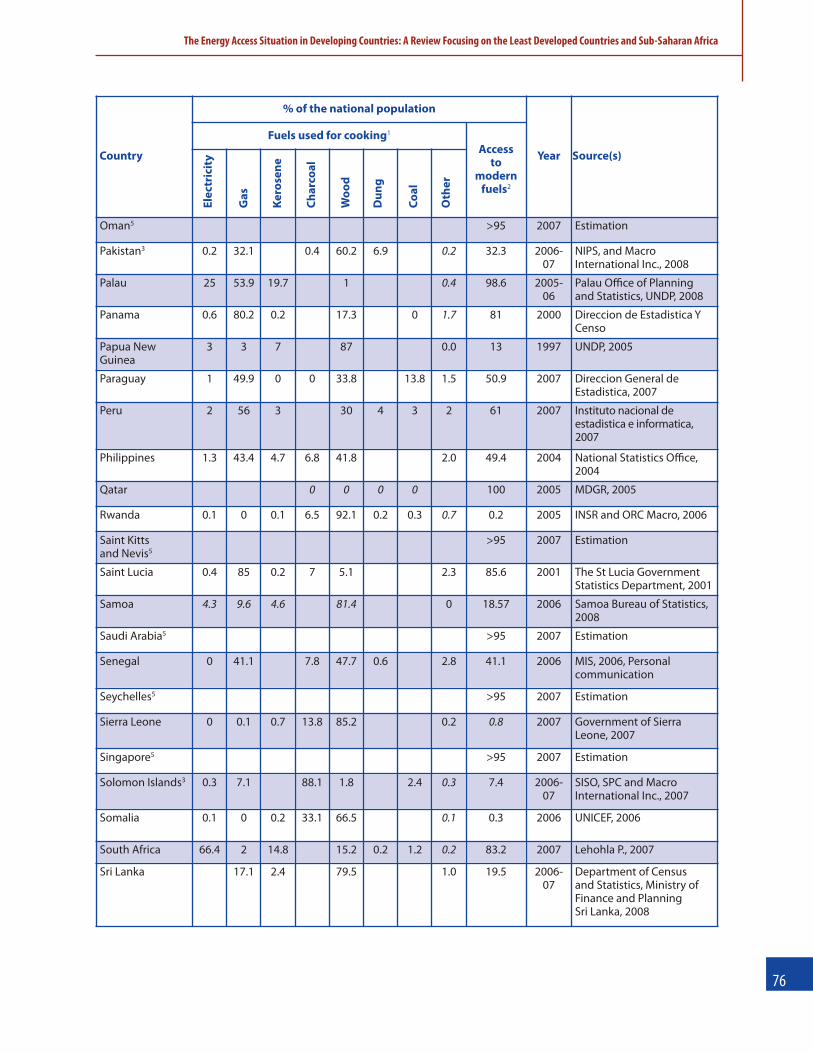
��
The Energy Access Situation in Developing Countries: A Review Focusing on the Least Developed Countries and Sub-Saharan Africa
Country
% of the national population
Year Source(s)
Fuels used for cooking1
Access to
modernfuels2
Oman5 >95 2007 Estimation
Pakistan3 0.2 32.1 0.4 60.2 6.9 0.2 32.3 2006-07
NIPS, and MacroInternational Inc., 2008
Palau 25 53.9 19.7 1 0.4 98.6 2005-06
Palau Office of Planningand Statistics, UNDP, 2008
Panama 0.6 80.2 0.2 17.3 0 1.7 81 2000 Direccion de Estadistica YCenso
Papua NewGuinea
3 3 7 87 0.0 13 1997 UNDP, 2005
Paraguay 1 49.9 0 0 33.8 13.8 1.5 50.9 2007 Direccion General de Estadistica, 2007
Peru 2 56 3 30 4 3 2 61 2007 Instituto nacional de estadistica e informatica,2007
Philippines 1.3 43.4 4.7 6.8 41.8 2.0 49.4 2004 National Statistics Office,2004
Qatar 0 0 0 0 100 2005 MDGR, 2005
Rwanda 0.1 0 0.1 6.5 92.1 0.2 0.3 0.7 0.2 2005 INSR and ORC Macro, 2006
Saint Kitts and Nevis5
>95 2007 Estimation
Saint Lucia 0.4 85 0.2 7 5.1 2.3 85.6 2001 The St Lucia GovernmentStatistics Department, 2001
Samoa 4.3 9.6 4.6 81.4 0 18.57 2006 Samoa Bureau of Statistics,2008
Saudi Arabia5 >95 2007 Estimation
Senegal 0 41.1 7.8 47.7 0.6 2.8 41.1 2006 MIS, 2006, Personal communication
Seychelles5 >95 2007 Estimation
Sierra Leone 0 0.1 0.7 13.8 85.2 0.2 0.8 2007 Government of SierraLeone, 2007
Singapore5 >95 2007 Estimation
Solomon Islands3 0.3 7.1 88.1 1.8 2.4 0.3 7.4 2006-07
SISO, SPC and Macro International Inc., 2007
Somalia 0.1 0 0.2 33.1 66.5 0.1 0.3 2006 UNICEF, 2006
South Africa 66.4 2 14.8 15.2 0.2 1.2 0.2 83.2 2007 Lehohla P., 2007
Sri Lanka 17.1 2.4 79.5 1.0 19.5 2006-07
Department of Census and Statistics, Ministry of Finance and Planning Sri Lanka, 2008
Elec
tric
ity
Oth
er
Coal
Woo
d
Dun
g
Char
coal
Kero
sene
Gas

��
The Energy Access Situation in Developing Countries: A Review Focusing on the Least Developed Countries and Sub-Saharan Africa
Country
% of the national population
Year Source(s)
Fuels used for cooking1
Access to
modernfuels2
Sudan 0.1 6.4 0.4 1.3 56.2 0.5 14.3 20.8 6.9 2006 Central Bureau of Statistics,Republic of Sudan, 2007
Swaziland3 12.6 11.2 0.4 71.7 0.2 3.9 23.8 2006-07
CSO, and MacroInternational Inc., 2008
Syrian ArabRepublic
1.4 98.1 0.5 99.5 2006 Central Bureau of Statistics,UNICEF, 2007
Tanzania 0.3 0.2 2.3 19 77.6 0 0.5 2.8 2007-08
TACAIDS, ZAC, NBS, OCGS,and Macro International Inc.,2008
Thailand 3.4 59.7 18.8 18.1 0 0 63.1 2005-06
Thailand National StatisticalOffice, 2006
Togo 0.1 1.2 0.5 43.8 54 0.4 1.8 2006 Direction Generale de laStatistique et de laComptabilité Nationale,2007
Tokelau 34.2 55.8 0.9 9.1 90 2006 Statistics New Zealand andthe Office of the Council forthe Ongoing Governmentof Tokelau, 2006
Tonga 3.5 53.6 2 40.9 0 59.1 2006 Tonga StatisticsDepartment, 2008
Trinidad andTobago
5.7 93.2 0.1 0.3 0.7 99 2006 Ministry of SocialDevelopment, CentralStatistical Office, UNICEF,2008
Tunisia 98.4 0.4 1.2 98.4 2006 Ministère de la SantéPublique, Office National dela Famille et de laPopulation, UNICEF, 2008
Tuvalu 0.9 12.1 58.3 28 0.7 71.3 2004-05
Tuvalu GovernmentMinistry of Finance,Economic Planning &Industries, 2006
Uganda3 0 0.1 0.3 13 85.8 0.8 0.4 2006 UBOS and MacroInternational Inc., 2007
United ArabEmirates
4.8 94.4 0.8 99.2 2003 WHO, 2003
Uruguay 6.8 87.7 1.1 4.3 0.1 95.6 2006 Instituto Nacional deEstadistica Uruguay,Encuesta Nacional deHogares Ampliada, 2006
Vanuatu 0.9 12.2 1.4 0.5 84.5 0 0.5 14.5 2007 Ministry of Health,Government of Vanuatu,2008
Elec
tric
ity
Oth
er
Coal
Woo
d
Dun
g
Char
coal
Kero
sene
Gas

��
The Energy Access Situation in Developing Countries: A Review Focusing on the Least Developed Countries and Sub-Saharan Africa
Country
% of the national population
Year Source(s)
Fuels used for cooking1
Access to
modernfuels2
Viet Nam 0.4 32.3 1.3 3.5 56.8 5.2 0.5 34 2006 General Statistics Office ofViet Nam, 2007
Yemen 0.6 58.9 3.4 36.2 0.9 62.9 2006 Ministry of Health andPopulation, UNICEF 2008
Zambia3 15.8 0 0 24.5 59.5 0.1 0.2 0 15.8 2007 CSO, MOH, TDRC, Universityof Zambia, and MacroInternational Inc., 2009
Zimbabwe 32.6 0 0.2 0.1 66.8 0.1 0.1 0.1 32.8 2005-06
CSO and MacroInternational Inc., 2007
Note: Figures in italic are estimated. See Section II for details. 1. Wood includes wood, wood chips, straw and crop residues. Gas includes natural gas,LPG, biogas and ethanol. Kerosene also includes paraffin. Coal includes coal dust and lignite. Other includes missing data, ‘no cooking in the house’ aswell as other fuels. 2. Access to modern fuels includes percent of population using electricity, gas or kerosene as primary cooking fuels. 3. Data refersto percentage of people with access. 4. More than one cooking fuels is indicated, therefore the total is higher than 100 percent. 5. Countries with a GrossNational Income (GNI) per capita above US$ 10,500 and for which no survey data is available are assumed to have made a complete transition to usingnon-solid fuels as the primary source of domestic energy for cooking and heating.
Table 20. Fuels used for cooking and access to modern fuels, by country (rural population)
Country
% of the rural population
Year Source(s)
Fuels used for cooking1
Accessto
modernfuels2
Afghanistan 0 3 0 0.5 65 30 1.5 3 2005 Ministry of RuralRehabilitation andDevelopment and theCentral Statistics Office,Kabul, 2007
Algeria 0.3 96.8 0.7 2.1 0.1 97.1 2006 Office National desStatistiques, UNICEF, 2007
Angola3 0.2 10.4 25.7 62.5 1 0.2 10.6 2006-07
COSEP, Consultoria, Lda.,Consaúde, Lda., 2007
Argentina 67.1 32.4 0.5 67.1 2001 2001 census atwww.indec.gov.ar
Bangladesh3 0 0.6 89.6 9.7 0 0.1 0.6 2007 NIPORT, Mitra andAssociates, and MacroInternational, 2009
Belize 0.8 69.1 1.1 0.1 27 0 0 1.9 71 2006 MICS and MDG Indicators,Belize, 2006
Benin 0 0.2 0.9 6.5 91.7 0.7 1.1 2006 INSAE, République duBénin, 2007
Bhutan 27.4 13 0.2 57.2 2.2 40.6 2007 National Statistics Bureau,Royal Government ofBhutan, 2007
Elec
tric
ity
Oth
er
Coal
Woo
d
Dun
g
Char
coal
Kero
sene
Gas
Elec
tric
ity
Oth
er
Coal
Woo
d
Dun
g
Char
coal
Kero
sene
Gas

��
The Energy Access Situation in Developing Countries: A Review Focusing on the Least Developed Countries and Sub-Saharan Africa
Country
% of the rural population
Year Source(s)
Fuels used for cooking1
Accessto
modernfuels2
Bolivia 0 29.1 0.1 69 1.1 0.7 29.2 2007 Instituto Nacional deEstadistica, 2009
Botswana 2.5 21.3 1.3 74.4 0.3 0.1 0.1 25.1 2006 Central Statistics Office,2009
Brazil 0.3 46.7 0 1.6 45.8 0 5.4 0.2 47 2003 WHO, 2003
Burkina Faso 0 1.4 0.4 1.7 96.4 0 0 0.1 1.8 2007 Ministère de l'Economie etdes Finances, InstitutNational de la Statistique etde la Démographie, 2007
Burundi 0 0.2 0 2 97.5 0 0.3 0.2 2005 ISTEEBU and UNICEF, 2008
Cambodia 0.1 3.4 0 4.9 91.3 0.2 0 0.1 3.5 2005 National Institute of PublicHealth, National Institute ofStatistics and ORC Macro,2006
Cameroon 0 1.4 1.2 1 93.9 2.5 2.6 2006 Ministère de l’Economie, Dela Planiycation et deL’Aménagement duTerritoire, Institut National dela statistique, UNICEF, 2007
Cape Verde 27.6 70.7 1.7 27.6 2006 Republic of Cape Verde,Ministry of Finance andPublic Administration, 2008
Central AfricanRepublic
0 0 0.3 1.2 98.2 0 0 0.3 0.3 2006 Institut Centrafricain desStatistiques, et des EtudesEconomiques et Sociales,2007
Chad 0.6 0.9 0.2 8.4 82.9 0.1 1.1 5.8 1.7 2003 WHO, 2003
China 7.5 17.8 0.1 0 43.1 29.8 1.7 25.5 2007 National agriculture census,2008 Carolina Population Center,National Institute ofNutrition and Food Safety,2008
Colombia 4.1 40.7 0.4 52 1 1.8 45.2 2005 Asociación Probienestar dela Familia ColombianaProfamilia, 2005
Comoros 0 0.4 9.4 0.4 85.4 0.2 4.2 9.8 2003 WHO, 2003
Congo 0.4 1 1.7 9.7 86 0.1 1.1 3.1 2005 CNSEE et ORC Macro, 2006
Congo DR3 0 0 11.4 88.5 0.1 0 2007 Ministère du Plan et MacroInternational, 2008
Elec
tric
ity
Oth
er
Coal
Woo
d
Dun
g
Char
coal
Kero
sene
Gas
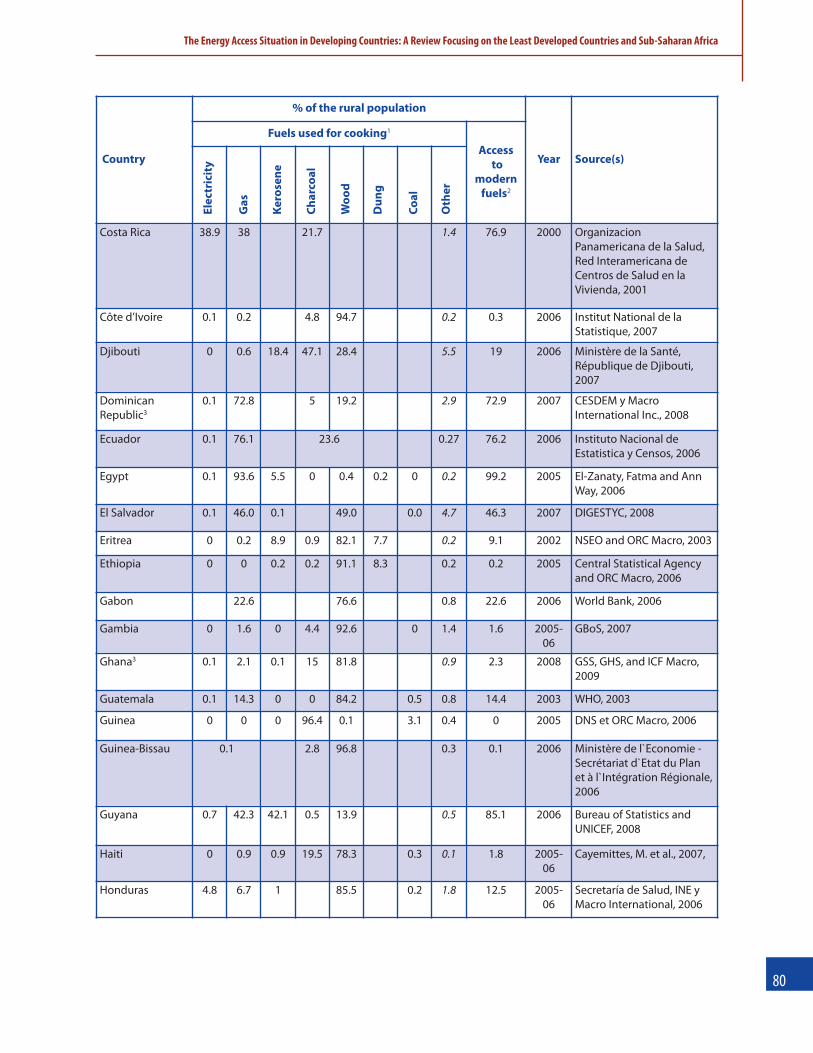
��
The Energy Access Situation in Developing Countries: A Review Focusing on the Least Developed Countries and Sub-Saharan Africa
Country
% of the rural population
Year Source(s)
Fuels used for cooking1
Accessto
modernfuels2
Costa Rica 38.9 38 21.7 1.4 76.9 2000 OrganizacionPanamericana de la Salud,Red Interamericana deCentros de Salud en laVivienda, 2001
Côte d’Ivoire 0.1 0.2 4.8 94.7 0.2 0.3 2006 Institut National de laStatistique, 2007
Djibouti 0 0.6 18.4 47.1 28.4 5.5 19 2006 Ministère de la Santé,République de Djibouti,2007
DominicanRepublic3
0.1 72.8 5 19.2 2.9 72.9 2007 CESDEM y MacroInternational Inc., 2008
Ecuador 0.1 76.1 23.6 0.27 76.2 2006 Instituto Nacional deEstatistica y Censos, 2006
Egypt 0.1 93.6 5.5 0 0.4 0.2 0 0.2 99.2 2005 El-Zanaty, Fatma and AnnWay, 2006
El Salvador 0.1 46.0 0.1 49.0 0.0 4.7 46.3 2007 DIGESTYC, 2008
Eritrea 0 0.2 8.9 0.9 82.1 7.7 0.2 9.1 2002 NSEO and ORC Macro, 2003
Ethiopia 0 0 0.2 0.2 91.1 8.3 0.2 0.2 2005 Central Statistical Agencyand ORC Macro, 2006
Gabon 22.6 76.6 0.8 22.6 2006 World Bank, 2006
Gambia 0 1.6 0 4.4 92.6 0 1.4 1.6 2005-06
GBoS, 2007
Ghana3 0.1 2.1 0.1 15 81.8 0.9 2.3 2008 GSS, GHS, and ICF Macro,2009
Guatemala 0.1 14.3 0 0 84.2 0.5 0.8 14.4 2003 WHO, 2003
Guinea 0 0 0 96.4 0.1 3.1 0.4 0 2005 DNS et ORC Macro, 2006
Guinea-Bissau 0.1 2.8 96.8 0.3 0.1 2006 Ministère de l`Economie -Secrétariat d`Etat du Plan et à l`Intégration Régionale,2006
Guyana 0.7 42.3 42.1 0.5 13.9 0.5 85.1 2006 Bureau of Statistics andUNICEF, 2008
Haiti 0 0.9 0.9 19.5 78.3 0.3 0.1 1.8 2005-06
Cayemittes, M. et al., 2007,
Honduras 4.8 6.7 1 85.5 0.2 1.8 12.5 2005-06
Secretaría de Salud, INE yMacro International, 2006
Elec
tric
ity
Oth
er
Coal
Woo
d
Dun
g
Char
coal
Kero
sene
Gas

��
The Energy Access Situation in Developing Countries: A Review Focusing on the Least Developed Countries and Sub-Saharan Africa
Country
% of the rural population
Year Source(s)
Fuels used for cooking1
Accessto
modernfuels2
India 0.1 8.6 0.8 0.3 74.7 14.4 0.8 0.3 9.5 2005-06
IIPS and MacroInternational, 2007
Indonesia 0.1 3.9 18.5 0.5 76.6 0 0.4 22.5 2007 Statistics Indonesia (BadanPusat Statistik—BPS) andMacro International, 2008
Iraq 0.2 74.1 12.8 10.5 2.1 0.3 0.0 87.1 2006 Central Organization forStatistics & InformationTechnology, KurdistanRegional Statistics Office,2007
Jordan 0.1 99 0.3 0.5 0.1 99.4 2007 Department of Statisticsand Macro InternationalInc., 2008
Kenya 0.2 0.7 2.7 7.7 88.2 0.5 3.6 2005-06
Kenya National Bureau ofStatistics, 2009
Korea (Rep.) 99 0.5 0.5 99.5 1998 UNESCAP, athttp://www.unescap.org/esd/energy/publications/psec/tables/guidelines-table-112.jpg
Lao PDR 0.1 0.1 1 88 10.8 0 0.2 2006 Department of Statisticsand UNICEF, 2008
Lesotho 0.2 10.7 9.2 0.2 72.1 7.4 0 0.2 20.1 2004 MOHSW, BOS and ORCMacro, 2005
Liberia3 0 0 0 13.6* 86 * 0.4 0 2007 LISGIS, et al., 2008
Madagascar 0.1 0.1 0.1 6.3 93 0.4 0.3 2005 INSTAT, Ministère del'Economie, des Finances etdu Budget, 2006
Malawi 0.2 0 0 1.3 98.3 0 0 0.2 0.2 2006 National Statistical Officeand UNICEF, 2008
Malaysia 0 94.8 0.5 0.2 1.9 2.6 95.3 2003 WHO, 2003
Mali3 0 0 4.5 92.5 2.4 0.6 0 2006 CPS/MS, DNSI/MEIC etMacro International Inc.,2007
Marshall Islands3 0.7 0.5 3.2 0.3 94.9 0.4 4.4 2007 EPPSO, SPC and MacroInternational Inc., 2008
Mauritania 0.5 16.8 17.7 64.3 0.7 17.3 2007 Office National de laStatistique and UNICEF,2008
Elec
tric
ity
Oth
er
Coal
Woo
d
Dun
g
Char
coal
Kero
sene
Gas

��
The Energy Access Situation in Developing Countries: A Review Focusing on the Least Developed Countries and Sub-Saharan Africa
Country
% of the rural population
Year Source(s)
Fuels used for cooking1
Accessto
modernfuels2
Mauritius 0.1 94.5 1.2 2.3 2 95.9 2003 WHO, 2003
Mexico 0.3 54.8 0 1.4 41.5 0 0.7 1.1 55.1 2003 WHO, 2003
Mongolia 1.8 * 44.9 49.5 3.8* 1.8 2005 National Statistical Office,UNICEF, 2007, Mongolia
Morocco 0 78.1 0 1.2 20.1 0.3 0.3 78.1 2003-04
Measure DHS, Personalcommunication
Mozambique 0.2 0 0 0.1 98.4 0.2 0.9 0.2 0.2 2003 Instituto Nacional deEstatística, Ministério daSaúde, ORC Macro, 2005
Myanmar 0.1 0 0 11.2 84.6 0 4.1 0.1 2003 WHO, 2003
Namibia3 3.9 2.3 0 0.9 92.1 0.5 0.1 0.2 6.2 2006-07
MoHSS, Macro InternationalInc., 2008
Nepal 0 6.3 1 0.1 83.1 9.1 0 0.4 7.3 2006 MOHP, New ERA, and MacroInternational Inc., 2007
Nicaragua 0.3 7.3 0 91.4 0.1 0.9 7.6 2006-07
INIDE, MINSA, 2008
Niger 0.1 0.1 1.2 96.1 2.3 0.2 0.2 2006 INS et Macro InternationalInc., 2007
Nigeria 0.1 0.2 7.3 0.7 90.2 0.7 0 0.8 7.6 2007 National Bureau ofStatistics, UNICEF, 2007
OccupiedPalestinianTerritories
98.7 0.3 1 0 99 2006 Palestinian Central Bureauof Statistics, 2007;Estimations
Oman Estimation
Pakistan3 0.2 9.6 0.6 80.3 9.1 0.2 9.8 2006-07
NIPS, and MacroInternational Inc., 2008
Paraguay 0.9 21.6 0 68.5 7.9 1.1 22.5 2007 Direccion General deEstadistica, 2007
Peru 0.1 7.5 2.1 76.7 9 1.3 3.3 9.7 2004-05
DHS 2004-2005, personalcommunication
Philippines 0.2 27 2.4 8.3 60.8 1.4 0 29.5 2003 WHO, 2003
Rwanda 0 0 0 1.3 98 0.2 0 0.5 0 2005 INSR and ORC Macro, 2006
Elec
tric
ity
Oth
er
Coal
Woo
d
Dun
g
Char
coal
Kero
sene
Gas

��
The Energy Access Situation in Developing Countries: A Review Focusing on the Least Developed Countries and Sub-Saharan Africa
Country
% of the rural population
Year Source(s)
Fuels used for cooking1
Accessto
modernfuels2
Senegal 0 12.1 7.5 78.5 1.1 0.8 12.1 2006 MIS, 2006, personalcommunication
Sierra Leone 0 0 0.3 0.5 99 0 0.2 0.3 2007 Government of SierraLeone, 2007
Solomon Islands3 0.1 1.9 94.5 0.6 0 2.5 0.4 2 2006-07
SISO, SPC and MacroInternational Inc., 2007
Somalia 0 0 0.1 8 91.8 0.1 0.1 2006 UNICEF, 2006
South Africa 36.5 4.8 16 0.4 31.5 0.1 2.7 8 57.3 2003 WHO, 2003
Sri Lanka 12.4 1.1 85.6 0.9 13.5 2006-07
Department of Census andStatistics, Ministry ofFinance and Planning SriLanka, 2008
Swaziland3 5.2 6.4 0.3 86.2 0.1 1.8 11.6 2006-07
CSO, and MacroInternational Inc., 2008
Syrian ArabRepublic
1.1 98 0.9 99.1 2006 Central Bureau of Statistics,UNICEF, 2007
Tanzania 0.1 0 0.3 5.7 93.6 0 0.3 0.4 2007-08
TACAIDS, ZAC, NBS, OCGS,and Macro InternationalInc., 2008
Thailand 1.9 50.8 23.9 23.3 0.1 0.0 52.7 2005-06
Thailand National StatisticalOffice, 2006
Togo 0 0.2 0.1 17.4 82.3 0 0.0 0.3 2006 Direction Generale de laStatistique et de laComptabilité Nationale,2007
Tonga 3.2 44.5 2 0 50.2 0 0.1 49.7 2006 Tonga StatisticsDepartment, 2008
Tunisia 97 1.2 1.8 97 2006 Ministère de la SantéPublique, Office National dela Famille et de laPopulation, UNICEF, 2008
Uganda3 0 0 0.1 5.2 94.3 0.4 0.1 2006 UBOS and MacroInternational Inc., 2007
United ArabEmirates
1 98.7 0.3 99.7 2003 WHO, 2003
Uruguay 2.8 74.6 1.1 21.2 0.3 78.5 2006 Instituto Nacional deEstadistica Uruguay,Encuesta Nacional deHogares Ampliada, 2006
Elec
tric
ity
Oth
er
Coal
Woo
d
Dun
g
Char
coal
Kero
sene
Gas
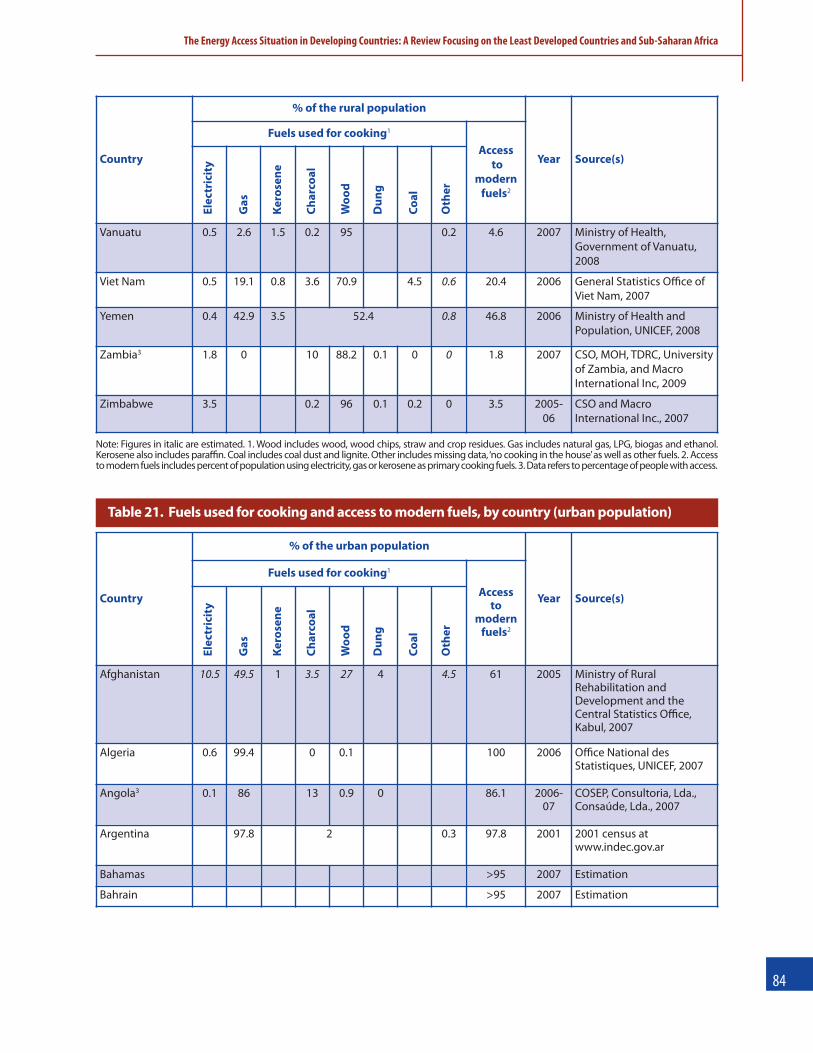
��
The Energy Access Situation in Developing Countries: A Review Focusing on the Least Developed Countries and Sub-Saharan Africa
Country
% of the rural population
Year Source(s)
Fuels used for cooking1
Accessto
modernfuels2
Vanuatu 0.5 2.6 1.5 0.2 95 0.2 4.6 2007 Ministry of Health,Government of Vanuatu,2008
Viet Nam 0.5 19.1 0.8 3.6 70.9 4.5 0.6 20.4 2006 General Statistics Office ofViet Nam, 2007
Yemen 0.4 42.9 3.5 52.4 0.8 46.8 2006 Ministry of Health andPopulation, UNICEF, 2008
Zambia3 1.8 0 10 88.2 0.1 0 0 1.8 2007 CSO, MOH, TDRC, Universityof Zambia, and MacroInternational Inc, 2009
Zimbabwe 3.5 0.2 96 0.1 0.2 0 3.5 2005-06
CSO and MacroInternational Inc., 2007
Note: Figures in italic are estimated. 1. Wood includes wood, wood chips, straw and crop residues. Gas includes natural gas, LPG, biogas and ethanol.Kerosene also includes paraffin. Coal includes coal dust and lignite. Other includes missing data, ‘no cooking in the house’ as well as other fuels. 2. Accessto modern fuels includes percent of population using electricity, gas or kerosene as primary cooking fuels. 3. Data refers to percentage of people with access.
Table 21. Fuels used for cooking and access to modern fuels, by country (urban population)
Country
% of the urban population
Year Source(s)
Fuels used for cooking1
Access to
modernfuels2
Afghanistan 10.5 49.5 1 3.5 27 4 4.5 61 2005 Ministry of RuralRehabilitation andDevelopment and theCentral Statistics Office,Kabul, 2007
Algeria 0.6 99.4 0 0.1 100 2006 Office National desStatistiques, UNICEF, 2007
Angola3 0.1 86 13 0.9 0 86.1 2006-07
COSEP, Consultoria, Lda.,Consaúde, Lda., 2007
Argentina 97.8 2 0.3 97.8 2001 2001 census atwww.indec.gov.ar
Bahamas >95 2007 Estimation
Bahrain >95 2007 Estimation
Elec
tric
ity
Oth
er
Coal
Woo
d
Dun
g
Char
coal
Kero
sene
Gas
Elec
tric
ity
Oth
er
Coal
Woo
d
Dun
g
Char
coal
Kero
sene
Gas

��
The Energy Access Situation in Developing Countries: A Review Focusing on the Least Developed Countries and Sub-Saharan Africa
Country
% of the urban population
Year Source(s)
Fuels used for cooking1
Access to
modernfuels2
Bangladesh3 0 37.4 58 3.7 0.9 37.4 2007 NIPORT, Mitra andAssociates, and MacroInternational, 2009
Barbados >95 2007 Estimation
Belize 1.3 92.5 0.9 0 2.1 3.2 94.7 2006 MICS and MDG Indicators,Belize, 2006
Benin 0.1 9 3.2 43 43.3 1.4 12.3 2006 INSAE, République duBénin, 2007
Bhutan 50.1 44.8 0 2.3 2.8 94.9 2007 National Statistics Bureau,Royal Government ofBhutan, 2007
Bolivia 1.1 88.8 0 6.5 0.1 3.5 89.8 2007 Instituto Nacional deEstadistica, 2009
Botswana 10.7 63 4.7 21.3 0 0 0.3 78.3 2006 Central Statistics Office,2009
Brazil 0.5 94.8 0 0.2 3 0 1.1 0.3 95.4 2003 WHO, 2003
Burkina Faso 0.5 24.5 0.4 13.7 59.6 0 1.3 25.4 2007 Ministère de l'Economie etdes Finances, InstitutNational de la Statistique etde la Démographie, 2007
Burundi 1.4 1 0 65.4 28.8 2.4 1 2.4 2005 ISTEEBU and UNICEF, 2008
Cambodia 0.6 30.2 0.1 25.4 43.6 0 0 0.1 30.9 2005 National Institute of PublicHealth, National Institute ofStatistics and ORC Macro,2006
Cameroon 0.2 30.6 9.1 2.4 53.2 4.5 39.9 2006 Ministère de l’Economie, Dela Planiycation et deL’Aménagement duTerritoire, Institut Nationalde la statistique, UNICEF,2007
Cape Verde 86 11.1 2.9 86 2006 Republic of Cape Verde,Ministry of Finance andPublic Administration, 2008
Central AfricanRepublic
0.8 0.2 0.1 4 94.4 0 0.1 0.4 1.1 2006 Institut Centrafricain desStatistiques, et des EtudesEconomiques et Sociales,2007
Chad 1.2 3.4 0.5 39.4 29.6 0 17.8 8.1 5.1 2003 WHO, 2003
Elec
tric
ity
Oth
er
Coal
Woo
d
Dun
g
Char
coal
Kero
sene
Gas

��
The Energy Access Situation in Developing Countries: A Review Focusing on the Least Developed Countries and Sub-Saharan Africa
Country
% of the urban population
Year Source(s)
Fuels used for cooking1
Access to
modernfuels2
China 14.8 49 0.5 0 4.3 27.7 3.6 64.3 2006 Carolina Population Center,National Institute ofNutrition and Food Safety,2008
Colombia 8.3 85.7 1 2.5 0.2 2.3 95 2005 Asociación Probienestar dela Familia ColombianaProfamilia, 2005
Comoros 0.3 1.9 51.3 0.2 42.2 0.3 3.8 53.4 2003 WHO, 2003
Congo 4.9 15.6 8.9 49.6 18.7 1.2 1.1 29.4 2005 CNSEE et ORC Macro, 2006
Congo DR3 10.8 0.2 52.2 36.6 0.2 11 2007 Ministère du Plan et MacroInternational, 2008
Costa Rica 67.7 28.7 2.6 1 96.4 2000 OrganizacionPanamericana de la Salud,Red Interamericana deCentros de Salud en laVivienda, 2001
Côte d’Ivoire 0.2 31.2 39 29.4 0.2 31.4 2006 Institut National de laStatistique, 2007
Djibouti 0.6 5.1 83.6 6.9 2.5 1.3 89.3 2006 Ministère de la Santé,République de Djibouti,2007
DominicanRepublic3
0 95 1.9 1.3 1.8 95 2007 CESDEM y MacroInternational Inc., 2008
Ecuador 0.5 98.8 0.8 0 99.2 2006 Instituto Nacional deEstatistica y Censos, 2006
Egypt 0.2 98.5 1 0 0 0 0 0.3 99.7 2005 El-Zanaty F. and Way A., 2006
El Salvador 1.5 86.3 0.1 7.8 0.1 4.3 87.8 2007 DIGESTYC, 2008
Eritrea 1.6 11.9 58.2 3 23.4 1.2 0.7 71.7 2002 NSEO and ORC Macro, 2003
Ethiopia 1 1.2 25.9 18.1 48.7 2.1 3.0 28.1 2005 Central Statistical Agencyand ORC Macro, 2006
Gabon 79.6 14.4 6 79.6 2006 World Bank, 2006
Gambia 0.1 7.8 0.3 21.7 62.4 0.1 7.6 8.2 2005-06
GBoS, 2007
Ghana3 1 22.1 0.6 56.6 18.3 1.4 23.7 2008 GSS, GHS, and ICF Macro,2009
Guatemala 1.2 67.9 0 0.1 30 0.1 0.8 69.1 2003 WHO, 2003
Guinea 1.1 0.3 0.2 33.8 0.8 59.6 4.2 1.6 2005 DNS et ORC Macro, 2006
Elec
tric
ity
Oth
er
Coal
Woo
d
Dun
g
Char
coal
Kero
sene
Gas

��
The Energy Access Situation in Developing Countries: A Review Focusing on the Least Developed Countries and Sub-Saharan Africa
Country
% of the urban population
Year Source(s)
Fuels used for cooking1
Access to
modernfuels2
Guinea-Bissau 3 0 74.2 21.8 1 3 2006 Ministère de l`Economie -Secrétariat d`Etat du Plan et à l`Intégration Régionale,2006
Guyana 3.6 64.3 29.9 0 1.4 0.2 0.6 97.8 2005 Ministry of HealthGeorgetown, Guyana, 2006
Haiti 0.1 6.6 6 76.5 10 0.3 0.5 12.7 2005-06
Cayemittes, M. et al., 2007
Honduras 33.6 32.6 10.4 20.1 0.1 3.2 76.6 2005-06
Secretaría de Salud, INE yMacro International, 2006
Hong Kong,China
>95 2007 Estimation
India 0.9 59.2 8.2 0.5 23.3 2.8 4.3 0.8 68.3 2005-06
IIPS and MacroInternational, 2007
Indonesia 0.4 21 55.2 0.2 22.3 0 0.9 76.6 2007 Statistics Indonesia (BadanPusat Statistik—BPS) andMacro International, 2008
Iran >95 2007 Estimation
Iraq 0.2 92.2 7 0.5 0 0 0.1 99.4 2006 Central Organization forStatistics & InformationTechnology, KurdistanRegional Statistics Office,2007
Jordan 0.2 99.6 0.1 0 0.1 99.9 2007 Department of Statistics and MacroInternational Inc., 2008
Kenya 1.8 12 44.6 30.2 10.3 1.1 58.4 2005-06
Kenya National Bureau ofStatistics, 2009
Korea (Rep.) 0.1 99.9 100 1998 UNESCAP, athttp://www.unescap.org/esd/energy/ publications/psec/tables/guidelines-table-112.jpg
Kuwait >95 2007 Estimation
Lao PDR 5 3.5 0 2.2 45.2 0 44 0.1 8.5 2006 Department of Statisticsand UNICEF, 2008
Lesotho 7 58.2 27.4 0 6.7 0.5 0 0.2 65.2 2004 MOHSW, BOS and ORCMacro, 2005
Liberia3 0 0.1 0 85.6 13.6 0.7 0.1 2007 LISGIS, et al., 2008
Libya >95 2007 Estimation
Madagascar 0.9 3 0.2 59.4 35.5 0.1 0.7 0.2 4.1 2004 INSTAT et ORC Macro, 2005
Malawi 7.2 0.1 0 41.4 51.2 0 0 0.1 7.3 2006 National Statistical Officeand UNICEF, 2008
Elec
tric
ity
Oth
er
Coal
Woo
d
Dun
g
Char
coal
Kero
sene
Gas

��
The Energy Access Situation in Developing Countries: A Review Focusing on the Least Developed Countries and Sub-Saharan Africa
Country
% of the urban population
Year Source(s)
Fuels used for cooking1
Access to
modernfuels2
Malaysia 0.7 96.4 0.3 0.1 0.1 2.4 97.4 2003 WHO, 2003
Mali3 0.1 0.7 37.6 59.9 1.1 0.6 0.8 2006 CPS/MS, DNSI/MEIC et MacroInternational Inc., 2007
Marshall Islands3 24.3 26.1 41 0 7.9 0.7 91.4 2007 EPPSO, SPC and MacroInternational Inc., 2008
Mauritania 2.2 60 30 7 0.8 62.2 2007 Office National de laStatistique and UNICEF,2008
Mauritius 0.3 94.6 1.1 1.3 2.6 96 2003 WHO, 2003
Mexico 0.6 95.5 0 0.1 3.4 0 0.2 0.3 96.1 2003 WHO, 2003
Mongolia 39.1 * 25.8 3.9 31.3* 39.1 2005 National Statistical Office,UNICEF, 2007, Mongolia
Morocco 0.1 99.1 0 0 0.4 0 0.4 99.2 2003-04
Measure DHS, Personalcommunication
Mozambique 2.1 4.9 1.6 1 49.3 0 40.8 0.3 8.6 2003 Instituto Nacional deEstatística, Ministério daSaúde, ORC Macro, 2005
Myanmar 10.3 1 0.3 50.5 34 0.1 3.8 11.6 2003 WHO, 2003
Namibia3 65.6 10.4 0.2 0.1 19.7 0 0 4.0 76.2 2006-07
MoHSS, Macro InternationalInc., 2008
Nauru3 81.8 4.1 5.2 8.3 0.6 91.1 2007 Nauru Bureau of Statistics,SPC and MacroInternational Inc., 2007
Nepal 0.4 43.6 15.8 0.1 36.4 2.5 0 1.2 59.8 2006 MOHP, New ERA, and MacroInternational Inc., 2007
Nicaragua 0.9 65.6 0.2 30.9 0.9 1.5 66.7 2006-07
INIDE, MINSA, 2008
Niger 0.6 3.4 10.4 84.9 0.5 0.2 4 2006 INS et Macro InternationalInc., 2007
Nigeria 0.7 2.4 54.6 5.2 35.9 0 0.2 1.0 57.7 2007 National Bureau ofStatistics, UNICEF, 2007
OccupiedPalestinianTerritories
0.5 99 0.5 0 99.5 2006 Palestinian Central Bureauof Statistics, 2007;Estimations
Oman >95 2007 Estimation
Pakistan3 0.2 76.1 0.1 20.8 2.4 0.4 76.3 2006-07
NIPS, and MacroInternational Inc., 2008
Paraguay 1.1 68.1 0 11.5 17.5 1.8 69.2 2007 Direccion General deEstadistica, 2007
Peru 1.2 74.2 9.8 8.7 0.5 1.9 3.7 85.2 2004-05
DHS 2004-2005, personalcommunication
Elec
tric
ity
Oth
er
Coal
Woo
d
Dun
g
Char
coal
Kero
sene
Gas

��
The Energy Access Situation in Developing Countries: A Review Focusing on the Least Developed Countries and Sub-Saharan Africa
Country
% of the urban population
Year Source(s)
Fuels used for cooking1
Access to
modernfuels2
Philippines 0.8 61.8 10.7 5.5 19.5 1.5 0.2 73.3 2003 WHO, 2003
Qatar 100 2005 MDGR, 2005
Rwanda 0.3 0.2 0.3 37 58.2 0 1.6 2.4 0.8 2005 INSR and ORC Macro, 2006
Saint Kitts andNevis
>95 2007 Estimation
Saudi Arabia >95 2007 Estimation
Senegal 0 74.4 8.3 12.2 0 5.1 74.4 2006 MIS, 2006, Personalcommunication
Seychelles >95 2007 Estimation
Sierra Leone 0 0.3 1.4 37.1 61 0 0.2 1.7 2007 Government of SierraLeone, 2007
Singapore >95 2007 Estimation
Solomon Islands3 1 39 0 49.5 8.8 0 1.5 0.2 40 2006-07
SISO, SPC and MacroInternational Inc., 2007
Somalia 0.2 0.1 0.3 79.1 20.1 0.2 0.6 2006 UNICEF, 2006
South Africa 76.9 4.2 5.1 0 1.5 0 2.1 10.2 86.2 2003 WHO, 2003
Sri Lanka 50.6 10.5 37.6 1.3 61.1 2006-07
Department of Census andStatistics, Ministry ofFinance and Planning SriLanka, 2008
Swaziland3 40 29.3 0.7 17.4 0.7 11.9 69.3 2006-07
CSO, and MacroInternational Inc., 2008
Syrian ArabRepublic
1.7 98.2 0.1 99.9 2006 Central Bureau of Statistics,UNICEF, 2007
Tanzania3 0.9 0.8 8.5 59.6 29.2 0 1.1 10.2 2007-08
TACAIDS, ZAC, NBS, OCGS, and MacroInternational Inc., 2008
Thailand 7.1 81.5 6.2 5.1 0 0.1 88.6 2005-06
Thailand National StatisticalOffice, 2006
Togo 0.3 2.6 1.2 81.8 13.4 0 0.7 4.1 2006 Direction Generale de laStatistique et de laComptabilité Nationale,2007
Tokelau
Tonga 4.5 84.3 1.8 0 9.4 0 0 90.6 2006 Tonga StatisticsDepartment, 2008
Elec
tric
ity
Oth
er
Coal
Woo
d
Dun
g
Char
coal
Kero
sene
Gas

��
The Energy Access Situation in Developing Countries: A Review Focusing on the Least Developed Countries and Sub-Saharan Africa
Note: Figures in italic are estimated. 1. Wood includes wood, wood chips, straw and crop residues. Gas includes natural gas, LPG, biogas andethanol. Kerosene also includes paraffin. Coal includes coal dust and lignite. Other includes missing data, ‘no cooking in the house’ as well asother fuels. 2. Access to modern fuels includes percent of population using electricity, gas or kerosene as primary cooking fuels. 3. Data refersto percentage of people with access.
Country
% of the urban population
Year Source(s)
Fuels used for cooking1
Access to
modernfuels2
Tunisia 99 1 99 2006 Ministère de la SantéPublique, Office National dela Famille et de laPopulation, UNICEF, 2008
Uganda3 0.1 0.8 1.7 66 28.3 3.1 2.6 2006 UBOS and MacroInternational Inc, 2007
United ArabEmirates
5.2 94 0 0.9 99.2 2003 WHO, 2003
Uruguay 4.9 90.6 1.3 3 0.2 96.8 2006 Instituto Nacional deEstadistica Uruguay, 2006
Vanuatu 2.1 43.8 1.1 1.6 50.6 0.8 47 2007 Ministry of Health,Government of Vanuatu,2008
Viet Nam 0.2 70.7 2.7 3.3 15.8 7.3 0 73.6 2006 General Statistics Office ofViet Nam, 2007
Yemen 1 93.5 3.3 1 1.2 97.8 2006 Ministry of Health andPopulation, UNICEF 2008
Zambia3 41.2 0 0 50.7 7.5 0 0.5 0.1 41.2 2007 CSO, MOH, TDRC, Universityof Zambia, and MacroInternational Inc., 2009
Zimbabwe 87.9 0.6 11.3 0.2 88.5 2005-06
CSO and MacroInternational Inc., 2007
Table 22. Use of improved cooking stoves, by country
Country
% of population relying on solid fuels forcooking that use improved cooking stoves2
Source(s)
National Rural Urban Year
Bangladesh3 2.1 2.3 1.4 2007 Bangladesh Bureau of Statistics, UNICEF, 2007
Belize 8.3 6.8 2006 MICS and MDG Indicators, Belize, 2006
Brazil 53.5 64.9 47.1 2003 WHO, Household energy database
Burkina Faso 2.1 1.1 8.1 2003 WHO, Household energy database
Burundi 0.1 1.6 1.5 2005 ISTEEBU and UNICEF, 2008
Cambodia 6.7 2007 GERES, 2008 (author’s calculation based on)
Elec
tric
ity
Oth
er
Coal
Woo
d
Dun
g
Char
coal
Kero
sene
Gas
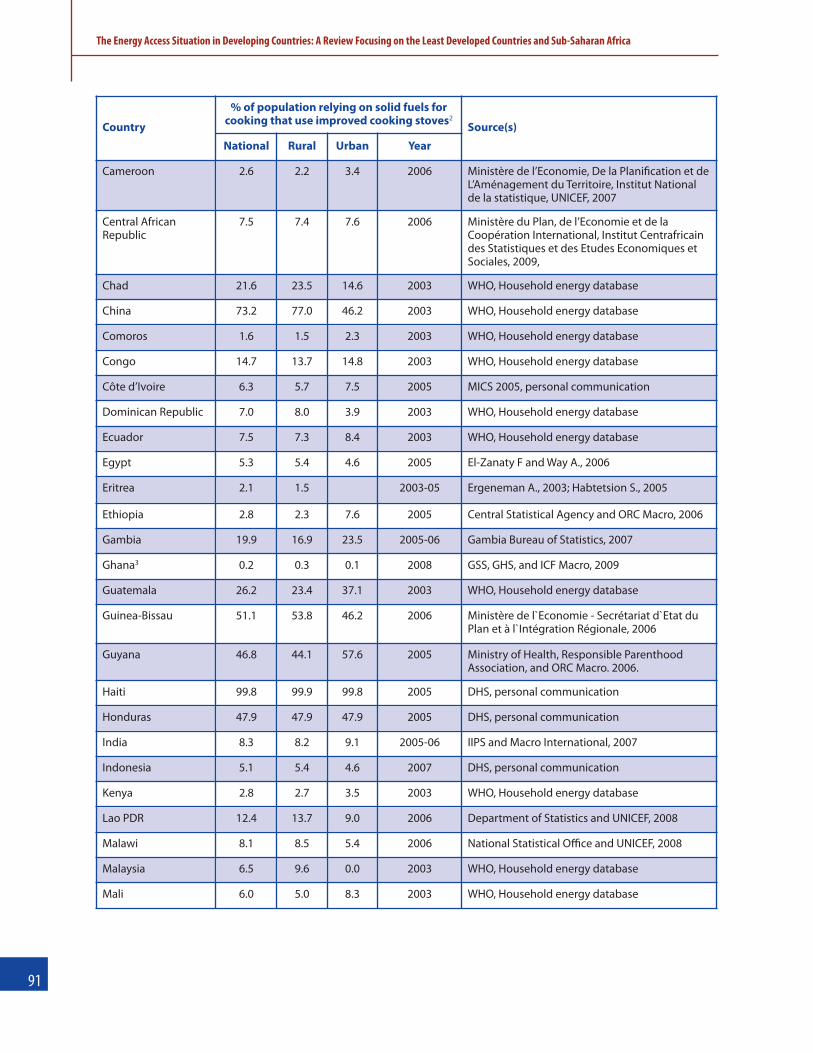
��
The Energy Access Situation in Developing Countries: A Review Focusing on the Least Developed Countries and Sub-Saharan Africa
Country
% of population relying on solid fuels forcooking that use improved cooking stoves2
Source(s)
National Rural Urban Year
Cameroon 2.6 2.2 3.4 2006 Ministère de l’Economie, De la Planiycation et deL’Aménagement du Territoire, Institut Nationalde la statistique, UNICEF, 2007
Central AfricanRepublic
7.5 7.4 7.6 2006 Ministère du Plan, de l’Economie et de laCoopération International, Institut Centrafricaindes Statistiques et des Etudes Economiques etSociales, 2009,
Chad 21.6 23.5 14.6 2003 WHO, Household energy database
China 73.2 77.0 46.2 2003 WHO, Household energy database
Comoros 1.6 1.5 2.3 2003 WHO, Household energy database
Congo 14.7 13.7 14.8 2003 WHO, Household energy database
Côte d’Ivoire 6.3 5.7 7.5 2005 MICS 2005, personal communication
Dominican Republic 7.0 8.0 3.9 2003 WHO, Household energy database
Ecuador 7.5 7.3 8.4 2003 WHO, Household energy database
Egypt 5.3 5.4 4.6 2005 El-Zanaty F and Way A., 2006
Eritrea 2.1 1.5 2003-05 Ergeneman A., 2003; Habtetsion S., 2005
Ethiopia 2.8 2.3 7.6 2005 Central Statistical Agency and ORC Macro, 2006
Gambia 19.9 16.9 23.5 2005-06 Gambia Bureau of Statistics, 2007
Ghana3 0.2 0.3 0.1 2008 GSS, GHS, and ICF Macro, 2009
Guatemala 26.2 23.4 37.1 2003 WHO, Household energy database
Guinea-Bissau 51.1 53.8 46.2 2006 Ministère de l`Economie - Secrétariat d`Etat duPlan et à l`Intégration Régionale, 2006
Guyana 46.8 44.1 57.6 2005 Ministry of Health, Responsible ParenthoodAssociation, and ORC Macro. 2006.
Haiti 99.8 99.9 99.8 2005 DHS, personal communication
Honduras 47.9 47.9 47.9 2005 DHS, personal communication
India 8.3 8.2 9.1 2005-06 IIPS and Macro International, 2007
Indonesia 5.1 5.4 4.6 2007 DHS, personal communication
Kenya 2.8 2.7 3.5 2003 WHO, Household energy database
Lao PDR 12.4 13.7 9.0 2006 Department of Statistics and UNICEF, 2008
Malawi 8.1 8.5 5.4 2006 National Statistical Office and UNICEF, 2008
Malaysia 6.5 9.6 0.0 2003 WHO, Household energy database
Mali 6.0 5.0 8.3 2003 WHO, Household energy database
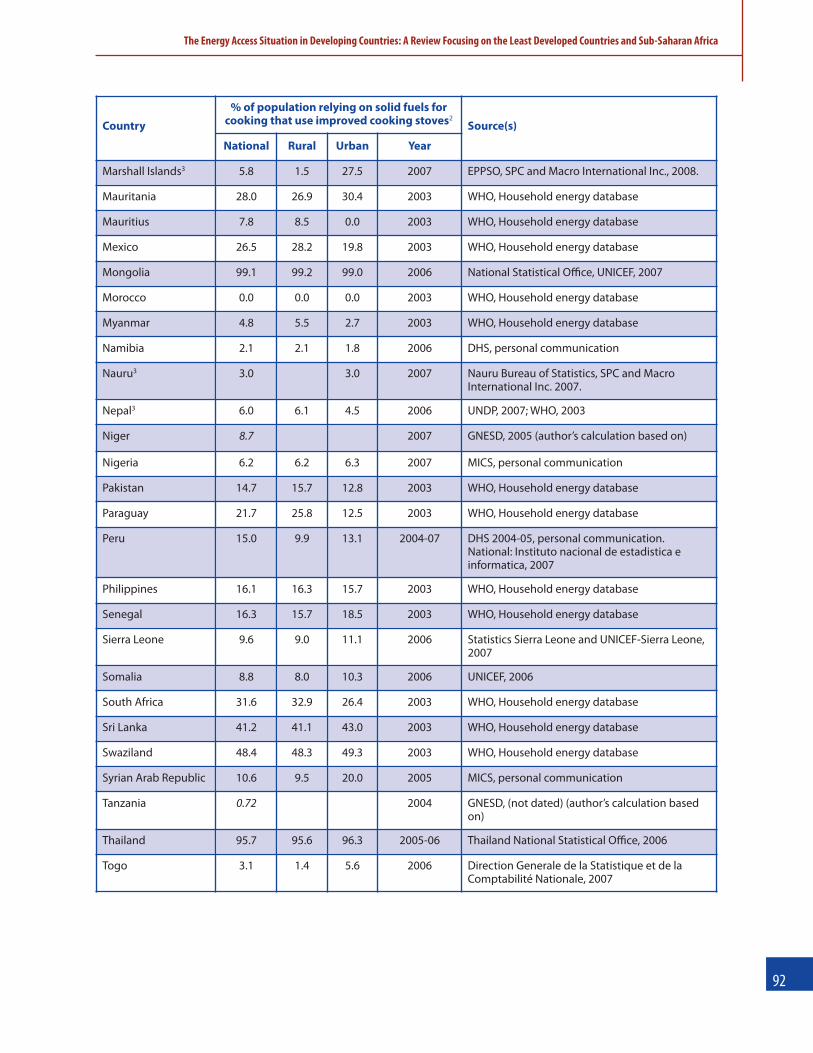
��
The Energy Access Situation in Developing Countries: A Review Focusing on the Least Developed Countries and Sub-Saharan Africa
Country
% of population relying on solid fuels forcooking that use improved cooking stoves2
Source(s)
National Rural Urban Year
Marshall Islands3 5.8 1.5 27.5 2007 EPPSO, SPC and Macro International Inc., 2008.
Mauritania 28.0 26.9 30.4 2003 WHO, Household energy database
Mauritius 7.8 8.5 0.0 2003 WHO, Household energy database
Mexico 26.5 28.2 19.8 2003 WHO, Household energy database
Mongolia 99.1 99.2 99.0 2006 National Statistical Office, UNICEF, 2007
Morocco 0.0 0.0 0.0 2003 WHO, Household energy database
Myanmar 4.8 5.5 2.7 2003 WHO, Household energy database
Namibia 2.1 2.1 1.8 2006 DHS, personal communication
Nauru3 3.0 3.0 2007 Nauru Bureau of Statistics, SPC and MacroInternational Inc. 2007.
Nepal3 6.0 6.1 4.5 2006 UNDP, 2007; WHO, 2003
Niger 8.7 2007 GNESD, 2005 (author’s calculation based on)
Nigeria 6.2 6.2 6.3 2007 MICS, personal communication
Pakistan 14.7 15.7 12.8 2003 WHO, Household energy database
Paraguay 21.7 25.8 12.5 2003 WHO, Household energy database
Peru 15.0 9.9 13.1 2004-07 DHS 2004-05, personal communication.National: Instituto nacional de estadistica einformatica, 2007
Philippines 16.1 16.3 15.7 2003 WHO, Household energy database
Senegal 16.3 15.7 18.5 2003 WHO, Household energy database
Sierra Leone 9.6 9.0 11.1 2006 Statistics Sierra Leone and UNICEF-Sierra Leone,2007
Somalia 8.8 8.0 10.3 2006 UNICEF, 2006
South Africa 31.6 32.9 26.4 2003 WHO, Household energy database
Sri Lanka 41.2 41.1 43.0 2003 WHO, Household energy database
Swaziland 48.4 48.3 49.3 2003 WHO, Household energy database
Syrian Arab Republic 10.6 9.5 20.0 2005 MICS, personal communication
Tanzania 0.72 2004 GNESD, (not dated) (author’s calculation basedon)
Thailand 95.7 95.6 96.3 2005-06 Thailand National Statistical Office, 2006
Togo 3.1 1.4 5.6 2006 Direction Generale de la Statistique et de laComptabilité Nationale, 2007

��
The Energy Access Situation in Developing Countries: A Review Focusing on the Least Developed Countries and Sub-Saharan Africa
Country
% of population relying on solid fuels forcooking that use improved cooking stoves2
Source(s)
National Rural Urban Year
Tunisia 15.2 17.0 12.2 2003 WHO, Household energy database
Uganda3 5.3 5.3 5.8 2006 UBOS and Macro International Inc., 2007
United Arab Emirates 0.0 0.0 0.0 2003 WHO, Household energy database
Uruguay 74.7 90.4 51.1 2003 WHO, Household energy database
Vanuatu 6.1 6.0 6.4 2007 Ministry of Health, Government of Vanuatu, 2008
Viet Nam 22.0 21.0 31.1 2006 General Statistics Office of Viet Nam, 2007
Zambia3 0.40 0.3 0.7 2007 CSO, MOH, TDRC, University of Zambia, andMacro International Inc., 2009
Zimbabwe 3.1 2.9 6.2 2005-06 CSO and Macro International Inc, 2007
Note: 1. Figures in italic are estimated. See Section II for details. Dates in italics are presumed based on available information. 2. Improvedcooking stoves refer to closed stoves with chimney, as well as open stoves or yre with chimney of hood, but exclude open stoves or yre with nochimney or hood. Stoves for the use of electricity, liquid or gaseous fuels are not included. 3. Data refers to percentage of people with access.
Country
% of population with access to mechanical power
Source(s)National Year Rural Year Urban Year
Benin 0 2005 République du Bénin, Ministère duDéveloppement de l'Economie et desFinances, Ministère de l'Energie, des Mines etde l'Eau, 2006
Central AfricanRepublic
0 2000 MDGR, 2004
Mali 10 2004 ECOWAS, UEMOA, 2006
Table 23. Access to mechanical power, by country
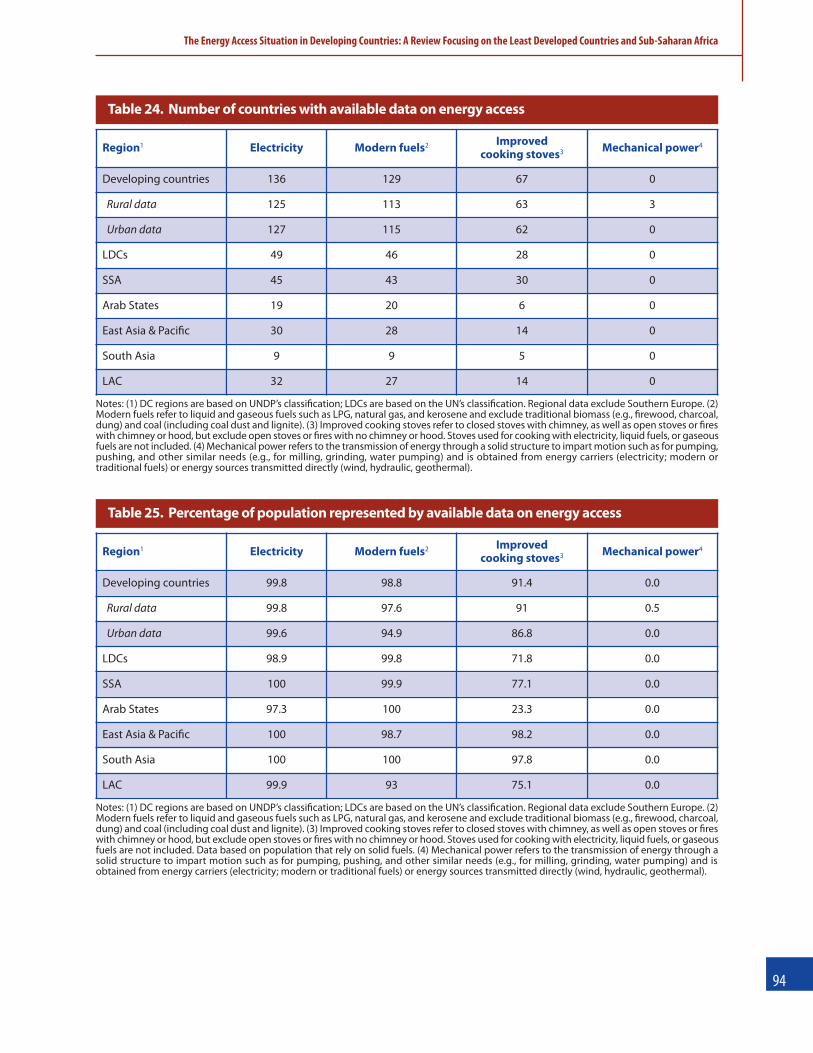
��
The Energy Access Situation in Developing Countries: A Review Focusing on the Least Developed Countries and Sub-Saharan Africa
Notes: (1) DC regions are based on UNDP’s classiycation; LDCs are based on the UN’s classiycation. Regional data exclude Southern Europe. (2)Modern fuels refer to liquid and gaseous fuels such as LPG, natural gas, and kerosene and exclude traditional biomass (e.g., yrewood, charcoal,dung) and coal (including coal dust and lignite). (3) Improved cooking stoves refer to closed stoves with chimney, as well as open stoves or yreswith chimney or hood, but exclude open stoves or yres with no chimney or hood. Stoves used for cooking with electricity, liquid fuels, or gaseousfuels are not included. (4) Mechanical power refers to the transmission of energy through a solid structure to impart motion such as for pumping,pushing, and other similar needs (e.g., for milling, grinding, water pumping) and is obtained from energy carriers (electricity; modern ortraditional fuels) or energy sources transmitted directly (wind, hydraulic, geothermal).
Table 24. Number of countries with available data on energy access
Region1 Electricity Modern fuels2 Improved cooking stoves3 Mechanical power4
Developing countries 136 129 67 0
Rural data 125 113 63 3
Urban data 127 115 62 0
LDCs 49 46 28 0
SSA 45 43 30 0
Arab States 19 20 6 0
East Asia & Paciyc 30 28 14 0
South Asia 9 9 5 0
LAC 32 27 14 0
Notes: (1) DC regions are based on UNDP’s classiycation; LDCs are based on the UN’s classiycation. Regional data exclude Southern Europe. (2)Modern fuels refer to liquid and gaseous fuels such as LPG, natural gas, and kerosene and exclude traditional biomass (e.g., yrewood, charcoal,dung) and coal (including coal dust and lignite). (3) Improved cooking stoves refer to closed stoves with chimney, as well as open stoves or yreswith chimney or hood, but exclude open stoves or yres with no chimney or hood. Stoves used for cooking with electricity, liquid fuels, or gaseousfuels are not included. Data based on population that rely on solid fuels. (4) Mechanical power refers to the transmission of energy through asolid structure to impart motion such as for pumping, pushing, and other similar needs (e.g., for milling, grinding, water pumping) and isobtained from energy carriers (electricity; modern or traditional fuels) or energy sources transmitted directly (wind, hydraulic, geothermal).
Table 25. Percentage of population represented by available data on energy access
Region1 Electricity Modern fuels2 Improved cooking stoves3 Mechanical power4
Developing countries 99.8 98.8 91.4 0.0
Rural data 99.8 97.6 91 0.5
Urban data 99.6 94.9 86.8 0.0
LDCs 98.9 99.8 71.8 0.0
SSA 100 99.9 77.1 0.0
Arab States 97.3 100 23.3 0.0
East Asia & Paciyc 100 98.7 98.2 0.0
South Asia 100 100 97.8 0.0
LAC 99.9 93 75.1 0.0
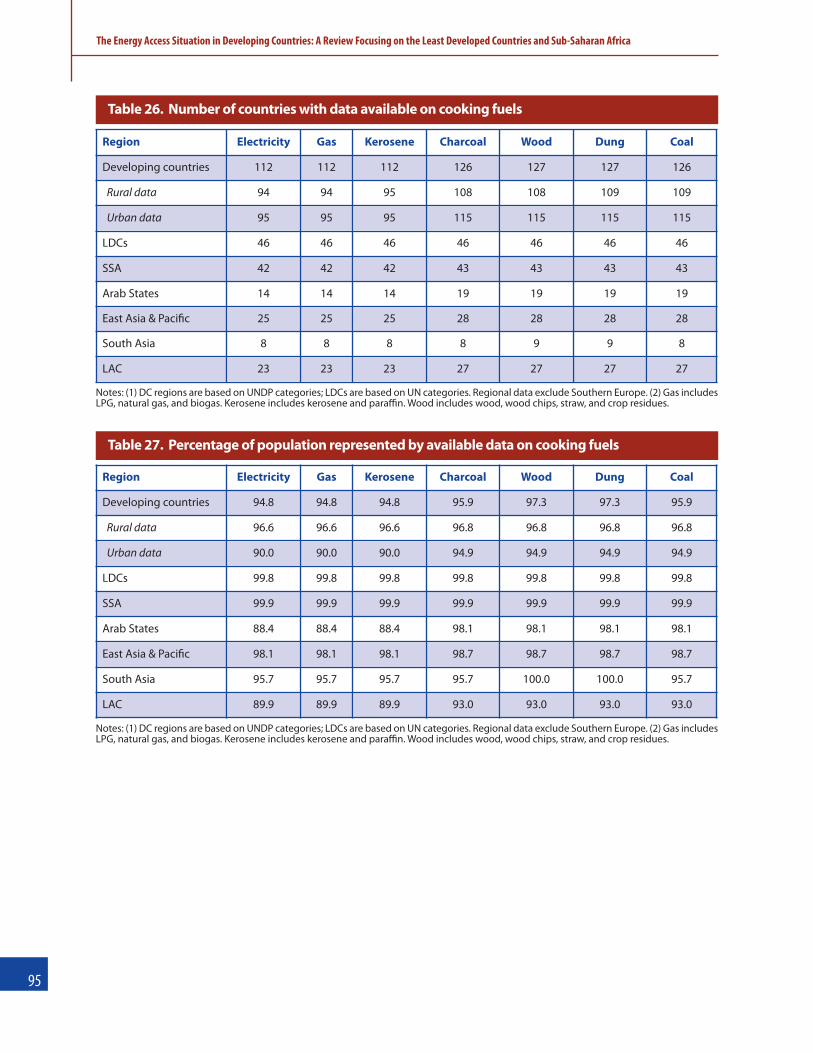
��
The Energy Access Situation in Developing Countries: A Review Focusing on the Least Developed Countries and Sub-Saharan Africa
Notes: (1) DC regions are based on UNDP categories; LDCs are based on UN categories. Regional data exclude Southern Europe. (2) Gas includesLPG, natural gas, and biogas. Kerosene includes kerosene and paraffin. Wood includes wood, wood chips, straw, and crop residues.
Table 26. Number of countries with data available on cooking fuels
Region Electricity Gas Kerosene Charcoal Wood Dung Coal
Developing countries 112 112 112 126 127 127 126
Rural data 94 94 95 108 108 109 109
Urban data 95 95 95 115 115 115 115
LDCs 46 46 46 46 46 46 46
SSA 42 42 42 43 43 43 43
Arab States 14 14 14 19 19 19 19
East Asia & Paciyc 25 25 25 28 28 28 28
South Asia 8 8 8 8 9 9 8
LAC 23 23 23 27 27 27 27
Notes: (1) DC regions are based on UNDP categories; LDCs are based on UN categories. Regional data exclude Southern Europe. (2) Gas includesLPG, natural gas, and biogas. Kerosene includes kerosene and paraffin. Wood includes wood, wood chips, straw, and crop residues.
Table 27. Percentage of population represented by available data on cooking fuels
Region Electricity Gas Kerosene Charcoal Wood Dung Coal
Developing countries 94.8 94.8 94.8 95.9 97.3 97.3 95.9
Rural data 96.6 96.6 96.6 96.8 96.8 96.8 96.8
Urban data 90.0 90.0 90.0 94.9 94.9 94.9 94.9
LDCs 99.8 99.8 99.8 99.8 99.8 99.8 99.8
SSA 99.9 99.9 99.9 99.9 99.9 99.9 99.9
Arab States 88.4 88.4 88.4 98.1 98.1 98.1 98.1
East Asia & Paciyc 98.1 98.1 98.1 98.7 98.7 98.7 98.7
South Asia 95.7 95.7 95.7 95.7 100.0 100.0 95.7
LAC 89.9 89.9 89.9 93.0 93.0 93.0 93.0
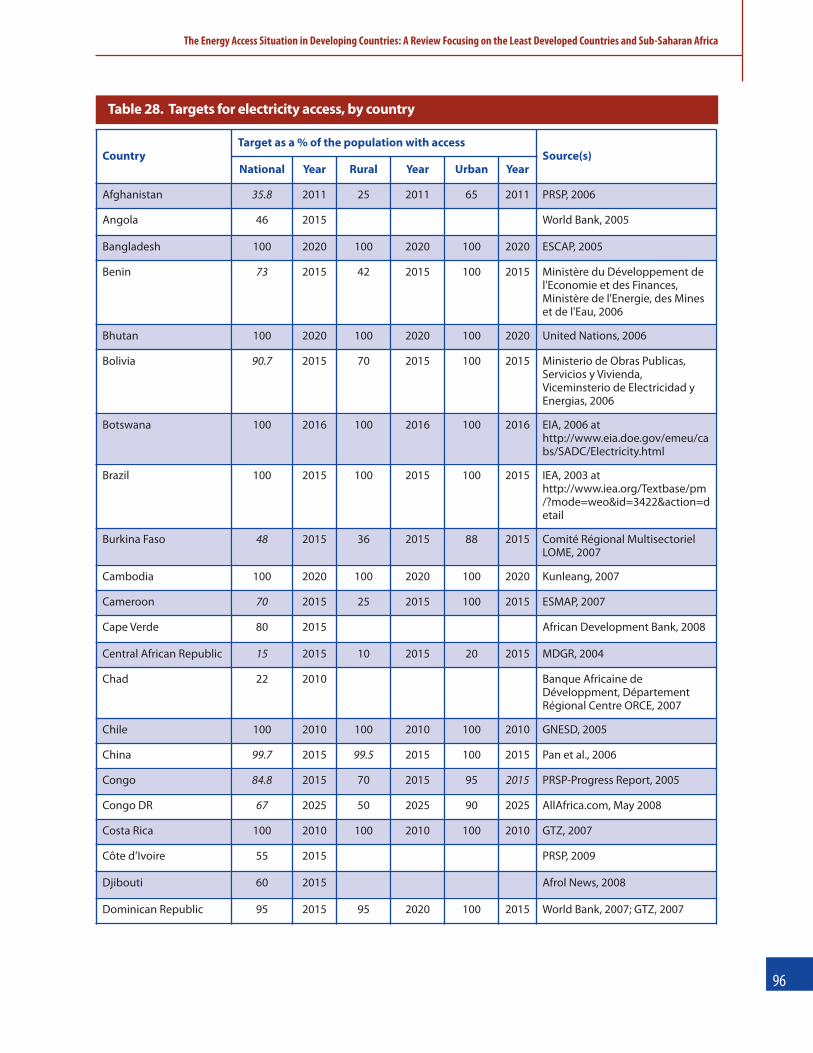
��
The Energy Access Situation in Developing Countries: A Review Focusing on the Least Developed Countries and Sub-Saharan Africa
Table 28. Targets for electricity access, by country
CountryTarget as a % of the population with access
Source(s)National Year Rural Year Urban Year
Afghanistan 35.8 2011 25 2011 65 2011 PRSP, 2006
Angola 46 2015 World Bank, 2005
Bangladesh 100 2020 100 2020 100 2020 ESCAP, 2005
Benin 73 2015 42 2015 100 2015 Ministère du Développement del'Economie et des Finances,Ministère de l'Energie, des Mineset de l'Eau, 2006
Bhutan 100 2020 100 2020 100 2020 United Nations, 2006
Bolivia 90.7 2015 70 2015 100 2015 Ministerio de Obras Publicas,Servicios y Vivienda,Viceminsterio de Electricidad yEnergias, 2006
Botswana 100 2016 100 2016 100 2016 EIA, 2006 athttp://www.eia.doe.gov/emeu/cabs/SADC/Electricity.html
Brazil 100 2015 100 2015 100 2015 IEA, 2003 athttp://www.iea.org/Textbase/pm/?mode=weo&id=3422&action=detail
Burkina Faso 48 2015 36 2015 88 2015 Comité Régional MultisectorielLOME, 2007
Cambodia 100 2020 100 2020 100 2020 Kunleang, 2007
Cameroon 70 2015 25 2015 100 2015 ESMAP, 2007
Cape Verde 80 2015 African Development Bank, 2008
Central African Republic 15 2015 10 2015 20 2015 MDGR, 2004
Chad 22 2010 Banque Africaine deDéveloppment, DépartementRégional Centre ORCE, 2007
Chile 100 2010 100 2010 100 2010 GNESD, 2005
China 99.7 2015 99.5 2015 100 2015 Pan et al., 2006
Congo 84.8 2015 70 2015 95 2015 PRSP-Progress Report, 2005
Congo DR 67 2025 50 2025 90 2025 AllAfrica.com, May 2008
Costa Rica 100 2010 100 2010 100 2010 GTZ, 2007
Côte d’Ivoire 55 2015 PRSP, 2009
Djibouti 60 2015 Afrol News, 2008
Dominican Republic 95 2015 95 2020 100 2015 World Bank, 2007; GTZ, 2007

��
The Energy Access Situation in Developing Countries: A Review Focusing on the Least Developed Countries and Sub-Saharan Africa
CountryTarget as a % of the population with access
Source(s)National Year Rural Year Urban Year
Ecuador 98.7 2015 92 2012 100 2015 Consejo Nacional de Electricidad,2007
El Salvador 93 2009 World Bank, 2006
Eritrea 85.3 2015 80 2015 100 2015 Habtetsion, 2005
Ethiopia 20 2012 Afrol News, 2008
Gambia 50 2011 19 2016 PRSP, 2008; Kite, 2005
Ghana 100 2020 100 2020 100 2020 Ghana Energy Commission, 2006
Guatemala 90 2010 Ministerio de Energía y Minas,2007
Guinea 65 2015 40 2015 100 2015 UNDP, 2006
Haiti 50 2017 Bureau of Mines and Energy,Electricity of Haiti, 2006
Honduras 80 2015 PRSP, 2005
India 100 2012 100 2012 100 2012 Ailawadi and Bhattacharyya,2006
Indonesia 90 2020 95 2025 100 2020 Hutapea, 2008
Jamaica 100 2020 100 2020 100 2020 Jamaica Cabinet Office
Kenya 40 2020 PRSP, 2005
Kiribati 75 2015 Solar Energy Company, 2004
Lao PDR 90 2020 70 2020 100 2020 ADB, 2006
Lesotho 35 2020 Department of Energy/RuralElectriycation Unit, 2007
Liberia 10 2011 2 2011 17.5 2011 PRSP, 2008
Madagascar 28.3 2011 10 2011 74 2011 Gouvernement de Madagascar,2006
Malawi 30 2020 10 2011 PRSP, 2007
Malaysia 98.4 2010 95.1 2010 100 2015 Economic Planning Unit, PrimeMinister’s Department
Mali 20.09 2011 8 2011 100 2015 PRSP, 2008
Mauritania 64.8 2015 12 2010 80 2015 Ministre du Pétrole et de l'Énergie(interview sur jeuneafrique.come)
Mongolia 100 2020 100 2020 100 2020 Ministry of Nature andEnvironment of Mongolia

��
The Energy Access Situation in Developing Countries: A Review Focusing on the Least Developed Countries and Sub-Saharan Africa
CountryTarget as a % of the population with access
Source(s)National Year Rural Year Urban Year
Mozambique 20 2020 Fond Africain de Development,2006
Namibia 50 2010 25 2010 95 2010 EMCON, 2008
Nepal 100 2027 100 2027 100 2027 Government of Nepal NationalPlanning Commission, 2007
Nicaragua 90 2013 National Energy Commission
Niger 15 2012 3 2012 46 2012 PRSP, 2007
Nigeria 60 2015 75 2020 Sambo; Lagos, 2007
Panama 95 2012 87 2012 100 2012 SESEM – CFT, 2005
Peru 91 2012 75 2012 95.7 2012 SESEM – CFT, 2005; World Bank,2006
Philippines 90 2017 66.5 2017 100 2017 Philippines Department ofEnergy
Rwanda 35 2020 30 2020 UNEP, 2006
Senegal 66 2015 30 2015 92.2 2015 PRSP, 2007
Sierra Leone 35 2015 Kite, 2005
South Africa 100 2012 100 2012 100 2012 Winkler and Marquard, 2007
Sri Lanka 96 2016 70 2007 Ferdinando, 2007; ADB
Swaziland 100 2022 100 2022 100 2022 Swaziland Government, 2004
Tanzania 25 2010 15 2015 60.5 2015 Tanzania Electric SupplyCompany Limited, 2007; PRSP,2005
Timor-Leste 80 2025 ADB, 2004
Togo 66 2015 40 2015 100 2015 UNDP, 2007
Tunisia 100 2010 100 2010 100 2010 UNDP, World Bank, 2005
Uganda 23 2010 10 2012 Ministry of Energy and MineralDevelopment, 2001
Viet Nam 100 2020 Vu Van Thai, 2006
Zambia 41.8 2016 15 2016 78 2016 Sibanda, 2006
Note: Figures in italic are estimated. See Section II for details. Dates in italics are presumed based on available information.
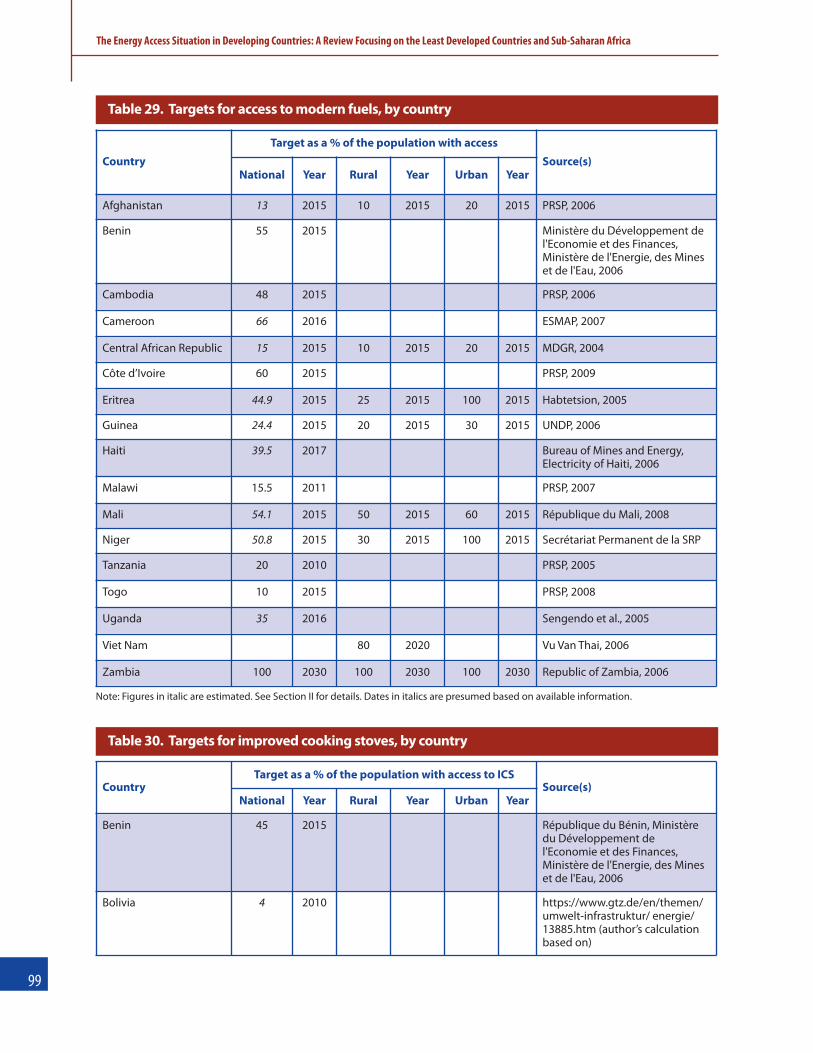
��
The Energy Access Situation in Developing Countries: A Review Focusing on the Least Developed Countries and Sub-Saharan Africa
Table 29. Targets for access to modern fuels, by country
Country
Target as a % of the population with access
Source(s)National Year Rural Year Urban Year
Afghanistan 13 2015 10 2015 20 2015 PRSP, 2006
Benin 55 2015 Ministère du Développement del'Economie et des Finances,Ministère de l'Energie, des Mineset de l'Eau, 2006
Cambodia 48 2015 PRSP, 2006
Cameroon 66 2016 ESMAP, 2007
Central African Republic 15 2015 10 2015 20 2015 MDGR, 2004
Côte d’Ivoire 60 2015 PRSP, 2009
Eritrea 44.9 2015 25 2015 100 2015 Habtetsion, 2005
Guinea 24.4 2015 20 2015 30 2015 UNDP, 2006
Haiti 39.5 2017 Bureau of Mines and Energy,Electricity of Haiti, 2006
Malawi 15.5 2011 PRSP, 2007
Mali 54.1 2015 50 2015 60 2015 République du Mali, 2008
Niger 50.8 2015 30 2015 100 2015 Secrétariat Permanent de la SRP
Tanzania 20 2010 PRSP, 2005
Togo 10 2015 PRSP, 2008
Uganda 35 2016 Sengendo et al., 2005
Viet Nam 80 2020 Vu Van Thai, 2006
Zambia 100 2030 100 2030 100 2030 Republic of Zambia, 2006
Note: Figures in italic are estimated. See Section II for details. Dates in italics are presumed based on available information.
Table 30. Targets for improved cooking stoves, by country
CountryTarget as a % of the population with access to ICS
Source(s)National Year Rural Year Urban Year
Benin 45 2015 République du Bénin, Ministèredu Développement del'Economie et des Finances,Ministère de l'Energie, des Mineset de l'Eau, 2006
Bolivia 4 2010 https://www.gtz.de/en/themen/umwelt-infrastruktur/ energie/13885.htm (author’s calculationbased on)
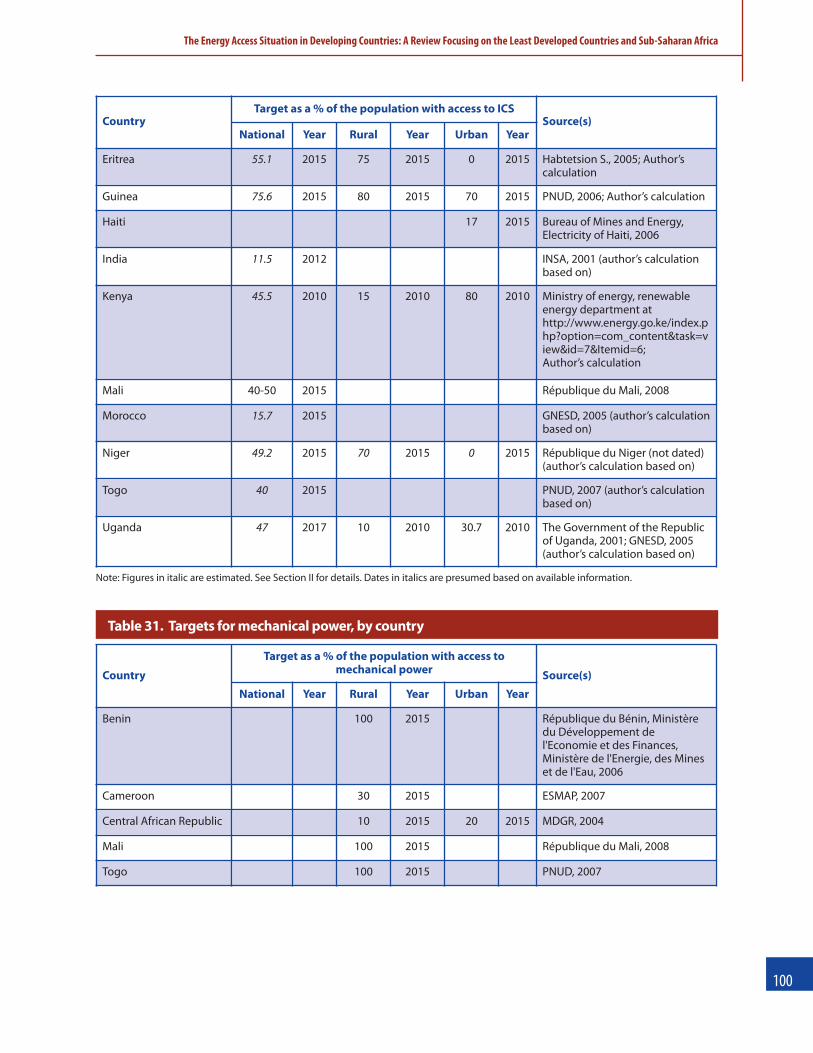
���
The Energy Access Situation in Developing Countries: A Review Focusing on the Least Developed Countries and Sub-Saharan Africa
CountryTarget as a % of the population with access to ICS
Source(s)National Year Rural Year Urban Year
Eritrea 55.1 2015 75 2015 0 2015 Habtetsion S., 2005; Author’scalculation
Guinea 75.6 2015 80 2015 70 2015 PNUD, 2006; Author’s calculation
Haiti 17 2015 Bureau of Mines and Energy,Electricity of Haiti, 2006
India 11.5 2012 INSA, 2001 (author’s calculationbased on)
Kenya 45.5 2010 15 2010 80 2010 Ministry of energy, renewableenergy department athttp://www.energy.go.ke/index.php?option=com_content&task=view&id=7&Itemid=6;Author’s calculation
Mali 40-50 2015 République du Mali, 2008
Morocco 15.7 2015 GNESD, 2005 (author’s calculationbased on)
Niger 49.2 2015 70 2015 0 2015 République du Niger (not dated)(author’s calculation based on)
Togo 40 2015 PNUD, 2007 (author’s calculationbased on)
Uganda 47 2017 10 2010 30.7 2010 The Government of the Republicof Uganda, 2001; GNESD, 2005(author’s calculation based on)
Table 31. Targets for mechanical power, by country
Country
Target as a % of the population with access tomechanical power Source(s)
National Year Rural Year Urban Year
Benin 100 2015 République du Bénin, Ministèredu Développement del'Economie et des Finances,Ministère de l'Energie, des Mineset de l'Eau, 2006
Cameroon 30 2015 ESMAP, 2007
Central African Republic 10 2015 20 2015 MDGR, 2004
Mali 100 2015 République du Mali, 2008
Togo 100 2015 PNUD, 2007
Note: Figures in italic are estimated. See Section II for details. Dates in italics are presumed based on available information.
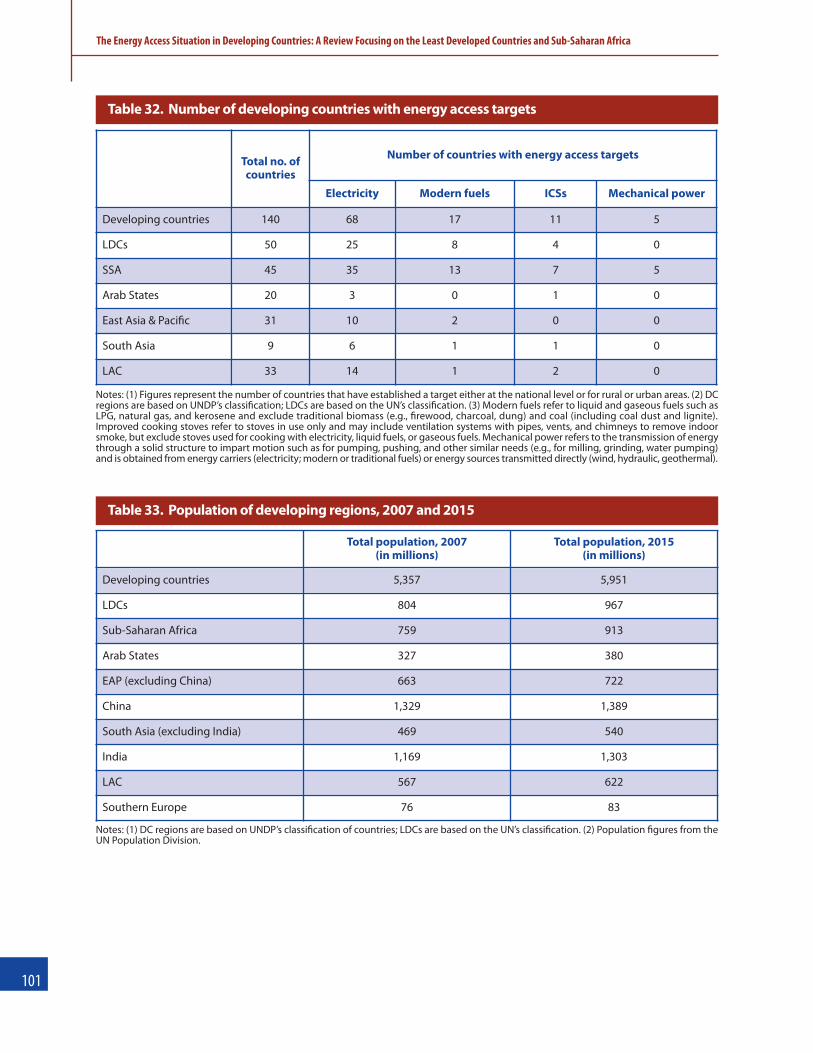
���
The Energy Access Situation in Developing Countries: A Review Focusing on the Least Developed Countries and Sub-Saharan Africa
Total no. ofcountries
Number of countries with energy access targets
Electricity Modern fuels ICSs Mechanical power
Developing countries 140 68 17 11 5
LDCs 50 25 8 4 0
SSA 45 35 13 7 5
Arab States 20 3 0 1 0
East Asia & Paciyc 31 10 2 0 0
South Asia 9 6 1 1 0
LAC 33 14 1 2 0
Table 32. Number of developing countries with energy access targets
Notes: (1) Figures represent the number of countries that have established a target either at the national level or for rural or urban areas. (2) DCregions are based on UNDP’s classiycation; LDCs are based on the UN’s classiycation. (3) Modern fuels refer to liquid and gaseous fuels such asLPG, natural gas, and kerosene and exclude traditional biomass (e.g., yrewood, charcoal, dung) and coal (including coal dust and lignite).Improved cooking stoves refer to stoves in use only and may include ventilation systems with pipes, vents, and chimneys to remove indoorsmoke, but exclude stoves used for cooking with electricity, liquid fuels, or gaseous fuels. Mechanical power refers to the transmission of energythrough a solid structure to impart motion such as for pumping, pushing, and other similar needs (e.g., for milling, grinding, water pumping)and is obtained from energy carriers (electricity; modern or traditional fuels) or energy sources transmitted directly (wind, hydraulic, geothermal).
Table 33. Population of developing regions, 2007 and 2015
Notes: (1) DC regions are based on UNDP’s classiycation of countries; LDCs are based on the UN’s classiycation. (2) Population ygures from theUN Population Division.
Total population, 2007(in millions)
Total population, 2015(in millions)
Developing countries 5,357 5,951
LDCs 804 967
Sub-Saharan Africa 759 913
Arab States 327 380
EAP (excluding China) 663 722
China 1,329 1,389
South Asia (excluding India) 469 540
India 1,169 1,303
LAC 567 622
Southern Europe 76 83
General
ADB. 2007. Key Indicators 2007, Volume 38.
Barnes, D.F., K. Openshaw, K.R. Smith, and R. van der Plas. 1994. ‘What Makes People Cook with ImprovedBiomass Stoves? A Comparative International Review of Stove Programs.’ World Bank Technical PaperNo 242, Energy Series.
Clarke and Wallsten. 2002. Universal(ly Bad) Service: Providing Infrastructure Services to Rural and PoorUrban Consumers.
Desai, M.A., S.Mehta, and K.R. Smith. 2004. Indoor smoke from solid fuels: Assessing the environmentalburden of disease at national and local levels. WHO Environmental Burden of Disease Series, No. 4.Geneva: World Health Organization.
ESMAP. 2003. Household Energy Use in Developing Countries: A Multicountry Study. Report 27588.
Geoghegan T., S. Anderson, and B. Dixon. 2008. Opportunities to achieve poverty reduction and climatechange beneyts through low carbon energy access programmes, A review of the portfolio of theAshden Awards for Sustainable Energy, for the Department for International Development.
GNESD. (not dated). Poverty Reduction: Can Renewable Energy Make a Real Contribution?
GNESD. 2007. Reaching the Millennium Development Goals and beyond: Access to modern forms ofenergy as a prerequisite.
Gordon, B., R. Mackay, and E. Rehfuess. 2004. Inheriting the World: The Atlas of Children’s Health and theEnvironment. WHO: Geneva, Switzerland.
GTZ. 2007. Energy-policy Framework Conditions for Electricity Markets and Renewable Energies, 23Country Analyses.
IEA/OECD. 2004. World Energy Outlook 2004.
IEA/OECD. 2006. World Energy Outlook 2006.
IEA/OECD. 2009. World Energy Outlook 2009.
UN Millennium Project, UNDP, and ESMAP. 2005. Energy Services for the Millennium Development Goals.IBRD, World Bank, and UNDP.
UNCTAD. 2006. The Least Developed Countries, Report 2006.
UNDP. 2007. Human Development Indicators 2007.
UNDP. 2007a. A Review of Energy in National MDG Reports.
UNDP. 2007b. Energizing Poverty Reduction: A Review of the Energy-Poverty Nexus in Poverty ReductionStrategy Papers.
UNDP. 2007c. Energizing the Least Developed Countries to Achieve the Millennium Development Goals:The Challenges and Opportunities of Globalization, Making Globalization Work for the LDCs. Istanbul,9-11 July 2007.
UNDP. 2006. Human Development Indicators 2006.
appendiX �: sources consulted
The Energy Access Situation in Developing Countries: A Review Focusing on the Least Developed Countries and Sub-Saharan Africa
���

UNDP. 2005. MDG Monitoring and Reporting: A Review of Good Practices.
UNDP and ESMAP. 2005. Energy Services for the Millennium Development Goals, Achieving theMillennium Development Goals.
UNPD. 2006. World Population Prospect: The 2006 Revision Population Database.
WHO. 2006. Fuels for Life: Households Energy and Health.
World Bank. 2004. ‘Scaling up Access to Energy: The Client’s Perspective.’ Presentation to the World Bank’sEnergy Week 2004, 12-18 March 2004, Washington, DC.
World Bank. 2007. ‘Closing the Electricity Supply-Demand Gap.’ Energy and Mining Sector BoardDiscussion Paper, Paper No. 20.
World Bank and IMF. 2007. Clean Energy for Development Investment Framework: The World Bank GroupAction Plan, DC2007-0002.
Regional
Asia & PaciUcCastalia. 2004. Paciyc Infrastructure Review, Background Paper, Final Report.
ESCAP. 2005. Electric Power in Asia and the Paciyc, 2001 and 2002.
UNDP. 2005. Asia-Paciyc Regional Energy Programme for Poverty Reduction (REP-POR), Paciyc RapidAssessment and Gap Analysis, Draft Final Report.
World Bank. 2001. Regulatory Framework and Transaction Models for Private Participation in Infrastructurein Paciyc Islands Countries.
World Bank. 2006. The Paciyc Infrastructure Challenge: A review of obstacles and opportunities forimproving performance in the Paciyc Islands.
AfricaAfrican Development Bank Group. 2007. East Africa Energy Sector Challenges and Opportunities, Invest in
Renewable Energies, East Africa Conference, September 2007, Frankfurt, Germany.
CEMAC. 2006. Cadre d’analyse logique du Plan d'Action.
EAC. 2007. Strategy On Scaling Up Access to Modern Energy Services In Order to Achieve The MillenniumDevelopment Goals.
ECOWAS, UEMOA. 2006. White Paper for a regional policy, geared towards increasing access to energyservices for rural and periurban populations in order to achieve the Millennium Developments Goals.
FEMA. 2005. FEMA position paper: energy and the MDGs.
SAPP. 2007. Energising the region for economic development, Operational Report, Issue No. R03-07(March 2007).
Southern African Development Community. (not dated). Regional Indicative Strategic Development Plan.
Latin America And CaribbeanECLAC. 2008. Statistical yearbook for Latin America and the Caribbean, 2007.
GNESD. 2005. Workshop Summary Report (Draft), Latin American Regional Workshop on Electricity &Development, 13-14 April 2005, Rio de Janeiro, Brazil.
���
The Energy Access Situation in Developing Countries: A Review Focusing on the Least Developed Countries and Sub-Saharan Africa
Mycoo, M. (not dated). Housing & Urban Management in the Caribbean.
SESEM – CFT. 2005. A Review of the Power Sector in Latin America and the Caribbean, Evolution in theMarket and Investment Opportunities for CFTs, Securing Energy Supply and Enlarging Marketsthrough Cleaner Fossil Technology.
Sources consulted, by country
AfghanistanNadiri, I. 2005. Interim Afghanistan National Development Strategy, Summary Report, An Interim Strategy
For Security, Governance, Economic Growth & Poverty Reduction.
MDGR. 2005. Millennium Development Goals, Country Report 2005, Islamic Republic of Afghanistan,Vision 2020, UNDP.
Ministry of Rural Rehabilitation and Development and the Central Statistics Office. 2007. The National Riskand Vulnerability Assessment 2005, Kabul, Afghanistan.
PRSP. 2006. Afghanistan National Development Strategy: An Interim Strategy For Security, Governance,Economic Growth & Poverty Reduction, IMF.
WFP. 2004. Report on Findings from the 2003 National Risk and Vulnerability Assessment (NRVA) in Rural Afghanistan.
ALGERIA
MDGR. 2005. Governement Algérien, Rapport national sur les objectifs du Millénaire pour ledéveloppement, Algérie.
Office National des Statistiques, UNICEF. 2007. Résultats de l'Enquête Nationale à Indicateurs MultiplesMICS3 Algérie 2006, Rapport Préliminaire.
AngolaCCA. 2002. Angola: The Post-War Challenges, Common Country Assessment, UN.
COSEP, Consultoria, Lda., Consaúde, Lda. 2007. Angola Malaria Indicator Survey, 2006-07.
World Bank. 2005. Private Solutions for Infrastructure in Angola: A Country Framework Report.
Antigua And BarbudaAntigua & Barbuda Statistics Division of the Ministry of Finance and The Economy. 2004. Summary Social,
Economic, Demographic, and Housing Characteristics, 2001 Census of Population and Housing.
Kairi Consultants, National Assessment Team of Antigua and Barbuda. 2007. Living Conditions in Antiguaand Barbuda: Poverty in a Services Economy in Transition. Volume III Statistical and TechnicalAppendices to the SLC/HBS.
ArgentinaINDEC. 2001 census at www.indec.gov.ar
MDGR. 2005. Millennium Development Goals: A commitment for poverty eradication, social integrationand non-discrimination purposes, Country report 2005, Executive Summary, Republic of Argentina,Office of the President.
���
The Energy Access Situation in Developing Countries: A Review Focusing on the Least Developed Countries and Sub-Saharan Africa

BangladeshBangladesh Bureau of Statistics. 2004. Key Findings of the Poverty Monitoring Survey, 2004.
Bangladesh Bureau of Statistics. 2007. Key ynding of HIES – 2005.
Bangladesh Bureau of Statistics. Statistics Bangladesh, 2006.
Bangladesh Bureau of Statistics, UNICEF. 2007. Bangladesh Multiple Indicator Cluster survey.
MDGR. 2005. Millennium Development Goals, Bangladesh Progress Report, UNDP.
National Institute of Population Research and Training (NIPORT), Mitra and Associates, and MacroInternational. 2009. Bangladesh Demographic and Health Survey 2007. Dhaka, Bangladesh andCalverton, Maryland, USA: National Institute of Population Research and Training, Mitra andAssociates, and Macro International.
PRSP. 2005. Bangladesh, Unlocking the Potential National Strategy for Accelerated Poverty Reduction, IMF.
Shrestha R.M et al. Undated. Institutional reforms and electricity access: lessons from Bangladesh and Thailand.
WHO. (not dated). World Health Survey Result 2003, Report of Bangladesh.
BelizeCentral Statistical Office. (not dated). Belize. Population Census 2000, Major Findings.
MDGR. 2005. First Millennium Development Goals Report, Belize 2004, Ministry of National Development,Government of Belize, UNDP.
Ministerio de Obras Publicas, Servicios y Vivienda, Viceminsterio de Electricidad y Energias. 2006.Alernativas Program ‘Electricidad para vivir con Dignidad’.
Multiple Indicator Cluster Surveys (MICS) and Millennium Development Goals (MDG) Indicators, Belize.2006. Summary Table of Findings.
Statistical Institute of Belize. 2007. Results of the September 2007 Labor Force Survey.
BeninENDA. 2005. Monographie pays Benin, élaborée dans le cadre de la politique régionale pour
‘L’accroissement de l’accès aux services énergétiques des populations rurales et périurbaines pouratteindre les objectifs du millénaire pour le développement ‘, CEDEAO & UNDP – PREP.
[INSAE] Institut National de la Statistique et de l’Analyse Économique, République du Bénin. 2007. Bénin,Enquête Démographique et de Santé 2006.
MDGR. 2003. Premier Rapport sur les objectifs du Millénaire pour le Développement, UNDP.
PRSP. 2002. Benin Poverty Reduction Strategy Paper 2003-2005, IMF.
PRSP-Progress Report. 2004. Benin, Program For Strengthening the Observatory of Social Change,Progress Report on the Implementation of the PRSP 2003, IMF.
République du Bénin, Ministère du Développement de l'Economie et des Finances, Ministère de l'Energie,des Mines et de l'Eau. 2006. Stratégie pour la Fourniture d'Energie nécessaire pour l'Atteinte des OMDau Bénin, Version Déynitive, UNDP.
BhutanADB. 2002. Country Strategy and Program Update (2003–2005), Bhutan.
���
The Energy Access Situation in Developing Countries: A Review Focusing on the Least Developed Countries and Sub-Saharan Africa
ADB. 2006. Technical Assistance Kingdom of Bhutan: Accelerated Rural Electriycation.
JBIC. 2007. JBIC Provides First ODA Loan to Bhutan – Supporting Poverty Reduction through Rural Electriycation.
MDGR. 2005. Millennium Development Goals Progress Report 2005, Bhutan, UNDP.
National Statistics Bureau, Royal Government of Bhutan. 2007. Bhutan Living Standard Survey 2007, Report.
Planning Commission, Royal Government of Bhutan. 1999. Bhutan 2020: A Vision for Peace, Prosperity andHappiness.
PRSP. 2004. Royal Government of Bhutan, Poverty Reduction Strategy Paper, A Cover Note to the NinthPlan Main Document, IMF.
United Nations. 2006. An Update on the Progress of Implementation of the Brussels Programme of Actionby the Royal Government of Bhutan.
BoliviaInstituto Nacional de Estadística (INE), Ministerio de Salud y Deportes (MSD) et al. 2004. Encuesta Nacional
de Demografía y Salud ENDSA 2003, Programa MEASURE DHS+/ORC Macro.
Instituto Nacional de Estadistica. 2009. Bolivia - Hogares: Combustible Utilizado Para Cocinar, Según ÁreaGeográyca, 1998 - 2007, at http://www.ine.gov.bo/
Instituto Nacional de Estadistica. 2009. Bolivia - Hogares: Disponibilidad De Energía Eléctrica, Según ÁreaGeográyca, 1997 - 2007, at http://www.ine.gov.bo/
Ministerio de Obras Publicas, Servicios y Vivienda, Viceminsterio de Electricidad y Energias. 2006.Alernativas Program ‘Electricidad para vivir con Dignidad’.
BotswanaAREED. (not dated). Botswana: Basic Country Information.
Central Statistics Office. 2009. Botswana Demographic Survey 2006
BrazilMDGR. 2004. Brazilian Monitoring Report on the Millennium Development Goals, UNDP.
WHO. (not dated). World Health Survey Result 2003, Report of Brazil.
Burkina FasoComité Régional Multisectoriel LOME. 2007. Burkina Faso, Etat d'Avancement de la Mise en Œuvre de la
Politique Régionale pour l'Accès à l'Energie, Créer une vision, 4ème Réunion, 12 au 15 novembre 2007,UNDP, ECOWAS, UEOMA, Mepred.
Yaméogo, G. 2005. Monographie pays Burkina Faso, élaborée dans le cadre de la politique régionale pour‘l’accroissement de l’accès aux services énergétiques des populations rurales et périurbaines pouratteindre les objectifs du millénaire pour le développement’, CEDEAO & UNDP – PREP.
IEPF. 2004. Actes du séminaire accès à l’énergie et lutte contre la pauvreté Ouagadougou, Burkina Faso, 10au 12 mai 2004.
[INSD] Institut National de la Statistique et de la Démographie, Burkina Faso. 2006. StatistiquesStructurelles (http://www.insd.bf/).
���
The Energy Access Situation in Developing Countries: A Review Focusing on the Least Developed Countries and Sub-Saharan Africa

INSD and ORC Macro. 2004. Enquête Démographique et de Santé du Burkina Faso 2003. Calverton,Maryland, USA : INSD and ORC Macro.
Institut National de la Statistique et de la Démographie, UNICEF. 2008. Suivi de la Situation des Enfants etdes Femmes, Enquête par Grappes à Indicateurs Multiples, 2006, Rapport ynal.
MDGR. 2003. Rapport Pays, Suivi des Objectifs du Millénaire pour le Développement, UNDP.
Ministère de l'Economie et des Finances, Institut National de la Statistique et de la Démographie. 2007.Analyse des résultats de l'enquête annuelle sur les conditions de vie des ménages en 2007EA/QUIBB 2007.
ONAPAD, Burkin Faso. 2005. Données Pour suivre et évaluer la pauvreté et le développement humaindurable, UNDP.
PRSP. 2004. Burkina Faso Poverty Reduction Strategy Paper, IMF.
PRSP-Progress Report. 2005. Burkina Faso, Poverty Reduction Strategy Paper, 2004 ImplementationReport, Fifth Edition, IMF.
UNDP, Burkina Faso. 2007. Rapport sur le Développement Humain 2007, Sécurité Privé et DéveloppementHumain.
WHO. (not dated). World Health Survey Result 2003, Report of Burkina Faso.
BurundiEmerusenge, E. 2007. Projet Multisectoriel Infrastructures Eau et Energie, Cadre de Gestion
Environnementale et Sociale, République du Burundi, Ministère de l'Eau, de l'Energie et des Mines,Régie de Production et de Distribution de l'Eau et de l'Electricité.
Institut de Statistitiques et d'Etudes Economiques du Burundi (ISTEEBU) and UNICEF. 2008. EnquêteNationale d'Evaluation des Conditions de vie de l'Enfant et de la Femme au Burundi-2005, MICS,Rapport déynitif. World Bank, UNFPA.
MDGR. 2004. Rapport d’avancement - Objectifs du Millenaire pour le Developpement, UNDP.
PRSP. 2006. Republic of Burundi Poverty Reduction Strategy Paper, IMF.
WHO. (not dated). Word Health Survey Result 2003, Report of Burundi.
CambodiaBCSE. 2005. Renewable Energy in Asia: The Cambodia Report. An overview of the energy systems,
renewable energy options, initiatives, actors and opportunities in Cambodia.
GERES. 2008. Energy Globe Award: Reward for GERES Cambodia Program.
Kunleang, H. 2007. Rural Electriycation by Renewable Energy in Cambodia, Capacity and InstitutionalStrenghtening for Rural Electriycation and Development-Decentralized Energy Options, Vientiane, LaoPDR, 03-05 April 2007.
MDGR. 2003. Cambodia, Millennium Development Goals Report, UNDP.
National Institute of Public Health, National Institute of Statistics, Cambodia and ORC Macro. 2006.Cambodia Demographic and Health Survey 2005. Phnom Penh, Cambodia and Calverton, Maryland,USA: National Institute of Public Health, National Institute of Statistics and ORC Macro.
NEDO. 2002. Assistance Project for the Establishment of an Energy Master Plan for the Kingdom ofCambodia, Final Report.
PRSP. 2006. Cambodia: Poverty Reduction Strategy Paper, IMF.
���
The Energy Access Situation in Developing Countries: A Review Focusing on the Least Developed Countries and Sub-Saharan Africa

CameroonESMAP. 2007. Cameroun: Plan d’Action National Energie pour la Réduction de la Pauvreté, ESMAP
Technical Paper 117/07 FR.
[INS] Institut National de la Statistique and ORC Macro. 2004. Enquête Démographique et de Santé duCameroun 2004, Calverton, Maryland, USA: INS and ORC Macro.
MINEFI. 2007. Le secteur électrique au Cameroun, Ambassade de France au Cameroun, MissionEconomique.
Ministère de l’Economie, de la Planiycation et de L’Aménagement du Territoire, Institut National de lastatistique, UNICEF. 2007. Cameroun, Enquête par grappes à indicateurs multiples 2006, Suivi de lasituation des enfants et des femmes, Rapport principal, MICS 2003.
Cape VerdeAfrican Development Bank. 2008. Republic of Cape Verde, Completion Report 2005-2007, Results-based
Country Strategy Paper, Country Operations Department, West Region 2 (ORWB).
Cape Verde. 2004. National Assessments of The Barbados Programme of Action + 10 Review.
MDGR. 2004. Objectifs du Millenaire pour le Developpement au Cap Vert, Rapport 2004, Une Evaluationdes Efforts Accomplis, UNDP.
PRSP. 2004. Republic of Cape Verde, Growth and Poverty Reduction Strategy Paper, IMF.
PRSP-Progress Report. 2006. Implementation of the Growth and Poverty Reduction Strategy Cape Verde, IMF.
Republic of Cape Verde, Ministry of Finance and Public Administration. 2008. Poverty Reduction andGrowth Strategy Paper – II.
Central African RepublicInstitut Centrafricain des Statistiques, et des Etudes Economiques et Sociales. 2007. Suivi de la Situation
des Enfants et des Femmes, Résultats de l’enquête à indicateurs multiples couplée avec la sérologieVIH et anémie en RCA, 2006, Rapport préliminaire, UNICEF.
MDGR. 2004. République Centrafricaine, Objectifs du Millénaire pour le Développement, Rapport National,2003–2015, UNDP.
PRSP-Interim. 2000. Central African Republic, Preliminary Statement of the Government on the PovertyReduction Strategy and Medium-Term Economic Policies, IMF.
République Centrafricaine, Direction Générale de la Statistique, des Études Économiques et Sociales. 2005.Troisième Recensement Général de la Population et de l'Habitation de 2003, Habitation etEnvironnement Immédiat, Rapport d'Analyse Thématique.
ChadBandoumal, O., K. Nodjimadji, et al. 2004. Enquête Démographique et de Santé Tchad 2004. Calverton,
Maryland, U.S.A.: INSEED and ORC Macro.
Banque Africaine de Développment, Département Régional Centre ORCE. 2007. République du Tchad,Rapport de Revue à Mi-parcours du Document de Stratégie Pays Axée sur les Résultats DSPAR2005-2009.
MDGR. 2002. Premier Rapport Pays sur la Mise en Œuvre de la Déclaration du Millénaire au TCHAD, UNDP.
���
The Energy Access Situation in Developing Countries: A Review Focusing on the Least Developed Countries and Sub-Saharan Africa
Munkeni, F. 2006. Energie, Modernité et Lutte contre la Pauvreté, Communication faite aux PremièresJournées Internationales d'Etudes Scientiyques sur le Thème: ‘Le Tchad à l'Ere Pétrolière et sonDéveloppment Durable’.
PRSP. 2003. Republic of Chad, National Poverty Reduction Strategy Paper, IMF.
PRSP-Progress Report. 2005. Republic of Chad, National Poverty Reduction Strategy Monitoring andImplementation Report 2005, IMF.
UNCTAD. 2005. Statistical Proyles of the Least Developed Countries, United Nations, New York and Geneva
WHO. (not dated). World Health Survey Result 2003, Report of Chad.
ChileIMF. 2007. Chile: 2007 Article IV Consultation—Staff Report; Public Information Notice on the Executive
Board Discussion; and Statement by the Executive Director for Chile, IMF Country Report No. 07/333.
MDGR. 2005. Government of Chile, Millennium Development Goals, Executive Summary.
ChinaCarolina Population Center, National Institute of Nutrition and Food Safety. 2008. China Health and
Nutrition Survey 2006, at http://www.cpc.unc.edu/projects/china.
MDGR. 2005. China's progress toward the Millennium Development Goals, Ministry of Foreign Affairs ofthe People's Republic of China, UNDP.
National Bureau of Statistics of China. National agriculture census 2008, at http://www.stats.gov.cn/
Pan, J., et al.. 2006. Rural Electriycation in China 1950-2004: Historical processes and key driving forces.Program on Energy and Sustainable Development, Stanford University. Working Paper #60
Peabody, J.W., T.J. Riddell, K.R. Smith, Y. Liu, et al. 2005. Indoor Air Pollution in Rural China: Cooking Fuels,Stoves and Health Status, Archives of Environmental & Occupational Health; Mar/Apr 2005.
WHO. (not dated). World Health Survey Result 2003, Report of China.
World Bank. 2006. Migration in Towns in China, a Tale of Three Provinces: Evidence from PreliminaryTabulations of the 2000 Census, World Bank Policy Research Working Paper 3890.
ColombiaAsociación Probienestar de la Familia Colombiana Profamilia. 2005. Salud Sexual Y Reproductiva,
Resultados Encuesta Nacional de Demografía y Salud 2005.
ComorosLachaud J.P. 2005. Pauvreté, inégalité et marché du travail dans l’Union des Comores, Eléments d’analyse
fondés sur l’Enquête intégrale auprès des ménages de 2004. Union des Comores, Ministère du Plan etde l’Aménagement du Territoire, PNUD.
MDGR. 2003. Union Des Comores, Rapport National sur les Objectifs du Millénaire pour leDéveloppement, Progrès, Revers et Déys, UNDP.
PRSP-Interim Report. 2005. Union of the Comoros, Poverty Reduction and Growth Strategy Paper,Updated Interim Paper, IMF.
WHO. (not dated). World Health Survey Result 2003, Report of Comoros.
���
The Energy Access Situation in Developing Countries: A Review Focusing on the Least Developed Countries and Sub-Saharan Africa
Congo (Republic Of)[CNSEE] Centre National de la Statistique et des Études Économiques and ORC Macro. 2006. Enquête
Démographique et de Santé du Congo 2005. Calverton, Maryland, USA: CNSEE and ORC Macro.
PRSP-Progress Report. 2005. Republic of Congo: Interim Poverty Reduction Strategy Paper ProgressReport, IMF Country Report No. 05/39.
WHO. (not dated). World Health Survey Result 2003, Report of Congo.
Congo (Democratic Republic Of)MDGR. 2004. Objectifs du Millénaire pour le Développement, Rapport National de suivi de progrès pour la
République, Démocratique du Congo 2004, UNDP.
Ministère du Plan and Macro International. 2008. Enquête Démographique et de Santé, RépubliqueDémocratique du Congo 2007. Calverton, Maryland, U.S.A.: Ministère du Plan and Macro International.
PRSP. 2007. Democratic Republic of the Congo: Poverty Reduction Strategy Paper, IMF Country Report No.07/330.
PRSP-Interim Report. 2002. Democratic Republic of the Congo, Interim Poverty Reduction Strategy Paper,IMF.
PRSP-I-Progress Report. 2004. Democratic Republic of the Congo, Second Progress Report on the I-PRSPImplementation and the Formulation of the Full PRSP June 2003-June 2004, IMF.
World Bank. 2007. Project Appraisal Document on a Proposed Grant in the Amount of SDR196.1 Million tothe Democratic Republic of Congo for a Regional and Domestic Power Markets Development Projectin Support of the Southern Africa Power Market Program.
Cook IslandsCook Islands Statistics Office. 2008. Census 2006, Characteristics of private occupied dwelling.
Côsta RicaOrganizacion Panamericana de la Salud, Red Interamericana de Centros de Salud en la Vivienda. 2001.
Diagnostico Salud en la Vivienda en Costa Rica.
Côte D’ivoireENDA. 2005. République de Côte d'Ivoire, Monographie Pays élaborée dans le Cadre de la Politique
Régionale pour ‘l'Accroissement de l'accès aux Services énergétiques des Populations Rurales etPériurbaines pour Atteindre les Objectifs du Millénaire pour le Développement’.
Institut National de la Statistique, Côte d’Ivoire. 2007. Enquête par grappes à indicateurs multiples Côted'Ivoire 2006, UNICEF.
WHO. (not dated). World Health Survey Result 2003, Report of Côte d'Ivoire.
CubaAhorra Energia. 2007. La Revolution Energetica en Cuba. Concepcion y Resultados, Medellín, 29 de
Noviembre de 2007.
Reinmuller D. 2002. A comparison of Philosophies in Rural Electriycation in Cuba, Mexico and South Africa,SEPCo Workshop II, 7 November 2002.
���
The Energy Access Situation in Developing Countries: A Review Focusing on the Least Developed Countries and Sub-Saharan Africa

DjiboutiESMAP. 2007. Potentiel de réduction des coûts de l’électricité et Stratégie sectorielle d’accroissement de
l’accès à l’Energie en République de Djibouti.
Guelleh, I. 2005. Djibouti sur le chemin du Développement, Livre Blanc.
MDGR. 2005. Djibouti, Objectifs du Millénaire pour le Développement, UNDP.
PRSP. 2004. Republic of Djibouti: Poverty Reduction Strategy Paper, IMF.
Ministère de la Santé, République de Djibouti. 2007. Enquêtes Djiboutienne à Indicateurs Multiples 2006,Rapport préliminaire.
DominicaPRSP. 2006. Dominica: Poverty Reduction Strategy Paper, IMF Country Report No. 06/289.
Dominican Republic
Centro de Estudios Sociales y Demográycos (CESDEM) y Macro International Inc. 2008. EncuestaDemográyca y de Salud 2007. Santo Domingo, República Dominicana: CESDEM y MacroInternational Inc.
Oycina Nacional de Estadistica, UNICEF. 2006. Encuesta Nacional de Hogares de Propósitos Múltiples 2006,ENHOGAR 2006, Informe de Avance de Resultados.
WHO. (not dated). World Health Survey Result 2003, Report of Dominican Republic.
EcuadorConsejo Nacional de Electricidad, Ecuador. 2007. Plan Maestro de Electriycacion 2007-2016.
INEC, 2006, Las condiciones de Vida de Los Ecuatorianos, Resultados de la Encuesta de Condiciones deVida - Quinta Ronda, Vivienda
Instituto Nacional de Estatistica y Censos. 2006. Encuesta de Condiciones de Vida athttp://redatam.inec.gov.ec/
UNDESA. 2008. Commission on Sustainable Development, Ecuador, Case Study, Energy.
WHO. (not dated). World Health Survey Result 2003, Report of Ecuador.
EgyptEl-Zanaty F., and Way A.. 2006. Egypt Demographic and Health Survey 2005. Cairo, Egypt: Ministry of
Health and Population, National Population Council, El-Zanaty and Associates, and ORC Macro.
El-Zanaty F. and Way A.. 2009. Egypt Demographic and Health Survey 2008. Cairo, Egypt: Ministry ofHealth, El-Zanaty and Associates, and Macro International.
UNDP. 2008. Egypt Human Development Report 2008, Egypt’s Social Contract: The Role of Civil Society.
El SalvadorDirección General de Estadística y Censos El Salvador, DIGESTYC, 2008, Encuesta de Hogares de Propósitos
Múltiples 2007
World Bank. 2006. El Salvador Recent Economic Developments in Infrastructure - Strategy Report(REDI-SR), Infrastructure Service Provision in El Salvador: Fighting Poverty, Resuming Growth,Report No. 37689-SV.
���
The Energy Access Situation in Developing Countries: A Review Focusing on the Least Developed Countries and Sub-Saharan Africa
Equatorial GuineaCCA. 2006. République de Guinée Equatoriale, Bilan Commun de Pays.
EritreaEmbassy of Japan. Investment Opportunities in the Energy Sector of Eritrea, USAID (http://www.embassy-
avenue.jp/eritrea/proyle/).
CCA. 2001. Eritrea, Common Country Assessment, UN.
Ergeneman, A. 2003. Dissemination of Improved Cookstoves in Rural Areas of the Developing World:Recommendations for the Eritrea Dissemination of Improved Stoves Program, Eritrea Energy Researchand Training Center(http://www.crest.org/discussiongroups/resources/stoves/Vanbuskirk/EriStoveAPAReport.htm#_ftn11).
Habtetsion, S. 2005. Energy Needs for Achieving MDGs in Eritrea, Department of Energy, Eritrea.
[NSEO] National Statistics and Evaluation Office, (Eritrea) and ORC Macro. 2003. Eritrea Demographicand Health Survey 2002. Calverton, Maryland, USA: National Statistics and Evaluation Office andORC Macro.
EthiopiaCentral Statistical Agency [Ethiopia] and ORC Macro. 2006. Ethiopia Demographic and Health Survey 2005,
Addis Ababa, Ethiopia and Calverton, Maryland, USA: Central Statistical Agency and ORC Macro.
Ethiopia Central Statistical Authority. 2005. Ethiopia Welfare Monitoring Survey 2004.
MDGR. 2004. Millennium Development Goals Report, Challenges and Prospects for Ethiopia, UNDP.
PRSP. 2002. Ethiopia: Sustainable Development and Poverty Reduction Program, IMF.
PRSP-Progress Report. 2005. Ethiopia: Sustainable Development and Poverty Reduction Program (SDPRP),Annual Progress Report (2003/04), IMF.
UNCTAD. 2005. Statistical Proyles of the Least Developed Countries, Ethiopia.
WHO. (not dated). World Health Survey Result 2003, Report of Ethiopia.
World Bank. 2007. Project Appraisal Document on a Proposed Credit in the Amount of Sdr 86.0 Million tothe Federal Democratic Republic of Ethiopia for a Second Electricity Access Rural Expansion Project.
FijiADB. (not dated). Fiji Islands, Country Strategy And Program Update (2004-2006).
MDGR. 2004. Millennium Development Goals Fiji National Report, National Planning Office, Ministry ofFinance and National Planning.
ADB. 2005. Republic of the Fiji Islands: Rural Electriycation Project, Technical Assistance Consultant’sReport, Project Number: 35487.
GabonDGSEE Republique Gabonaise. 2001. Enquête Démographique et de Santé Gabon 2000 - Final Report.
Direction Générale de la Statistique et des Études Économiques (DGSEE) [Gabon] and ORC Macro.2001. Enquête Démographique et de Santé Gabon 2000. Calverton, Maryland : Direction Généralede la Satistique et des Études Économiques, et Fonds des Nations Unies pour la Populations, andORC Macro.
���
The Energy Access Situation in Developing Countries: A Review Focusing on the Least Developed Countries and Sub-Saharan Africa
World Bank. 2006. Gabon - Diagnostique de la pauvreté, Report Nr. 34490-GA.
GambiaGambia Bureau of Statistics (GBoS). 2007. The Gambia Multiple Indicator Cluster Survey 2005/2006 Report,
Banjul.
Gambia Bureau of Statistics. 2007. Monitoring the Situation of Children and Women, Findings from theGambia Multiple Indicator Cluster Survey 2005/2006, Preliminary Report, UNICEF.
KITE. 2005. The Gambia Country Report for Regional Policy Base on ‘Increasing Access to Energy Servicesfor Populations in Rural and Sub Urban Areas in order to Achieve the Millennium Development Goals’,UNDP-REPP & ECOWAS.
MDGR. 2005. Reaching Out to the People: A Review of Progress toward achieving the MillenniumDevelopment Goals at the Local Level in the Gambia.
PRSP. 2002. The Republic of Gambia, Strategy for Poverty Alleviation, IMF.
PRSP-Progress Report. 2006. The Gambia: Poverty Reduction Strategy Paper—Second Annual ProgressReport, January-December 2004, IMF.
Republic of the Gambia. 2006. Poverty Reduction Strategy: 2007-2011.
UNCTAD. 2005. Statistical Proyles of the Least Developed Countries, Gambia.
UNICEF. 2003. Government of Gambia, Baseline Survey In Lower, Central And Upper River Divisions, 2002.
GhanaGhana Energy Commission. 2006. Strategic National Energy Plan 2006 – 2020, Main Report.
Ghana Statistical Service (GSS), Ghana Health Service (GHS), and ICF Macro. 2009. Ghana Demographicand Health Survey 2008. Accra, Ghana: GSS, GHS, and ICF Macro.
Ghana Statistical Service (GSS), Noguchi Memorial Institute for Medical Research (NMIMR), and ORC Macro.2004. Ghana Demographic and Health Survey 2003. Calverton, Maryland: GSS, NMIMR, and ORCMacro.
Statistical Service Ghana. 2007. Monitoring the Situation of Children and Women: Findings from the GhanaMultiple Indicator Cluster Survey 2006, Preliminary Report, UNICEF.
WHO. (not dated). World Health Survey Result 2003, Report of Ghana.
GrenadaKAIRI. 1999. Poverty Assessment Report, Grenada, Volume 2 of 2, Appendices.
PRSP-Interim. 2006. Grenada: Interim Poverty Reduction Strategy Paper, IMF Country Report No. 06/280.
GuatemalaAhmed, K., Y. Awe, et al. 2005. Environmental Health and Traditional Fuel Use in Guatemala, ESMAP.
República de Guatemala, Ministerio de Energía y Minas. 2007. Politica Energetica y Minera, 2008-2015.
WHO. (not dated). World Health Survey Result 2003, Report of Guatemala.
GuineaDirection Nationale de la Statistique (DNS) (Guinée) and ORC Macro. 2006. Enquête Démographique et de
Santé, Guinée 2005. Calverton, Maryland, U.S.A. : DNS and ORC Macro.
���
The Energy Access Situation in Developing Countries: A Review Focusing on the Least Developed Countries and Sub-Saharan Africa
ESMAP. 1999. Guinea, Households Energy Strategy.
MDGR. 2007. Rapport National sur les Objectifs de la Déclaration du Millénaire, UNDP.
UNDP. 2006. OMD Présentation du Rapport Diagnostic Secteur Energie.
PRSP. 2002. Republic of Guinea, Poverty Reduction Strategy Paper, IMF.
PRSP-Progress Report. 2006. Republic of Guinea, Third Progress Report on the Poverty ReductionStrategy, IMF.
Guinea-BissauENDA. 2005. Monographie pays Guinée Buissau, élaborée dans le cadre de la politique régionale pour
‘l’accroissement de l’accès aux services énergétiques des populations rurales et périurbaines pouratteindre les objectifs du millénaire pour le développement’, CEDEAO & UNDP – PREP.
Ministère de l`Economie - Secrétariat d`Etat du Plan et à l`Intégration Régionale. 2006. Enquête parGrappes à Indicateurs Multiples, Guinée-Bissau, 2006, Rapport Final, Bissau, Guinée-Bissau : Ministèrede l`Economie - Secrétariat d`Etat du Plan et à l`Intégration Régionale.
PRSP-Interim. 2000. Guinea-Bissau Interim National Poverty Reduction Strategy Paper, IMF.
GuyanaBureau of Statistics, Guyana. 2007. Population and Housing Census - 2002, Table 26. Neighbourhood
Democratic Councils - Households by Type of Lighting.
Bureau of Statistics, Guyana. 2007. Population and Housing Census 2002, National Census Report, ChapterVII: Housing and Living Arrangements.
Bureau of Statistics and UNICEF. 2008. Guyana Multiple Indicator Cluster Survey 2006, Final Report.Georgetown, Guyana: Bureau of Statistics and UNICEF.
MDGR. 2007. Guyana Millennium Development Goals 2007, UNDP.
Ministry of Health Georgetown, Guyana. 2006. Guyana HIV/AIDS Indicator Survey 2005, USAID.
HaitiBureau of Mines and Energy, Electricity of Haiti. 2006. Haiti Energy Sector Development Plan 2007–2017.
Cayemittes, Michel, Marie Florence Placide, Soumaïla Mariko, Bernard Barrère, Blaise Sévère, and CanezAlexandre. 2007. Enquête Mortalité, Morbidité et Utilisation des Services, Haïti, 2005-2006. Calverton,Maryland, USA : Ministère de la Santé Publique et de la Population, Institut Haïtien de l’Enfance, andMacro International Inc.
MDGR. 2004. Rapport National sur les Objectifs du Millénaire pour le Développement, UNDP.
UNDP. 2004. La vulnérabilité en Haïti: Chemin inévitable vers la pauvreté? Rapport national sur ledéveloppement humain – Haïti.
PRSP. 2008. Haiti: Poverty Reduction Strategy Paper, IMF Country Report No. 08/115.
HondurasPRSP. 2005. Honduras: Poverty Reduction Strategy Paper Progress Report, IMF Country Report No. 05/82.
Secretaría de Salud [Honduras], Instituto Nacional de Estadística (INE), and Macro International. 2006.Encuesta Nacional de Salud y Demografía 2005-2006. Tegucigalpa, Honduras: SS, INE and MacroInternational.
���
The Energy Access Situation in Developing Countries: A Review Focusing on the Least Developed Countries and Sub-Saharan Africa
IndiaAilawadi, V. S. and Bhattacharyya, S.C. 2006. Access to energy services by the poor in India: Current
situation and need for alternative strategies, Natural Resources Forum 30 (2006) 2–14.
INSA. 2001. Pursuit and Promotion of Science: The Indian Experience, Ch. 34: Ministry of Non-conventionalEnergy Sources.
International Institute for Population Sciences (IIPS) and Macro International. 2007. National Family HealthSurvey (NFHS-3), 2005–06: India: Volume I. Mumbai: IIPS.
WHO. (not dated). World Health Survey Result 2003, Report of India.
IndonesiaBadan Pusat Statistik-Statistics Indonesia (BPS) and ORC Macro. 2003. Indonesia Demographic and Health
Survey 2002-2003. Calverton, Maryland, USA: BPS and ORC Macro.
Hutapea, M. 2008. Generating Dialogue Clean Energy, Good Governance and Regulation, Ministry ofEnergy and Mineral Resources, Singapore, 17-18 March 2008.
Kusdiana D., Saptono A. 2008. Implementation of Rural Energy by Renewable Energy in Indonesia,Directorate General of Electricity and Energy Utilization, Ministry of Energy and Mineral Resources,Workshop on Rural Energization Paris, May 28-29, 2008.
Statistics Indonesia (Badan Pusat Statistik—BPS) and Macro International. 2008. Indonesia Demographicand Health Survey 2007. Calverton, Maryland, USA: BPS and Macro International.
World Bank. 2005. Electricity for All: Options for Increasing Access in Indonesia.
IranStatistical Center of Iran. (not dated). Summary Results of the Urban and Rural Household Income and
Expenditure Survey-2006.
IraqCentral Organization for Statistics & Information Technology and Kurdistan Regional Statistics Office. 2007.
Iraq Multiple Indicator Cluster Survey 2006, Final Report. Iraq.
Iraq Ministry of Planning and Development Cooperation. 2005. Iraq Living Conditions Survey 2004,Volume I: Tabulation Report, UNDP.
JamaicaJamaica Cabinet Office. (not dated). Green Paper, The Jamaica Energy Policy 2006 – 2020.
MDGR. 2004. Millennium Development Goals Jamaica, UNDP.
JordanDepartment of Statistics [Jordan] and ORC Macro. 2003. Jordan Population and Family Health Survey 2002.
Calverton, Maryland, USA: Department of Statistics and ORC Macro.
Department of Statistics [Jordan] and Macro International Inc. 2008. Jordan Population and Family HealthSurvey 2007, Calverton, Maryland, USA: Department of Statistics and Macro International Inc.
KenyaCentral Bureau of Statistics (CBS) [Kenya], Ministry of Health (MOH) [Kenya], and ORC Macro. 2004. Kenya
Demographic and Health Survey 2003. Calverton, Maryland: CBS, MOH, and ORC Macro.
���
The Energy Access Situation in Developing Countries: A Review Focusing on the Least Developed Countries and Sub-Saharan Africa

Kenya Ministry of Energy. 2007. Strategic Plan 2004 - 2009, Revised Draft, March 2007.
Kenya National Bureau of Statistics. 2009. Kenya Integrated Household Budget Survey, 2005-2006 athttp://www.cbs.go.ke/
Ministry of Energy, Kenya. 2008. Opening Speech by the Permanent Secretary, Ministry of Energy, At thePublic Sector Workshop on Formulation of a Strategy, Action Plan and Regulations for WoodfuelDevelopment, Westlands, 26th March 2008.
PRSP. 2005. Kenya: Poverty Reduction Strategy Paper, IMF Country Report No. 05/11.
Theuri, D. (not dated). Rural Energy, Stoves and Indoor Air Quality: The Kenyan Experience, ITDG.
WHO. (not dated). World Health Survey Result 2003, Report of Kenya.
Kiribati PIREP. 2004. Paciyc Regional Energy Assessment, Kiribati National Report Volume 5, GEF, UNDP, SPREP and
the Paciyc Islands.
Solar Energy Company. 2004. Improving the Living Standard of an I-Kiribati, Solar Energy for OuterIslands – Kiribati.
Lao People’s Democratic RepublicADB. 2006. Lao People’s Democratic Republic 2007–2011Country Strategy and Program.
Department of Statistics and UNICEF. 2008. Lao PDR Multiple Indicator Cluster Survey 2006, Final Report.Vientiane, Lao PDR: Department of Statistics and UNICEF.
MDGR. 2004. Millennium Development Goals Progress Report, Lao PDR.
National Statistics Centre of the Lao PDR. (not dated). Results from the Population Census 2005.
PRSP. 2004. Lao People’s Democratic Republic, National Growth and Poverty Eradication Strategy, IMF.
UNDP. 2006. National Human Development Report International Trade and Human Development, Lao PDR.
WHO. (not dated). World Health Survey Result 2003, Report of Lao PDR.
LebanonLebanese Republic Ministry of Social Affairs, UNDP. 2006. Living Conditions of Households. The National
Survey of Household Living Conditions.
Lesotho Department of Energy/Rural Electriycation Unit. 2007. Lesotho Renewable Energy-Based Rural
Electriycation Project, Quarterly Progress Report, June – August 2007, GEF, UNDP.
Government of Lesotho. 2004. Invitation to Qualify for the Privatisation of the Lesotho ElectricityCorporation.
Lesotho Electricity Authority. 2006. Energy Policy for the Kingdom of Lesotho, Draft.
Ministry of Health and Social Welfare (MOHSW) [Lesotho], Bureau of Statistics (BOS) [Lesotho], and ORCMacro. 2005. Lesotho Demographic and Health Survey 2004. Calverton, Maryland: MOH, BOS, andORC Macro.
PRSP. 2006. Kingdom of Lesotho: Poverty Reduction Strategy Paper, 2004/2005 – 2006/2007, IMF.
���
The Energy Access Situation in Developing Countries: A Review Focusing on the Least Developed Countries and Sub-Saharan Africa

LiberiaCCA. 2006. Common Country Assessment for Liberia, Consolidating Peace and National Recovery for
Sustainable Development, UN.
Liberia Institute of Statistics and Geo-Information Services (LISGIS) [Liberia], Ministry of Health and SocialWelfare [Liberia], National AIDS Control Program [Liberia], and Macro International Inc. 2008. LiberiaDemographic and Health Survey 2007, Monrovia, Liberia: Liberia Institute of Statistics and Geo-Information Services (LISGIS) and Macro International Inc.
MDGR. 2004. Republic of Liberia, Millennium Development Goals Report 2004.
PRSP-Interim. 2007. Republic of Liberia: Interim Poverty Reduction Strategy Paper, Breaking with the Past:from Conzict to Development, IMF.
Republique of Liberia. 2008. Poverty Reduction Strategy.
MadagascarGouvernement de Madagascar. 2006. Plan d'Action Madagascar, 2007-2012, Un Plan Audacieux pour le
Développement Rapide.
INSTAT (Institut National de la Statistique à Madagascar) and ORC Macro. 2005. Enquête Démographiqueet de Santé, Madagascar 2003–2004 : Rapport de synthèse.
INSTAT, Ministère de l'Economie, des Finances et du Budget. 2006. Enquête permanente auprès desménages 2005, Rapport principal
MDGR. 2001. Madagascar en 2015, Les perceptions du futur par les communautés de base malgaches.
MINEFI. 2007. Fiche de Synthèse, l'Electricité à Madagascar.
PRSP. 2007. Madagascar Action Plan 2007–2012, A Bold and Exciting Plan for Rapid Development, IMF.
MalawiESMAP. 2005. Malawi: Rural Energy and Institutional Development.
MDGR. 2003. Republic of Malawi, Millennium Development Goals Report, 2003, UNDP.
National Statistical Office (NSO) [Malawi], and ORC Macro. 2005. Malawi Demographic and Health Survey2004, Calverton, Maryland: NSO and ORC Macro.
National Statistical Office and UNICEF. 2008. Malawi Multiple Indicator Cluster Survey 2006, Final Report.Lilongwe, Malawi: National Statistical Office and UNICEF.
National Statistical Office Malawi. 2007. Malawi 2006 Welfare Monitoring Survey.
National Statistical Office Zomba, Malawi, UNICEF. 2007. Malawi Multiple Indicator Cluster Survey 2006,Preliminary Report, Monitoring the Situation of Children and Women.
PRSP. 2007. Malawi, Growth and Development Strategy, From Poverty to Prosperity, 2006-2011, IMF.
WHO. (not dated). World Health Survey Result 2003, Report of Malawi.
MalaysiaKasbani A. 2006. Gap Analysis on Access to Energy for the Poor Malaysia. UNDP.
WHO. (not dated). World Health Survey Result 2003, Report of Malaysia.
MaldivesMDGR. 2005. Millennium Development Goals, Maldives Country Report.
���
The Energy Access Situation in Developing Countries: A Review Focusing on the Least Developed Countries and Sub-Saharan Africa
Ministry of Planning and National Development, Republic of Maldives. Census Analysis 2006, HousingConditions & Housing Amenities.
Republic of Maldives, Ministry of Planning and National Development. 2004. Vulnerability and Poverty Assessment.
World Bank. 2006. The Maldives: Sustaining Growth & Improving The Investment Climate.
MaliCellule de Planiycation et de Statistique du Ministère de la Santé (CPS/MS), Direction Nationale de la
Statistique et de l'Informatique (DNSI), and ORC Macro. 2002. Enquête Démographique et de Santé auMali 2001. Calverton, Maryland, USA : CPS/MS, DNSI and ORC Macro.
Cellule de Planiycation et de Statistique du Ministère de la Santé (CPS/MS), Direction Nationale de laStatistique et de l’Informatique du Ministère de l’Économie, de l’Industrie et du Commerce(DNSI/MEIC) and Macro International Inc. 2007. Enquête Démographique et de Santé du Mali 2006.Calverton, Maryland, USA : CPS/DNSI and Macro International Inc.
Diallo, S. 2005. Monographie pays Mali, élaborée dans le cadre de la politique régionale pour‘L’accroissement de l’accès aux services énergétiques des populations rurales et périurbaines pouratteindre les objectifs du millénaire pour le développement’, CEDEAO & UNDP – PREP.
Hantafaye, H., Direction Nationale de l'Energie. (not dated). Présentation de la Situation et Politiqueénergétique au Mali.
MDGR. 2004. République du Mali, Rapport de suivi de la mise en œuvre des Objectifs du Millénaire pour leDéveloppement (OMD), UNDP.
PRSP. 2008. Mali: Poverty Reduction Strategy Paper, IMF Country Report No. 08/121.
PRSP-Implementation Report. 2005. PRSP Implementation Report 2003 And 2004, IMF.
République du Mali. 2008. Plan Décennal pour la Réalisation des Objectifs du Millénaire pour leDéveloppement (OMD) 2006-2015.
République du Mali, Ministère de la Promotion de la Femme, de l'Enfant et de la Famille. 2006. ProgrammeNational de développement des Plates-Formes Multifonctionnelles – Mali (PN/PTF).
WHO. (not dated). World Health Survey Result 2003, Report of Mali.
Marshall IslandsEconomic Policy, Planning and Statistics Office (EPPSO), SPC and Macro International Inc. 2008. Republic of
the Marshall Islands Demographic and Health Survey 2007.
EPPSO. 2006. RMI 2006 Community Survey, Summary of Survey Results.
Government of Marshall Islands, 2001, Marshall Islands National Energy Policy 2002, 2nd Economic &Social Summit 2001
RMI Economic Policy, Planning and Statistics Office. 2006. 2006 RMI Community Survey FinalPopulation Tables.
MauritaniaMDGR. 2005. Rapport sur les progrès dans la mise en oeuvre des Objectifs du Millénaire pour le
Développement en Mauritanie, UNDP.
Office National de la Statistique (ONS). 2006. Proyl de la Pauvreté en Mauritanie, 2004.
���
The Energy Access Situation in Developing Countries: A Review Focusing on the Least Developed Countries and Sub-Saharan Africa

Office National de la Statistitique and UNICEF. 2008. Mauritanie, Enquête par Grappes à IndicateursMultiples 2007, Rapport Final.
PRSP. 2006. Islamic Republic of Mauritania: Poverty Reduction Strategy Paper, Action Plan 2006–2010, IMF.
WHO. (not dated). World Health Survey Result 2003, Report of Mauritania.
MauritiusCentral Statistics Office, Ministry of Economic Development, Financial Services and Corporate Affairs. 2003.
Mauritius, 2000 Housing and Population Census Housing and Household characteristics – MainResults.
Central Statistics Office, Ministry of Finance and Economic Development. 2004. Continuous Multi-PurposeHousehold Survey - First Quarter 2004, Main results
WHO. (not dated). World Health Survey Result 2003, Report of Mauritius.
MexicoINEGI. 2005. Mexico at a Glance, 2005 Edition.
WHO. (not dated). World Health Survey Result 2003, Report of Mexico.
MicronesiaGovernment of the Federated States of Micronesia. 2008. Analysis of the 2005 Household Income and
Expenditure Survey, A report on the estimation of basic needs poverty lines, and the incidence andcharacteristics of poverty in Federated States of Micronesia, UNDP.
PIREP. 2004. Paciyc Regional Energy Assessment, Federates States of Micronesia, National Report Volume3, GEF, UNDP, SPREP and the Paciyc Islands.
MongoliaAgchbayar Dorj. (not dated). Mongolia - Energy Access in Rural Areas, Solar PV System’s Service Co. Ltd.
MDGR. 2007. The Millennium Development Goals Implementation in Mongolia: Second National Report,Ministry of Finance, Mongolia.
Ministry of Nature and Environment of Mongolia. (not dated). Mongolia National Renewable EnergyProgram.
National Statistical Office, UNICEF. 2007. Mongolia ‘Child and Development 2005’ survey (MICS-3), FinalReport. Ulaanbaatar, Mongolia.
MoroccoMDGR. 2003. Rapport National relatif aux Objectifs du Millénaire pour le Développement, Royaume du
Maroc, UNDP.
Ministère de la Santé [Maroc], ORC Macro, and Ligue des États Arabes. 2005. Enquête sur la Population etla Santé Familiale (EPSF) 2003-2004. Calverton, Maryland, USA : Ministère de la Santé and ORC Macro.
ONE. 2008. L'Electriycation Rurale au Maroc, Une Expérience à Partager.
WHO. (not dated). World Health Survey Result 2003, Report of Morocco.
���
The Energy Access Situation in Developing Countries: A Review Focusing on the Least Developed Countries and Sub-Saharan Africa

MozambiqueGwatkin, D.R., et al. 2003. Socio-Economic Differences in Health, Nutrition, and Population, Mozambique
1997–2003.
Fond Africain de Development. 2006. Republique du Mozambique, Quatrième Projet d'Electricité, Rapportd'Evaluation.
Instituto Nacional de Estatística Maputo, Moçambique, Ministério da Saúde Maputo, Moçambique, andORC Macro. 2005. Moçambique Inquérito Demográyco e de Saúde 2003.
MDGR. 2005. Report on the Millennium Development Goals, Republic of Mozambique, UNDP.
PRSP. 2006. Republic of Mozambique, Action Plan for the Reduction of Absolute Poverty 2006–2009, IMF.
MyanmarMDGR. 2005. Millennium Development Goals Report of Myanmar, Ministry of National Planning and
Economic Development.
WHO. (not dated). World Health Survey Result 2003, Report of Myanmar.
NamibiaEMCON. 2008. Impact Assessment of Norad-Funded Rural Electriycation Interventions in Northern
Namibia, 1990-2000, Norad Collected Reviews.
Ministry of Health and Social Services (MoHSS) [Namibia], Macro International Inc.. 2008. NamibiaDemographic and Health Survey 2006-07, Windhoek, Namibia and Calverton, Maryland, USA: MoHSSand Macro International Inc.
Ministry of Health and Social Services, Namibia. 2003. Namibia Demographic and Health Survey 2000.
WHO. (not dated). World Health Survey Result 2003, Report of Namibia.
NauruNauru Bureau of Statistics, SPC and Macro International Inc. 2007. Nauru 2007 Demographic and Health
Survey.
PIREP. 2004. Paciyc Regional Energy Assessment, Nauru National Report Volume 7, GEF, UNDP, SPREP, andthe Paciyc Islands.
NepalCentral Bureau of Statistics of Nepal. 2004. Nepal Living Standards Survey 2003/04 Statistical Report,
Volume One.
Government of Nepal National Planning Commission. 2007. Three Year Interim Plan (2007/08 –2009/10), Ch. 31.
MDGR. 2005. Nepal Millennium Development Goals, Progress Report 2005, UNDP.
Ministry of Health and Population (MOHP) [Nepal], New ERA, and Macro International Inc. 2007. NepalDemographic and Health Survey 2006. Kathmandu, Nepal: Ministry of Health and Population, NewERA, and Macro International Inc.
PRSP. 2003. The Tenth Plan, Poverty Reduction Strategy Paper, 2002-2007, IMF.
���
The Energy Access Situation in Developing Countries: A Review Focusing on the Least Developed Countries and Sub-Saharan Africa

PRSP-Progress Report. 2006. An Assessment of the Implementation of the Tenth Plan/ PRSP Review2005/2006, IMF.
UNDP. 2007. Review of the Improved Cooking Stoves (ICS) Programme in Nepal.
WHO. (not dated). World Health Survey Result 2003, Report of Nepal.
NicaraguaInstituto Nacional de Estadísticas y Censos, Ministerio de Salud, and ORC Macro. 2002. Encuesta
Nicaraguense de Demografía y Salud 2001.
Instituto Nacional de Información de Desarrollo (INIDE), Ministerio de Salud (MINSA). 2008. EncuestaNicaragüense de Demografía y Salud ENDESA 2006/07, Informe Final.
Niger Institut National de la Statistique (INS) and Macro International Inc. 2007. Enquête Démographique et de
Santé et à Indicateurs Multiples du Niger 2006. Calverton, Maryland, USA : INS and MacroInternational Inc.
MDGR. 2003. Rapport National sur le Progrès vers les Objectifs du Millénaire pour le Développement,UNDP.
PRSP. 2002. République du Niger, Poverty Reduction Strategy, Le Niger contre la Pauvreté.
PRSP-Status Report. 2006. Niger: Poverty Reduction Strategy Paper—2005 Status Report, IMF.
République du Niger, Cabinet du Premier Ministre, Secrétariat Permanent de la SRP, Stratégie de Réductionde la Pauvreté, Deuxième génération, Stratégie de Développement Accelere et de Reduction de laPauvreté, 2008 – 2012.
NigeriaNational Bureau of Statistics, UNICEF. 2007. Nigeria Multiple Indicator Cluster Survey 2007, Preliminary
Report.
National Population Commission, Federal Republic of Nigeria. 2004. 2003 Demographic and Health Surveyof Nigeria.
Sambo, A.S. (not dated). Renewable Energy Masterplan for a Developing Nation: The Case of Nigeria,Energy Commission of Nigeria.
NiueSecretariat of the Paciyc Community, National Planning and Development Office, Niue. 2008. Niue
population proyle based on 2006 census of population and housing: a guide for planners and policy-makers.
Occupied Palestinian territoriesPalestinian Central Bureau of Statistics. MDGs Indicators Data in Palestine, 1994-2006.
Palestinian Central Bureau of Statistics. 2007. Palestinian Family Health Survey 2006, Final Report,Ramallah-Palestine.
PakistanGovernment of Pakistan Statistics Division. 2007. Pakistan Social and Living Standards Measurement
Survey 2006-07, www.statpak.gov.pk.
���
The Energy Access Situation in Developing Countries: A Review Focusing on the Least Developed Countries and Sub-Saharan Africa
National Institute of Population Studies (NIPS) [Pakistan], and Macro International Inc. 2008. PakistanDemographic and Health Survey 2006-07, Islamabad, Pakistan: National Institute of PopulationStudies and Macro International Inc.
PRSP. 2004. Pakistan: Poverty Reduction Strategy Paper, IMF Country Report No. 04/24.
WHO. (not dated). World Health Survey Result 2003, Report of Pakistan.
PalauOffice of Planning and Statistics Republic of Palau. 2005. 2005 Census of Population and Housing of the
Republic of Palau, Volume I: Basic Tables.
Palau Office of Planning and Statistics, UNDP. 2008. Palau, Analysis of the 2005/2006 Household incomeand expenditure survey, Final report on the estimation of basic needs poverty lines, and the incidenceand characteristics of poverty in Palau.
PIREP. 2004. Paciyc Regional Energy Assessment, Palau National Report Volume 9, GEF, UNDP, SPREP andthe Paciyc Islands.
PanamaDireccion de Estadistica Y Censo, Censos de Población y Vivienda de Panamá: Año 2000,
http://estadisticas.contraloria.gob.pa/cgi-bin/RpWebEngine.exe/PortalAction?&MODE=MAIN&BASE=LP2000&MAIN=WebServerMain_censos.inl
Papua New GuineaGibson, J., and S. Rozelle. 2002. Poverty and Access to Infrastructure in Papua New Guinea, Working Paper
No. 02-008.
MDGR. 2004. Papua New Guinea, Millennium Development Goals Progress Report 2004, Government ofPapua New Guinea, UNDP.
ParaguayDireccion General de Estadistica. 2007. Principales Resultados de la Encuesta Permanente de Hogares
2007, Total Pais.
WHO. (not dated). World Health Survey Result 2003, Report of Paraguay.
PeruINEI. 2006. Casi Dos Millones de Hogares Cocinan Con Lena. Nota de Prensa N°135, Junio 2006.
Instituto Nacional de Estadistica e Informatica, Programa Measure DHS, and ORC Macro. 2007. PeruEncuesta Demográyca y de Salud Familiar, Endes Continua 2004-2006, Informe Principal.
Instituto Nacional de Estadistica e Informatica. 2009. Censos Nacionales 2007: XI de Población y VI deVivienda, at http://iinei.inei.gob.pe/iinei/RedatamCpv2007.asp?ori=S
World Bank. 2006. Project Appraisal Document on a Proposed Loan in the Amount of US$50.0 Million anda Proposed Grant from the Global Environement Facility Trust Fudn in the Amount of US$10.0 Millionto the Republic of Peru for a Rural Electriycation Project, Report No.: 32686-PE.
PhilippinesMDGR. 2003. Millennium Development Goals Progress Report, Philippines, UNDP.
���
The Energy Access Situation in Developing Countries: A Review Focusing on the Least Developed Countries and Sub-Saharan Africa

National Statistics Office (NSO) [Philippines], and ORC Macro. 2004. National Demographic and HealthSurvey 2003. Calverton, Maryland: NSO and ORC Macro.
National Statistics Office, Republique of the Philippines. Census 2004 atwww.census.gov.ph/data/sectordata/2004/pr055410.htm
Philippines Department of Energy. Philippines Energy Plan, 2004-2013
WHO. (not dated). World Health Survey Result 2003, Report of Philippines.
QatarMDGR. 2005. The Millennium Development Goals in State of Qatar 2005, The Planning Council
General Secretariat.
RwandaInstitut National de la Statistique du Rwanda (INSR) and ORC Macro. 2006. Rwanda Demographic and
Health Survey 2005. Calverton, Maryland, U.S.A.: INSR and ORC Macro.
MDGR. 2003. Millennium Development Goals, Status Report 2003, UNDP.
UNEP. 2006. National Adaptation Programmes of Action to Climate Change, NAPA Rwanda.
PRSP. 2008. Rwanda: Poverty Reduction Strategy Paper, IMF Country Report No. 08/90.
PRSP-Progress Report. 2005. Republic of Rwanda, Poverty Reduction Strategy Annual Progress Report,Policy Matrix.
République du Rwanda, Ministère des Finances et de la Planiycation Economique. 2005. Impact de la crisede l’énergie sur la croissance économique au Rwanda.
UNCTAD. 2005. Statistical Proyles of the Least Developed Countries, Rwanda.
St LuciaSt Lucia Government Statistics Department. 2001 Population and Housing Census Report.
SamoaPIREP. 2004. Paciyc Regional Energy Assessment, Samoa National Report Volume 11, GEF, UNDP, SPREP and
the Paciyc Islands.
Samoa Bureau of Statistics. 2008. Samoa Population and Housing Census Report 2006, AusAID.
United Nations. 2006. An Update on the Progress of Implementation of the Brussel Programme of Actionby the Government of Samoa.
São Tomé and PrincipeInstituto Nacional De Estatística, Sao Tome. 2005. QUIBB 2005 – Dados Preliminares
(http://www.ine.st/quadro_resumo_quibb.htm).
MDGR. 2004. République Démocratique de Sao Tomé et Principe, Objectifs du Millénaire pour leDéveloppement, Premier Rapport National.
PRSP. 2008. São Tomé and Príncipe: Poverty Reduction Strategy Paper Progress Report, IMF Country ReportNo. 08/154.
PRSP-Update. 2005. São Tomé And Príncipe, Update of National Poverty Reduction Strategy, IMF.
���
The Energy Access Situation in Developing Countries: A Review Focusing on the Least Developed Countries and Sub-Saharan Africa

World Bank. 2005. International Development Association Country Assistance Strategy For Sao Tome & Principe.
SenegalBocar Sada Sy. 2005. Monographie pays Sénégal, élaborée dans le cadre de la politique régionale pour
‘l’accroissement de l’accès aux services énergétiques des populations rurales et périurbaines pouratteindre les objectifs du millénaire pour le développement ‘, CEDEAO & UNDP – PREP.
Direction de la prévision et de la statistique. 2004. Rapport de synthèse de la 2ème Enquête SénégalaiseAuprès des Ménages DPS/2004.
ESMAP. 2004. Énergies modernes et réduction de la pauvreté: Un atelier multi-sectoriel. Actes de l'atelierrégional, Dakar, Sénégal, du 4 au 6 février 2003, Report 278/04.
MDGR. 2003. République du Sénégal, Suivi des Objectifs du Millénaire pour le Développement, UNDP.
Ndiaye, S. and Ayad. M. 2006. Enquête Démographique et de Santé au Sénégal 2005. Calverton, Maryland,USA : Centre de Recherche pour le Développement Humain [Sénégal] and ORC Macro.
Ndiaye S. and Ayad M. 2007. Enquête Nationale sur le Paludisme au Sénégal 2006. Calverton, Maryland,USA : Centre de Recherche pour le Développement Humain [Sénégal] et Macro International Inc.
PRSP. 2007. Senegal: Poverty Reduction Strategy Paper, IMF Country Report No. 07/316.
PRSP-Progress Report. 2005. Republic of Senegal, Progress Report on Implementation of the PovertyReduction Strategy, IMF.
WHO. (not dated). World Health Survey Result 2003, Report of Senegal.
SeychellesSeychelles National Statistics Bureau. 2007. Seychelles in Figures, 2007 Edition.
Sierra LeoneGovernment of Sierra Leone. 2007. Core Welfare Indicator Survey 2007, Final Statistical Report.
KITE. 2005. Sierra Leone country report for regional policy based on ‘increasing access to energy servicesfor populations in rural and sub urban areas in order to achieve the millennium development goals’,UNDP-REPP & ECOWAS.
MDGR. 2005. Millennium Development Goals Report for Sierra Leone.
Ministry of Energy & Power. 2006. The Sierra Leone Energy Sector: Prospects & Challenges.
PRSP. 2005. Sierra Leone: Poverty Reduction Strategy Paper: A National Programme for Food Security, JobCreation and Good Governance (2005–2007).
PRSP-Progress Report. 2006. Sierra Leone: Poverty Reduction Strategy Paper, Annual Progress Report.
Statistics Sierra Leone. 2006. Monitoring the Situation of Children and Women: Findings from the SierraLeone Multiple Indicator Cluster Survey 2005, Preliminary Report, UNICEF.
Statistics Sierra Leone and UNICEF-Sierra Leone. 2007. Sierra Leone Multiple Indicator Cluster Survey 2005,Final Report. Freetown, Sierra Leone: Statistics Sierra Leone and UNICEF-Sierra Leone.
UNECA. 2004. The Energy Policy for Sierra Leone.
���
The Energy Access Situation in Developing Countries: A Review Focusing on the Least Developed Countries and Sub-Saharan Africa

Solomon IslandsNational Statistics Office (SISO), SPC and Macro International Inc. 2007. Solomon Islands 2006-2007
Demographic and Health Survey.
PIREP. 2004. Paciyc Regional Energy Assessment, Solomon Islands National Report Volume 12, GEF, UNDP,SPREP and the Paciyc Islands.
SICFCS. 2002. Solomon Islands National Assessment World Summit on Sustainable Development (Rio +10), Synopsis of Issues, Activities, Needs, and Constraints: Sustainable Development 1992-2002.
Solomon Islands Statistics Office. 2006. Household Income And Expenditure Survey 2005/6 NationalReport (Part One).
SomaliaCOWI. 2003. An Urban Development Programme for the European Commission in Somalia.
UNICEF. 2006. Somalia Multiple Indicator Cluster Survey 2006.
South AfricaDepartment of Health, Medical Research Council, and ORC Macro. 2007. South Africa Demographic and
Health Survey 2003, Pretoria: Department of Health.
Lehohla, P. 2007. Community Survey 2007: Municipal data on household services / Statistics South Africa,Report No. 03-01-22 (2007).
Winkler, H., and A. Marquard. 2007. Energy development and climate change in South Africa:Decarbonising growth in South Africa. Occasional paper 2007/40, for UNDP's Human DevelopmentReport 2007/8: Fighting climate change: Human solidarity in a divided world. New York, HumanDevelopment Report Office.
WHO. (not dated). World Health Survey Result 2003, Report of South Africa.
Sri LankaDepartment of Census and Statistics, Ministry of Finance and Planning Sri Lanka. 2008. Household Income
and Expenditure Survey - 2006/07, Final Report.
Ferdinando, M.M.C.. 2007. Power & Energy, Ministry of Power and Energy Sri Lanka.
MDGR. 2005. Millennium Development Goals, Country Report, Sri Lanka, NCED, UNDP.
PRSP. 2002. Government of Sri Lanka, Regaining Sri Lanka: Vision and Strategy for AcceleratedDevelopment.
UNESCAP. (not dated). Country Paper, Sri Lanka.
WHO. (not dated). World Health Survey Result 2003, Report of Sri Lanka.
SudanCentral Bureau of Statistics, Republic of Sudan. 2007. Sudan Household Health Survey, Summary
Finding, Draft.
Department of Statistics, Ministry of Economic and National Planning, Sudan. 1991. Sudan Demographicand Health Survey 1989/1990.
MDGR. 2004. Sudan Millennium Development Goals: Interim Uniyed Report, UNDP.
���
The Energy Access Situation in Developing Countries: A Review Focusing on the Least Developed Countries and Sub-Saharan Africa
SurinameBureau voor de Statistiek in Suriname. 2007. Geselecteerde Census variabelen per district (Census-proyel).
MDGR. 2005. Suriname MDG Baseline Report, UNDP.
SwazilandCentral Statistical Office (CSO) [Swaziland], and Macro International Inc. 2008. Swaziland Demographic and
Health Survey 2006-07. Mbabane, Swaziland: Central Statistical Office and Macro International Inc.
Swaziland Government. 2004. Annual Report, Energy.
WHO. (not dated). World Health Survey Result 2003, Report of Swaziland.
Syrian Arab RepublicCentral Bureau of Statistics, UNICEF. 2007. Findings from the Multiple Indicator Cluster Survey 3 Syrian
Arab Republic, 2006, Preliminary Report.
TanzaniaMDGR. 2001. IDT/MDG Progress: International / Millennium Declaration Development Goals.
National Bureau of Statistics (NBS) [Tanzania] and ORC Macro. 2005. Tanzania Demographic and HealthSurvey 2004-05. Dar es Salaam, Tanzania: National Bureau of Statistics and ORC Macro.
National Bureau of Statistics, United Republic of Tanzania. 2007. Tanzania in Figures 2006.
PRSP. 2005. The United Republic of Tanzania National Strategy for Growth And Reduction Of Poverty(NSGRP), IMF.
Tanzania Commission for AIDS (TACAIDS), Zanzibar AIDS Commission (ZAC), National Bureau of Statistics(NBS), Office of the Chief Government Statistician (OCGS), and Macro International Inc. 2008. TanzaniaHIV/AIDS and Malaria Indicator Survey 2007-08. Dar es Salaam, Tanzania: TACAIDS, ZAC, NBS, OCGS,and Macro International Inc.
Tanzania Electric Supply Company Limited. 2007. Tanzania Energy Development and Access Project, PartB, Environmental and Social Management Framework for the Off-Grid Electriycation Component.
ThailandLimmeechokchai, B., and S. Chawana. 2004. How to Succeed in the Adoption of the Improved Cooking
Stove: The Case Study of Thailand, The Joint International Conference on ‘Sustainable Energy andEnvironment (SEE)’ 1-3 December 2004, Hua Hin, Thailand.
MDGR. 2004. Thailand Millennium Development Goals Report 2004, Office of the National Economic andSocial Development Board, United Nations Country Team in Thailand.
Shrestha, R.M, et al. (not dated). Institutional reforms and electricity access: lessons from Bangladesh andThailand.
Thailand National Statistical Office. 2006. Thailand Multiple Indicator Cluster Survey, December 2005–February 2006, Final Report. Bangkok, Thailand: National Statistical Office.
Timor-LesteADB. 2004. Power Sector Development Plan For Timor-Leste.
���
The Energy Access Situation in Developing Countries: A Review Focusing on the Least Developed Countries and Sub-Saharan Africa
MDGR. 2004. Timor-Leste, Millennium Development Goals Report, UNDP.
PRSP. 2005. Democratic Republic of Timor-Leste: Poverty Reduction Strategy Paper—NationalDevelopment Plan, Road Map for Implementation of National Development Plan, Overview of SectorInvestment Programs—Strategies and Priorities for the Medium Term, IMF Country Report No. 05/247.
UNDP. 2006. Timor-Leste Human Development Report 2006, The Path out of Poverty, Integrated rural development.
World Bank. 2007. Project Paper on a Proposed Grant in the Amount of Sdr 1.64 Million to the DemocraticRepublic of Timor-Leste for an Energy Services Delivery Project.
TogoDirection Generale de la Statistique et de la Comptabilité Nationale. 2007. Suivi de la Situation des
Enfants et des Femmes, Résultats de l’enquête nationale à indicateurs multiples Togo 2006,Rapport Final, UNICEF.
ENDA. 2005. Monographie pays Togo, élaborée dans le cadre de la politique régionale pour‘L’accroissement de l’accès aux services énergétiques des populations rurales et périurbaines pouratteindre les objectifs du millénaire pour le développement’, CEDEAO & UNDP – PREP.
MDGR. 2003. Suivi des Objectifs du Millénaire pour le Développement au Togo, Premier rapport, UNDP.
PRSP. 2008. Togo: Interim Poverty Reduction Strategy Paper, IMF Country Report No. 08/144.
UNDP. 2007. Le Togo se mobilise autour des OMD, Stratégie National de Développement à Long Termebasée sur les OMD.
TokelauStatistics New Zealand and the Office of the Council for the Ongoing Government of Tokelau. 2006.
Tokelau Census of Population and Dwellings, 2006 Census, Tabular Report.
TongaPIREP. 2004. Paciyc Regional Energy Assessment, Tonga National Report Volume 14, GEF, UNDP, SPREP and
the Paciyc Islands.
Tonga Statistics Department. 2008. Tonga 2006 Census of population and housing, Volume 1:Administrative Report and Basic Tables.
Trinidad and TobagoThe Government of the Republic of Trinidad and Tobago, Ministry of Social Development, Central
Statistical Office, UNICEF. 2008. Monitoring the situation of children and women, Multiple IndicatorCluster Survey 3.
TunisiaBen Arfa O.. 2008. La STEG et ses Perspectives de Développement.
MDGR. 2004. Tunisie, Rapport National sur les Objectifs du Millénaire pour le Développement, Nations Unies.
Ministère de la Santé Publique [Tunisie], Office National de la Famille et de la Population, UNICEF. 2008.Enquête sur la Santé et le Bien-être de la Mère et l'Enfant, MICS3.
���
The Energy Access Situation in Developing Countries: A Review Focusing on the Least Developed Countries and Sub-Saharan Africa

Ounalli A.. 2006. Rural Electriycation Institutional Experience: Case of Tunisia, Energy Week at the WorldBank, 6-9 March 2006,
UNDP, World Bank. 2005. Rural Electriycation in Tunisia: National Commitment, Efficient Implementationand Sound Finances.
WHO. (not dated). World Health Survey Result 2003, Report of Tunisia.
TurkeyHacettepe University Institute of Population Studies. 2004. Turkey Demographic and Health Survey 2003.
TuvaluPIREP. 2004. Paciyc Regional Energy Assessment, Tuvalu National Report Volume 15, GEF, UNDP, SPREP and
the Paciyc Islands.
SPC. 2005. Tuvalu 2002, Population and Housing Census, Volume 1 Analytical Report.
Tuvalu Government Ministry of Finance, Economic Planning & Industries. 2006. Household Income andExpenditure Survey (HIES) 2004/2005, Final Report.
Uganda Sengendo, M. et al. 2005. Gender, Poverty and Energy in Implementing Sustainable Development in
Uganda, National Paper Uganda.
MDGR. 2003. The Millennium Development Goals, Progress Report for Uganda.
Ministry of Energy and Mineral Development, Republic of Uganda. 2002. The Energy Policy for Uganda..
Ministry of Energy and Mineral Development, The Government of the Republic of Uganda. 2001. RuralElectriycation Strategy and Plan Covering the Period 2001 to 2010.
Ministry of Energy and Mineral Development, Republic of Uganda. 2007. The Renewable Energy Policy forUganda.
PRSP. 2004. Poverty Eradication Action Plan (2004/5-2007/8), IMF.
Uganda, Republic of. 2001. National Biomass Energy Demand Strategy 2001 – 2010, Draft Document,Ministry of Energy and Mineral Development.
Uganda Bureau of Statistics (UBOS) and Macro International Inc. 2007. Uganda Demographic and HealthSurvey 2006. Calverton, Maryland, USA: UBOS and Macro International Inc.
United Arab EmiratesWHO. (not dated). World Health Survey Result 2003, Report of United Arab Emirates.
UruguayWHO. (not dated). World Health Survey Result 2003, Report of Uruguay.
Instituto Nacional de Estadistica Uruguay. Encuesta Nacional de Hogares Ampliada 2006, Flash Tematico 7.
VanuatuPIREP. 2004. Paciyc Regional Energy Assessment, Vanuatu National Report Volume 16, GEF, UNDP, SPREP
and the Paciyc Islands.
���
The Energy Access Situation in Developing Countries: A Review Focusing on the Least Developed Countries and Sub-Saharan Africa
Ministry of Health, Government of Vanuatu. 2008. Vanuatu Multiple Indicator Cluster Survey 2007, FinalReport, Port Vila, Vanuatu.
Vanuatu National Statistics Office. 2008. Analysis of the 2006 Household Income and Expenditure Survey,A Report on the Estimation of Basic Needs Poverty Lines and the Incidence and Characteristics ofPoverty in Vanuatu, ADB, UNDP.
Viet NamCommittee for Population, Family and Children [Viet Nam], and ORC Macro. 2003. Viet Nam Demographic
and Health Survey 2002. Calverton, Maryland, USA: Committee for Population, Family and Childrenand ORC Macro.
General Statistics Office of Viet Nam. 2007. Viet Nam Multiple Indicator Cluster Survey 2006 - MICS3.
MDGR. 2005. Viet Nam achieving the Millennium Development Goals.
PRSP. 2006. Viet Nam: Poverty Reduction Strategy Paper—Annual Progress Report, IMF Country Report No.06/340.
Vu Van Thai. 2006. Workshop on Mean streaming Policies and Investment in Low Carbon: Opportunity forNew Approaches to Investment and Flexible Mechanisms, 30-31 August 2006, UNESCAP, Bangkok,Thailand, Viet Nam Energy Policy: Energy Investment and Climate Change.
WHO. (not dated). World Health Survey Result 2003, Report of Viet Nam.
YemenESMAP. 2005. Household Energy Supply and Use in Yemen: Volume I, Main Report.
MDGR. 2003. Millennium Development Goals, Progress Report for Yemen, UNDP.
Ministry of Health and Population, UNICEF 2008, Yemen Multiple Indicator Cluster Survey 2006, FinalReport
PRSP. 2002. Republic of Yemen, Poverty Reduction Strategy Paper, 2003–2005, IMF
Central Statistical Organization, Yemen. Census 2004.
Zambia Central Statistical Office [Zambia], Central Board of Health [Zambia], and ORC Macro. 2003. Zambia
Demographic and Health Survey 2001-2002. Calverton, Maryland, USA: Central Statistical Office,Central Board of Health, and ORC Macro.
PRSP. 2002. Republic of Zambia, Poverty Reduction Strategy Paper.
PRSP-Progress Report. 2004. Republic of Zambia, Second PRSP Implementation Progress Report July 2003– June 2004, IMF.
Republic of Zambia. 2006. Fifth National Development Plan 2006-2010, PRSP.
Sibanda, N. 2006. Reporting on Energy Issues in Zambia, 14th Session of the UN Commission onSustainable Development (CSD 14), UN Headquarters, New York. May 9, 2006.
UNDP. 2006. Economic policies for Growth, Employment and Poverty Reduction, Case Study of Zambia.
WHO. (not dated). World Health Survey Result 2003, Report of Zambia.
���
The Energy Access Situation in Developing Countries: A Review Focusing on the Least Developed Countries and Sub-Saharan Africa

Central Statistical Office (CSO), Ministry of Health (MOH), Tropical Diseases Research Centre (TDRC),University of Zambia, and Macro International Inc. 2009. Zambia Demographic and Health Survey2007. Calverton, Maryland, USA: CSO and Macro International Inc.
ZimbabweCentral Statistical Office (CSO) [Zimbabwe] and Macro International Inc. 2007. Zimbabwe Demographic
and Health Survey 2005-06. Calverton, Maryland: CSO and Macro International Inc.
Government of Zimbabwe. 2007. Draft Energy Policy.
WHO. (not dated). World Health Survey Result 2003, Report of Zimbabwe.
���
The Energy Access Situation in Developing Countries: A Review Focusing on the Least Developed Countries and Sub-Saharan Africa

For Further Information:
Ms. Veerle Vandeweerd
DirectorEnvironment & Energy GroupBureau for Development PolicyUnited Nations Development Programme304 East 45th Street, 9th FloorNew York, NY 10017 , U.S.A.Tel: +1 (212) 906-5020Email: [email protected]
For Further Information:
Maria Neira
Director, Public Health and EnvironmentHealth Security and EnvironmentWorld Health OrganizationAvenue Appia 201211 Geneva 27SwitzerlandTel: + 41 22 791 21 11Email: [email protected] N
ovem
ber2
009