thermodynamic investigation of the interaction between
TRANSCRIPT
RSC Advances
PAPER
Ope
n A
cces
s A
rtic
le. P
ublis
hed
on 2
6 A
ugus
t 202
0. D
ownl
oade
d on
1/2
8/20
22 3
:50:
39 A
M.
Thi
s ar
ticle
is li
cens
ed u
nder
a C
reat
ive
Com
mon
s A
ttrib
utio
n 3.
0 U
npor
ted
Lic
ence
.
View Article OnlineView Journal | View Issue
Thermodynamic
School of Studies in Chemistry, Pt. Ravisha
C.G., India. E-mail: [email protected]
† Electronic supplementary informa10.1039/d0ra04394j
Cite this: RSC Adv., 2020, 10, 31400
Received 17th May 2020Accepted 4th August 2020
DOI: 10.1039/d0ra04394j
rsc.li/rsc-advances
31400 | RSC Adv., 2020, 10, 31400–
investigation of the interactionbetween ionic liquid functionalized goldnanoparticles and human serum albumin forselective determination of glutamine†
Sushama Sahu, Reshma, Srishti Sharma, Indrapal Karbhal and Kallol K. Ghosh *
The excellent biocompatible and monodispersed gold nanoparticles (AuNPs) functionalized by amino
based ionic liquid (IL) have been synthesized for the demonstration of their interaction with human
serum albumin (HSA). Amino based IL stabilizes the surface of AuNPs and provides a colorimetric sensor
platform. The size of synthesized IL–AuNPs was identified by use of transmission electron microscopy
(TEM) and dynamic light scattering (DLS) techniques. Molecular interaction of functionalized AuNPs with
HSA have been investigated using multispectroscopic techniques, such as UV-Vis, fluorescence and
Fourier transform infra-red (FT-IR) spectroscopy. The fluorescence and synchronous fluorescent
intensity together indicated that IL–AuNPs exhibits a strong ability to quench the intrinsic fluorescence
of HSA via a dynamic quenching mechanism. Moreover, the binding constant (Ka), Stern–Volmer
quenching constant (KSV) and different thermodynamic parameters, namely Gibb's free energy (DG),
enthalpy (DH) and entropy (DS) have been evaluated at different temperatures. This interactive study
focuses on the nature of surface modification of IL–AuNPs via HSA for selective detection of glutamine
(Glu) with a lower limit of detection of 0.67 nM in the linear range of 10–100 nM for Glu.
1. Introduction
Serum albumins are proteins found in blood plasma whichaccount for about 60% of the total protein corresponding toa concentration of 42 g L�1 and are ultimately responsible forabout 80% of the osmotic pressure of blood.1–3 Both bovineserum albumin (BSA) and human serum albumin (HSA) arethiol containing proteins.4 HSA consists of 585 amino acids andthe main binding sites are located at hydrophobic cavities intheir subdomains, such as tryptophan (Trp-214) and tyrosine(Tyr-411) residues.5 HSA has a tendency to interact with posi-tively charged species due to its negative charges at pH 7.8 andthe isoelectronic point (pI) of HSA is found to be 4.9, hence itshows roll on distribution, transportation and metabolismfunctions in pharmaceuticals.5,6 HSA is considered as biode-gradable and non-antigenic, hence, it is widely used for thepreparation of microsphere and nanosphere sized nano-particles (NPs).7
Understanding the interaction of NPs with serum albumin isan important aspect in nanobiology, nanomedicine and nano-toxicology. The assembled HSA-NPs exhibits enhanced
nkar Shukla University, Raipur-492010,
m; Tel: +91-771-2262583
tion (ESI) available. See DOI:
31410
permeability and retention effect (EPR effect), hence, it enablestoo passive tumor targeting in cancer therapy.8 Additionally,albumin molecules possess many functional groups whichhelps them in binding to the surface of other bio-active ligands,such as different amino acids found in human blood.7,9 Hence,it is necessary to study the interaction ability of HSA towardsNPs as they may be a key for many bio-medical issues.
From past decades, NPs have been targeted as a novel andinnovative nanomaterials due to their unique properties andpotential applications with high chemical reactivity.8 Therenano size enables them to interact with other biomolecules,drugs etc. making them applicable in areas such as catalysis ormicroelectronics.10 Metal NPs are extensively used in thera-peutic and diagnosis due to their excellent properties, such asminimal size, high stability, large surface area, suspensionreactivity and tunable water solubility.11 Mostly, metal NPsinclude gold (Au), silver (Ag), copper (Cu) and iron (Fe). Amongthese, Au has been studied extensively in many elds, as opticalabsorption study, self assembled monolayers, immunoassayand resonance light scattering spectroscopy, due to their inertand relatively less cytotoxicity.12 Nowadays, ionic liquid (IL) arealso becoming a subject of interest for the functionalization ofmetal NPs due to their extraordinary physical, chemical andbiodegradable properties.13 Therefore, the study of the interac-tion of IL–AuNPs to serum albumins for selective sensing ofamino acids could be critically signicant.
This journal is © The Royal Society of Chemistry 2020

Paper RSC Advances
Ope
n A
cces
s A
rtic
le. P
ublis
hed
on 2
6 A
ugus
t 202
0. D
ownl
oade
d on
1/2
8/20
22 3
:50:
39 A
M.
Thi
s ar
ticle
is li
cens
ed u
nder
a C
reat
ive
Com
mon
s A
ttrib
utio
n 3.
0 U
npor
ted
Lic
ence
.View Article Online
A lot of research work has been focused in understanding themechanism behind interaction of NPs with serum albu-mins.4,7,13–15 The major interaction for NPs–HSA binding involvesp–p stacking, electrostatic and hydrophobic interactions.16 Thenature and sources of the interaction of NPs with HSA alsocontribute in unraveling the binding mechanism between them.7
Hemmateenejad et al.17 investigated the interaction of ZnS-NPswith HSA and indicated that uorescence of HSA is quenchedthrough static mechanism. They also showed the spontaneousbinding reaction and proved that conformational structure ofHSA molecules could be changed in the presence of ZnS-NPsusing synchronous uorescence spectroscopy. Sen et al.18
studied the interaction of AuNPs with HSA by surface energytransfer method and proved that AuNPs interacts more stronglywith subdomain IA of HSA. Gorjup et al.19 developed and opti-mized the ligand modied NPs based on HSA for an efficientgene therapy. Chamani et al.20 studied the interaction betweenciprooxacin and HSA in the presence and absence of AgNPs todescribe the critical aggregation concentration changes ofciprooxacin by changing the hydrophobic interaction in pres-ence of AgNPs. So far, no work has been reported involving thestudy of interaction between AuNPs functionalized by aminobased IL with HSA for selective detection of amino acids.
Here, in this work, uorescence and synchronous quenchingmethod as well as UV-Vis method have been used for the deter-mination of different parameters to evaluate the interactionbetween IL functionalized AuNPs with HSA. Based on the HSAquenched by IL–AuNPs, different parameters as Stern–Volmerquenching constant (KSV), enthalpy (DH), entropy (DS) and Gibb'sfree energy (DG) were calculated by uorescence and UV-Vistechnique at different temperature. This interaction study hasbeen applied to investigate their effect for the detection of aminoacids found in human blood. This interaction strategy has beenapplied for selective detection of glutamine (Glu) using IL–AuNPsas a colorimetric sensor. In this method, the amino based ionicliquid (IL), i.e., 4-((hydroxyimino)methyl)-1-(2-(octylamino)-2-oxoethyl)pyridin-1-iumbromide [Fig. S1(a)†] was used for func-tionalization of AuNPs surface for obtaining strong absorptionpeak in the visible region. The self aggregation behavior of AuNPs
Fig. 1 Schematic representation for the interaction of IL–AuNPs with H
This journal is © The Royal Society of Chemistry 2020
has been reduced due to the use of IL. The synthesized IL–AuNPsin the absence and presence of HSA was characterized by UV-Vis,uorescence, transmission electron microscope (TEM), dynamiclight scattering (DLS) and diffused reectance Fourier transforminfra-red (DRS-FTIR) spectroscopy. The aggregation of IL–AuNPswas driven upon the addition of HSA which causes decrease inabsorption band at 520 nmwhereas uorescence (FL) intensity isfound to be decreased by increasing the concentration of IL–AuNPs. Further, this interaction was applied for selective sensingof Glu, in which all HSA molecules were found to be replaced byamino and carboxyl group of Glu [Fig. S1(b)†] conrmed bystrong FL intensity observed for AuNPs–Glu complex. The sche-matic representation of this process is shown in Fig. 1.
2. Experimental section2.1 Materials
All the chemicals used were of analytical grade. Hydrogen tet-rachloro aurate(iii) (HAuCl4$3H2O, 99%), human serumalbumin (HSA), glutamine (Glu), aspartic acid (Asp), leucine(Leu), trypsine (Try), tyrosine (Tyr), arginine (Arg) and methio-nine (Met) were procured from Sigma Aldrich Pvt. Ltd., Banga-lore, India. HSA was dissolved in 0.1 M phosphate-buffer saline(PBS), pH 7.8 and stored at 4 �C. Sodium borohydride (NaBH4)was purchased from Merck, Mumbai, India. Amino based ionicliquid (IL) i.e., 4-((hydroxyimino) methyl)-1-(2-(octylamino)-2-oxoethyl) pyridin-1-iumbromide was purchased from SigmaAldrich Pvt. Ltd. Bangalore, India. All the chemicals were usedwithout further purication. All the experiments were per-formed with ultrapure water (18 MU cm).
2.2 Instrumentation
The concentration and interparticle distance of IL–AuNPs andIL–AuNPs with HSA were measured from 200 nm to 800 nm (pH7.8) at 291, 298 and 305 K on Agilent technology Cary-60 UV-Visspectrophotometer. Fluorescence measurements were per-formed on a Fluorescence spectrophotometer equipped witha 150 W xenon lamp in the wavelength range of 300–450 nm
SA for selective sensing of Glu.
RSC Adv., 2020, 10, 31400–31410 | 31401
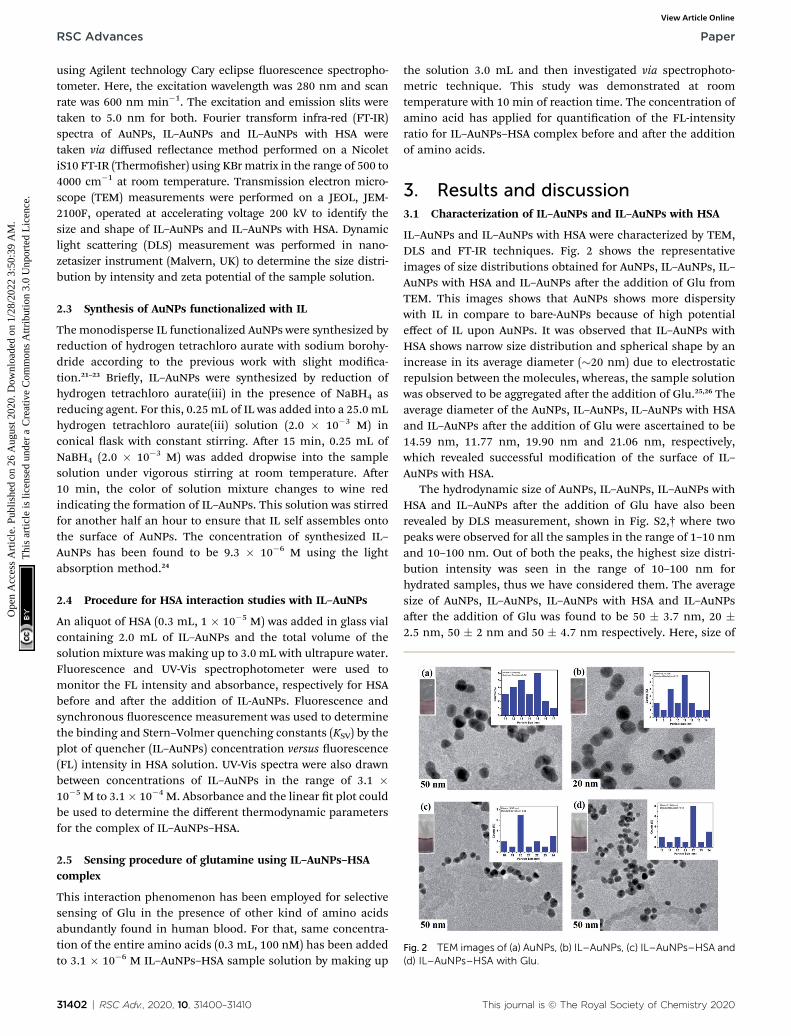
Fig. 2 TEM images of (a) AuNPs, (b) IL–AuNPs, (c) IL–AuNPs–HSA and(d) IL–AuNPs–HSA with Glu.
RSC Advances Paper
Ope
n A
cces
s A
rtic
le. P
ublis
hed
on 2
6 A
ugus
t 202
0. D
ownl
oade
d on
1/2
8/20
22 3
:50:
39 A
M.
Thi
s ar
ticle
is li
cens
ed u
nder
a C
reat
ive
Com
mon
s A
ttrib
utio
n 3.
0 U
npor
ted
Lic
ence
.View Article Online
using Agilent technology Cary eclipse uorescence spectropho-tometer. Here, the excitation wavelength was 280 nm and scanrate was 600 nm min�1. The excitation and emission slits weretaken to 5.0 nm for both. Fourier transform infra-red (FT-IR)spectra of AuNPs, IL–AuNPs and IL–AuNPs with HSA weretaken via diffused reectance method performed on a NicoletiS10 FT-IR (Thermosher) using KBr matrix in the range of 500 to4000 cm�1 at room temperature. Transmission electron micro-scope (TEM) measurements were performed on a JEOL, JEM-2100F, operated at accelerating voltage 200 kV to identify thesize and shape of IL–AuNPs and IL–AuNPs with HSA. Dynamiclight scattering (DLS) measurement was performed in nano-zetasizer instrument (Malvern, UK) to determine the size distri-bution by intensity and zeta potential of the sample solution.
2.3 Synthesis of AuNPs functionalized with IL
Themonodisperse IL functionalized AuNPs were synthesized byreduction of hydrogen tetrachloro aurate with sodium borohy-dride according to the previous work with slight modica-tion.21–23 Briey, IL–AuNPs were synthesized by reduction ofhydrogen tetrachloro aurate(iii) in the presence of NaBH4 asreducing agent. For this, 0.25 mL of IL was added into a 25.0 mLhydrogen tetrachloro aurate(iii) solution (2.0 � 10�3 M) inconical ask with constant stirring. Aer 15 min, 0.25 mL ofNaBH4 (2.0 � 10�3 M) was added dropwise into the samplesolution under vigorous stirring at room temperature. Aer10 min, the color of solution mixture changes to wine redindicating the formation of IL–AuNPs. This solution was stirredfor another half an hour to ensure that IL self assembles ontothe surface of AuNPs. The concentration of synthesized IL–AuNPs has been found to be 9.3 � 10�6 M using the lightabsorption method.24
2.4 Procedure for HSA interaction studies with IL–AuNPs
An aliquot of HSA (0.3 mL, 1 � 10�5 M) was added in glass vialcontaining 2.0 mL of IL–AuNPs and the total volume of thesolution mixture was making up to 3.0 mL with ultrapure water.Fluorescence and UV-Vis spectrophotometer were used tomonitor the FL intensity and absorbance, respectively for HSAbefore and aer the addition of IL-AuNPs. Fluorescence andsynchronous uorescence measurement was used to determinethe binding and Stern–Volmer quenching constants (KSV) by theplot of quencher (IL–AuNPs) concentration versus uorescence(FL) intensity in HSA solution. UV-Vis spectra were also drawnbetween concentrations of IL–AuNPs in the range of 3.1 �10�5 M to 3.1� 10�4 M. Absorbance and the linear t plot couldbe used to determine the different thermodynamic parametersfor the complex of IL–AuNPs–HSA.
2.5 Sensing procedure of glutamine using IL–AuNPs–HSAcomplex
This interaction phenomenon has been employed for selectivesensing of Glu in the presence of other kind of amino acidsabundantly found in human blood. For that, same concentra-tion of the entire amino acids (0.3 mL, 100 nM) has been addedto 3.1 � 10�6 M IL–AuNPs–HSA sample solution by making up
31402 | RSC Adv., 2020, 10, 31400–31410
the solution 3.0 mL and then investigated via spectrophoto-metric technique. This study was demonstrated at roomtemperature with 10 min of reaction time. The concentration ofamino acid has applied for quantication of the FL-intensityratio for IL–AuNPs–HSA complex before and aer the additionof amino acids.
3. Results and discussion3.1 Characterization of IL–AuNPs and IL–AuNPs with HSA
IL–AuNPs and IL–AuNPs with HSA were characterized by TEM,DLS and FT-IR techniques. Fig. 2 shows the representativeimages of size distributions obtained for AuNPs, IL–AuNPs, IL–AuNPs with HSA and IL–AuNPs aer the addition of Glu fromTEM. This images shows that AuNPs shows more dispersitywith IL in compare to bare-AuNPs because of high potentialeffect of IL upon AuNPs. It was observed that IL–AuNPs withHSA shows narrow size distribution and spherical shape by anincrease in its average diameter (�20 nm) due to electrostaticrepulsion between the molecules, whereas, the sample solutionwas observed to be aggregated aer the addition of Glu.25,26 Theaverage diameter of the AuNPs, IL–AuNPs, IL–AuNPs with HSAand IL–AuNPs aer the addition of Glu were ascertained to be14.59 nm, 11.77 nm, 19.90 nm and 21.06 nm, respectively,which revealed successful modication of the surface of IL–AuNPs with HSA.
The hydrodynamic size of AuNPs, IL–AuNPs, IL–AuNPs withHSA and IL–AuNPs aer the addition of Glu have also beenrevealed by DLS measurement, shown in Fig. S2,† where twopeaks were observed for all the samples in the range of 1–10 nmand 10–100 nm. Out of both the peaks, the highest size distri-bution intensity was seen in the range of 10–100 nm forhydrated samples, thus we have considered them. The averagesize of AuNPs, IL–AuNPs, IL–AuNPs with HSA and IL–AuNPsaer the addition of Glu was found to be 50 � 3.7 nm, 20 �2.5 nm, 50 � 2 nm and 50 � 4.7 nm respectively. Here, size of
This journal is © The Royal Society of Chemistry 2020
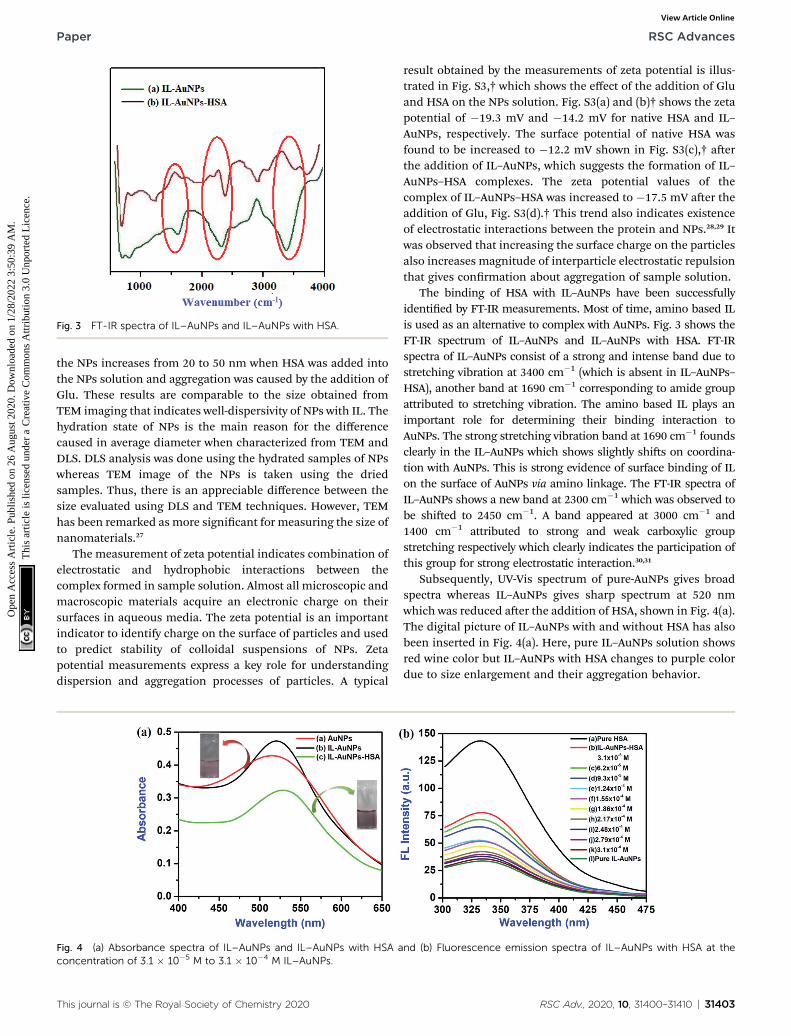
Fig. 3 FT-IR spectra of IL–AuNPs and IL–AuNPs with HSA.
Paper RSC Advances
Ope
n A
cces
s A
rtic
le. P
ublis
hed
on 2
6 A
ugus
t 202
0. D
ownl
oade
d on
1/2
8/20
22 3
:50:
39 A
M.
Thi
s ar
ticle
is li
cens
ed u
nder
a C
reat
ive
Com
mon
s A
ttrib
utio
n 3.
0 U
npor
ted
Lic
ence
.View Article Online
the NPs increases from 20 to 50 nm when HSA was added intothe NPs solution and aggregation was caused by the addition ofGlu. These results are comparable to the size obtained fromTEM imaging that indicates well-dispersivity of NPs with IL. Thehydration state of NPs is the main reason for the differencecaused in average diameter when characterized from TEM andDLS. DLS analysis was done using the hydrated samples of NPswhereas TEM image of the NPs is taken using the driedsamples. Thus, there is an appreciable difference between thesize evaluated using DLS and TEM techniques. However, TEMhas been remarked as more signicant for measuring the size ofnanomaterials.27
The measurement of zeta potential indicates combination ofelectrostatic and hydrophobic interactions between thecomplex formed in sample solution. Almost all microscopic andmacroscopic materials acquire an electronic charge on theirsurfaces in aqueous media. The zeta potential is an importantindicator to identify charge on the surface of particles and usedto predict stability of colloidal suspensions of NPs. Zetapotential measurements express a key role for understandingdispersion and aggregation processes of particles. A typical
Fig. 4 (a) Absorbance spectra of IL–AuNPs and IL–AuNPs with HSA aconcentration of 3.1 � 10�5 M to 3.1 � 10�4 M IL–AuNPs.
This journal is © The Royal Society of Chemistry 2020
result obtained by the measurements of zeta potential is illus-trated in Fig. S3,† which shows the effect of the addition of Gluand HSA on the NPs solution. Fig. S3(a) and (b)† shows the zetapotential of �19.3 mV and �14.2 mV for native HSA and IL–AuNPs, respectively. The surface potential of native HSA wasfound to be increased to �12.2 mV shown in Fig. S3(c),† aerthe addition of IL–AuNPs, which suggests the formation of IL–AuNPs–HSA complexes. The zeta potential values of thecomplex of IL–AuNPs–HSA was increased to �17.5 mV aer theaddition of Glu, Fig. S3(d).† This trend also indicates existenceof electrostatic interactions between the protein and NPs.28,29 Itwas observed that increasing the surface charge on the particlesalso increases magnitude of interparticle electrostatic repulsionthat gives conrmation about aggregation of sample solution.
The binding of HSA with IL–AuNPs have been successfullyidentied by FT-IR measurements. Most of time, amino based ILis used as an alternative to complex with AuNPs. Fig. 3 shows theFT-IR spectrum of IL–AuNPs and IL–AuNPs with HSA. FT-IRspectra of IL–AuNPs consist of a strong and intense band due tostretching vibration at 3400 cm�1 (which is absent in IL–AuNPs–HSA), another band at 1690 cm�1 corresponding to amide groupattributed to stretching vibration. The amino based IL plays animportant role for determining their binding interaction toAuNPs. The strong stretching vibration band at 1690 cm�1 foundsclearly in the IL–AuNPs which shows slightly shis on coordina-tion with AuNPs. This is strong evidence of surface binding of ILon the surface of AuNPs via amino linkage. The FT-IR spectra ofIL–AuNPs shows a new band at 2300 cm�1 which was observed tobe shied to 2450 cm�1. A band appeared at 3000 cm�1 and1400 cm�1 attributed to strong and weak carboxylic groupstretching respectively which clearly indicates the participation ofthis group for strong electrostatic interaction.30,31
Subsequently, UV-Vis spectrum of pure-AuNPs gives broadspectra whereas IL–AuNPs gives sharp spectrum at 520 nmwhich was reduced aer the addition of HSA, shown in Fig. 4(a).The digital picture of IL–AuNPs with and without HSA has alsobeen inserted in Fig. 4(a). Here, pure IL–AuNPs solution showsred wine color but IL–AuNPs with HSA changes to purple colordue to size enlargement and their aggregation behavior.
nd (b) Fluorescence emission spectra of IL–AuNPs with HSA at the
RSC Adv., 2020, 10, 31400–31410 | 31403

Fig. 5 Fluorescence quenching spectra of HSA by IL–AuNPs at (A) 291 K, (B) 298 K and (C) 305 K.
Table 1 Stern–Volmer quenching constants (KSV) and correlationcoefficient (R) for IL–AuNPs with HSA at different temperatures
pH value Temperature (K)
IL–AuNPs–HSA
KSV (103 L mol�1) R
7.8 291 31.10 � 0.05 0.996298 45.92 � 0.08 0.987305 51.51 � 0.06 0.984
RSC Advances Paper
Ope
n A
cces
s A
rtic
le. P
ublis
hed
on 2
6 A
ugus
t 202
0. D
ownl
oade
d on
1/2
8/20
22 3
:50:
39 A
M.
Thi
s ar
ticle
is li
cens
ed u
nder
a C
reat
ive
Com
mon
s A
ttrib
utio
n 3.
0 U
npor
ted
Lic
ence
.View Article Online
The uorescence emission spectra of HSA at differentconcentration of IL–AuNPs (3.1 � 10�5 M to 3.1 � 10�4 M) wererecorded in the wavelength range of 300–475 nm, shown inFig. 4(b). Here, it was observed that as the concentration of IL–AuNPs increases, FL intensity of HSA decreases regularly byshowing blue shiing of spectra. Hence, the highest emissionwavelength was found at 338 nm and the lowest emissionwavelength (aer blue shi) was observed at 330 nm.
3.2 Fluorescence spectroscopic studies
3.2.1 Quenching mechanism and effect of IL–AuNPs onHSA. Fluorescence quenching can be caused either by dynamic(collisions) or static (complex formation) with respect to thequencher.15 The quenching effect of IL–AuNPs on HSA wasstudied at three different temperature (i.e., 291, 298 and 305 K),shown in Fig. 5. It could be seen that the FL intensity of HSAdecreases regularly by increasing the concentration of IL–
Fig. 6 (a) Fluorescence quenching linear fit spectra of HSA by IL–AuNPquenching linear fit spectra at different temperature (291, 298 and 305 K
31404 | RSC Adv., 2020, 10, 31400–31410
AuNPs and shows slightly blue shiing of spectra from 338 to330 nm. This phenomenon implies that uorescence quench-ing process was mainly controlled by dynamic quenchingmechanism rather than a static quenching mechanism.32 Table1 also claries the dynamic method of this procedure byshowing increase in the Stern–Volmer quenching constants(KSV) value upon increase in the temperature. The uorescencequenching results were analyzed by the Stern–Volmerequation.32–34
F0
F¼ 1þ KSV½Q� (1)
where, F0 and F are the uorescence emission peak of HSA inthe absence and presence of quencher, respectively. KSV and [Q]are the Stern–Volmer quenching constant and the concentra-tion of free quencher, respectively.
The plot of F0/F for HSA versus IL–AuNPs concentrationexhibits good linearity range (R � 0.92) and affords KSV to be 31to 51 (103 L mol�1) at the temperature of 291, 298 and 305 K,shown in Fig. 6(a). Therefore, it indicates that the uorescencequenching process of HSA has been mainly governed bya dynamic quenching mechanism.
3.2.2 The apparent binding constant (Ka) and number ofbinding sites (n). Several methods are available to calculate thebinding constant (Ka) and the number of binding sites (n).35,36Here,HSA provides binding sites for IL–AuNPs. The reaction between ILfunctionalized AuNPs and HSA can be proposed as following:
Au + HSA / Au1–HSA (2)
s at different temperature (291, 298 and 305 K) and (b) Fluorescence).
This journal is © The Royal Society of Chemistry 2020
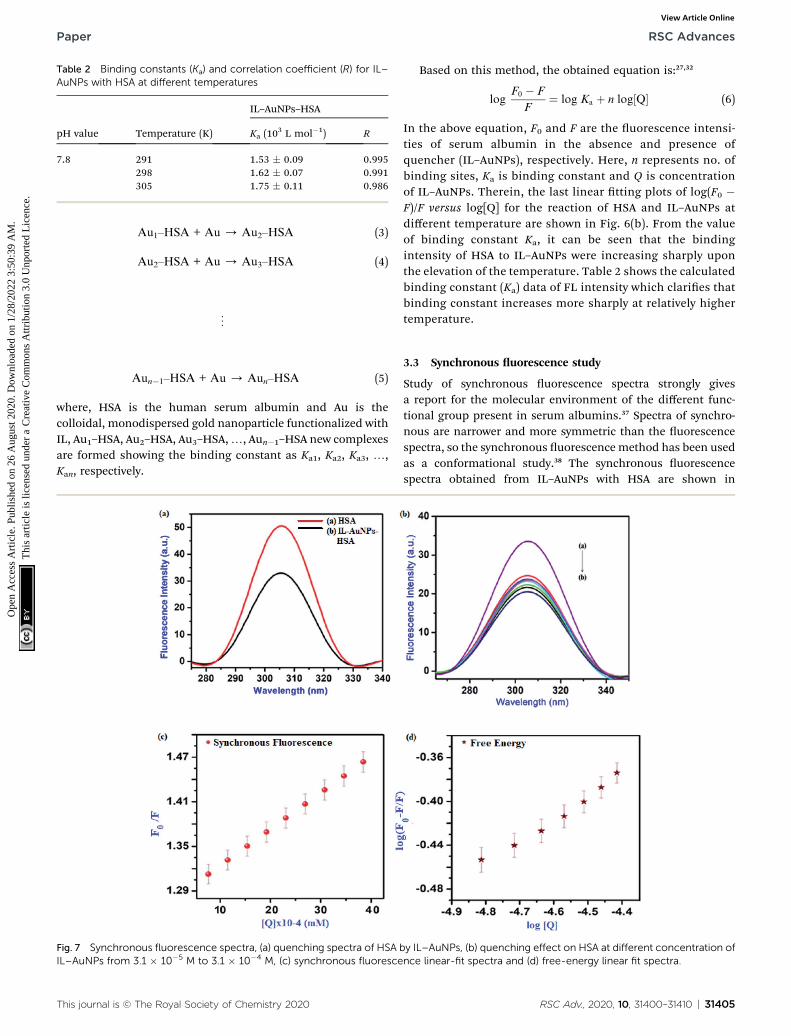
Table 2 Binding constants (Ka) and correlation coefficient (R) for IL–AuNPs with HSA at different temperatures
pH value Temperature (K)
IL–AuNPs–HSA
Ka (103 L mol�1) R
7.8 291 1.53 � 0.09 0.995298 1.62 � 0.07 0.991305 1.75 � 0.11 0.986
Paper RSC Advances
Ope
n A
cces
s A
rtic
le. P
ublis
hed
on 2
6 A
ugus
t 202
0. D
ownl
oade
d on
1/2
8/20
22 3
:50:
39 A
M.
Thi
s ar
ticle
is li
cens
ed u
nder
a C
reat
ive
Com
mon
s A
ttrib
utio
n 3.
0 U
npor
ted
Lic
ence
.View Article Online
Au1–HSA + Au / Au2–HSA (3)
Au2–HSA + Au / Au3–HSA (4)
«
Aun�1–HSA + Au / Aun–HSA (5)
where, HSA is the human serum albumin and Au is thecolloidal, monodispersed gold nanoparticle functionalized withIL, Au1–HSA, Au2–HSA, Au3–HSA,., Aun�1–HSA new complexesare formed showing the binding constant as Ka1, Ka2, Ka3, .,Kan, respectively.
Fig. 7 Synchronous fluorescence spectra, (a) quenching spectra of HSAIL–AuNPs from 3.1 � 10�5 M to 3.1 � 10�4 M, (c) synchronous fluoresce
This journal is © The Royal Society of Chemistry 2020
Based on this method, the obtained equation is:27,32
logF0 � F
F¼ log Ka þ n log½Q� (6)
In the above equation, F0 and F are the uorescence intensi-ties of serum albumin in the absence and presence ofquencher (IL–AuNPs), respectively. Here, n represents no. ofbinding sites, Ka is binding constant and Q is concentrationof IL–AuNPs. Therein, the last linear tting plots of log(F0 �F)/F versus log[Q] for the reaction of HSA and IL–AuNPs atdifferent temperature are shown in Fig. 6(b). From the valueof binding constant Ka, it can be seen that the bindingintensity of HSA to IL–AuNPs were increasing sharply uponthe elevation of the temperature. Table 2 shows the calculatedbinding constant (Ka) data of FL intensity which claries thatbinding constant increases more sharply at relatively highertemperature.
3.3 Synchronous uorescence study
Study of synchronous uorescence spectra strongly givesa report for the molecular environment of the different func-tional group present in serum albumins.37 Spectra of synchro-nous are narrower and more symmetric than the uorescencespectra, so the synchronous uorescence method has been usedas a conformational study.38 The synchronous uorescencespectra obtained from IL–AuNPs with HSA are shown in
by IL–AuNPs, (b) quenching effect on HSA at different concentration ofnce linear-fit spectra and (d) free-energy linear fit spectra.
RSC Adv., 2020, 10, 31400–31410 | 31405

Table 3 Stern–Volmer quenching constants (KSV), correlation coeffi-cient (R) and associative binding constants (Ka) for IL–AuNPs with HSAat different temperatures
pH value Temperature (K)
IL–AuNPs–HSA
KSV (103 L mol�1) R Ka
7.8 291 7.012 � 0.22 0.920 1.302298 8.002 � 0.01 0.995 1.371305 8.930 � 0.31 0.956 2.950
RSC Advances Paper
Ope
n A
cces
s A
rtic
le. P
ublis
hed
on 2
6 A
ugus
t 202
0. D
ownl
oade
d on
1/2
8/20
22 3
:50:
39 A
M.
Thi
s ar
ticle
is li
cens
ed u
nder
a C
reat
ive
Com
mon
s A
ttrib
utio
n 3.
0 U
npor
ted
Lic
ence
.View Article Online
Fig. 7(a). The surface modication of IL–AuNPs with HSAshowed slight blue shi of the FL intensity peaks from 307 nmin Fig. 7(b), curve (a), to 304 nm, curve (b) which evidences thatsize of the inner IL–AuNPs “core” experiences a little decrease.39
Furthermore, the maximum FL intensity of HSA was signi-cantly quenched with increasing quencher from 3.1� 10�5 M to3.1 � 10�4 M IL–AuNPs. As the concentration increases, thesynchronous uorescence spectral maximum gradually shis tolonger wavelengths and an explanation for this phenomenoncan be given in terms of inner-lter effect.40,41 The linear t andfree energy plot has also been drawn for this method, shown inFig. 7(c) and (d). Hence, the quenching effect of IL–AuNPs onthe synchronous uorescence emission of HSA was found to bedependent on the concentration of quencher.
Table 3 shows the calculated Stern–Volmer quenchingconstants (KSV), correlation coefficient (R) and binding constants
Fig. 8 UV-Vis spectra of IL–AuNPs with HSA by increasing the concentrand (c) 305 K.
31406 | RSC Adv., 2020, 10, 31400–31410
(K) for IL–AuNPs with HSA system, using synchronous uores-cence quenching method at room temperature. This revealedthat the conformation and microenvironment of HSA werechanged by the binding of IL–AuNPs with HSA. From thedynamic ranges of IL–AuNPs–HSA at relatively higher tempera-ture, it is very clear that the IL–AuNPs–HSA system providesmoreprecise information about the molecular environments of HSA.
3.4 UV-Vis studies
Fluorescence quenching mechanism was further revealed byUV-Vis absorption spectrum for IL–AuNPs–HSA system. Fig. 8shows the UV-Vis spectra of IL–AuNPs with HSA at thetemperature of 291, 298 and 305 K. This study has been used fordetermination of binding constant (K) of IL–AuNPs–HSAcomplex using following equations.32,33
1
A� A0
¼ 1
KðAmax � A0Þ½Q� þ1
Amax � A0
(7)
where, A0 and A are the absorbance of IL–AuNPs in the absenceand presence of HSA, respectively. Amax are the absorbance athigh concentrations of IL–AuNPs at saturation point and K is thebinding constant. The plots of 1/[A0 � A] versus concentration ofIL–AuNPs provides straight line. Fig. 8 shows the formation ofcomplex of IL–AuNPs with HSA and calculated binding constantfrom Bensei–Hildebrand plot listed in Table 4.42
3.4.1 Study of binding interaction between IL–AuNPs andHSA. In general,molecule bindswith each other through any of four
ation of IL–AuNPs from 3.1 � 10�5 to 3.1 � 10�4 at (a) 291 K, (b) 298 K
This journal is © The Royal Society of Chemistry 2020
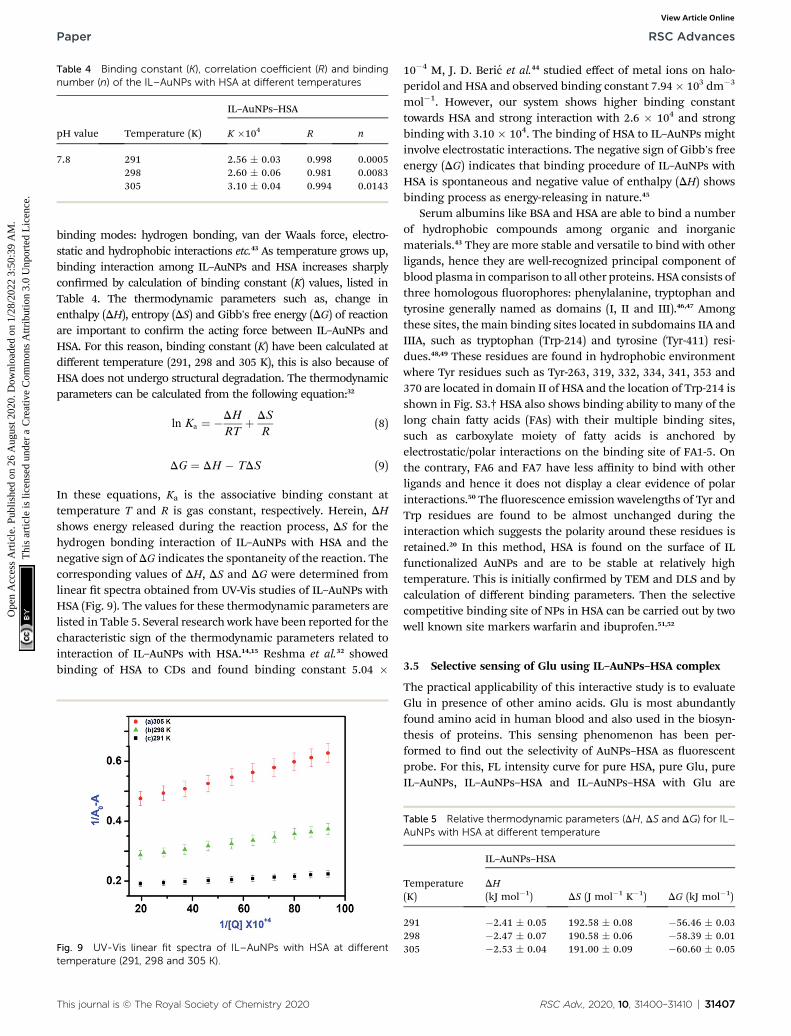
Table 4 Binding constant (K), correlation coefficient (R) and bindingnumber (n) of the IL–AuNPs with HSA at different temperatures
pH value Temperature (K)
IL–AuNPs–HSA
K �104 R n
7.8 291 2.56 � 0.03 0.998 0.0005298 2.60 � 0.06 0.981 0.0083305 3.10 � 0.04 0.994 0.0143
Paper RSC Advances
Ope
n A
cces
s A
rtic
le. P
ublis
hed
on 2
6 A
ugus
t 202
0. D
ownl
oade
d on
1/2
8/20
22 3
:50:
39 A
M.
Thi
s ar
ticle
is li
cens
ed u
nder
a C
reat
ive
Com
mon
s A
ttrib
utio
n 3.
0 U
npor
ted
Lic
ence
.View Article Online
binding modes: hydrogen bonding, van der Waals force, electro-static and hydrophobic interactions etc.43 As temperature grows up,binding interaction among IL–AuNPs and HSA increases sharplyconrmed by calculation of binding constant (K) values, listed inTable 4. The thermodynamic parameters such as, change inenthalpy (DH), entropy (DS) and Gibb's free energy (DG) of reactionare important to conrm the acting force between IL–AuNPs andHSA. For this reason, binding constant (K) have been calculated atdifferent temperature (291, 298 and 305 K), this is also because ofHSA does not undergo structural degradation. The thermodynamicparameters can be calculated from the following equation:32
ln Ka ¼ �DH
RTþ DS
R(8)
DG ¼ DH � TDS (9)
In these equations, Ka is the associative binding constant attemperature T and R is gas constant, respectively. Herein, DHshows energy released during the reaction process, DS for thehydrogen bonding interaction of IL–AuNPs with HSA and thenegative sign of DG indicates the spontaneity of the reaction. Thecorresponding values of DH, DS and DG were determined fromlinear t spectra obtained from UV-Vis studies of IL–AuNPs withHSA (Fig. 9). The values for these thermodynamic parameters arelisted in Table 5. Several research work have been reported for thecharacteristic sign of the thermodynamic parameters related tointeraction of IL–AuNPs with HSA.14,15 Reshma et al.32 showedbinding of HSA to CDs and found binding constant 5.04 �
Fig. 9 UV-Vis linear fit spectra of IL–AuNPs with HSA at differenttemperature (291, 298 and 305 K).
This journal is © The Royal Society of Chemistry 2020
10�4 M, J. D. Beric et al.44 studied effect of metal ions on halo-peridol and HSA and observed binding constant 7.94� 103 dm�3
mol�1. However, our system shows higher binding constanttowards HSA and strong interaction with 2.6 � 104 and strongbinding with 3.10 � 104. The binding of HSA to IL–AuNPs mightinvolve electrostatic interactions. The negative sign of Gibb's freeenergy (DG) indicates that binding procedure of IL–AuNPs withHSA is spontaneous and negative value of enthalpy (DH) showsbinding process as energy-releasing in nature.45
Serum albumins like BSA and HSA are able to bind a numberof hydrophobic compounds among organic and inorganicmaterials.43 They are more stable and versatile to bind with otherligands, hence they are well-recognized principal component ofblood plasma in comparison to all other proteins. HSA consists ofthree homologous uorophores: phenylalanine, tryptophan andtyrosine generally named as domains (I, II and III).46,47 Amongthese sites, themain binding sites located in subdomains IIA andIIIA, such as tryptophan (Trp-214) and tyrosine (Tyr-411) resi-dues.48,49 These residues are found in hydrophobic environmentwhere Tyr residues such as Tyr-263, 319, 332, 334, 341, 353 and370 are located in domain II of HSA and the location of Trp-214 isshown in Fig. S3.† HSA also shows binding ability to many of thelong chain fatty acids (FAs) with their multiple binding sites,such as carboxylate moiety of fatty acids is anchored byelectrostatic/polar interactions on the binding site of FA1-5. Onthe contrary, FA6 and FA7 have less affinity to bind with otherligands and hence it does not display a clear evidence of polarinteractions.50 The uorescence emission wavelengths of Tyr andTrp residues are found to be almost unchanged during theinteraction which suggests the polarity around these residues isretained.20 In this method, HSA is found on the surface of ILfunctionalized AuNPs and are to be stable at relatively hightemperature. This is initially conrmed by TEM and DLS and bycalculation of different binding parameters. Then the selectivecompetitive binding site of NPs in HSA can be carried out by twowell known site markers warfarin and ibuprofen.51,52
3.5 Selective sensing of Glu using IL–AuNPs–HSA complex
The practical applicability of this interactive study is to evaluateGlu in presence of other amino acids. Glu is most abundantlyfound amino acid in human blood and also used in the biosyn-thesis of proteins. This sensing phenomenon has been per-formed to nd out the selectivity of AuNPs–HSA as uorescentprobe. For this, FL intensity curve for pure HSA, pure Glu, pureIL–AuNPs, IL–AuNPs–HSA and IL–AuNPs–HSA with Glu are
Table 5 Relative thermodynamic parameters (DH, DS and DG) for IL–AuNPs with HSA at different temperature
Temperature(K)
IL–AuNPs–HSA
DH(kJ mol�1) DS (J mol�1 K�1) DG (kJ mol�1)
291 �2.41 � 0.05 192.58 � 0.08 �56.46 � 0.03298 �2.47 � 0.07 190.58 � 0.06 �58.39 � 0.01305 �2.53 � 0.04 191.00 � 0.09 �60.60 � 0.05
RSC Adv., 2020, 10, 31400–31410 | 31407
RSC Advances Paper
Ope
n A
cces
s A
rtic
le. P
ublis
hed
on 2
6 A
ugus
t 202
0. D
ownl
oade
d on
1/2
8/20
22 3
:50:
39 A
M.
Thi
s ar
ticle
is li
cens
ed u
nder
a C
reat
ive
Com
mon
s A
ttrib
utio
n 3.
0 U
npor
ted
Lic
ence
.View Article Online
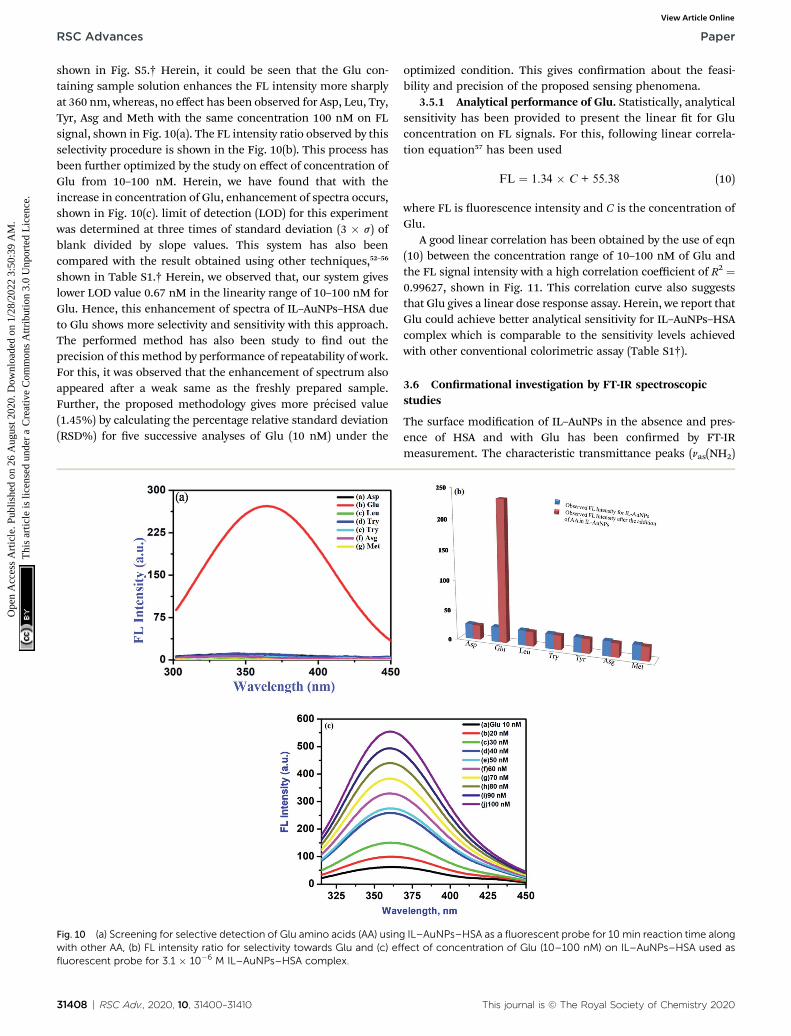
shown in Fig. S5.† Herein, it could be seen that the Glu con-taining sample solution enhances the FL intensity more sharplyat 360 nm, whereas, no effect has been observed for Asp, Leu, Try,Tyr, Asg and Meth with the same concentration 100 nM on FLsignal, shown in Fig. 10(a). The FL intensity ratio observed by thisselectivity procedure is shown in the Fig. 10(b). This process hasbeen further optimized by the study on effect of concentration ofGlu from 10–100 nM. Herein, we have found that with theincrease in concentration of Glu, enhancement of spectra occurs,shown in Fig. 10(c). limit of detection (LOD) for this experimentwas determined at three times of standard deviation (3 � s) ofblank divided by slope values. This system has also beencompared with the result obtained using other techniques,52–56
shown in Table S1.† Herein, we observed that, our system giveslower LOD value 0.67 nM in the linearity range of 10–100 nM forGlu. Hence, this enhancement of spectra of IL–AuNPs–HSA dueto Glu shows more selectivity and sensitivity with this approach.The performed method has also been study to nd out theprecision of this method by performance of repeatability of work.For this, it was observed that the enhancement of spectrum alsoappeared aer a weak same as the freshly prepared sample.Further, the proposed methodology gives more precised value(1.45%) by calculating the percentage relative standard deviation(RSD%) for ve successive analyses of Glu (10 nM) under the
Fig. 10 (a) Screening for selective detection of Glu amino acids (AA) usinwith other AA, (b) FL intensity ratio for selectivity towards Glu and (c) efffluorescent probe for 3.1 � 10�6 M IL–AuNPs–HSA complex.
31408 | RSC Adv., 2020, 10, 31400–31410
optimized condition. This gives conrmation about the feasi-bility and precision of the proposed sensing phenomena.
3.5.1 Analytical performance of Glu. Statistically, analyticalsensitivity has been provided to present the linear t for Gluconcentration on FL signals. For this, following linear correla-tion equation57 has been used
FL ¼ 1.34 � C + 55.38 (10)
where FL is uorescence intensity and C is the concentration ofGlu.
A good linear correlation has been obtained by the use of eqn(10) between the concentration range of 10–100 nM of Glu andthe FL signal intensity with a high correlation coefficient of R2 ¼0.99627, shown in Fig. 11. This correlation curve also suggeststhat Glu gives a linear dose response assay. Herein, we report thatGlu could achieve better analytical sensitivity for IL–AuNPs–HSAcomplex which is comparable to the sensitivity levels achievedwith other conventional colorimetric assay (Table S1†).
3.6 Conrmational investigation by FT-IR spectroscopicstudies
The surface modication of IL–AuNPs in the absence and pres-ence of HSA and with Glu has been conrmed by FT-IRmeasurement. The characteristic transmittance peaks (nas(NH2)
g IL–AuNPs–HSA as a fluorescent probe for 10 min reaction time alongect of concentration of Glu (10–100 nM) on IL–AuNPs–HSA used as
This journal is © The Royal Society of Chemistry 2020
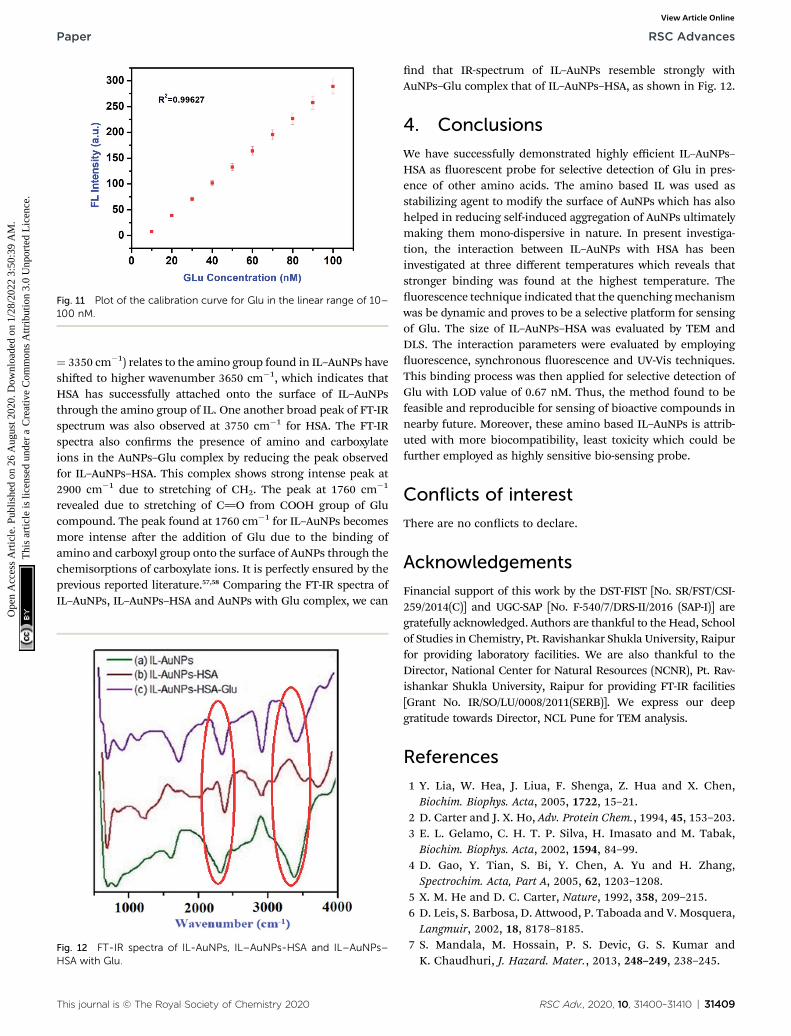
Fig. 11 Plot of the calibration curve for Glu in the linear range of 10–100 nM.
Paper RSC Advances
Ope
n A
cces
s A
rtic
le. P
ublis
hed
on 2
6 A
ugus
t 202
0. D
ownl
oade
d on
1/2
8/20
22 3
:50:
39 A
M.
Thi
s ar
ticle
is li
cens
ed u
nder
a C
reat
ive
Com
mon
s A
ttrib
utio
n 3.
0 U
npor
ted
Lic
ence
.View Article Online
¼ 3350 cm�1) relates to the amino group found in IL–AuNPs haveshied to higher wavenumber 3650 cm�1, which indicates thatHSA has successfully attached onto the surface of IL–AuNPsthrough the amino group of IL. One another broad peak of FT-IRspectrum was also observed at 3750 cm�1 for HSA. The FT-IRspectra also conrms the presence of amino and carboxylateions in the AuNPs–Glu complex by reducing the peak observedfor IL–AuNPs–HSA. This complex shows strong intense peak at2900 cm�1 due to stretching of CH2. The peak at 1760 cm�1
revealed due to stretching of C]O from COOH group of Glucompound. The peak found at 1760 cm�1 for IL–AuNPs becomesmore intense aer the addition of Glu due to the binding ofamino and carboxyl group onto the surface of AuNPs through thechemisorptions of carboxylate ions. It is perfectly ensured by theprevious reported literature.57,58 Comparing the FT-IR spectra ofIL–AuNPs, IL–AuNPs–HSA and AuNPs with Glu complex, we can
Fig. 12 FT-IR spectra of IL-AuNPs, IL–AuNPs-HSA and IL–AuNPs–HSA with Glu.
This journal is © The Royal Society of Chemistry 2020
nd that IR-spectrum of IL–AuNPs resemble strongly withAuNPs–Glu complex that of IL–AuNPs–HSA, as shown in Fig. 12.
4. Conclusions
We have successfully demonstrated highly efficient IL–AuNPs–HSA as uorescent probe for selective detection of Glu in pres-ence of other amino acids. The amino based IL was used asstabilizing agent to modify the surface of AuNPs which has alsohelped in reducing self-induced aggregation of AuNPs ultimatelymaking them mono-dispersive in nature. In present investiga-tion, the interaction between IL–AuNPs with HSA has beeninvestigated at three different temperatures which reveals thatstronger binding was found at the highest temperature. Theuorescence technique indicated that the quenchingmechanismwas be dynamic and proves to be a selective platform for sensingof Glu. The size of IL–AuNPs–HSA was evaluated by TEM andDLS. The interaction parameters were evaluated by employinguorescence, synchronous uorescence and UV-Vis techniques.This binding process was then applied for selective detection ofGlu with LOD value of 0.67 nM. Thus, the method found to befeasible and reproducible for sensing of bioactive compounds innearby future. Moreover, these amino based IL–AuNPs is attrib-uted with more biocompatibility, least toxicity which could befurther employed as highly sensitive bio-sensing probe.
Conflicts of interest
There are no conicts to declare.
Acknowledgements
Financial support of this work by the DST-FIST [No. SR/FST/CSI-259/2014(C)] and UGC-SAP [No. F-540/7/DRS-II/2016 (SAP-I)] aregratefully acknowledged. Authors are thankful to the Head, Schoolof Studies in Chemistry, Pt. Ravishankar Shukla University, Raipurfor providing laboratory facilities. We are also thankful to theDirector, National Center for Natural Resources (NCNR), Pt. Rav-ishankar Shukla University, Raipur for providing FT-IR facilities[Grant No. IR/SO/LU/0008/2011(SERB)]. We express our deepgratitude towards Director, NCL Pune for TEM analysis.
References
1 Y. Lia, W. Hea, J. Liua, F. Shenga, Z. Hua and X. Chen,Biochim. Biophys. Acta, 2005, 1722, 15–21.
2 D. Carter and J. X. Ho, Adv. Protein Chem., 1994, 45, 153–203.3 E. L. Gelamo, C. H. T. P. Silva, H. Imasato and M. Tabak,Biochim. Biophys. Acta, 2002, 1594, 84–99.
4 D. Gao, Y. Tian, S. Bi, Y. Chen, A. Yu and H. Zhang,Spectrochim. Acta, Part A, 2005, 62, 1203–1208.
5 X. M. He and D. C. Carter, Nature, 1992, 358, 209–215.6 D. Leis, S. Barbosa, D. Attwood, P. Taboada and V. Mosquera,Langmuir, 2002, 18, 8178–8185.
7 S. Mandala, M. Hossain, P. S. Devic, G. S. Kumar andK. Chaudhuri, J. Hazard. Mater., 2013, 248–249, 238–245.
RSC Adv., 2020, 10, 31400–31410 | 31409

RSC Advances Paper
Ope
n A
cces
s A
rtic
le. P
ublis
hed
on 2
6 A
ugus
t 202
0. D
ownl
oade
d on
1/2
8/20
22 3
:50:
39 A
M.
Thi
s ar
ticle
is li
cens
ed u
nder
a C
reat
ive
Com
mon
s A
ttrib
utio
n 3.
0 U
npor
ted
Lic
ence
.View Article Online
8 W. Darwich, C. Gedig, H. Srour, C. C. Santini andM. H. G. Precht, RSC Adv., 2013, 3, 20324–20331.
9 W. Wang, Y. Huang, S. Zhao, T. Shao and Y. Cheng, Chem.Commun., 2013, 49, 2234–2236.
10 M. Hasanzadeh, N. Shadjou and Md. Guardia, Trends Anal.Chem., 2017, 89, 119–132.
11 P. M. Tiwari, K. Vig, V. A. Dennis and S. R. Singh,Nanomaterials, 2011, 1, 31–63.
12 D. Gao, Y. Tian, S. Bi, Y. Chen, A. Yu and H. Zhang,Spectrochim. Acta, Part A, 2005, 62, 1203–1208.
13 W. Zhang, Q. Zhang, F. Wang, L. Yuan, Z. Xu, F. Jianga andY. Liu, Luminescence, 2015, 30, 397–404.
14 M. S. Ali, H. A. A. Lohedan, A. M. Atta, A. O. Ezzat andS. A. A. A. Hussain, J. Mol. Liq., 2015, 204, 248–254.
15 H. Alsamamra, I. Hawwarin, S. A. Sharkh and M. Abuteir, J.Bioanal. Biomed., 2018, 10, 43–49.
16 C. Wang, Q. H. Wu, C. R. Li, Z. Wang, J. J. Ma, X. H. Zang andN. X. Qin, Anal. Sci., 2007, 23, 429–433.
17 B. Hemmateenejad and S. Yousenejad, J. Mol. Struct., 2013,1037, 317–322.
18 T. Sen, S. Mandal, S. Haldar, K. Chattopadhyay and A. Patra,J. Phys. Chem. C, 2011, 115, 24037–24044.
19 J. Look, N. Wilhelm, N. V. Briesen, N. Noske, C. Gunther,K. Langer and E. Gorjup, Mol. Pharm., 2015, 12, 3202–3213.
20 H. Iranfar, O. Rajabi, R. Salari and J. Chamani, J. Phys. Chem.B, 2012, 116, 1951–1964.
21 X. Zhang, Z. Sun, Z. Cui and H. Li, Sens. Actuators, B, 2014,191, 313–319.
22 G. K. Darbha, A. K. Singh, U. S. Rai, E. Yu, H. Yu andP. C. Ray, J. Am. Chem. Soc., 2008, 130, 8038–8043.
23 C. Deraedt, L. Salmon, S. Gatard, R. Ciganda, R. Hernandez,J. Ruiza and D. Astruc, Chem. Commun., 2014, 50, 14194.
24 J. Shang and X. Gao, Chem. Soc. Rev., 2014, 43, 7267–7278.25 Y. Zhouab and J. Yoon, Chem. Soc. Rev., 2012, 41, 52–67.26 A. Ravindran, V. Mani, N. Chandrasekaran and
A. Mukherjee, Talanta, 2011, 85, 533–540.27 S. Sharma, N. Singh, E. Nepovimova, J. Korabecny, K. Kuca,
M. L. Satnami and K. K. Ghosh, J. Biomol. Struct. Dyn., 2020,38, 1822–1837.
28 B. Bakaeean, M. Kabiri, H. Iranfar, M. R. Saberi andJ. Chamani, J. Solution Chem., 2012, 41, 1777–1801.
29 A. Chakrabarty, A. Mallick, B. Haldar, P. Das andP. Chattophadhyay, Biomacromolecules, 2007, 8, 920–927.
30 S. Gupta, S. P. Singh and R. Singh, J. Microbiol. Biotechnol.,2015, 25, 612–619.
31 K. S. Hemath Naveen, G. Kumar, L. Karthik andK. V. Bhaskara Rao, Appl. Sci. Res., 2010, 2, 161–167.
32 R. Sahu, S. K. Vaishnav, I. Karbhal, M. L. Satnami andK. K. Ghosh, J. Mol. Liq., 2018, 255, 279–287.
33 S. Sinha, D. Tikariha, J. Lakra, T. Yadav, S. Kumari, S. K. Sahaand K. K. Ghosh, J. Mol. Liq., 2016, 218, 421–428.
31410 | RSC Adv., 2020, 10, 31400–31410
34 X. Wang, P. Wu, Y. Lv and X. Hou, Microchem. J., 2011, 99,327–331.
35 S. Bia, L. Dinga, Y. Tiana, D. Songa, X. Zhoua, X. Liua andH. Zhang, J. Mol. Struct., 2004, 703, 37–45.
36 D. Gao, Y. Tian, D. Bi, Y. Chen, A. Yu and H. Zhang,Spectrochim. Acta, Part A, 2005, 62, 1203–1208.
37 J. Mariam, P. M. Dongre and D. C. Kothari, J. Fluoresc., 2011,21, 2193–2199.
38 L. Y. Wang, Y. Y. Zhou, L. Wang, C. Q. Zhu, Y. X. Li andF. Gao, Anal. Chim. Acta, 2002, 466, 87–92.
39 L. Wang, A. Liang, H. Q. Chen, Y. L. B. Qian and J. Fu, Anal.Chim. Acta, 2008, 616, 170–176.
40 A. N. Liang, L. Wang, H. Q. Chen, B. B. Qian, B. Ling andJ. Fu, Talanta, 2010, 81, 438–443.
41 M. E. Pacheco and L. Bruzzone, J. Lumin., 2013, 137, 138–142.
42 H. A. Benesi and J. H. Hildebrand, J. Am. Chem. Soc., 1949,71, 2703–2707.
43 C. Q. Jiang, M. X. Gao and X. Z. Meng, Spectrochim. Acta, PartA, 2003, 59, 1605–1610.
44 J. D. Beric, S. D. Stojanovic, E. M. Mrkalic, Z. D. Matovic,D. R. Milovanovic, M. M. Sovrlic and R. M. Jelic, Monatsh.Chem., 2018, 149, 2359–2368.
45 Z. Q. Xu, Q. Q. Yang, J. Y. Lan, J. Q. Zhang, W. Peng, J. C. Jin,F. L. Jiang and Y. Liu, J. Hazard. Mater., 2016, 301, 242–249.
46 M. Bogdan, A. Pirnau, C. Floare and C. Bugeac, J. Pharm.Biomed. Anal., 2008, 47, 981–984.
47 M. M. Islam, S. Barik and M. Sarkar, J. Phys. Chem. B, 2019,123, 1512–1526.
48 X. M. He and D. C. Carter, Nature, 1992, 358, 209–215.49 I. Petitpas and A. A. Bhattacharya, J. Biol. Chem., 2001, 276,
22804–22809.50 G. Sudlow, D. J. Birkett and D. N. Wade, Mol. Pharmacol.,
1975, 11, 824–832.51 L. Y. Wang, Y. Y. Zhou, L. Wang, C. Q. Zhu, Y. X. Li and
F. Gao, Anal. Chim. Acta, 2002, 466, 87–92.52 Y. M. Chen, C. J. Yu, T. L. Cheng and W. L. Tseng, Langmuir,
2008, 24, 3654–3660.53 S. Wang, X. Hu, L. Tan, Q. Liao and Z. Chen,Microchim. Acta,
2016, 183, 3135–3141.54 F. Rohrbach, H. Karadeniz, A. Erdem, M. Famulok and
G. Mayer, Anal. Biochem., 2012, 421, 454–459.55 P. R. Yeh and W. L. Tseng, J. Chromatogr., 2012, 1268, 166–
172.56 N. Wangoo, C. R. Suri and G. Shekhawat, Appl. Phys. Lett.,
2008, 92, 133104.57 K. Shrivas, S. Sahu, A. Ghorai and R. Shankar, Microchim.
Acta, 2016, 183, 827–836.58 X. Zhang, Z. Sun, Z. Cui and H. Li, Sens. Actuators, B, 2014,
191, 313–319.
This journal is © The Royal Society of Chemistry 2020