thermographic and vibration control maintenance …
TRANSCRIPT

A u t h o r : Vladislav Goncharov
THERMOGRAPHIC AND
VIBRATION CONTROL
MAINTENANCE IN A CHP
POWER PLANT
Final thesis
OPINNÄYTETYÖ - AMMATTIKORKEAKOULUTUTKINTO
TEKNIIKAN JA LIIKENTEEN ALA

SAVONIA UNIVERSITY OF APPLIED SCIENCES THESIS Abstract
Field of Study Technology, Communication and Transport Degree Programme Degree Programme in Industrial Management
Author(s) Vladislav Goncharov Title of Thesis Thermographic and Vibration Control Maintenance in a CHP Power Plant
Date Pages/Appendices
Supervisor(s) Heikki Salkinoja Olli-Pekka Kähkönen Client Organisation/Partners Savonia University of Applied Sciences Abstract Nowadays global economy faces more demand for energy and plants must meet the demand in the most efficient way. Energy industry in Russia has an extreme need for development and change of old-fashioned way of maintenance and management. In the nearest future with its new technolo-gies and inventions that way may cause big problems and losses in the whole energy system all over the Russian Federation and also in the nearest countries. Owners of such plants can’t afford costly shutdowns and also it is a question of safety for workers and citizens nearby. Right and efficient maintenance is key component in every factory or power plant to produce cheap and safe energy and provide it for customers. In the Thesis maintenance problems in a CHP power plant are reviewed. The plant in question is located in Petrozavodsk, Russia where the author was working during his practical training. Vibra-tion and Thermography control is a modern and effective method which is commonly used in Eu-rope.
Keywords Thermography, Vibration, Maintenance, Power plant
CONTENTS
LIST OF FIGURES ............................................................................................... 5
LIST OF ABBREVIATIONS AND SYMBOLS .............................................................. 6
1 INTRODUCTION ............................................................................................. 7
2 MAINTENANCE ............................................................................................... 8
2.1 Technical diagnostics ................................................................................ 8
3 VIBRATION DIGNOSTICS ............................................................................... 10
3.1 Vibration theory ...................................................................................... 10
3.2 Equipment for vibration control ................................................................ 11
3.2.1 Portable tools ................................................................................ 11
3.3 Methods of vibration control ..................................................................... 14
3.4 Online condition monitoring systems ......................................................... 17
4 THERMOGRAPHIC DIAGNOSTICS .................................................................... 19
4.1 Theory ................................................................................................... 19
4.2 IR camera usage ..................................................................................... 20
5 INPECTIONS AND MAINTENANCE ................................................................... 24
6 ECONOMICAL POINT ..................................................................................... 25
7 IMPLEMENTATION AND EXISTING SYSTEM ..................................................... 27
7.1 Equipment that was saved ....................................................................... 27
8 CONCLUSION ................................................................................................ 29
REFERENCES ..................................................................................................... 30
5
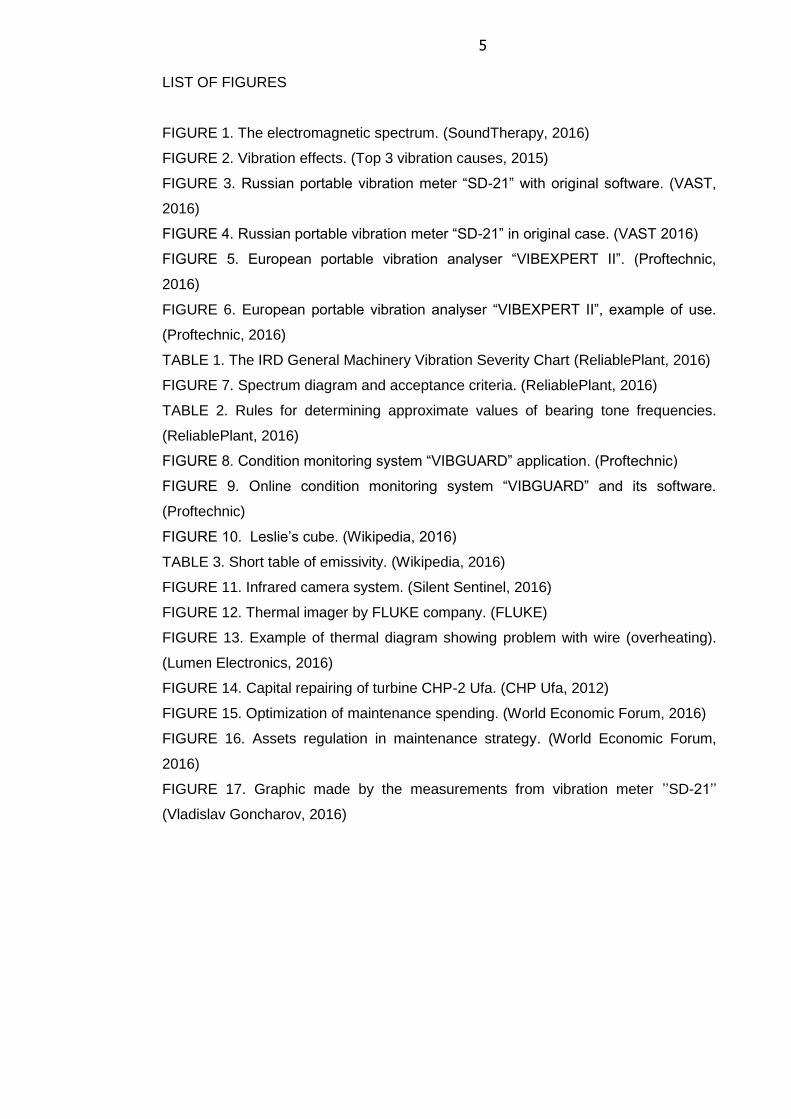
LIST OF FIGURES FIGURE 1. The electromagnetic spectrum. (SoundTherapy, 2016)
FIGURE 2. Vibration effects. (Top 3 vibration causes, 2015)
FIGURE 3. Russian portable vibration meter “SD-21” with original software. (VAST,
2016)
FIGURE 4. Russian portable vibration meter “SD-21” in original case. (VAST 2016)
FIGURE 5. European portable vibration analyser “VIBEXPERT II”. (Proftechnic,
2016)
FIGURE 6. European portable vibration analyser “VIBEXPERT II”, example of use.
(Proftechnic, 2016)
TABLE 1. The IRD General Machinery Vibration Severity Chart (ReliablePlant, 2016)
FIGURE 7. Spectrum diagram and acceptance criteria. (ReliablePlant, 2016)
TABLE 2. Rules for determining approximate values of bearing tone frequencies.
(ReliablePlant, 2016)
FIGURE 8. Condition monitoring system “VIBGUARD” application. (Proftechnic)
FIGURE 9. Online condition monitoring system “VIBGUARD” and its software.
(Proftechnic)
FIGURE 10. Leslie’s cube. (Wikipedia, 2016)
TABLE 3. Short table of emissivity. (Wikipedia, 2016)
FIGURE 11. Infrared camera system. (Silent Sentinel, 2016)
FIGURE 12. Thermal imager by FLUKE company. (FLUKE)
FIGURE 13. Example of thermal diagram showing problem with wire (overheating).
(Lumen Electronics, 2016)
FIGURE 14. Capital repairing of turbine CHP-2 Ufa. (CHP Ufa, 2012)
FIGURE 15. Optimization of maintenance spending. (World Economic Forum, 2016)
FIGURE 16. Assets regulation in maintenance strategy. (World Economic Forum,
2016)
FIGURE 17. Graphic made by the measurements from vibration meter ’’SD-21’’
(Vladislav Goncharov, 2016)
6
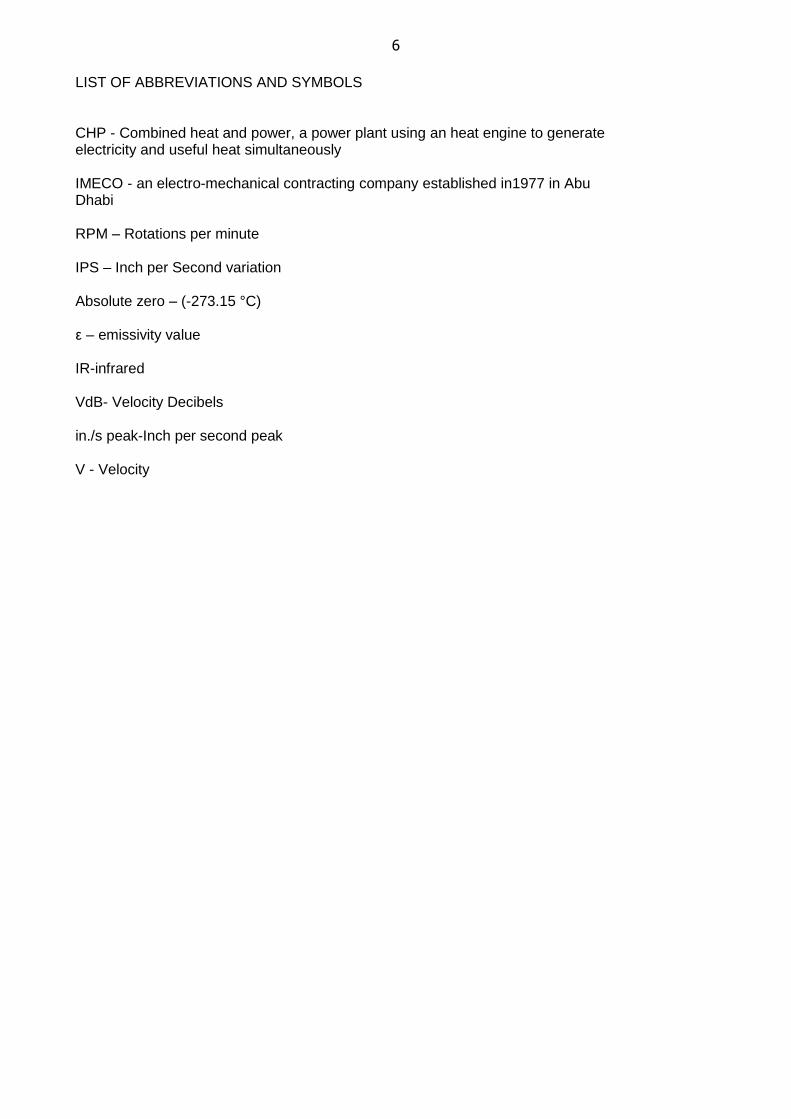
LIST OF ABBREVIATIONS AND SYMBOLS CHP - Combined heat and power, a power plant using an heat engine to generate electricity and useful heat simultaneously IMECO - an electro-mechanical contracting company established in1977 in Abu Dhabi RPM – Rotations per minute IPS – Inch per Second variation Absolute zero – (-273.15 °C) ε – emissivity value IR-infrared VdB- Velocity Decibels in./s peak-Inch per second peak V - Velocity
7
1 INTRODUCTION
Nowadays the most actual and important problem of industry is how to increase
quality and reliability of equipment in every field of industry. The problem is caused by
continuous increase of installed power at any factory, power plant or industrial com-
plex. Also it is caused by equipping them by modern, complicated and innovative
systems of maintenance and management.
Certainly traditional ways of increasing reliability are known widely such as upgrading
different units, optimization of processes or half-power equipment usage. Those
methods can only be applied to low-power systems.
However in most industrial areas it has not been possible to apply the methods due
to restrictions caused by dimensions and mass. Consequently this leads to search of
new ways for solving problems with reliability and resource.
One of such development options can be preventive maintenance system that al-
ready gets high positions all over the world. Nondestructive testing and modern
equipment gives the engineer opportunity to look inside the equipment without disas-
sembling it and get all the data at the same time. Infrared camera and vibration ana-
lyzer are the most usable and common tools for such important job as Power plant
maintenance. Professional and certified uses are the key point to efficient and safe
maintenance. In such a huge and dangerous industry every fault can cause serious
damage, human casualties or losses of millions of dollar.
In the thesis advantages of preventive maintenance and its main features are pre-
sented.
8
2 MAINTENANCE
Until recently machinery and equipment were used either until breakdown or there
was scheduled repairing called preventing maintenance. In the first case of using
equipment until breakdown only cheap equipment can be used and at observance of
existing backup systems. Second case of preventive maintenance got wide distribu-
tion all over the world. That caused impossibility of backup system usage, expensive
equipment and big losses in case of unpredicted breakdowns.
Certain interval of time is the only thing that determines this method. Interval of
maintenance can be measured by statistics of usage of the same equipment, its his-
tory and its load. But for most of equipment preventing maintenance does not prevent
unexpected breakdowns. Reliability of machinery can be lowered after scheduled
maintenance because of assembly defects made by workers. It’s obvious that in-
crease of performance, stability and resources and also safe usage of machinery are
tightly connected with right and timely evaluation of its technical condition.
That was the key to foundation of new scientific direction – technical diagnostics.
2.1 Technical diagnostics
Technical diagnostics is a branch of science studying and inventing methods that
help to evaluate and predict technical condition of equipment without its disassembly.
It’s worth mentioning that some methods of evaluating technical condition already
existed but the information about mechanisms it was limited and in very small cases
was possible to find out damage caused.
Invention of automatic systems of monitoring, control and diagnostics brought tech-
nical diagnostics to higher level. That helps to prevent difficult and expensive repair-
ing, lowers laboriousness and time of maintenance. Eventually that leads to decrease
of operational costs.
Usually in complicated machines and aggregates operational costs exceed manufac-
turing costs several times. For example in car industry that will be 7 times more and
in industrial machinery that number will be always more than 8.
9
According to IMECO, laboriousness and repairing time can be decreased by up to
40% and fuel by consumption up to 4% only because of diagnostics tools implemen-
tation?
Those things help the industry in many aspects:
Increase of durability and reliability of machines and equipment
Preventing emergency situations
Increase of performance and production output
Forecasting equipment resources
Decrease of time and money consumption for maintenance
Decrease of needed staff
Optimizing spare parts quantity
Thus safety usage, reliability increase and cost reduction are impossible nowadays
without a wide use of technical diagnostics. That method gives an opportunity to get
significant economic benefits and ability to use preventive maintenance.
10
3 VIBRATION DIGNOSTICS
Every CHP power plant has plenty of rotating equipment, engines, turbines and bear-
ings. The most efficient and common way to check the condition of those aggregates
is to analyze the vibration level. So it can be said that vibration diagnostics are used
to identify the root reason of vibration or noise problems.
3.1 Vibration theory
Vibration is a mechanical phenomenon whereby oscillations occur about an equilibri-
um point. Vibration can be classified into two types: desirable or undesirable. Desira-
ble vibration means type of vibration that humans use in their lives. Most common
vibration produces loudspeaker: sound that we hear is also kind of vibration in differ-
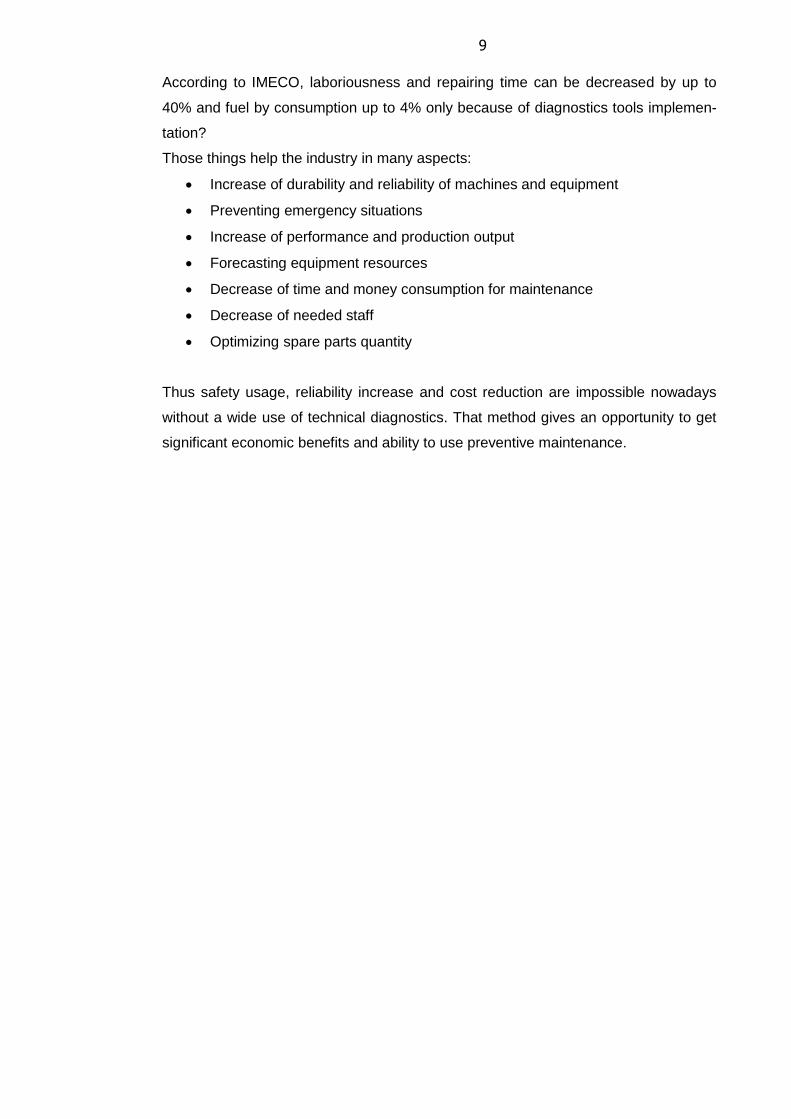
ent frequencies. It is also known that everything around us has its own frequency and
vibrates even if it’s not possible to feel it. The example of how the frequencies spread
into spectrum can be seen in the Figure 1.
FIGURE 1. The electromagnetic spectrum. (SoundTherapy, 2016)
On the other hand there are many types of harmful vibrations such as imbalanced
motor vibration. They all waste energy, create unwanted sound or even destroy parts
or mechanisms. For all rotating parts all kind of vibration is harmful and dangerous.
Only careful design, perfect manufacturing and qualified maintenance may cause
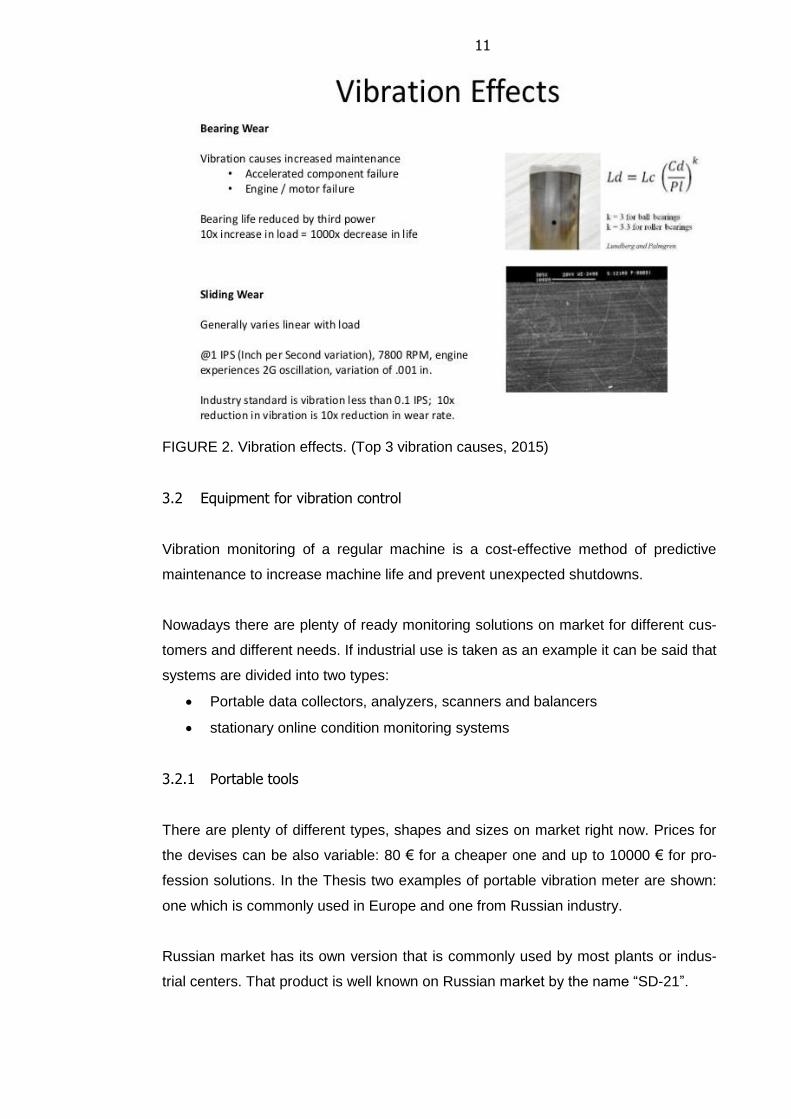
long-life of equipment like shown in Figure 2.
11
FIGURE 2. Vibration effects. (Top 3 vibration causes, 2015)
3.2 Equipment for vibration control
Vibration monitoring of a regular machine is a cost-effective method of predictive
maintenance to increase machine life and prevent unexpected shutdowns.
Nowadays there are plenty of ready monitoring solutions on market for different cus-
tomers and different needs. If industrial use is taken as an example it can be said that
systems are divided into two types:
Portable data collectors, analyzers, scanners and balancers
stationary online condition monitoring systems
3.2.1 Portable tools
There are plenty of different types, shapes and sizes on market right now. Prices for
the devises can be also variable: 80 € for a cheaper one and up to 10000 € for pro-
fession solutions. In the Thesis two examples of portable vibration meter are shown:
one which is commonly used in Europe and one from Russian industry.
Russian market has its own version that is commonly used by most plants or indus-
trial centers. That product is well known on Russian market by the name “SD-21”.
12
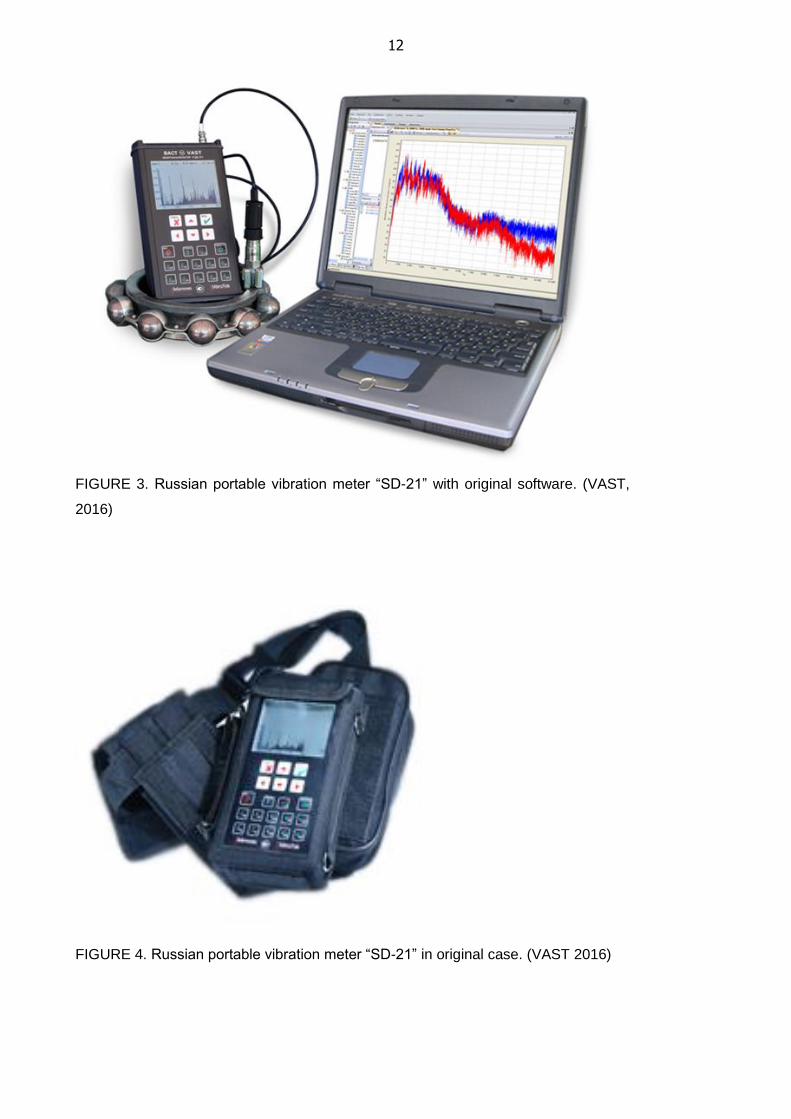
FIGURE 3. Russian portable vibration meter “SD-21” with original software. (VAST,
2016)
FIGURE 4. Russian portable vibration meter “SD-21” in original case. (VAST 2016)
13
In pictures 3 and 4 is shown ready vibration analyzer that is right now used in CHP
plant in Petrozavodsk. That fully digital device that can collect data has its own
memory and battery and at the same time it can analyze the data. Also it works as
field balancer. Easily connected to computer with the help of software “DREAM” can
give wide and exact information about rotation part you have tested before. That pro-
gram has its own algorithms for automatic problem detection and all the equipment
and bearing types are pre-installed. Nowadays price varies for 7000 € to 10000 €
depending on seller, delivery options and software.
As for European market the choice of such equipment is so wide that you hardly can
understand the difference between companies. For a long time and still nowadays
German engineering companies were well known all over the world by their perfect
quality.
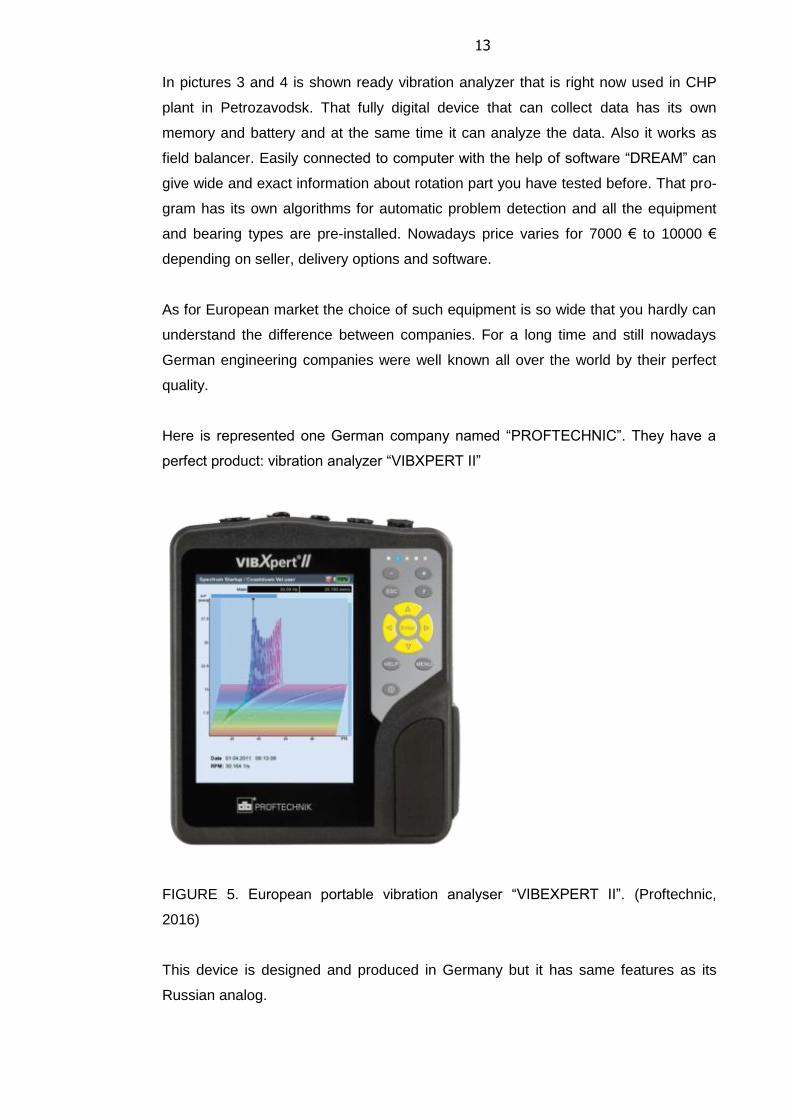
Here is represented one German company named “PROFTECHNIC”. They have a
perfect product: vibration analyzer “VIBXPERT II”
FIGURE 5. European portable vibration analyser “VIBEXPERT II”. (Proftechnic,
2016)
This device is designed and produced in Germany but it has same features as its
Russian analog.
14
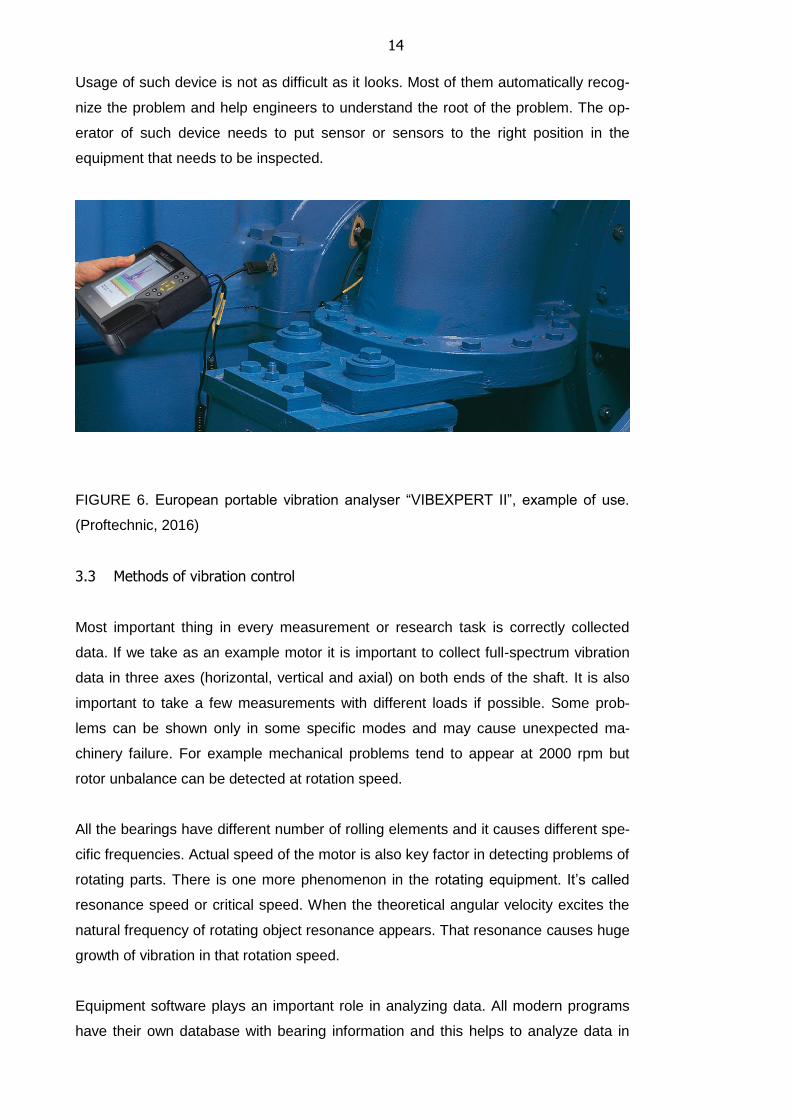
Usage of such device is not as difficult as it looks. Most of them automatically recog-
nize the problem and help engineers to understand the root of the problem. The op-
erator of such device needs to put sensor or sensors to the right position in the
equipment that needs to be inspected.
FIGURE 6. European portable vibration analyser “VIBEXPERT II”, example of use.
(Proftechnic, 2016)
3.3 Methods of vibration control
Most important thing in every measurement or research task is correctly collected
data. If we take as an example motor it is important to collect full-spectrum vibration
data in three axes (horizontal, vertical and axial) on both ends of the shaft. It is also
important to take a few measurements with different loads if possible. Some prob-
lems can be shown only in some specific modes and may cause unexpected ma-
chinery failure. For example mechanical problems tend to appear at 2000 rpm but
rotor unbalance can be detected at rotation speed.
All the bearings have different number of rolling elements and it causes different spe-
cific frequencies. Actual speed of the motor is also key factor in detecting problems of
rotating parts. There is one more phenomenon in the rotating equipment. It’s called
resonance speed or critical speed. When the theoretical angular velocity excites the
natural frequency of rotating object resonance appears. That resonance causes huge
growth of vibration in that rotation speed.
Equipment software plays an important role in analyzing data. All modern programs
have their own database with bearing information and this helps to analyze data in
15
automatic mode, and to give ready repair report. It is also important to inspect the
whole assembly (motor – driven equipment) because of resonance problems. They
are usually typical for such assemblies in which vibration frequency of one part is
close to the natural frequency of the entire system.
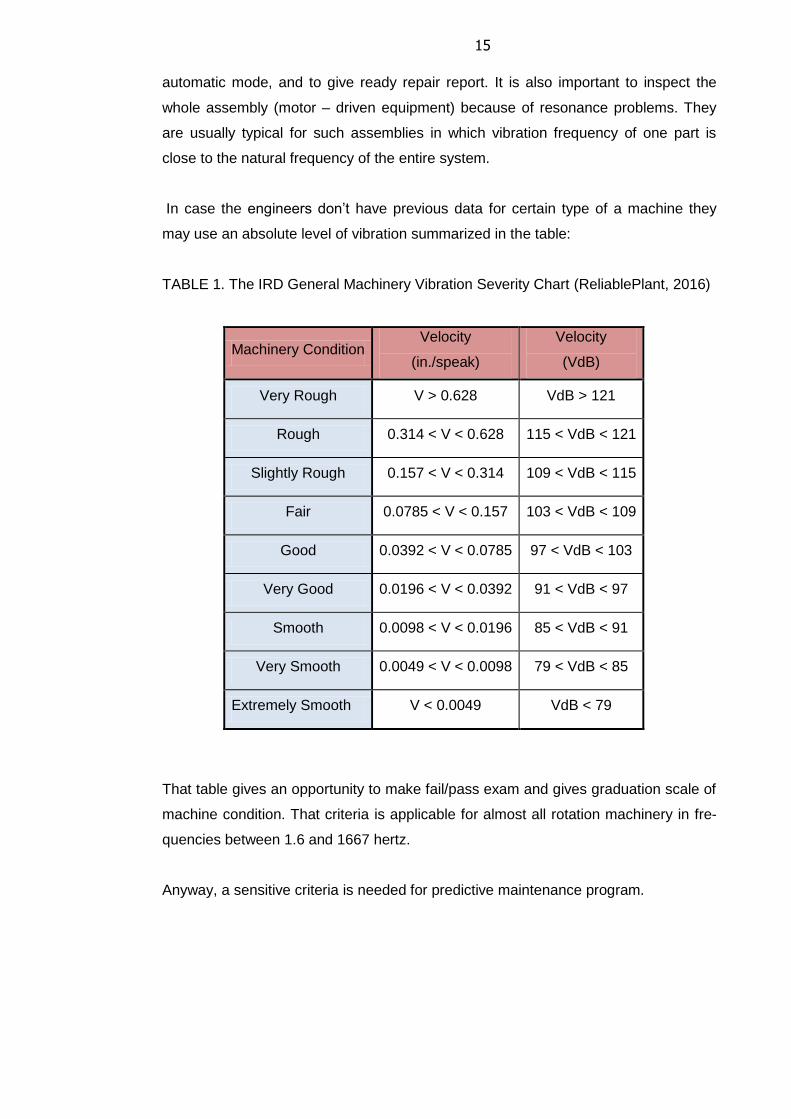
In case the engineers don’t have previous data for certain type of a machine they
may use an absolute level of vibration summarized in the table:
TABLE 1. The IRD General Machinery Vibration Severity Chart (ReliablePlant, 2016)
Machinery Condition Velocity
(in./speak)
Velocity
(VdB)
Very Rough V > 0.628 VdB > 121
Rough 0.314 < V < 0.628 115 < VdB < 121
Slightly Rough 0.157 < V < 0.314 109 < VdB < 115
Fair 0.0785 < V < 0.157 103 < VdB < 109
Good 0.0392 < V < 0.0785 97 < VdB < 103
Very Good 0.0196 < V < 0.0392 91 < VdB < 97
Smooth 0.0098 < V < 0.0196 85 < VdB < 91
Very Smooth 0.0049 < V < 0.0098 79 < VdB < 85
Extremely Smooth V < 0.0049 VdB < 79
That table gives an opportunity to make fail/pass exam and gives graduation scale of
machine condition. That criteria is applicable for almost all rotation machinery in fre-
quencies between 1.6 and 1667 hertz.
Anyway, a sensitive criteria is needed for predictive maintenance program.
16
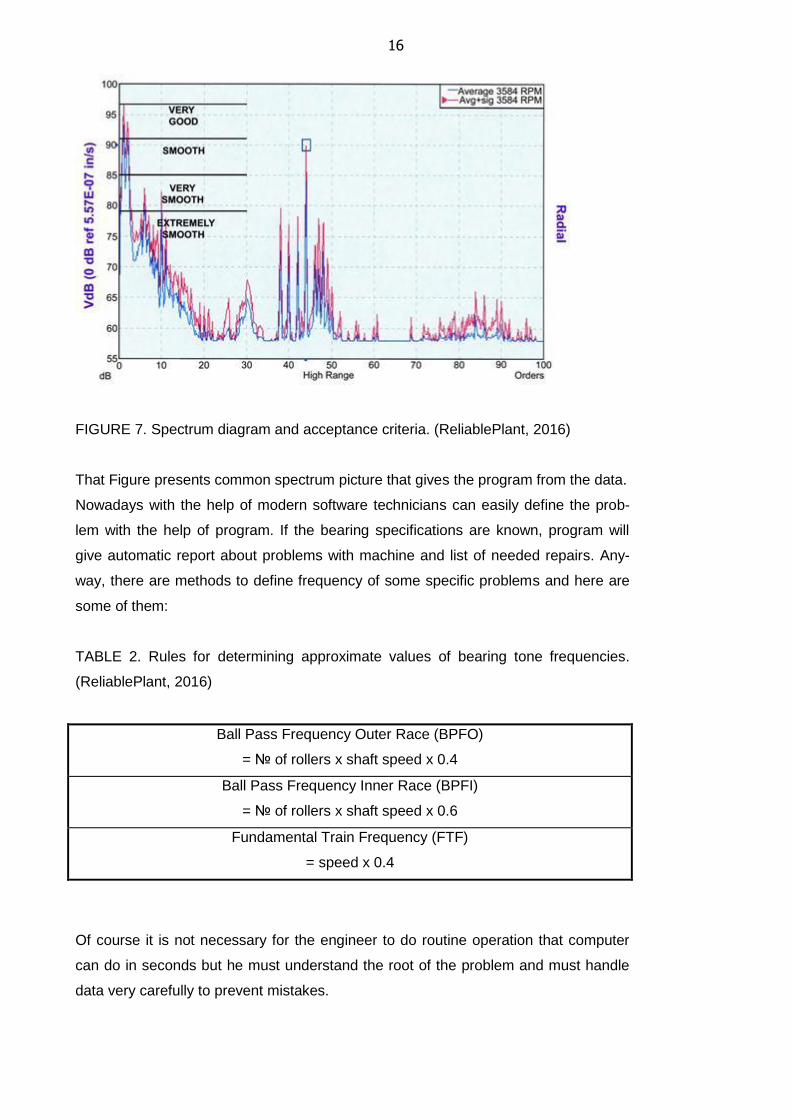
FIGURE 7. Spectrum diagram and acceptance criteria. (ReliablePlant, 2016)
That Figure presents common spectrum picture that gives the program from the data.
Nowadays with the help of modern software technicians can easily define the prob-
lem with the help of program. If the bearing specifications are known, program will
give automatic report about problems with machine and list of needed repairs. Any-
way, there are methods to define frequency of some specific problems and here are
some of them:
TABLE 2. Rules for determining approximate values of bearing tone frequencies.
(ReliablePlant, 2016)
Ball Pass Frequency Outer Race (BPFO)
= № of rollers x shaft speed x 0.4
Ball Pass Frequency Inner Race (BPFI)
= № of rollers x shaft speed x 0.6
Fundamental Train Frequency (FTF)
= speed x 0.4
Of course it is not necessary for the engineer to do routine operation that computer
can do in seconds but he must understand the root of the problem and must handle
data very carefully to prevent mistakes.
17
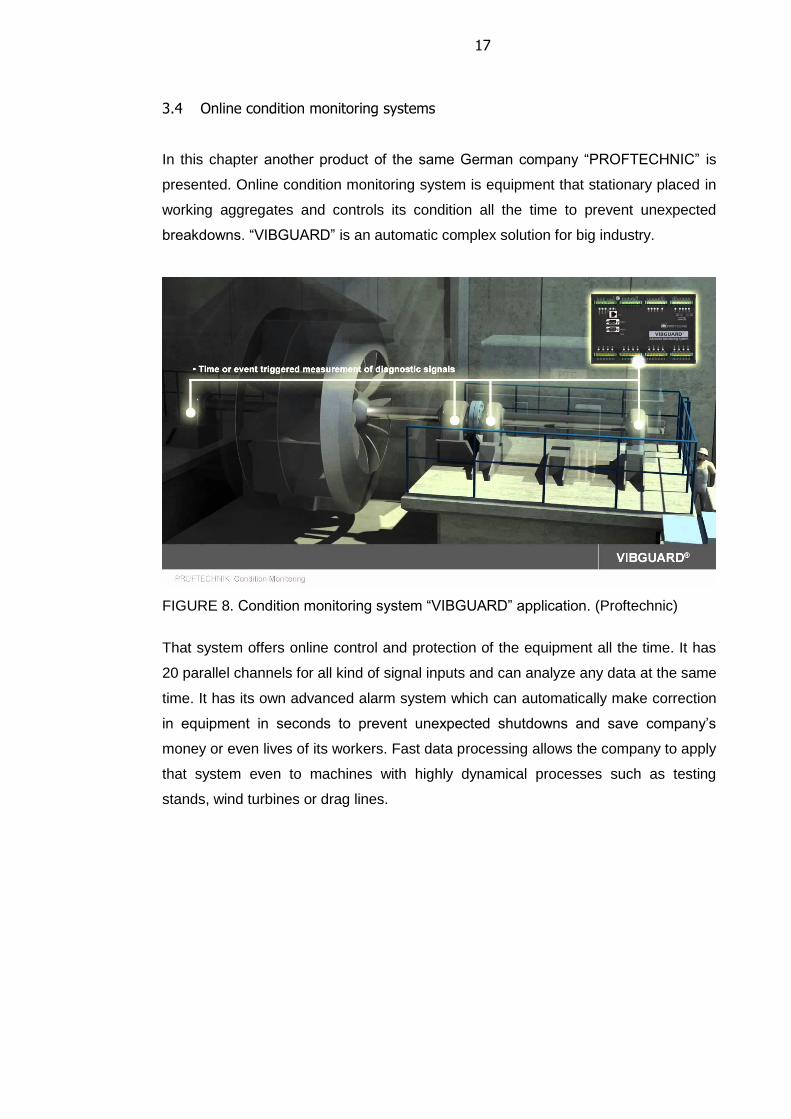
3.4 Online condition monitoring systems
In this chapter another product of the same German company “PROFTECHNIC” is
presented. Online condition monitoring system is equipment that stationary placed in
working aggregates and controls its condition all the time to prevent unexpected
breakdowns. “VIBGUARD” is an automatic complex solution for big industry.
FIGURE 8. Condition monitoring system “VIBGUARD” application. (Proftechnic)
That system offers online control and protection of the equipment all the time. It has
20 parallel channels for all kind of signal inputs and can analyze any data at the same
time. It has its own advanced alarm system which can automatically make correction
in equipment in seconds to prevent unexpected shutdowns and save company’s
money or even lives of its workers. Fast data processing allows the company to apply
that system even to machines with highly dynamical processes such as testing
stands, wind turbines or drag lines.
18
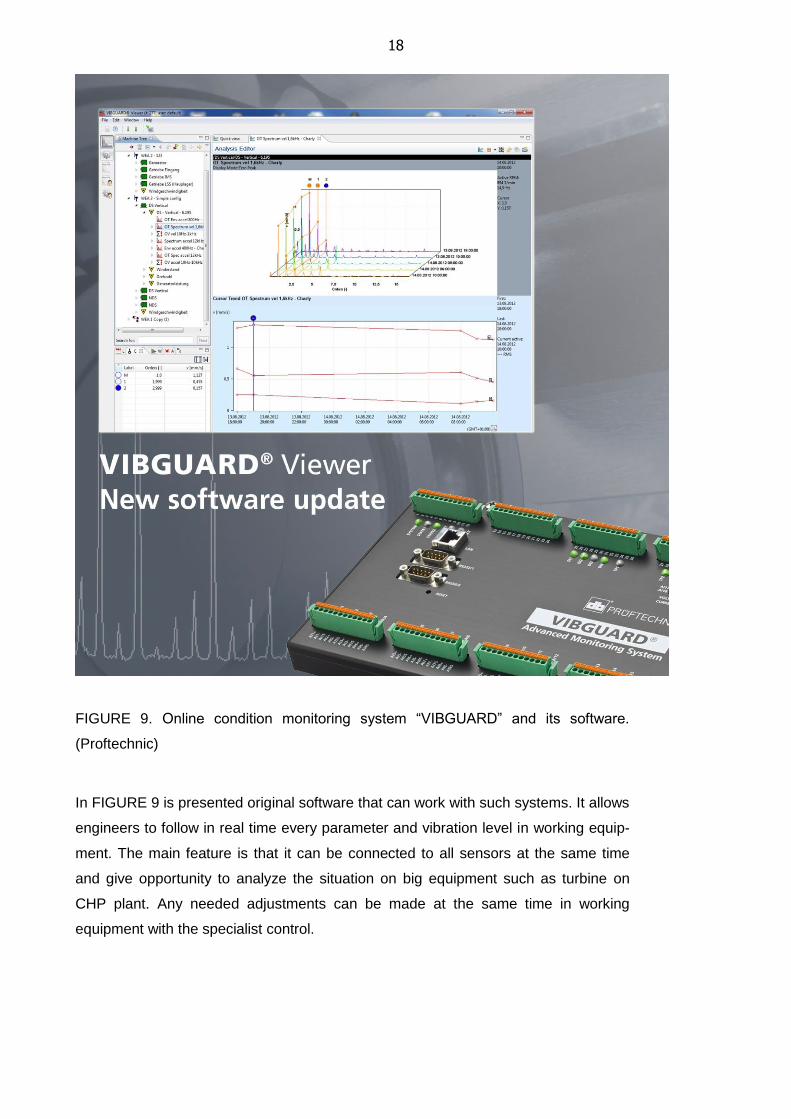
FIGURE 9. Online condition monitoring system “VIBGUARD” and its software.
(Proftechnic)
In FIGURE 9 is presented original software that can work with such systems. It allows
engineers to follow in real time every parameter and vibration level in working equip-
ment. The main feature is that it can be connected to all sensors at the same time
and give opportunity to analyze the situation on big equipment such as turbine on
CHP plant. Any needed adjustments can be made at the same time in working
equipment with the specialist control.
19
4 THERMOGRAPHIC DIAGNOSTICS
Another very important part of CHP power plant is electrical distribution system.
There are hundreds types of switchgear, transformers, breaker panels, cabinets and
equipment connectors on every typical power plant in every place on earth?. Each
unit can have potential risk of accident or breakdown. To minimize the risks and con-
trol equipment quality in plant maintenance engineers use special tool - thermografic
scanner or IR scanner.
4.1 Theory
In the base of IR thermography lays a physical phenomenon that all the bodies emit
electromagnetic radiation in its temperature more than absolute zero. Every surface
has its own emissivity depending on material it’s made of and helps to identify its
temperature in non-contact way. Emissivity is its effectiveness in emitting energy as
thermal radiation. That ratio varies from 0 to 1 and means that surface with value 1
has 100%, 0.8 has 80% emissivity.
ε – Means emissivity value.
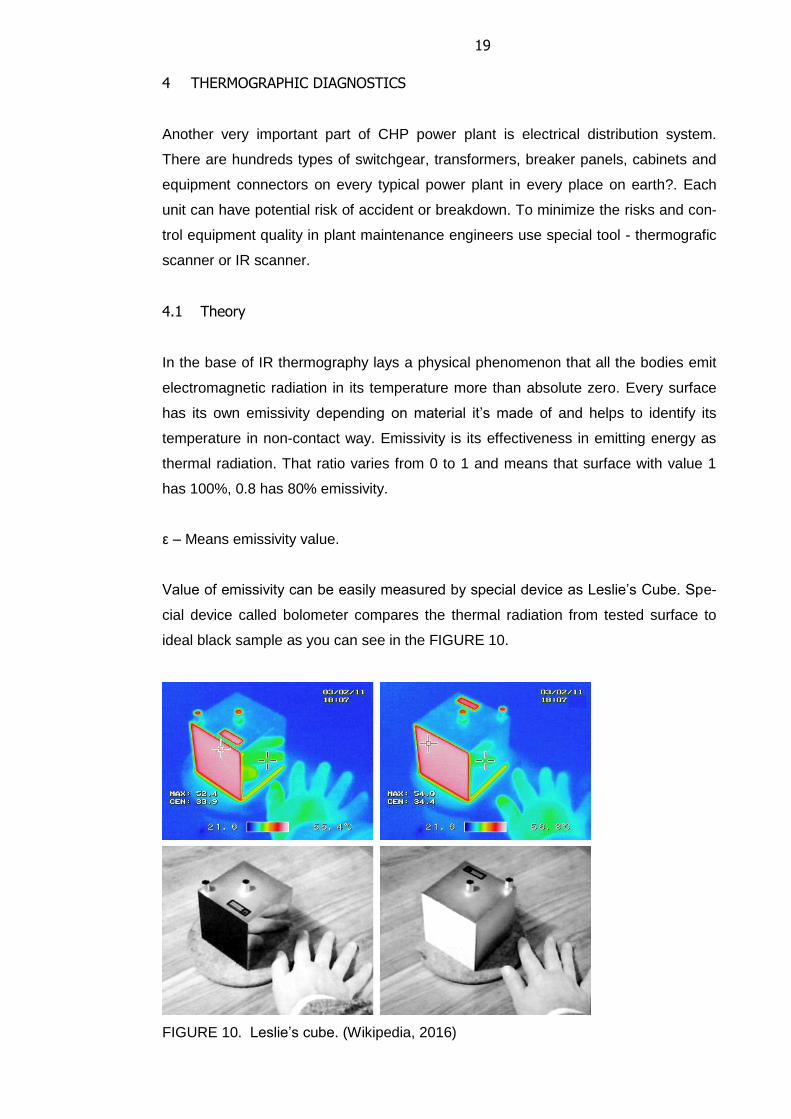
Value of emissivity can be easily measured by special device as Leslie’s Cube. Spe-
cial device called bolometer compares the thermal radiation from tested surface to
ideal black sample as you can see in the FIGURE 10.
FIGURE 10. Leslie’s cube. (Wikipedia, 2016)
20
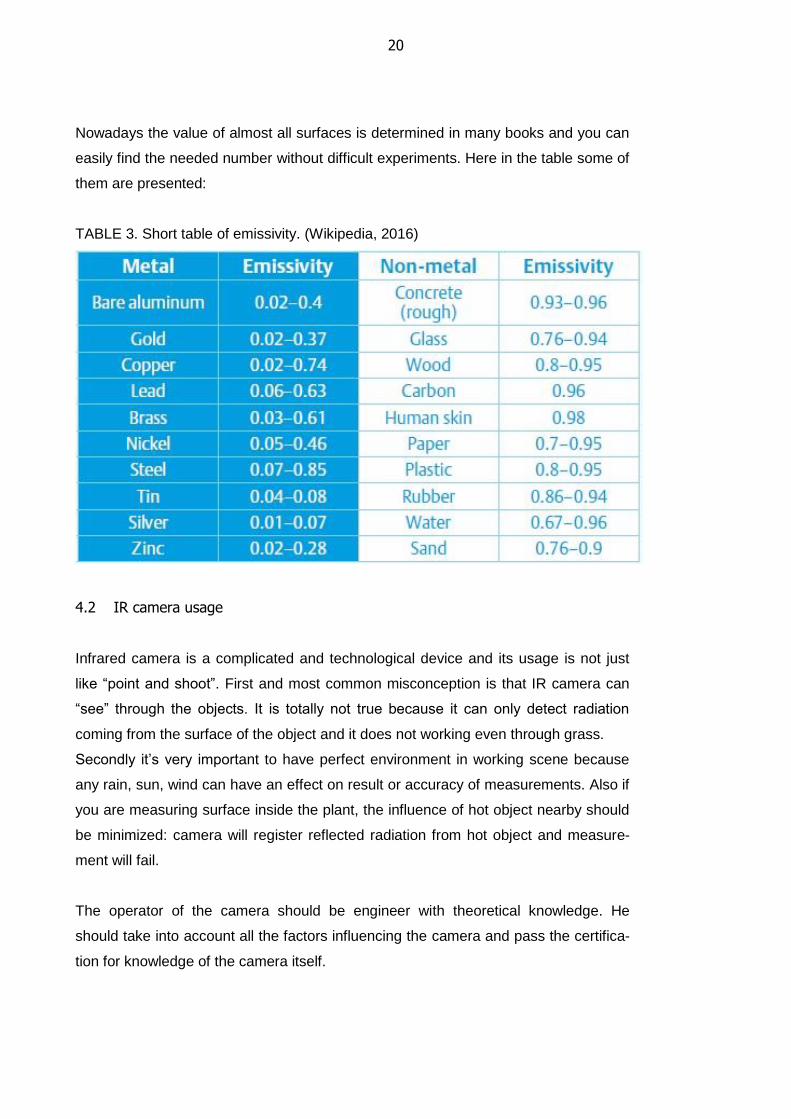
Nowadays the value of almost all surfaces is determined in many books and you can
easily find the needed number without difficult experiments. Here in the table some of
them are presented:
TABLE 3. Short table of emissivity. (Wikipedia, 2016)
4.2 IR camera usage
Infrared camera is a complicated and technological device and its usage is not just
like “point and shoot”. First and most common misconception is that IR camera can
“see” through the objects. It is totally not true because it can only detect radiation
coming from the surface of the object and it does not working even through grass.
Secondly it’s very important to have perfect environment in working scene because
any rain, sun, wind can have an effect on result or accuracy of measurements. Also if
you are measuring surface inside the plant, the influence of hot object nearby should
be minimized: camera will register reflected radiation from hot object and measure-
ment will fail.
The operator of the camera should be engineer with theoretical knowledge. He
should take into account all the factors influencing the camera and pass the certifica-
tion for knowledge of the camera itself.
21
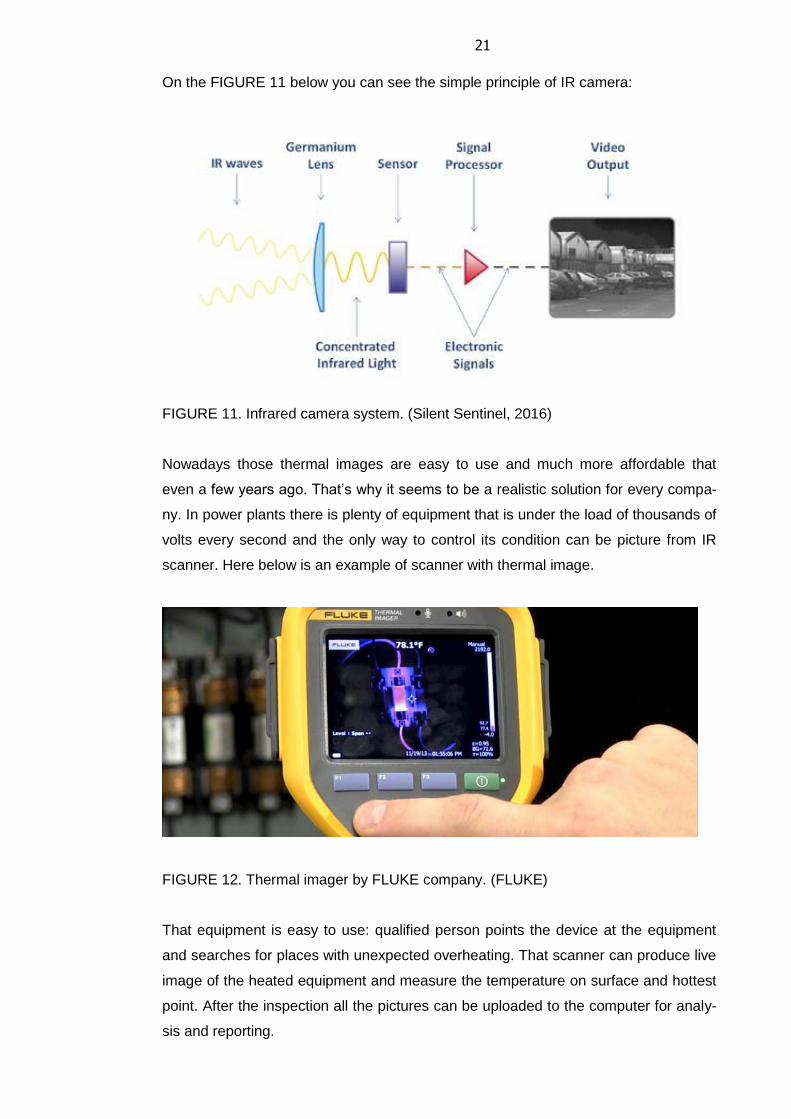
On the FIGURE 11 below you can see the simple principle of IR camera:
FIGURE 11. Infrared camera system. (Silent Sentinel, 2016)
Nowadays those thermal images are easy to use and much more affordable that
even a few years ago. That’s why it seems to be a realistic solution for every compa-
ny. In power plants there is plenty of equipment that is under the load of thousands of
volts every second and the only way to control its condition can be picture from IR
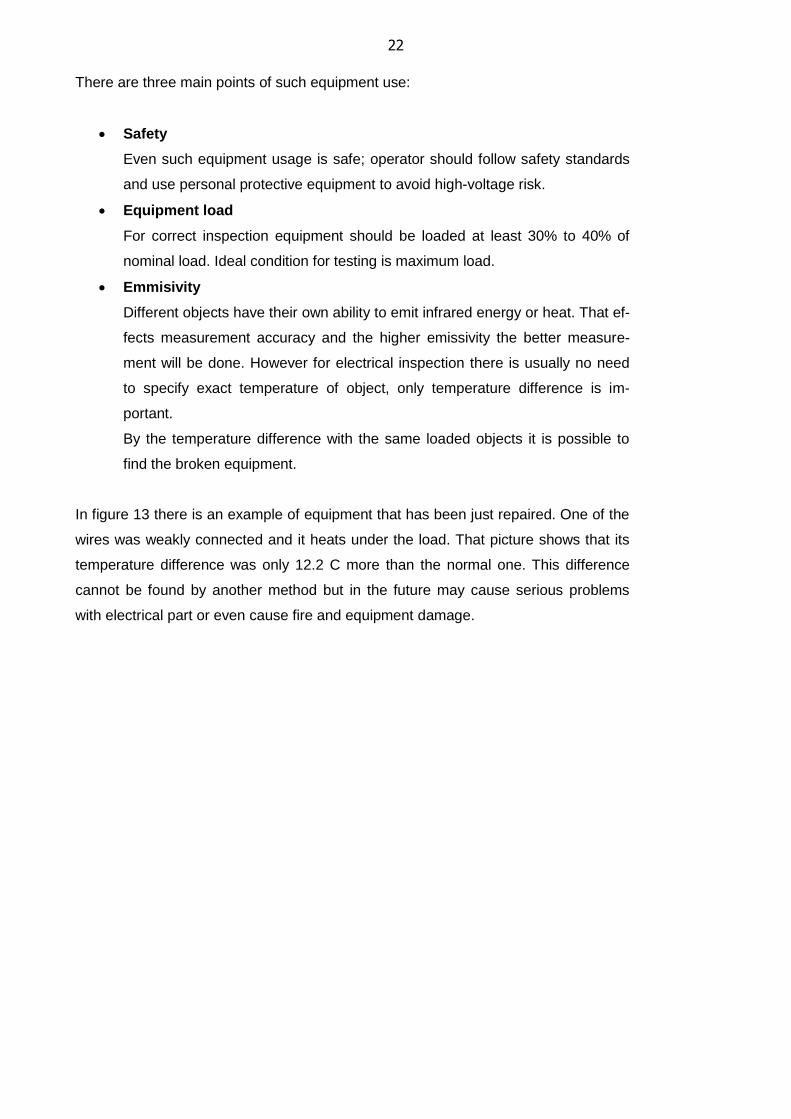
scanner. Here below is an example of scanner with thermal image.
FIGURE 12. Thermal imager by FLUKE company. (FLUKE)
That equipment is easy to use: qualified person points the device at the equipment
and searches for places with unexpected overheating. That scanner can produce live
image of the heated equipment and measure the temperature on surface and hottest
point. After the inspection all the pictures can be uploaded to the computer for analy-
sis and reporting.
22
There are three main points of such equipment use:
Safety
Even such equipment usage is safe; operator should follow safety standards
and use personal protective equipment to avoid high-voltage risk.
Equipment load
For correct inspection equipment should be loaded at least 30% to 40% of
nominal load. Ideal condition for testing is maximum load.
Emmisivity
Different objects have their own ability to emit infrared energy or heat. That ef-
fects measurement accuracy and the higher emissivity the better measure-
ment will be done. However for electrical inspection there is usually no need
to specify exact temperature of object, only temperature difference is im-
portant.
By the temperature difference with the same loaded objects it is possible to
find the broken equipment.
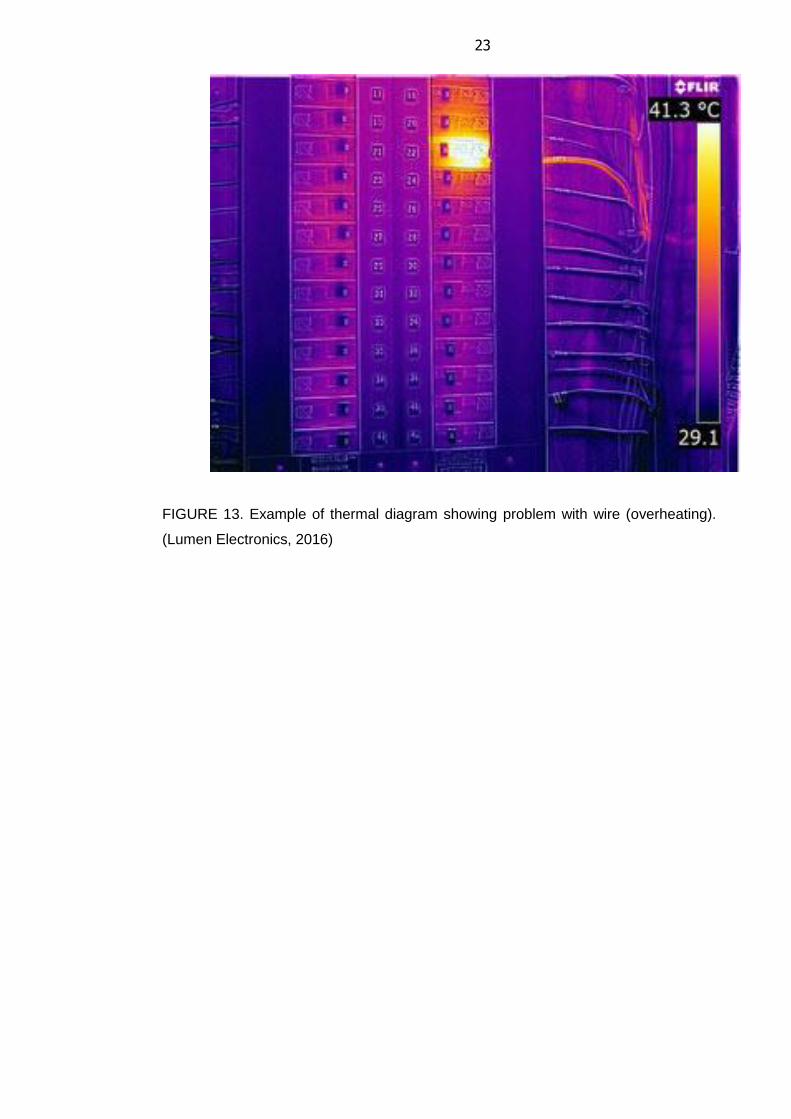
In figure 13 there is an example of equipment that has been just repaired. One of the
wires was weakly connected and it heats under the load. That picture shows that its
temperature difference was only 12.2 C more than the normal one. This difference
cannot be found by another method but in the future may cause serious problems
with electrical part or even cause fire and equipment damage.
23
FIGURE 13. Example of thermal diagram showing problem with wire (overheating).
(Lumen Electronics, 2016)
24
5 INPECTIONS AND MAINTENANCE
Two main methods of technical diagnostics mentioned above can’t live without highly
qualified engineers and well-designed inspection system. Also they should have
close integration and cooperation with all existing maintenance systems.
Most CHP plants in Russia have now scheduled maintenance system and are just
trying to apply technical diagnostics in that system.
Scheduled maintenance consists of three parts according to the repairing volume:
Actual maintenance
That type of maintenance includes solving of actual problems and repairing
after breakdowns
Middle maintenance
Consists of solving actual problems but with parts changing and all needed
part recovery
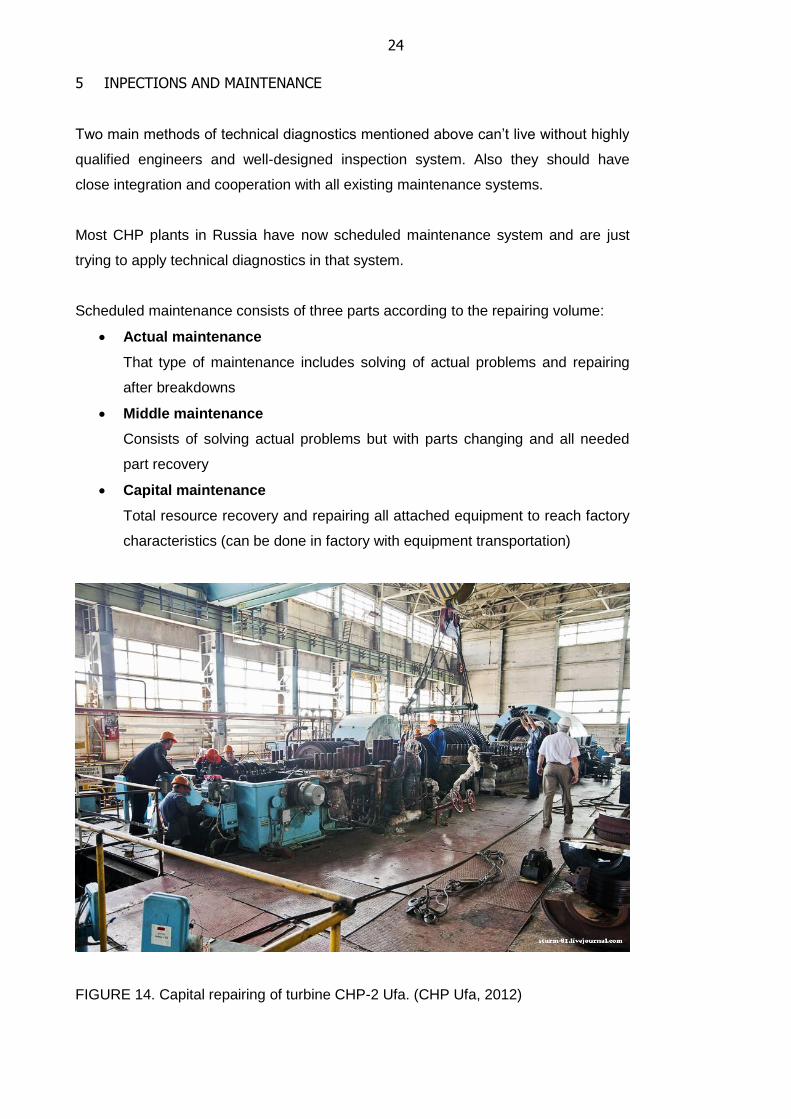
Capital maintenance
Total resource recovery and repairing all attached equipment to reach factory
characteristics (can be done in factory with equipment transportation)
FIGURE 14. Capital repairing of turbine CHP-2 Ufa. (CHP Ufa, 2012)
25
6 ECONOMICAL POINT
It’s obvious that preventive system of maintenance saves a huge amount of money
by preventing shutdowns and serious accidents but another side of the coin is that
the equipment for such maintenance is very expensive and highly-qualified workers
are needed to operate it. Company needs to set totally new department of qualified
engineer and buy them modern equipment. Also all the inspections are conducted
very often need big amount of human and economic resources.
But anyway it is obvious that improvement of preventive maintenance is the main key
to well-balanced and effective maintenance system. It gives many features to power
plant and saves a lot of money.
Here are direct advantage by the preventive maintenance and how it helps from eco-
nomical view point:
Lifetime of expensive and complicated equipment can be increased by up to 5-10
extra years of use.
Maintenance period can be increased by up to 15-30%
Reduction of reserve equipment
Total savings from the right maintenance system can be between 2-10% depending
on equipment type. Moreover there are indirect cost-cutting measures such as ex-
penses from unexpected shutdowns, repairing and recovery after emergencies. For
some reason it is hard to evaluate such costs but some specialists think that they can
be up to 6% of total annual production volume.
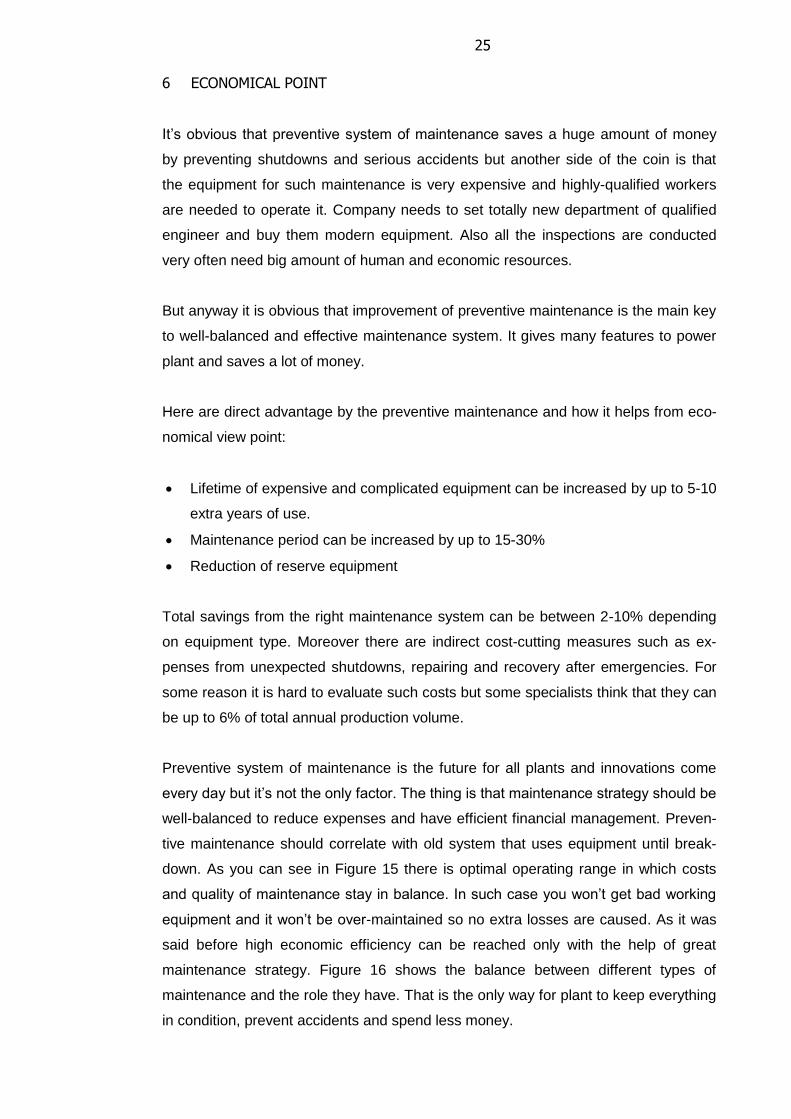
Preventive system of maintenance is the future for all plants and innovations come
every day but it’s not the only factor. The thing is that maintenance strategy should be
well-balanced to reduce expenses and have efficient financial management. Preven-
tive maintenance should correlate with old system that uses equipment until break-
down. As you can see in Figure 15 there is optimal operating range in which costs
and quality of maintenance stay in balance. In such case you won’t get bad working
equipment and it won’t be over-maintained so no extra losses are caused. As it was
said before high economic efficiency can be reached only with the help of great
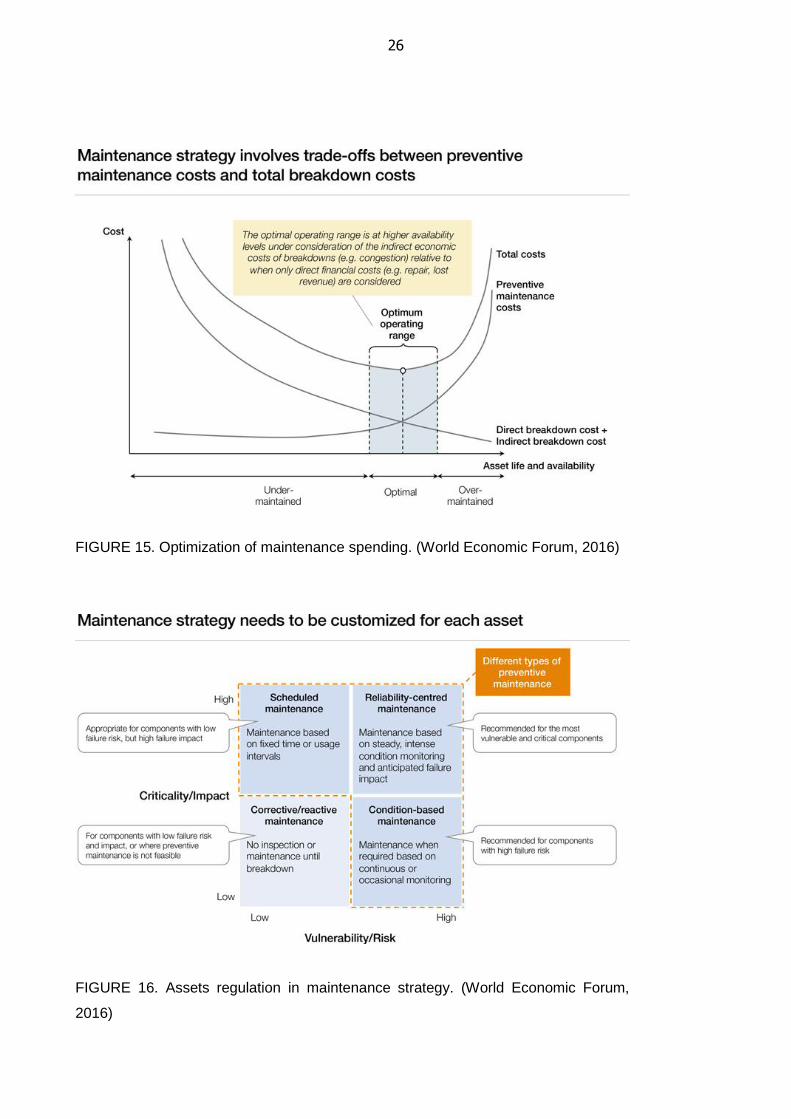
maintenance strategy. Figure 16 shows the balance between different types of
maintenance and the role they have. That is the only way for plant to keep everything
in condition, prevent accidents and spend less money.
26
FIGURE 15. Optimization of maintenance spending. (World Economic Forum, 2016)
FIGURE 16. Assets regulation in maintenance strategy. (World Economic Forum,
2016)
27
7 IMPLEMENTATION AND EXISTING SYSTEM
Nowadays Russian industry faces many problems because of its old-fashioned way
of engineering and old equipment. All the power plants are under the governments
control and renovation goes very slowly. For example most of the equipment at CHP
plant in Petrozavodsk was produced and designed 20-40 years ago. In the same way
most of the engineers working there are 50 years of old. That’s why modernization
and innovation goes very slow. People use old-fashioned ways of maintenance.
Here comes a problem, when they get some new system, aggregate of equipment,
the faces new technology and old methods are applied. But that equipment is modern
and can be only operated with new knowledge. Sometimes because of scheduled
maintenance equipment can be working even worse than before. It is caused by hu-
man factor. Also if somebody will test the equipment before planned maintenance
they will see that it doesn’t need maintenance yet and that schedule can be correct-
ed.
Nowadays such departments exist where two engineers carry out all the tasks and
measurements by themselves. They usually face such problems as mistrust from
other departments but already many times they saved expensive equipment.
7.1 Equipment that was saved
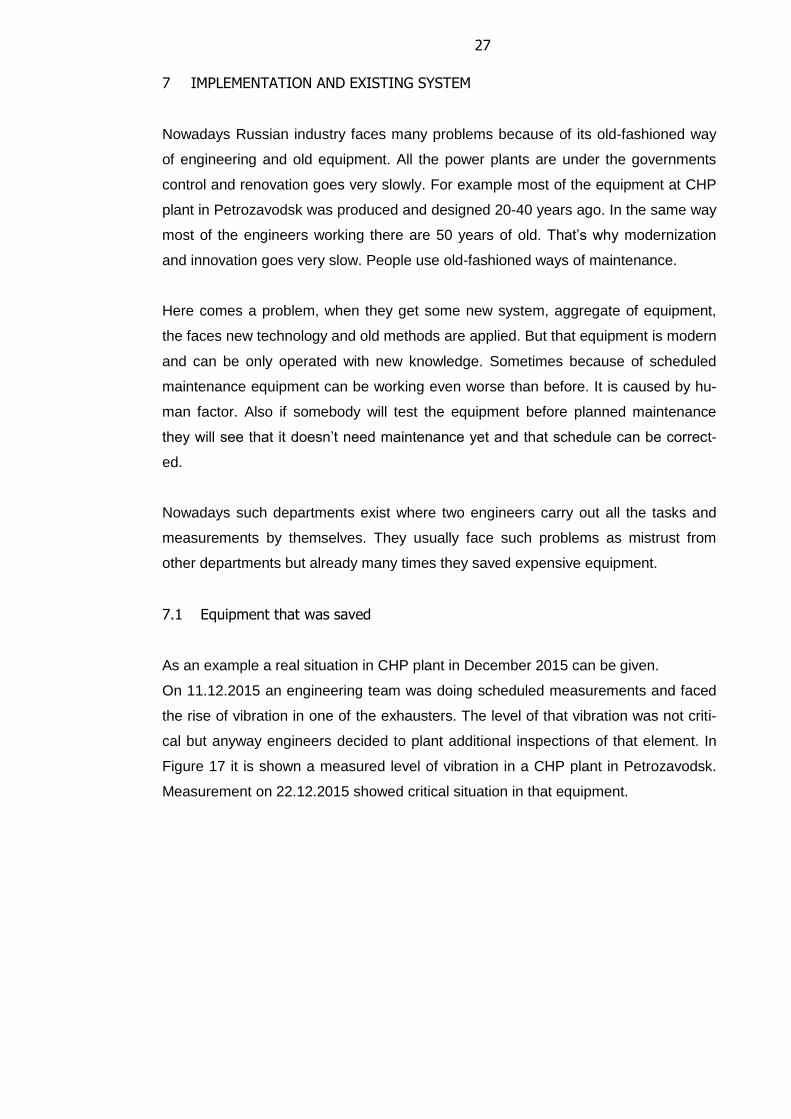
As an example a real situation in CHP plant in December 2015 can be given.
On 11.12.2015 an engineering team was doing scheduled measurements and faced
the rise of vibration in one of the exhausters. The level of that vibration was not criti-
cal but anyway engineers decided to plant additional inspections of that element. In
Figure 17 it is shown a measured level of vibration in a CHP plant in Petrozavodsk.
Measurement on 22.12.2015 showed critical situation in that equipment.
28
FIGURE 17. Graphic made by the measurements from vibration meter ’’SD-21’’
(Vladislav Goncharov, 2016)
Those measurements from vibration meter “SD-21” were treated and analyzed with
the use of original software that gives that graphic. It shows that increasing of vibra-
tion will grow exponentially and cause shutdown of the equipment. The situation was
critical because measuring team had clear vision of the situation development but
main engineers did not agree with them.
There is still huge influence of old school of maintenance and most of the workers
don’t trust modern equipment. They were thinking that there was no danger and don’t
give permit for maintenance. Afterwards when the vibration level started to grow very
fast they proved that situation was extremely dangerous and could cause big losses.
The right decision was made to make planned repair of the motor. Dissection show
that equipment was in bad condition despite it was renewed some time ago. On
02.01.2016 all the repairing was done when the load of plant was minimum because
of the holiday in country so the losses were minimized. Shutdown was prevented and
financial losses minimized.
That case shows importance of the measurement department and necessity of mod-
ern technologies.
29
8 CONCLUSION
In conclusion it can be said that vibration and thermal control is the main part of pre-
ventive maintenance system in every power plant. These two methods of mainte-
nance control can’t live separately from well-designed maintenance system. In every
plant or other factory the maintenance system itself needs to be well managed. Reac-
tive maintenance and preventive system should be included.
As a matter of fact it can be said that a perfect maintenance system can’t be without
modern technology and equipment. There should be team of engineers that will in-
vent the maintenance system for certain place or some it can be ordered from some
sided company as well. Also the most important part of every maintenance system is
human resources. It should be a highly qualified group of people with experience of
working on such big objects.
In fact it’s obvious that condition monitoring system comes now to every plant and will
become part of maintenance system. They have a huge role, cost a lot of money but
in the future that gives great advantage.
It follows from above that there are three main factors of good factory life: balanced
maintenance system, qualified human resources and modern technologies.
30
REFERENCES
Azima DLI. Using vibration analysis to test for bearing wear. Retrieved May 10, 2016,
from http://www.reliableplant.com/Read/27324/Vibration-analysis-bearing-wear
Barkova N.A. (2013). Introdction to vibration diagnostics.
Chuck Yung (2006). Vibration analysis: what does it mean?
http://www.plantservices.com/articles/2006/154/
Circuit Cellar (2014). What Is Emissivity? Retrieved May 7, 2016, from
http://circuitcellar.com/ee-tips/what-is-emissivity-ee-tip-133/
Decentralized energy. (2007). Strategies for CHP plant maintenance. Retrieved
April 27, 2016, from http://www.decentralized-energy.com/articles/print/volume-
8/issue-5/features/strategies-for-chp-plant-maintenance-sampm-costs-are-generally-
equal-to-power-plant-capital-cost-over-10-15-years.html
DynaVibe (2015). Top 3 causes of aircraft vibration. Retrieved May 5, 2016, from
http://www.slideshare.net/DynaVibe/top-3-causes-of-aircraft-vibration
Imeco. Electro-mechanical contracting company. Available from
http://www.imeco.com/
Plant maintenance (2014). Quality Assured Maintenance Management For Coal
Handling Plant. Retrieved May 5, 2016, from http://www.plant-
maintenance.com/articles/Maintenance_Management_QA.pdf
Plant Maintenance Resource Center. (2015). Quality Assured Maintenance Man-
agement For Coal Handling Plant. Retrieved April 23, 2016, from http://www.plant-
maintenance.com/articles/Maintenance_Management_QA.pdf
VAST. (2016). Retrieved April 20, 2016, from VAST: http://www.vibrotek.ru/
Wikipedia. Emissivity. Retrieved May 5, 2016, from
https://en.wikipedia.org/wiki/Emissivity
World economic forum (2014). Strategic infrastructure. Retrieved May 17, 2016,
from http://reports.weforum.org/strategic-infrastructure-2014/1-implementing-om-
best-practices/1-5-extend-asset-life/
Zavodfoto (2013). Factory life journal. Retrieved May 5, 2016, from
http://zavodfoto.livejournal.com/1423267.html