thesis - archive.org · m axim ize enem y casualties ..... 9 3. ensure services are tasked...
TRANSCRIPT

NAVAL POSTGRADUATE SCHOOLMonterey, California
THESIS
A JOINT SERVICE OPTIMZATION CNjOF THE =
PHASED THREAT DISTRIBUTION
by
Brian L. Widdowson
March, 1998
Thesis Advisor: Richard E. Rosenthal
Second Reader: Kirk A. Yost
Approved for public release; distribution is unlimited.
QUALM~ WW992

REPORT DOCUMENTATION PAGE Form ApprovedOMB No. 0704-0188
Public reporting burden for this collection of information is estimated to average 1 hour per response, including the time for reviewing instruction,searching existing data sources, gathering and maintaining the data needed, and completing and reviewing the collection of information. Sendcomments regarding this burden estimate or any other aspect of this collection of information, including suggestions for reducing this burden, toWashington headquarters Services, Directorate for Information Operations and Reports, 1215 Jefferson Davis Highway, Suite 1204, Arlington,VA 22202-4302, and to the Office of Management and Budget, Paperwork Reduction Project (0704-0188) Washington DC 20503.
1. AGENCY USE ONLY (Leave blank) 2. REPORT DATE 3. REPORT TYPE AND DATES COVEREDMarch 1998 Master's Thesis
4. TITLE AND SUBTITLE 5. FUNDING NUMBERSA Joint Service Optimization of the Phased Threat Distribution.6. AUTHOR(S) Brian L. Widdowson DWAM70262
7. PERFORMING ORGANIZATION NAME(S) AND ADDRESS(ES) 8. PERFORMING ORGANIZATION
Naval Postgraduate School REPORT NUMBER
Monterey, CA 93943-5000
9. SPONSORING I MONITORING AGENCY NAME(S) AND ADDRESS(ES) 10. SPONSORING I MONITORING
Chairman of the Joint Chiefs of Staff, J-8 (WAD), The Pentagon, AGENCY REPORT NUMBER
Washington, D.C.11. SUPPLEMENTARY NOTES
The views expressed in this thesis are those of the author and do not reflect the official policy or positionof the Department of Defense or the U.S. Government.12a. DISTRIBUTION / AVAILABILITY STATEMENT 12b. DISTRIBUTION CODE
Approved for public release; distribution is unlimited.
13. ABSTRACT (maximum 200 words).The decreasing defense budget forces the Department of Defense (DoD) to continually find areas
in which to reduce military spending. Traditionally, each service has requested munitions consideringitself in isolation. This inevitably leads to excessive munitions acquisition for the DoD as a whole. TheUnder Secretary of Defense for Acquisition and Technology developed the Capabilities-Based MunitionsRequirement (CBMR) process to ensure that the DoD address the munitions acquisition issue from a jointperspective and thus reduce excess.
The CBMR process requires each warfighting CinC to produce a phased threat distribution (PTD).The PTD specifies which friendly platform will be assigned to each enemy platform for a given scenario.This provides the services with estimates of the threats they must be prepared to overcome and themunitions they need. The purpose of this thesis is to help develop the PTD in such a way that the threatsare assigned appropriately with limited overlap among the services.
To achieve this purpose, the thesis develops a goal programming model that attempts to find anoptimal allocation based on three objectives: minimize friendly casualties, maximize enemy casualties, andmaximize adherence to the guidance delineating a proper division of labor among the services.14. SUBJECT 15. NUMBER OF
Phased Threat Distribution, Munition, Capabilities-Based Munition Requirement PAGESProcess. 85
16. PRICE CODE
17. SECURITY 18. SECURITY CLASSIFICATION OF 19. SECURITY CLASSIFICATION 20. LIMITATION OFCLASSIFICATION OF THIS PAGE OF ABSTRACT ABSTRACTREPORT Unclassified Unclassified ULUnclassified
N 7640-01-280-5500 Standard Form 298 (Rev. 2489)Prescribed by ANSI Std. 239-18 298-102
i

ii

Approved for public release; distribution is unlimited
A JOINT SERVICE OPTIMIZATION OF THE PHASED THREAT DISTRIBUTION
Brian L. WiddowsonCaptain, United States Marine Corps.
B.S., Ohio State University, 1991
Submitted in partial fulfillment of therequirements for the degree of
MASTER OF SCIENCE IN OPERATIONS RESEARCH
from the
NAVAL POSTGRADUATE SCHOOLMarch 1998
Author:
Brian L. Widdowson
Approved by:_.
Richard-. R",sent Thesis Advisor
irk Yost S ecndRe
\ý_ýnR. Washburn, Acting ChairmanDepartment of Operations Research
iii

iv

ABSTRACT
The decreasing defense budget forces the Department of Defense (DoD) to
continually find areas in which to reduce military spending. Traditionally, each service has
requested munitions considering itself in isolation. This inevitably leads to excessive
munitions acquisition for the DoD as a whole. The Under Secretary of Defense for
Acquisition and Technology developed the Capabilities-Based Munitions Requirement
(CBMR) process to ensure that the DoD address the munitions acquisition issue from a joint
perspective and thus reduce excess.
The CBMR process requires each warfighting CinC to produce a phased threat
distribution (PTD). The PTD specifies which friendly platform will be assigned to each
enemy platform for a given scenario. This provides the services with estimates of the threats
they must be prepared to overcome and the munitions they need. The purpose of this thesis
is to help develop the PTD in such a way that the threats are assigned appropriately with
limited overlap among the services.
To achieve this purpose, the thesis develops a goal programming model that attempts
to find an optimal allocation based on three objectives: minimize friendly casualties,
maximize enemy casualties, and maximize adherence to the guidance delineating a proper
division of labor among the services.
V

vi

TABLE OF CONTENTS
1. IN TRODU CTION ................................................................................................. 1
A .BACKGROUND ................................................................................................... 1
B . THE PROBLEM ................................................................................................ 3
C. CURRENT PROCEDURE ................................................................................... 4
D .PROPOSED PROCEDURE ................................................................................. 5
E . THREAT ALLOCATION ................................................................................... 6
F. OPTIM ALITY CRITERIA ................................................................................. 81. M inim ize Friendly Casualties .......................................................... 92. M axim ize Enem y Casualties ........................................................... 93. Ensure Services Are Tasked Consistent With Their Capabilities ..... 9
G .M EASURE OF EFFECTIVENESS .......................................................................... 11
H .CONSIDERATIONS ............................................................................................ 11
II. M OD ELIN G APPROA CH ............................................................................... 13
A .PROBLEM STATEMENT .................................................................................. 13
B .M ODEL D IFFERENCES ................................................................................. 131. H andling Greediness ...................................................................... 142. M odifying the Platform G oal ......................................................... 15
C. A SSUMPTIONS ............................................................................................. 15
D .D ATA SOURCES ........................................................................................... 18
III. TH E M ON OLITH IC M ODEL ........................................................................ 21
A .D ISCUSSION ............................................................................................... 21
B .M ONOLITHIC M ODEL FORM ULATION ........................................................... 21
IV . TH E D YNAM IC M ODEL .............................................................................. 31
A .D ISCUSSION ............................................................................................... 31
B .D YNAM IC M ODEL FORM ULATION ............................................................... 32
C. INTERPHASE CALCULATIONS ....................................................................... 381. R egeneration Com putations: ........................................................... 382. B alance Com putations ................................................................... 38
V . RESULTS AN D CON CLU SION S ................................................................. 41
A .RUN TYPES .................................................................................................. 41
B .RESULTS ..................................................................................................... 42
vii

C. BENEFITS OF M ODEL ................................................................................... 421. Speed ........................................................................................... 422. Reduced W orkload ........................................................................ 423. Sensitivity Analysis ...................................................................... 434. M ore Easily Defended Rationale .................................................... 43
D. SUGGESTED FUTURE W ORK ........................................................................ 44
1. Refine the Data ............................................................................... 442. Analytically Reconcile M odel Differences ..................................... 453. Incorporate Costs ........................................................................... 464. Use Loops to Provide Sensitivity Analysis ..................................... 465. Incorporate the M odels W ithin a Simulation .................................. 46
E. ACHIEVEMENT OF OBJECTIVE ...................................................................... 461. Improving the PTD ........................................................................ 462. Reducing the W orkload ................................................................. 47
F. SUMMARY OF RESULTS ................................................................................ 47
APPENDIX A - M ONOLITHIC GAM S CODE ....................................................... 49
APPENDIX B - DYNAM IC GAM S CODE ............................................................. 57
APPENDIX C - GLOSSARY OF ACRONYM S ...................................................... 67
LIST OF REFERENCES ......................................................................................... 69
INITIAL DISTRIBUTION LIST .............................................................................. 71
viii

EXECUTIVE SUMMARY
The decreasing defense budget forces the Department of Defense (DoD) to
continually find areas in which to reduce military spending. Traditionally, each service has
requested munitions considering itself in isolation. This inevitably leads to excessive
munitions acquisition for the DoD as a whole. The Under Secretary of Defense for
Acquisition and Technology developed the Capabilities-Based Munitions Requirement
(CBMR) Process to ensure that the DoD address the munitions acquisition issue from a joint
perspective and thus reduce excess.
The CBMR process requires each warfighting CinC to produce a phased threat
distribution (PTD). Department of Defense Instruction 3000.4 defines the PTD as "the
CINC's phased assignment of a portion of the enemy's total combat capability (i.e., forces,
installations, and organizations) to DOD Component commands. The distribution is a
percentage by type of target (e.g., tanks and fighters) by operation plan phases." It simply
specifies which friendly platform will be assigned to each enemy platform for a given
scenario. This provides the services with estimates of the threats they must be prepared to
overcome and the munitions they need. The purpose of this thesis is to help develop the PTD
in such a way that the threats are assigned appropriately with limited overlap among the
services.
To achieve this purpose, the thesis develops two goal programming models that
attempt to find optimal allocations based on three objectives: minimize friendly casualties,
maximize enemy casualties, and maximize adherence to the guidance delineating a proper
division of labor among the services. First, the thesis describes a monolithic model that
optimizes across all phases of a scenario concurrently. The thesis then modifies the
ix

monolithic model to develop a dynamic model. The dynamic model optimizes each phase
sequentially, using the results from a prior phase as input for the current.
Both models achieve the objective of providing the Joint Staff with a tool to aid in the
PTD development. Although the models still require a considerable effort to acquire data,
the requirement is no more extensive than that of past PTDs. The models' most significant
benefit is the ease with which the PTD is developed once the data has been collected. The
monolithic model solves to optimality on a Sun Ultra 200E workstation with 128 megabytes
of memory in less than fifteen minutes and the dynamic model in less than six. The speed
with which the models provide solutions allows the analyst to run several scenarios, thus
conducting sensitivity analysis. In this manner, the models allow the analyst to formulate
improved PTDs.
X

ACKNOWLEDGMENTS
I would like to thank several people, without whom this thesis would not have been
possible. First, I would like to thank Pete Byrne in the Warfighting Analysis Division of J-8.
Pete provided me with an interesting, relevant problem to work on and then was instrumental
in solving it. His enthusiasm was contagious and his support unfailing. Second, I would like
to thank Professor Richard E. Rosenthal and LtCol Kirk Yost. Their guidance and advice
saved me countless hours as I grappled with this problem. Their editing skills are something
that you, the reader, will appreciate. These three scholars have made my thesis possible.
I would also like to thank my friends, who have been my "local family" while I have
been in Monterey. They have made my stay in Monterey something I will always remember
fondly. In particular, I thank my girlfriend, Stephanie Whinery. Her love and support has
helped me immeasurably as I worked to complete this thesis.
Finally, my acknowledgements are not complete without a thank you to my parents.
Everything that I have accomplished I owe to their continued love and support.
xi

xii

I. INTRODUCTION
A. BACKGROUND
The decreasing defense budget forces the Department of Defense (DoD) to continually
find areas in which to reduce military spending. One area that consumes a great deal of money
is conventional munitions. Each service has traditionally computed munitions requirements in
isolation. This inevitably leads to excessive munitions acquisition for the DoD as a whole. To
ensure that the DoD addresses the munitions acquisition issue from a joint perspective, thus
reducing excess, the Under Secretary of Defense for Acquisition and Technology developed the
Capabilities-Based Munitions Requirement (CBMR) process.
The CBMR process defines a methodology to be used for munitions acquisitions. DoD
Instruction (DODI) 3000.4, dated 16 June 1997, tasks the services to use the CBMR process to
determine their munitions requirements and ensures that other DoD agencies provide needed
documents to the services.
Two documents central to the CBMR process are the Outyear Threat Report (OTR) and
the Defense Planning Guidance (DPG). The OTR is the Defense Intelligence Agency's (DIA)
estimate of adversary capabilities in the "outyears" (a specified planning horizon)[DODI
3000.4]. The OTR is produced every odd-numbered calendar year and supports the development
of the threat distributions produced by the Commanders in Chief of the combatant commands
(CinCs). The second document, the DPG, is published by the Secretary of Defense. In addition
to requiring the CBMR process, the DPG delineates "national security objectives and policies,
the priorities of military missions, and the resource levels projected to be available for the period
of time for which such recommendations and proposals are to be effective."[Lovelace and
Young, 1995] Included in the DPG are Illustrative Planning Scenarios (IPSs). These scenarios
1.
describe several hypothetical conflicts as a means to highlight some of the anticipated military
challenges within the coming years. This provides military planners with common scenarios in
which to conduct force analysis and to determine the types of capabilities needed. [Lovelace and
Young, 1995]
To satisfy the requirements of the CBMR process (depicted in Figure 1.1), the CinCs
(Central Command, U.S. Forces Korea, and Pacific Command) are each required to produce a
phased threat distribution (PTD), as shown in the lower left comer of Figure 1.1. The PTD is
defined in DODI 3000.4 as
the CINC's phased assignment of aportion of the enemy's total combat capability(i.e., forces, installations, and organizations) to DOD Component commands.The distribution is a percentage by type of target (e.g., tanks andfighters) byoperation plan phases.
The PTD, based on DIA's OTR and the applicable Operation Plan (OPLAN), allows each
service to estimate the threat that it must be prepared to overcome. If each service plans to
address all the threats specified in the OTR, then excessive investment in munitions is inevitable.
While a small amount of overlap is appropriate, the current goal is to divide the threats among
the services in such a way that each service is accountable for a portion that is consistent with its
role in the applicable OPLAN.
2
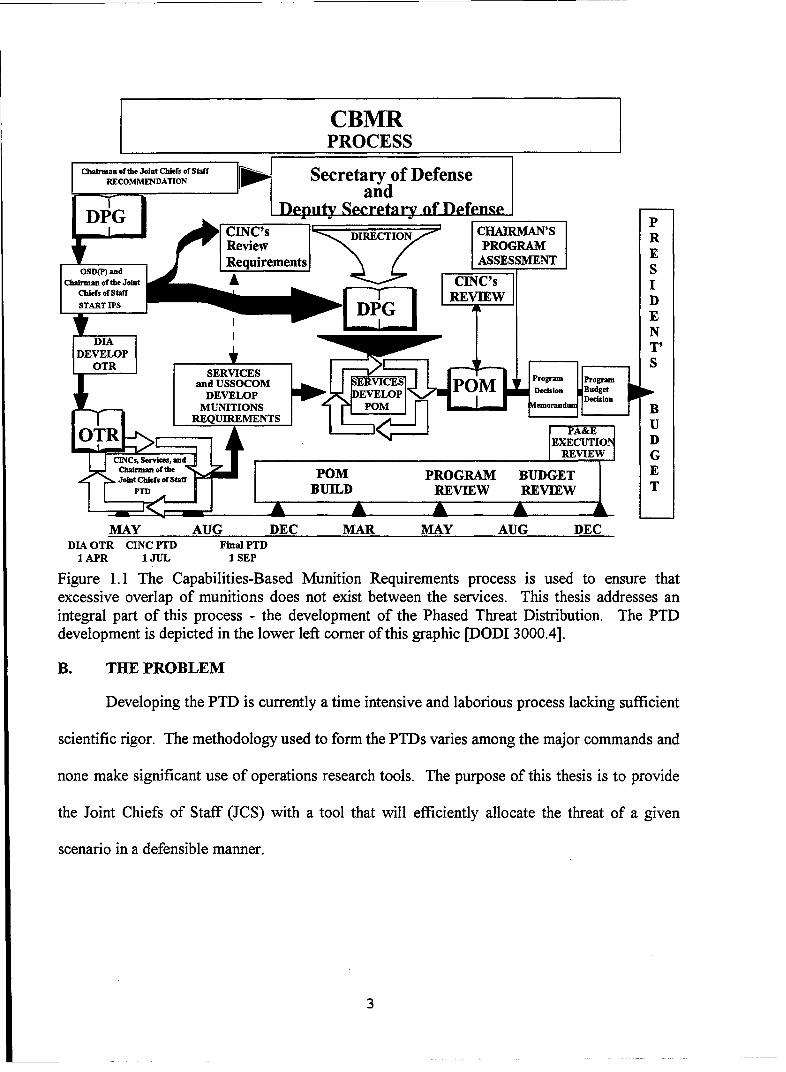
CBMRPROCESS
Chairman ofthe Joint Chiefs of Staff Secretaryaof DefenseRECOMMENDATIN Scearyofd ens
DPG Deputy Secretary of DefenseCINC'$ CHAIRMAN'S RReview PROGRAM E
OSD(P) ad Requirements ASSESSMENT gCh-ra ofthe J0oint CINC's IChid, of REVIEW D
S• NF- T9DUVELOPOTR
SERVICESPrga Pormand USSOCOM EVCS PM Dcso BdeD E V E L O P E V L Pn D csoM UNITIONS POM [ emoandu B
REQUIREMENTS PA&E [ U
O REXECUTIOI DcINcs, S,,'viem• an REVIEW G
Joint Chlefs ofstaff POM PROGRAM BUDGETPTD BUILD REVIEW REVIEW T
MAY AUG DEC MAR MAY AUG DECDIA OTR CINC PTD Final PTD
1 APR 1JUL ISEP
Figure 1.1 The Capabilities-Based Munition Requirements process is used to ensure thatexcessive overlap of munitions does not exist between the services. This thesis addresses anintegral part of this process - the development of the Phased Threat Distribution. The PTDdevelopment is depicted in the lower left comer of this graphic [DODI 3000.4].
B. THE PROBLEM
Developing the PTD is currently a time intensive and laborious process lacking sufficient
scientific rigor. The methodology used to form the PTDs varies among the major commands and
none make significant use of operations research tools. The purpose of this thesis is to provide
the Joint Chiefs of Staff (JCS) with a tool that will efficiently allocate the threat of a given
scenario in a defensible manner.
3

C. CURRENT PROCEDURE
As stated earlier, the current year PTDs are generated by the warfighting CinCs. The JCS
validates these current year PTDs and uses them as input to produce a PTD for the outyears. The
PTDs are formed using the DPG (including the IPSs) and the OTR as baseline documents. The
JCS provides this PTD to the services, who use it as a basis for their munitions requirements.
This process is depicted in Figure 1-2.
PTD:... an allocation of targets from a common target base
among the component forces of a warfighting CINC.
DPG
Allocated Forces +
(DPG) DETERMINE Services and
War Fighting Concepts DEPTDMN USSOCOM
(CINC) MoPTD-0 develop($ VIN )munitions
SValidate Develop requirementsW CinC Outyear
(DIA) PTDs PTD
Allocated CINC'seeoforces eveop Chairman of the
OTRseparate SrieOTRPTDs ser s Joint Chiefs
of Staff
Figure 1.2 The development of the Phased Threat Distribution currently requires the CinCs toeach develop a PTD. These PTDs are validated by the Joint Staff and then used as input into ajoint PTD for the outyears. This joint PTD allows the services and United States SpecialOperations Command (USSOCOM) to develop their munitions requirements. [DODI 3000.4]
TYe method used in the development of the CinCs' PTDs varies with each command.
Central Command conducts a time intensive spreadsheet analysis of TACWAR (a deterministic
land combat model) [U.S. Army Training and Doctrine Command, 1998] output to develop its
PTD. This effort requires the full-time attention of two officers for six months. U.S. Forces
Korea (USFK) develops their PTD by making changes to the prior year's PTD as military
4

judgement deems necessary based on current TACWAR output. The USFK PTD is also used
by Pacific Command. Pacific Command does review the USFK PTD, but there is no intensive
development method.
D. PROPOSED PROCEDURE
Upon the completion of the PTD model, the warfighting CinCs will be relieved from the
task of producing PTDs. Instead, the Joint Staff will use the model to produce the required PTD
without the currently required input of the CinC's PTDs. The CinCs will still be required (and
will probably demand the opportunity) to provide input to the Joint Staff for the development of
the PTD. This input, however, will be easily provided relative to the task of producing a PTD.
The CinCs will provide the concept of operations for their theater and will be involved in
reviewing the assumptions and the data sources that the Joint Staff uses. Finally, the CinCs will
desire to review the results of the Joint Staff analysis before publication to ensure there are no
intolerable points of contention.
In addition to reducing the CinC's burden, the PTD model will have two other benefits.
First, it will allow the Joint Staff to achieve the goal of"develop[ing] a common methodology to
compute and report quantitative requirements for weapons systems and platforms."[DODI
3000.4] Finally, the relative ease with which the Joint Staff will produce the PTD will allow
"what-if' analysis to be conducted on the input data and allocations. The proposed process is
depicted in Figure 1.3.
5

DPG
Allocated Forces +
(DPG) J Services andWar Fighting Concepts Determine USSOCOM
(CINC) PTD -0P, developmunitions
OTR ,_ _ _ _requirements
(DIA) * tCINC's Services Chairmaninput of the
JointChiefs of
Staff
Figure 1.3 With use of the model developed in this thesis, the CinCs will no longer be requiredto develop PTDs. They will still provide input to the Joint Staff, however, this input will beeasily provided relative to the task of producing PTDs. The Joint Staff will be able to producemore timely, beneficial PTDs with reduced effort.
E. THREAT ALLOCATION
To fully understand how a PTD is formed, the individual elements of the allocation must
be understood. In this thesis, each element of the threat allocation is referred to as an
assignment. All of the assignments of a scenario collectively form the allocation. It is this
allocation that is used to form the PTD. The allocations have a one-to-one correspondence with
the PTDs because the PTD is a percentage by type of target by plan phase. A planner may
convert the allocation to a unique PTD simply by converting the number of platforms assigned to
each service to the corresponding percentage. Figure 1.4 demonstrates a very simplified
example of this.

STarget Instance: Enemy Tanks in range band three of MTW
Southwest Asia during phase one.
ALLOCATION PTD
Army 200 Army 40%USMC 200 USMC 40%Navy 0 [* Navy 0%Air Force 100 Air Force 20%
Figure 1.4 The allocation is converted to a unique PTD by computing the percentage of targetsallocated for each service.
An optimal allocation, and thus PTD, is valid only for the scenario that is represented by
the input data. The following is a generic sample scenario that demonstrates the context within
which an allocation is made.
Suppose the United States becomes involved in two major theaters of war (MTW) nearly
simultaneously. To protect the interest of the United States, it is necessary to send American
service members to both regions. In both regions there is a set of targets that the services, and
possibly one ally, must collectively engage. Each service has several platform types and each of
these platforms is capable of firing one or more types of munitions. Within each MTW, the
targets are spread over the battlefield in five different range bands. These range bands are each
40km in depth, and represent the distance from the forward edge of the battle area (FEBA).
Each MTW also has an associated timeline. This timeline divides the conflict into five phases
(halt, early build-up, late build-up, early counter-attack, and late counter-attack). These phases
may last several hours, days, or weeks.
An allocation for this scenario specifies exactly which service, platform, and munition
will engage each target in each MTW, range band, and time period. An example element of this
allocation is "The Marines (service) will use tanks (platform) firing sabot rounds (munition) to
7
attack the BMPs (target) in the second range band of MTW2 during the late counter-attack
phase."
In general, only one platform is assigned to each target. However, a small amount of
redundancy is permissible for certain targets. This redundancy is referred to as overlap and is
intended to "enable the defeat of an unexpected disposition of enemy forces." [DODI 3000.4]
Overlap is accomplished in the model through the use of over-assignments, which are simply
assignments that are made on previously assigned targets. The maximum number of over-
assignments possible varies by target and is specified in the input data. Assignments and over-
assignments are equivalent for the purposes of converting an allocation to a PTD. In contrast to
figure 1.4, the sum of assignments and overassignments may exceed 100%.
F. OPTIMALITY CRITERIA
One must specify the criteria upon which optimality is judged to form an optimal
allocation. The following are reasonable goals when determining a threat allocation:
* Maximize target value destroyed
* Maximize the achievement of CinC defined goals by MTW, time phase, or rangeband.
* Maximize "effectiveness" (a complex criteria not yet defined)
* Minimize unproductive sorties
* Minimize friendly casualties
• Minimize munitions cost
This list is not meant to be exhaustive. Further analysis of the problem by others, with different
backgrounds, would undoubtedly find even more.
The previously mentioned objectives can not all be optimized simultaneously. For
example, minimizing friendly casualties and maximizing target value destroyed are in conflict.
8

One approach to this difficulty is to use goal programming [Charnes & Cooper, 1961]. In this
approach, the most important criteria are selected, a target value or goal is selected for each
criterion, and the under-achievements of the goals are penalized. The model's sponsor
considered three goals most important.
1. Minimize Friendly Casualties
First, it is important to minimize friendly casualties. From the planner's point of view, it
is also important that enough assets survive to begin the next phase of operations. Placing a goal
for each service and MTW on the number of platforms at the start of each time phase
incorporates both of these goals. If too many platforms are destroyed during a time phase, the
goal is not achieved in the next. This penalizes the overall measure of effectiveness (MOE).
2. Maximize Enemy Casualties
A second goal is to inflict damage upon the enemy. Placing a goal on the military worth
of the targets destroyed in each MTW during each phase incorporates this goal. A failure to
inflict a given amount of casualties on the enemy again penalizes the final MOE.
3. *Ensure Services Are Tasked Consistent With Their Capabilities
Lastly, the model -incorporates a service goal for two reasons, persistence and political
viability. The model considers persistence and political considerations by encouraging each
service and ally to engage a given "military worth" of enemy in each MTW and phase; failure to
do so penalizes the MOE.
a) Persistence
Persistence is that quality that prevents a model from making large changes to an
optimal solution when given a small modification to the input data. It is almost always more
desirable to find a nearly optimal solution that is very close to the existing policy than to find a
true optimum that requires large changes in current operations [Brown, Dell, and Wood, 1997].
9

Figure 1-1 makes it obvious that the PTD is one part of a much larger process. For
this reason it is desirable to have the model temper changes to the optimal solution caused by
minor changes to the inputs. The United States has a significant investment in hardware and
force structure to fire the munitions it will procure. This hardware and force structure is clearly
designed to make use of particular munitions allocations. Experts can estimate these allocations
using previous years' allocations and military judgement. Given that the United States has
designed each service to fire certain allocations, it is undesirable to arrive at an optimal solution
that is a vast departure from prior years. This "optimal solution" would necessitate an
impractical restructuring of the services, which is clearly unacceptable. The service goals allow
the model to account for the existing conditions indirectly while still allowing changes that
improve on the status quo.
b) Political viability
Political viability is another reason service goals are justified within the model. While
unpalatable for the modeler, political factors are nevertheless sometimes an important
consideration in real world problems. Ignoring these factors is satisfying for the modeler, but
can leave the client with a useless product.
Political viability indicates that the involved agencies have confidence in the model.
These agencies (the CinCs and Services) have been using PTDs for several years and have much
experience in judging allocations. While it may be difficult for these agencies to determine an
optimal allocation, they can easily spot a flawed one. Providing service goals effectively steers
the model away from these clearly impractical solutions. This prevents the model from losing
credibility with the users without forcing a particular solution.
10

G. MEASURE OF EFFECTIVENESS
These three goals are scaled and a linear combination of the under-achievements and
over-achievements of the goals becomes the single MOE for an allocation. The MOE's units are
"value of under-achievement". Given this single MOE, the allocation problem can now be
formulated as a linear program that seeks to minimize the MOE. This allows the model to
properly evaluate the tradeoffs necessitated by conflicting goals. It also provides the user with a
tool that can be used to compare different allocations within the same scenario.
Over-achievements are included in the MOE to allow the model to further improve upon
solutions that meet all of the goals. The over-achievement terms also allow the model to permit
small under-achievements in some goals if they produce very advantageous results in others. All
over-achievement terms are scaled with a parameter that is strictly less than one. This scaling
ensures the weighting of the underachievement is greater than the weighting of the
corresponding overachievement, thus maintaining convexity [Rosenthal, 1983]. This convexity
prevents the occurrence of simultaneous under-achievement and over-achievement of the same
goal. If an overachievement term had a scale factor greater than one, then the model would be
non-convex and it would need a nonlinear constraint to prevent simultaneous under and
overachievement. Figure 1.5 (next page) graphically demonstrates this concept.
H. CONSIDERATIONS
As with any issue involving very large sums of money, there are political factors that
necessitate several points of discussion. Since the PTD is the basis for munitions requirements,
the services will be very sensitive to the results of the JCS PTD. A service that perceives it has
been slighted by the JCS PTD will likely attribute, perhaps correctly, the loss of millions of
11

Penalty 10-1
5-5- 5
-5 5 -5 5
Rewar 4. -0 p 10-Reward Underachievement Overachievement
Figure 1.5. The objective function in the left chart rewards overachievement less than it penalizesunderachievement, and is thus convex. The objective function in the right chart, however,rewards overachievement more than it penalizes underachievement. It is not convex; therefore,it cannot be minimized with linear programming.
dollars of munitions funding to the JCS distribution. Since the goal of the PTD is to reduce
redundancy, it is likely that each service, as its munitions acquisition dollars shrink, will feel it
has been unjustly slighted. For this reason, it is imperative that the distribution be formulated as
objectively as possible. While there may be no reasonable PTD that satisfies everyone, the
methodology forming it should be objective and unassailable.
It is also very important to remember that the PTD addresses only the actual warfighting
needs of the services. It does not address training ammunition, strategic stockpiles, and those
munitions required to ensure that forward-deployed forces are adequately armed. While the PTD
will affect munitions acquisitions, the model is not designed as a tool for comparing the
platforms used to fire these munitions.
12

II. MODELING APPROACH
A. PROBLEM STATEMENT
The JCS must "best" allocate the threat of a given scenario among the Navy, Marine
Corps, Army, Air Force, and a single allied nation. "Best" refers to the allocation minimizing
the degree of failure to achieve the goals of destroying enemy platforms, protecting friendly
platforms, and ensuring a reasonable division of labor among the services. This problem is
solved in two ways. First, an optimization, referred to as a monolith, which optimizes across all
time phases of a scenario concurrently is formulated and solved. To gain additional insight, a
dynamic model is also formulated that optimizes phases sequentially, using output from each
phase as input for the next.
B. MODEL DIFFERENCES
The monolithic and dynamic models are purposely formulated to be as similar as
possible. The inherent difference between the monolithic and dynamic models, however, forces
several other differences. The most significant of these differences is the myopic view of the
dynamic model. This shortsightedness, unless accounted for, introduces a very undesirable
characteristic into the model: greediness. Much less significant, but requiring discussion, is the
handling of the platform goal in the dynamic model. The platform goal, as discussed, seeks to
ensure that enough platforms exist to begin the next phase. This must be modified to be
incorporated in the dynamic model, which can only use information pertaining to the current
phase.
13

1. Handling Greediness
A greedy (or myopic) method seeks to improve the objective function despite possible
negative effects in an unseen future [Gass and Harris, 1996]. Greediness is not a problem in the
monolithic model because the model can consider the later effects of actions taken in an early
phase. It is a problem for the dynamic model. This model optimizes each phase individually, so
the model cannot assess the future effects of actions taken in a given phase. This myopia causes
the model to take any action that improves the objective function, regardless of the resources
used in doing so.
Greediness is a problem in a dynamic model that rewards over-achievement. The original
purpose of the over-achievement reward was to allow the model to make a trade-off between
under-achievement and exceptionally worthy over-achievement elsewhere. The monolithic
model scales over-achievements to ensure they are generally preferred less than improving
existing under-achievements. This scaling does not help in the dynamic model because once the
model has reduced the under-achievements for the current phase, it will waste resources
maximally increasing that phase's over-achievements. This makes reducing under-achievements
in later phases very difficult.
The dynamic model removes over-achievement rewards from all but the last phase to
prevent this waste of resources. This ensures the model does not use resources for a small
marginal benefit in an early phase at the great expense of a later phase.
After the dynamic model has run to completion, the analyst may wish to post process the
overachievement obtained in the last phase to distribute it throughout the scenario's phases. It
seems intuitively obvious that in some cases it is best to make limited overachievements early in
a scenario. This is one area in which future work could improve the utility of the model.
14

2. Modifying the Platform Goal
The platform goal of the monolithic model ensures that the number of platforms that
begin each phase strives to attain a goal level. Unlike the other goals, the platform goal
intrinsically involves more than one phase. Fortunately, another key difference between the
models allows the modeler to reconcile the two.
All reinforcements occur during the phases in the monolithic model; these same
reinforcements occur between phases in the dynamic model. The reinforcements in both models
are deterministic input data. For this reason, the number of platforms that begin the next phase
of the dynamic model is exactly the number of platforms that end the prior phase plus any
reinforcements. This allows the modeler to adjust the dynamic goal from beginning the next
phase with "X" platforms to ending the current phase with "X minus pending reinforcements"
platforms. The revised goal now parallels the monolithic goal. For example, assume the
monolithic platform goal for tanks in phase three is 200. If the dynamic model will add 100
reinforcement tanks between phases two and three, then the goal of ending phase two with 100
tanks in the dynamic model is equivalent to the goal of beginning phase three with 200 tanks in
the monolithic model.
C. ASSUMPTIONS
Several assumptions are made in the formulation of this model. While the goal is to
capture as much of the essence of the real problem as possible, some simplifying assumptions are
needed to insure tractability. Another reason for making restrictive assumptions is to ensure
usable results.
Professionals who rely on the results of a model must be comfortable that the results
reflect reality. While counter-intuitive results are possible (and, when correct, they are a model's
15

greatest achievement), it is imperative that the analysis provide an explanation consistent with
reality. Well-formed assumptions can help prevent unsupportable, counter-intuitive results.
The following assumptions are made in the formulation of this model:
1. Military Experience and Judgment Have Value.
The inclusion of service goals provides persistence and incorporates military
professionals' expert opinions regarding reasonable divisions of labor between the services. This
provides realistic bounds within which the model can find an optimal solution and ensure that the
results are organizationally practical and politically feasible.
2. A Weapon System Has The Same Performance Characteristics Regardless ofWhich Service Operates It.
This simplifying assumption is made because available data is not of sufficient fidelity to
demonstrate service differences. In addition, any data that portrays a service as less efficient
than its sister services will be exploited by the optimization and continually challenged.
3. Weapons Systems Have Linear Utility in the Short Term.
It is assumed that each weapon system (friendly and enemy) has a constant value within
each phase until a goal is achieved. After the goal has been achieved, the weapon system has a
reduced value that will remain constant. This assumption ignores synergistic effects within or
between weapon systems. Reducing the value once a goal is achieved incorporates- the concept
of decreasing marginal returns. If an enemy is already decimated, there is little gained in
attacking it further.
4. Each Phase Lasts Long Enough for Friendly Weapon Systems to Cover theEntire Battlefield.
This assumption permits friendly weapon systems the full mobility that the model
requires. A weapon system may move several hundred kilometers from one time phase to the
next. This permits the model to allocate an enemy system to a friendly platform without
16

accounting for the distance between the systems. Without this assumption the model would be
required to consider specific locations of each platform, platform velocities, munitions speeds,
etc. The additional factors quickly make the model intractable. Further justifying this
assumption, the model uses a controlling set to capture battlefield dynamics. This set also
prevents those engagements that would violate physical or tactical considerations. This
controlling set, for example, prevents friendly tanks from attacking the enemy's deep rear during
a time-phase in which the U.S. is only attempting to halt the enemy.
5. Allied Forces Have Perfect Battlefield Information and BattlefieldDominance.
It is assumed that the allied forces have complete battlefield knowledge and the ability to
select engagements. Complete knowledge is necessary to allow the model to consider all
possible allocations. Battlefield dominance prevents the enemy from forcing a disadvantageous
engagement, and thus allocation, into the model.
This assumption will tend to favor the use of specialized weapons more than may be
warranted. The model always chooses the munition most effective for a given target. In the real
world, however, a platform will not always know with certainty what type of target it must
engage. Without this information, a real world platform will choose a munition that is generally
robust instead of one that is maximally effective for only one of the possible target types.
Although perfect information causes a slight skew in munitions selection, the analyst can
anticipate and account for it if necessary. To reduce this problem, the analyst may modify the
input data to make the use of a more robust munition more attractive in some cases. In a sense,
the modeler can introduce uncertainty by including targets for which non-specialized, robust
munitions are the most effective.
17

6. Reinforcement and Resupply are Unaffected by Battles.
Reinforcement and resupply data for all friendly platforms and munitions are time-
indexed. As such, the model assumes that the data accounts for the aggregate effects of battle.
The model makes no attempt to adjust reinforcements or resupply based on runtime decisions.
D. DATA SOURCES
Existing data sources provide all of the data used in the model. These data sources are a
mixture of senior guidance, outside agency analysis, weapons and environmental data, and
simulation outputs. None of the data require a dedicated collection effort, as it has already been
obtained for other analyses.
The DPG (including the IPSs) provides the senior guidance data necessary for the model.
The OTR, for example, provides data culled from outside agency analysis. Both of these sources
have been discussed. Weapons and environmental data are obtained from the input files of
existing models. These same models also provide data from their output files and thus warrant
discussion.
The Combat Sample Generator (COSAGE) is a division level simulation designed to help
planners determine Force Capability and Force Requirements [U.S. Army Concepts Analysis
Agency, 1993]. The model is used mainly as a method to calibrate data for theater level models.
Input data includes unit organizations, unit strengths, and unit weapons in addition to the actual
weapons data. Output files include a killer-victim scoreboard, personnel losses, and ammunition
expenditures. The killer-victim scoreboard provides the PTD model with weapons effectiveness
data by platform, munition, and target.
The Tactical Warfare Model (TACWAR) is a deterministic ground combat model that
examines the interactions of strategic and tactical forces in a given scenario [U.S. Army Training
18

and Doctrine Command, 1998]. This model is used to help planners develop operational war
plans and support operational commands as they conduct exercises or real world operations.
Input data again includes unit organization, strength, and weapons; and weapons data. Output
can be tailored to meet customer needs. PTD data derived from TACWAR input or output
includes the platform and target sets, range band information, munitions types, munitions data,
and effectiveness data.
The Weapons Optimization Resource Requirements Model (WORRM) [J8, 1996] is a
optimization model that examines only air-to-ground interactions. This model seeks to
maximize the military worth of targets destroyed given a cost constraint on the munitions used.
WORRM provides the PTD model with the air platforms and the effectiveness data for air
munitions against ground targets.
19

20

Ill. THE MONOLITHIC MODEL
A. DISCUSSION
The monolithic model is a time-indexed linear programming formulation to determine the
best allocation when considering all time phases simultaneously. The linear programming
model is generated in the General Algebraic Modeling System (GAMS)[Brooke, Kendrick, and
Meeraus, 1988] and solved with CPLEX 4.0. The output of the GAMS model consists of the
optimal allocation and a measure of its optimality. This optimality figure can then be used to
compare the results of runs with differing input data.
A typical scenario generates a matrix with approximately 55,000 rows, 400,000 columns,
and 1.5 million non-zero elements. A Sun Workstation model Ultra 200E with 128 megabytes of
RAM requires less than ten minutes to solve the model.
B. MONOLITHIC MODEL FORMULATION
The following is a mathematical description of the monolithic model using the Naval
Postgraduate School format. To further aid understanding, additional conventions are followed:
1. All simple indices consist of a single lowercase letter. A single word descriptionfollows the index and slashes enclose a sample set.
2. A composite index represents the cross product of two or more sets representedby simple indices. Composite indices are denoted by an uppercase characterfollowed by a lowercase character.
3. A lowercase name indicates given data; relevant indices are subscripted. Theunits of each type of data are indicated immediately following the name.
4. Uppercase names denote decision variables. Again, the units of each decisionvariable immediately follow the variable name.
21

5. In the mathematical formulation, composite indices may be replaced by theircomponent indices to aid understanding of the summations.
6. (a,b) c G(AB,C) indicates that there exist an element c E C such that
(a,b,c) c G(AB,C).
INDICES
s Service -- /Army, Navy, AirForce, Marine, Allied/Indicates instance service. Services are selected based on JCS guidance.
p Platform -- /PF 1... PFx/Indicates the friendly weapons platform instance. Ground weapons platforms areimported from TACWAR; air weapons platforms are from WORRM inputs.
d Target types -- /TT1 ... TTx/Indicates instance target type. Target types are based on TACWAR data.
r Major Theatre of War (MTW) -- /MITW1 ...MTW2/Model assumes two nearly simultaneous MTWs based on JCS guidance.
b Range band -- /RB1...RB5/Indicates geographical distance from the FEBA. TACWAR, which provides the data,assumed five range bands with a depth of 40km each.
m Munitions Type -- /MT1...MTx/Indicates munitions instance. Munitions are imported from TACWAR and WORRMinputs.
t phase -- /Halt, E-Build, L-Build, E-Counter, L-Counter/Indicates time phase of an MTW. Model assumes the given five phases based onTACWAR.
Composite indices
ShsIp Valid shootersSet of all possible combinations of service and platform that make up a valid shooter.Thus, the ordered pair (s,p) is an element of set Sh only if service s is equipped withplatform p. This set is formed from TACWAR data. It is a sparse subset of all possiblepairs (s,p).
Tar,b TargetsSet of all possible combinations that constitute a valid target. A valid target instance is atarget type that exists in the given MTW and range band. This set is formed fromTACWAR data and is also sparse.
22

ESsh,Ta,mt Engagement SetSet of all possible combinations of(s, p, d, r, b, m, t) that may occur in the model. Thisset is formed based on JCS guidance and "military common sense."
Oesh,Ta,m,t Over-assignments Engagement Set.Set of all possible combinations in which an over-assignment may occur. This set isformed dynamically and is a function of the engagement set, the permitted redundancy,the ekp data, and the service goals.
DATA
Target datainittgtTa (targets)
Initial number of targets.
tgtgoald,r,t (targets)CinC goal for a given target.
tgtvalT., t (points/target)Value of given target under given conditions
Platform datainitpltshr (platforms)
Initial number of platforms.
pltgoalst4,r,t (platforms)A given platform's availability in phase t.
pltvalsw4 ,t (points/platform)Penalty weight for platform availability goal
Service datasvcgoals,d,r,t (percent of targets)
CinC goal for each service to achieve against a given target under givenconditions.
svcvals,d,r,t (points/target)Penalty weight for service goal.
Operations and Effectiveness dataekpSh, d,r,•t (targets/platform)
Expected kills for a specific platform against a specific target under givenconditions.
attSd,r,t (platforms/assignment)Expected attrition of a specific platform when engaging a specific target undergiven conditions.
23

munperasgd,m (munitions/target)Required munitions expenditure of type m to kill a target of type d
reinfsh,r,t (platforms)Number of friendly reinforcements arriving.
regencapd,r,t (targets)Upper bound for the number of targets regenerating during phase t.
regenfrcd,r,t (unitless)Upper bound for the fraction of dead targets regenerating during time t.
resuplysh,r,nt (munitions)Re-supply of ammunition for a specific platform under given conditions.
overTa,t (unitless)Allowable over-assignments.
Scaling dataoverparml (unitless: 0 < overparml < 1)
Goal 1 over-achievement reward / under-achievement penalty
overparm2 (unitless: 0 < overparm2 < 1)Goal 2 over-achievement reward / under-achievement penalty
overparm3 (unitless: 0 < overparm3 < 1)Goal 3 over-achievement reward / under-achievement penalty
DECISION VARIABLES
PlatformBEGPLTSbr,t (platforms > 0)
Number of service s's platforms p in MTW r at start of phase t.
ENDPLTShr (platforms > 0)Number of service s's platforms p in MTW r at the end of the time horizon.
TargBEGTGTTa,t (targets Ž 0)
Number of live targets of type d in MTW r, range band b, at start of phase t.
ENDTGTTa (targets > 0)Number of live targets of type d in MTW r, range band b, at the end of the time horizon.
24

MunitionsBEGMUNsh,n,•r,t (munitions _> 0)
Number of munitions available for assignment in service s's platform p in MTWr, at start of phase t.
ENDMUNsimr (munitions __ 0)Number of munitions existing at the end of the time horizon.
AssignmentsASSIGNES (platforms > 0)
Number of platforms of type p from service s using munition m assigned to targetd in MTW r and range band b during phase t.
OVASSIGNoe (platforms Ž 0)Number of platforms of type p from service s using munition m over-assigned totarget d in MTW r and range band b during phase t.
RegenerationREGENT.,t (targets Ž 0)
Number of targets of type d in MTW r and range band b that were dead in phaset- 1 and are regenerated for phase t.
AchievementACHIOTa,t (targets)
Over-achievement of target goal
ACH1UTm,t (targets)Under-achievement of target goal
ACI2Oshr,t (platforms)Over-achievement of platform goal
ACH2Usir,t (platforms)Under-achievement of platform goal
ACH30s, d,r,t (targets)Over-achievement of service goal
ACH3Us,dr,t (targets)Under-achievement of service goal
25

FORMULATION
GOAL Minimize:
I Z (tgtValdrb,t ACH1Urt)-(djr)eTa t~b
Z: Z:(overparrnl I -ACH1Oaldrbt(d•r)c-Ta týr
S(pltvalsh r~t. ACH2U shr~t)
ShIr,t
1: (overparm2. pltvalShrt•* ACH2Os,*rt)J+
Sh,r,t
I (svcval s,d~r,t ACH3UsdrJt)-s,(c~r)eTa, t
-' (overparm3. svcvalsd,rt ACH30sd,rt)s,(d~r)eTa, t
Minimize under-achievement of the three goals while rewarding over-achievement at a reducedrate.
Such that:
TARGET GOAL
I (ekps,, r,tASSIGNshjdrbm,,t tgtgoald,rt +ACH1Oatrt - ACH1Udrt
Sh,b,m st.(Sh4dr,bmt)GEs
V (d,r) e Ta, t
The targets killed in each MTW and time period differs from the goal by the amount of under orover achievement.
PLATFORM GOALBEGPLTsh.rt = pltgoalsh rt + ACH20sb,t - ACS2Ush,,t V Sh, r, t #" halt"
The number of platforms of a given type from each service in an MTW differs from that goal bythe amount of under or over achievement.
26
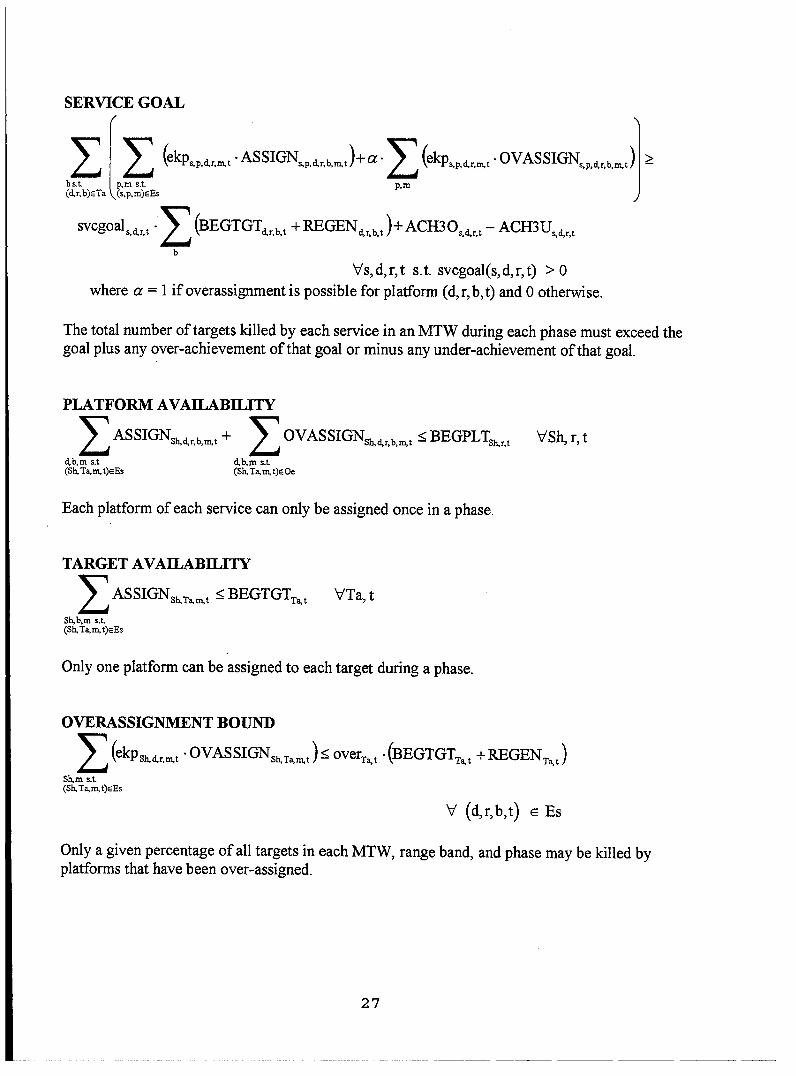
SERVICE GOAL
b (ekpspdr, n4t "ASSIGN,,P,'rb,"mt)+ a" - (ekp•p'drmt "OVASSIGN,'P'd'rbmt)j >
(d~r,b)eTa ~(sp,m~rnEs pJ
svcgoal5, d * _1 (BEGTGTrb~t +REGENdrb,t )+ACH3Osd,rt -ACH3Usd,rt
b
Vs, d,r,t s.t. svcgoal(s, d, r, t) > 0where a = 1 if overassignment is possible for platform (d,r,b,t) and 0 otherwise.
The total number of targets killed by each service in an MTW during each phase must exceed thegoal plus any over-achievement of that goal or minus any under-achievement of that goal.
PLATFORM AVAILABILITY
I ASSIGNshd.•.b~m + I OVASSIGNS1d~rbrmt < BEGPLTsý4,. VSh, r, t
d,bm s.t d,bm s.t(ShTa,mt)EEs (ShTan,.t):Oe
Each platform of each service can only be assigned once in a phase.
TARGET AVAILABILITY
I ASSIGNSh.Ta.J:t < BEGTGTTat VTa, tShbbm s.t(Sh, Ta,rnt)EEs
Only one platform can be assigned to each target during a phase.
OVERASSIGNMENT BOUND
1: (ekph " OVASSIGNSb.Ta, )m overT ." (BEGTGTTSat + REGENTat)
Sh, m s.t(ShTam,mt)rEs
V (d,rb,t) c Es
Only a given percentage of all targets in each MTW, range band, and phase may be killed byplatforms that have been over-assigned.
27

REGENERATION BOUNDSREGENTa,t < regenfrcL ,r.t "(inittgt a -BEGTGTTt) V Ta, t #" halt"
REGENTa,t < regencapdrt V Ta, t #" halt"
The number of targets that regenerate in a given MTW, range band, and phase is limited by twoseparate constraints. Regenerations cannot exceed a given fraction of the dead targets nor canthey exceed the given limit on the number of targets capable of regenerating.
TARGET BALANCE
BEGTGTT + at * ENDTGTT,, = BEGTGTTrt + REGEN.,t - 1 (ekpSkdr.rntASSIGNs.,t)
Shm s.t.(Sh,Ta,mn,t)eEs
V Ta,twhere a, = 0 if t is not the last phase
a= 1 if t is the last phase.
The number of each target in a MTW, range band, and phase is equal to the number that werethere in the prior phase plus any that regenerate minus those that are destroyed.
PLATFORM BALANCEBEGPLTsirt+i +±a,• ENDPLTslI, = BEGPLTsr.t -
I-' (attslir ,,t •AS SIGNsk, dr~b.t)-
d,b,m st.(Sh,Ta, m,t)r.Es
1 (attShrt OVAS+SIGNSkdrt
d,b,m s.t(Sh,Ta,rn,t)eOe
reinfshr.t V Sh,r,t
where at = 0 if t is not the last phase
at = 1 if t is the last phase.
The number of each platform in a MTW from each service during a phase is equal to the numberin the prior phase minus those destroyed due to assignments or over-assignments plus anyreinforcements that arrive.
28
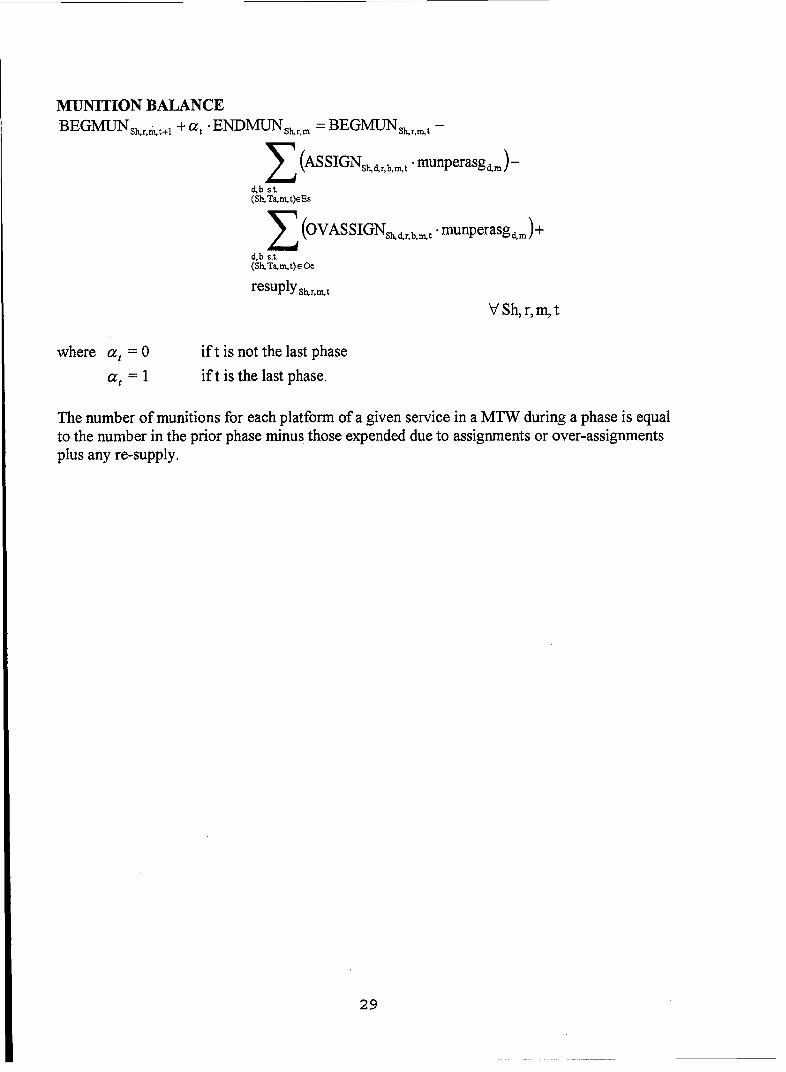
MUNITION BALANCEBEGMUNsh,r,t+i + at ENDMUNsb1r, = BEGMUNshmt
I (ASSIGNSKId,b,mt•, munperasgdm)-
d,b st(ShTa,rm,t)eEs
I (OVASSIGNsrd,,bmt "munperasg m m
d,b s.t(ShTa,Mt)e 0e
resuplysh, r,mt
VSh, r,m,t
where a, = 0 if t is not the last phase
at = 1 ift is the last phase.
The number of munitions for each platform of a given service in a MTW during a phase is equalto the number in the prior phase minus those expended due to assignments or over-assignmentsplus any re-supply.
29

30

1V. THE DYNAMIC MODEL
A. DISCUSSION
The dynamic model uses the same data set as the monolithic model. Although it inputs
all phases concurrently, the dynamic model uses only the data indexed with the current phase in
each invocation of the solver. To form the dynamically optimized PTD, the GAMS model is run
with the solver placed in a time-indexed loop. For each phase of the problem, the solver
produces an optimal allocation for that individual phase. Once that single-phase allocation is
optimal, the GAMS code recalculates various parameters for the next run. The dynamic model
repeats this loop until all phases are complete.
A typical scenario generates a matrix with approximately 11,000 rows, 75,000 columns,
and 325,000 non-zero elements during each phase. A Sun Workstation model Ultra 200E with
128 megabytes of RAM, using CPLEX 4.0, requires approximately five seconds to solve each
phase. The entire model, including parameter recalculations, requires approximately five
minutes.
Although the dynamic model appears to be only approximately twice as fast on the Sun
Workstation, it is many time faster than the monolithic on a personal computer. Test runs
indicate that the dynamic model is up to fifteen times faster on these machines. These test runs
were conducted on an IBM computer with a Pentium 166 MHz processor and 32 Mb of RAM.
The input file for the largest scenario was over 15 Mb. The monolithic model required over
fifteen hours to solve this scenario; the dynamic version solved it in slightly less than one hour.
31
B. DYNAMIC MODEL FORMULATION
The following is a mathematical description of the dynamic model using the Naval
Postgraduate School format. Conventions used are identical to those for the monolithic model.
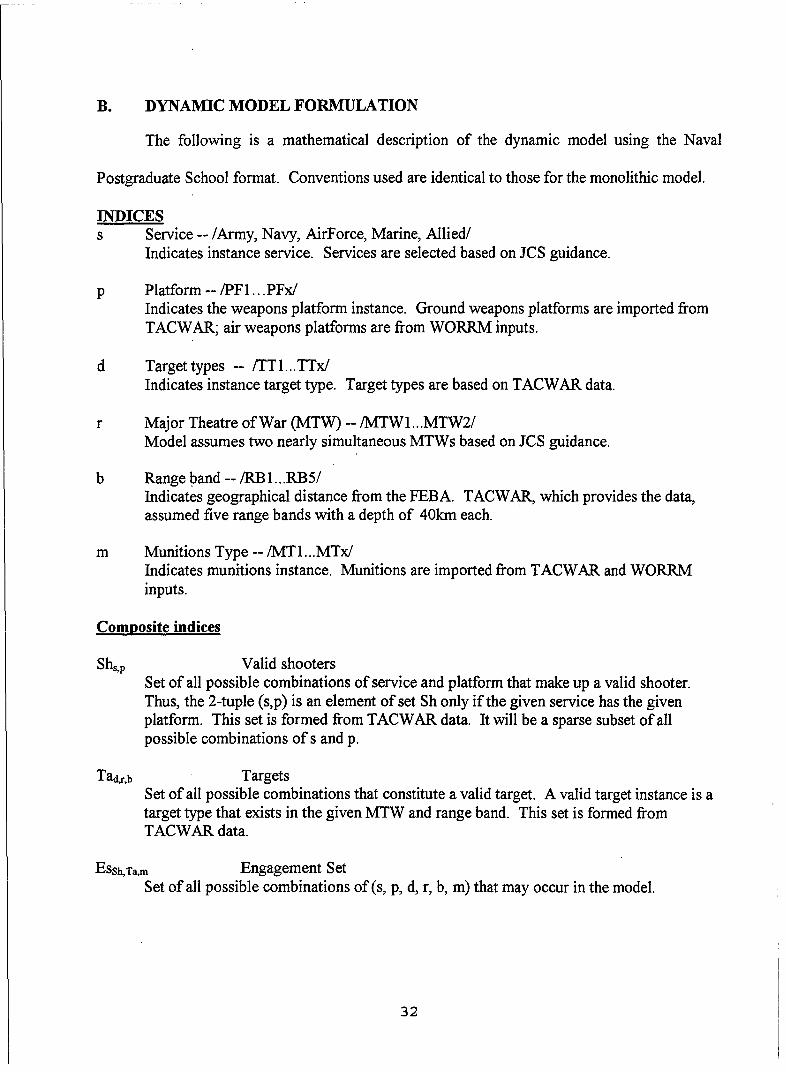
INDICESs Service -- /Army, Navy, AirForce, Marine, Allied/
Indicates instance service. Services are selected based on JCS guidance.
p Platform -- /PF 1... PFx/Indicates the weapons platform instance. Ground weapons platforms are imported fromTACWAR; air weapons platforms are from WORRM inputs.
d Target types -- /TT1...TTx/Indicates instance target type. Target types are based on TACWAR data.
r Major Theatre of War (MTW) -- /MTWl...MTW2/Model assumes two nearly simultaneous MTWs based on JCS guidance.
b Range band -- /RB 1...RB5/Indicates geographical distance from the FEBA. TACWAR, which provides the data,assumed five range bands with a depth of 40km each.
m Munitions Type -- /MT1...MTx/Indicates munitions instance. Munitions are imported from TACWAR and WORRMinputs.
Composite indices
ShsIp Valid shootersSet of all possible combinations of service and platform that make up a valid shooter.Thus, the 2-tuple (s,p) is an element of set Sh only if the given service has the givenplatform. This set is formed from TACWAR data. It will be a sparse subset of allpossible combinations of s and p.
Tad,r,b TargetsSet of all possible combinations that constitute a valid target. A valid target instance is atarget type that exists in the given MTW and range band. This set is formed fromTACWAR data.
ESSh,Ta,m Engagement SetSet of all possible combinations of(s, p, d, r, b, m) that may occur in the model.
32

Oesh,Ta,m Over-assignments Engagement Set.Set of all possible combinations in which an over-assignment may occur. This set isformed dynamically.
DATA
Target datainittgtT, (targets)
Initial number of targets.
tgtgoald,r (targets)CinC goal for a given target.
tgtvalTa (points/target)Value of given target under given conditions
Platform datainitpltskr (platforms)
Initial number of platforms.
pltfgoalsh,r (platforms)A given platform's availability at the end of the period.
pltvalsir (points/platform)Penalty weight for platform availability goal
Service datasvcgoals,,r (percent of targets)
CinC goal for each service to achieve against a given target under givenconditions.
svcvals,d,r (points/target)Penalty weight for service goal.
Operations and Effectiveness datainitmunsh,r,m (munition)
Munitions of type m for specified service, platform, & MTW triple.
ekpSh,d,rm (targets/platform)Expected kills for a specific platform against a specific target under givenconditions.
attsh,d,r (platforms/assignment)Expected attrition of a specific platform when engaging a specific target undergiven conditions.
33

munperasgd,m (munitions/target)Required munitions expenditure of type m to kill a target of type d
overTa (unitless)Allowable over-assignment to target d in MTW r and range band b.
Scaling dataoverparml (unitless: 0 < overparml < 1)
Goal 1 over-achievement reward / under-achievement penalty
overparm2 (unitless: 0 < overparm2 < 1)Goal 2 over-achievement reward / under-achievement penalty
overparm3 (unitless: 0 < overparm3 < 1)Goal 3 over-achievement reward / under-achievement penalty
DECISION VARIABLES
PlatformENDPLTskr (platforms _> 0)
Number of service s's platforms p in MTW r at the end of the time horizon.
TargeENDTGTTa (targets > 0)
Number of live targets of type d in MTW r, range band b, at the end of the timehorizon.
MunitionsENDMUNsh,n,r (munitions > 0)
Number of munitions existing at the end of the time horizon.
AssignmentsASSIGNEs (platforms Ž 0)
Number of platforms of type p from service s using munition m assigned to targetd in MTW r and range band b.
OVASSIGNoe (platforms __ 0)Number of platforms of type p from service s using munition m over-assigned totarget d In MTW r and range band b.
AchievementACHIOTa (targets)
Over-achievement of target goal
34
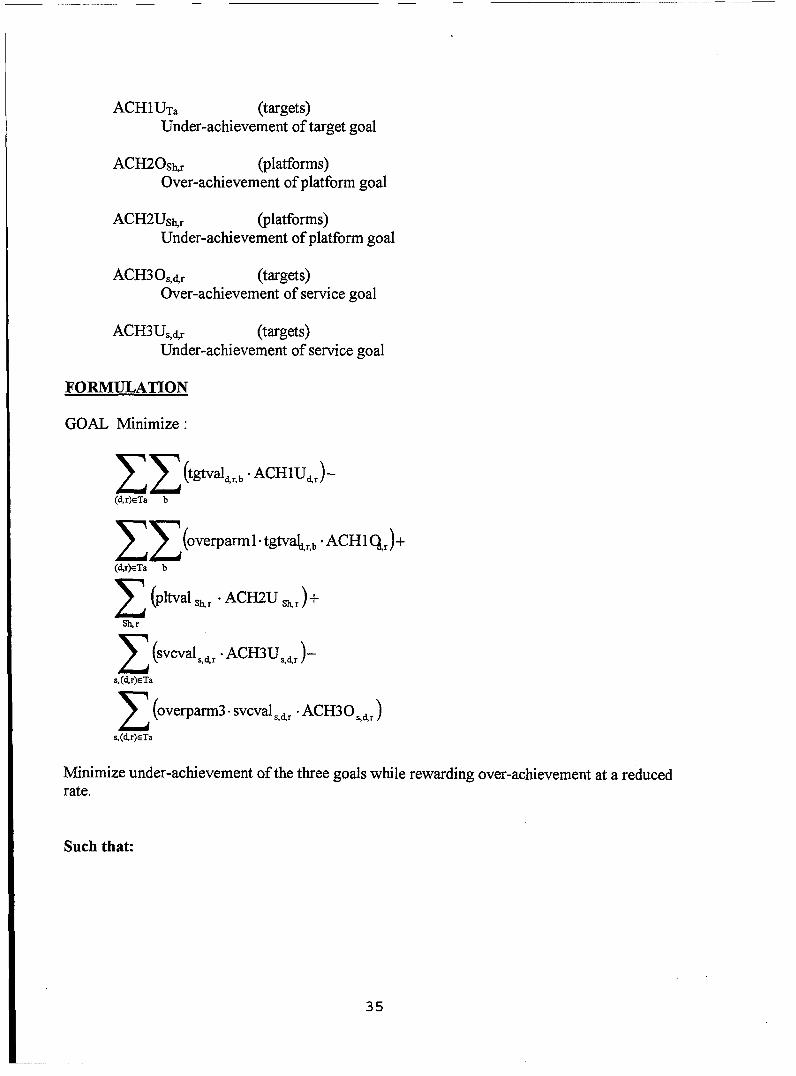
ACH1UTa (targets)Under-achievement of target goal
ACH2Osk,r (platforms)Over-achievement of platform goal
ACH2USh,r (platforms)
Under-achievement of platform goal
ACH3Os,d,r (targets)Over-achievement of service goal
ACH3Us, d,r (targets)
Under-achievement of service goal
FORMULATION
GOAL Minimize:
1 1 (tgtal rb *AHU(d,r)ETa b
y:(,overparmI1.tgtv4, 1,b -ACHI %,)(dr)ETa b
I (pltval Shr ACH2U Shr )+
Slur
I (Svcvals,dr "ACH3U,d, )--
s,(d,r)rTa
•- (overparm3. svcval djACH COrd,,)s,(d,r)rTa
Minimize under-achievement of the three goals while rewarding over-achievement at a reducedrate.
Such that:
35
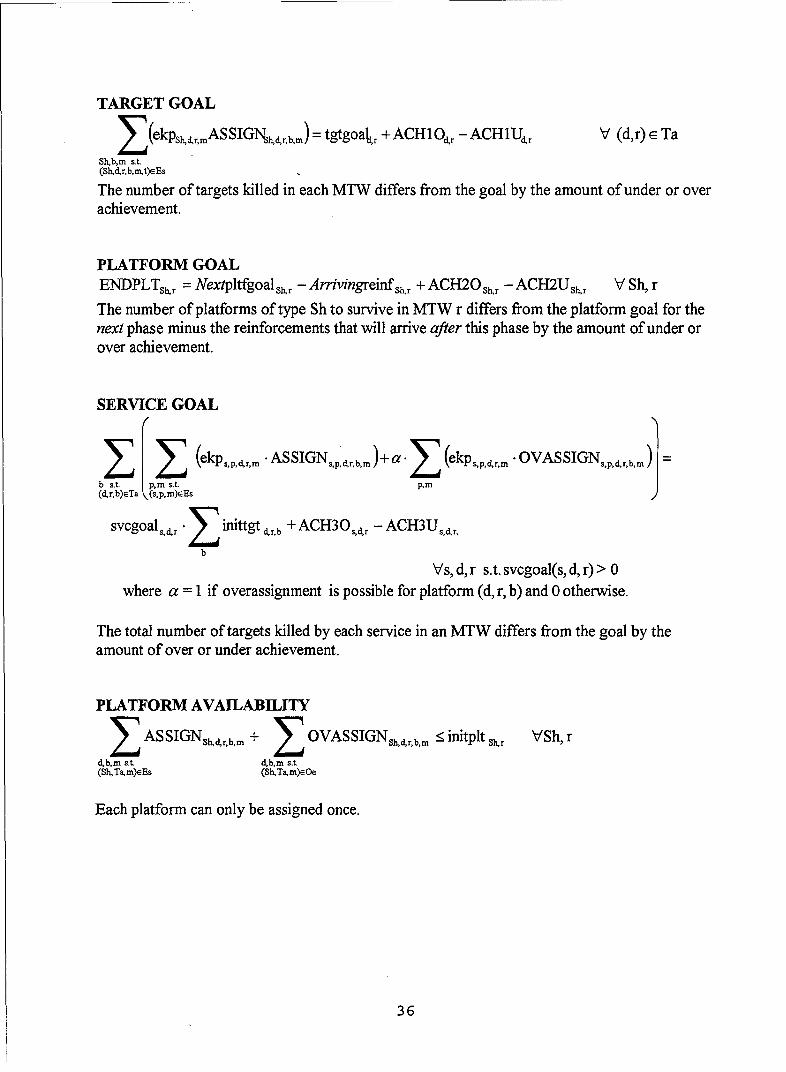
TARGET GOAL
7 (ekpsl .r, mASSlGNIhd,r,b,m) = tgtgoal, + ACHOId r-ACHIUd,r V (d,r) E Ta
Shb,m s.t.(Sh,d,r,b,m,t)GEs
The number of targets killed in each MTW differs from the goal by the amount of under or overachievement.
PLATFORM GOALENDPLTSh,ir = Nextpltfgoals,, - Arrivingreinf s.,r + ACH2OSh, r - ACH2Ushr V Sh, r
The number of platforms of type Sh to survive in MTW r differs from the platform goal for thenext phase minus the reinforcements that will arrive after this phase by the amount of under orover achievement.
SERVICE GOAL
SIZ (ekpd,,P'c'r "ASSIGNspdrb'm )+a." (ekpsPdtrm "OVAS SIGNS pd¢r'b'm
b s~t I, S~t. p, m(d&r~b)rTa ý(s,p~rm)cEs
svcgoal,,,d• inittgt dr~b +ACH30sr - ACH3Usdr
b
Vs, d, r s.t. svcgoal(s, d, r) > 0where a = 1 if overassignment is possible for platform (d, r, b) and 0 otherwise.
The total number of targets killed by each service in an MTW differs from the goal by theamount of over or under achievement.
PLATFORM AVAILABILITY
I ASSIGNSh.rbm + I OVASSIGNSd.rb•m < 1initplt Sb VSh, r
d,bm s.t d~b,m s.t(Sh, Tam)aEs (ShTam)sOe
Each platform can only be assigned once.
36

TARGET AVAILABILITYI ASSIGNshTam < inittgtTa VTa
Sh,m s.t.(Sb, Ta,m)eEs
Only one platform can be assigned to each target.
OVERASSIGNMENT BOUND
Z (ekpSh,&r'm "OVASSIGNShTm)<) overTa "inittgt Ta V (d, r, b)c Es
Sh,m s.t(Sh, Ta, m)eEs
Only a given percentage of all targets in each MTW and range band may be killed by platformsthat have been over-assigned.
TARGET BALANCE
ENDTGTr. = inittgtra - Z (ekpshdr. m* AS SIGNIsTam) V Ta
Shm s.t(ShTa, m)eEs
The final number of each target in a MTW and range band is equal to the number that were therein the beginning minus those that are destroyed.
PLATFORM BALANCEENDPLTsr = initpltrs,, -
I (attsk,"r 'AS SIGN Shdarb.m -
d,b,m s.t.(SkTa,m)eEs
Z (attsb.r- 'OVASSIGNsbaIrb,m) VShr
d,b,m s.t(Sb, Ta, m) e Oe
The number of each platform at the end of the period is equal to the number in the beginningminus those destroyed due to assignments or over-assignments.
37

MUNITIONS BALANCEENDMUNsbrm = initmun Shr~m -
I (ASSIGNshdrbm -munperasgrm)-
d.b st.(Sh Tam)SEs
E (OVAS SIGNSh• r.b, m" munperasg•m)
d,b st.(Sh.Tam)e Oe
VSh,r,m
The number of munitions remaining for each platform of a given service in a is equal to the
initial number minus those expended due to assignments or over-assignments.
C. INTERPHASE CALCULATIONS
The interphase calculations merely adjust each phase's data to account for the results of
the previous phase. The regeneration computations determine how many enemy platforms have
regenerated between the phases. The balance equations modify the data controlling the initial
number of platforms, targets, and munitions.
1. Regeneration Computations:
totdead(d,r,b,t) = starttgt(d,rb,'ti') - ENDTGT.L(d,rb)
The total number of dead targets is the number that started the first phase minus thosethat survived the last phase.
maxregen(d,r,b,t) = regenfrc(d,rt) * totdead(d,r,b,t)
The maximum number of targets that can regenerate is a fraction of those that have beenkilled.
regen(d,r,b,t) = min (regencap(d,rt),maxregen(d,r,b,t)
The number of targets that regenerate is either the limit placed on regeneration by thedata or a given fraction of the dead targets, whichever is less.
2. Balance Computations
inittgt(d,r,b) = ENDTGT.L(d,rb) + regen(d,rb,t)) V t# late counter-attack
The initial number of targets is equal to the number that survived the prior phase plusthose that regenerate.
38
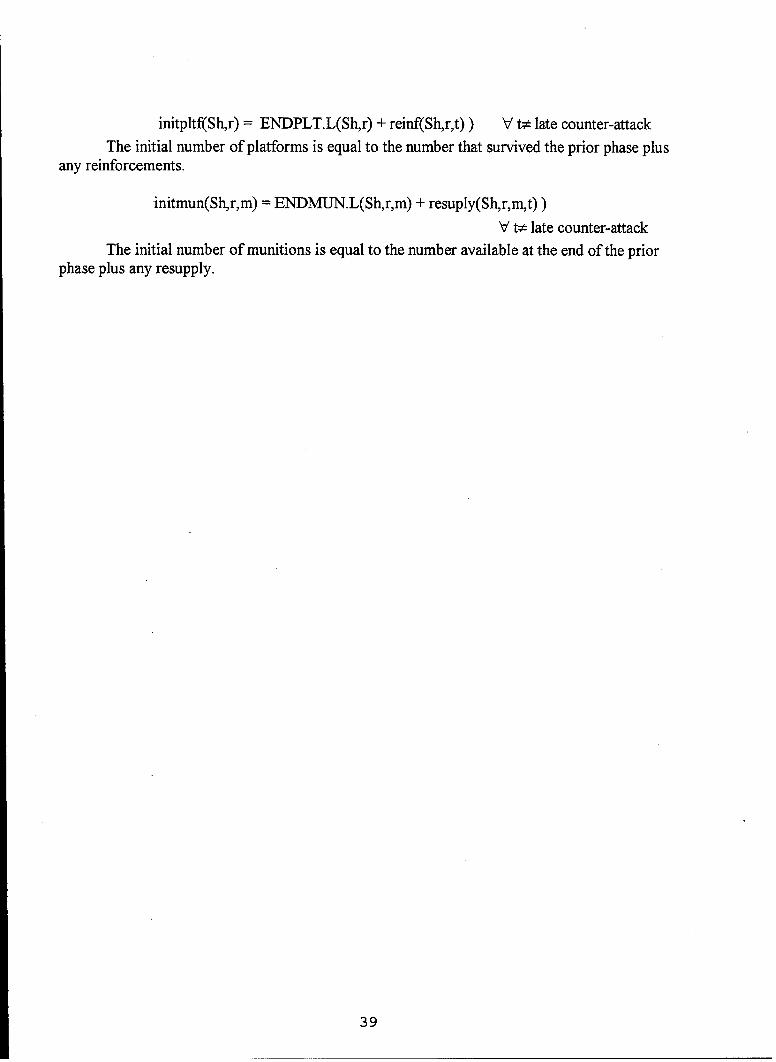
initpltf(Sh,r) = ENDPLT.L(Shr) + reinf(Sh,r,t)) V t• late counter-attack
The initial number of platforms is equal to the number that survived the prior phase plusany reinforcements.
initmun(Sh,r,m) = ENDMUN.L(Shr,m) + resuply(Sh,r,m,t))V t# late counter-attack
The initial number of munitions is equal to the number available at the end of the priorphase plus any resupply.
39

40

V. RESULTS AND CONCLUSIONS
A. RUN TYPES
As of publication, the PTD model has been run on only one realistic data set. Despite the
relative ease with which the PTD is produced, gathering and inputting all the data remains a non-
trivial task. The monolithic model, developed first, has been tested on several smaller data sets
and the results verified by expert opinion. The realistic data set (classified Top Secret) produced
a PTD comparable to those previously developed by the CinCs. Another scenario is currently
being readied for input into the PTD model.
The dynamic model has also been run using all of the data sets developed for the
monolithic model. As expected, and desired, the dynamic model produces solutions generally
comparable to those of the monolithic model.
The monolithic and dynamic models should both be used as tools in the formation of
each PTD. Although they are a significant part of the process, it is important to remember that
the models are still only tools. Each has strengths and weaknesses that will make it more or less
relevant to a particular scenario. While the results of the models will generally be comparable,
any wide disparity will require careful analysis. As a starting point, the analyst may wish to look
for the prevalence of alternative optima, which may be the cause of differences between results
of the two models. One approach to preventing alternative optima is to add an extra, lightly
weighted term to the objective function to break ties. The other most likely cause for large
differences is the myopic view of the dynamic model. It will be much harder for the analyst to
determine the cause for differences attributable to this myopia, however. Unfortunately, no easy
solution to this problem is offered in this thesis, but an idea for future research is indicated later
in this chapter.
41

B. RESULTS
The Top Secret classification of the data sets prevent the discussion of results for specific
runs. In a general sense, however, the models provide the desired results - a defensible phased
threat distribution - according to the project sponsor.
As desired, both models provide the Joint Staff with an optimal allocation for the given
input and model parameters. The parallels between the monolithic and dynamic model prevent
wildly divergent solutions, yet there are obvious differences. These differences can be attributed
to the difference in the overachievement reward during the beginning phases and the myopic
view of the dynamic model.
Most importantly, both models provide a PTD that compares favorably with those
developed without the model. The distribution provided is optimal with respect to the given
scenario and withstands the review of experts.
C. BENEFITS OF MODEL
1. Speed
Both the monolithic and dynamic models significantly reduce the time required to
produce a valid PTD. The primary time requirement when using these models is the collection
and processing of the input data. Once the analyst prepares the data for the models, producing
the PTD occurs relatively quickly. This is in contrast to prior PTDs, where data collection was
merely the very beginning of a long process. Additionally, as preparing the input data becomes
more automated, using the models will become quicker and easier.
2. Reduced Workload
Although the CinCs will still have input into the CBMR process, the models formulated
in this thesis will help eliminate the requirement that they produce the PTD. This obviously
42

reduces their workload. In addition, however, the Joint Staff will also be able to produce the
PTD with less effort than in the past. In addition to providing the PTD, the models provide run
reports and sensitivity analysis that allow the analysts to quickly conduct a rough validation of
the results. These reports provide an overall picture that allows the analyst to quickly ensure that
the answer is reasonable. The models thus automate much of the work associated with validating
the PTD.
3. Sensitivity Analysis
As just mentioned, the sensitivity analysis will allow the Joint Staff to more quickly
validate a given PTD. In addition, it will allow the analyst insights that may otherwise be
unattainable. The models may, for example, highlight a critical munition or expose a service
goal that seriously hinders operations. Much of the value in producing the PTD with these
models may be in the insights such sensitivity analyses provide.
These models provide the analyst with sensitivity analysis in two ways. First, the model
provides a report on the marginal values of the key variables and constraints. This highlights
those variables and constraints that are most important in forming a particular PTD. Secondly,
the models produce a PTD so quickly that an analyst may run them many times with modified
input data. This allows the analyst to determine the effects of specific -- possibly real world --
constraints. For example, the analyst could easily determine the effect on a scenario if a critical
munition were to become unavailable. This type of analysis is time-prohibitive without these
models.
4. More Easily Defended Rationale
Although having experts determine the PTD based on their experience may be valid, it is
very hard to quantify and explain their criteria. This leaves PTDs so developed open to criticism.
The models developed in this thesis have easily explained criteria and derive data from generally
43

accepted sources. Although a critic may still question an individual criterion or data set used in
the model, the rationale justifying a single element is much more easily explained and defended
than justifying an experts opinion on the PTD in general. For this reason, PTDs produced using
these models are much easier to defend from outside agency criticism.
D. SUGGESTED FUTURE WORK
The sponsor of this thesis very much considers these models works in progress. The
models will be continually refined and improved upon into the foreseeable future. The following
items may all be fruitfully addressed.
1. Refine the Data
The most immediately effective improvement to the models is the continued refinement
of the data sets. As with any model, improved accuracy within the data set yields improved
results. Although cost and tiiie constraints made using existing data sets essential, this clearly
forced compromise. The user may wish to modify the model to take advantage of any newly
developed data sets that are superior to existing ones. These data sets may be superior in the
quality or fidelity of the data provided.
Improved fidelity will also address a current weakness of the models. There are cases in
which the models may have a large amount of dual degeneracy which causes alternative optima.
This condition is encouraged when the input data sets do not always adequately differentiate
between elements within a set. Both Army and Marine tanks, for example, are equally effective
against a given target. This equivalence, in some cases, makes the model indifferent between
allocating the target between the two platforms. Massive dual degeneracy leaves the model open
to criticism.
44
Improved data sets will help alleviate this problem. Until improved data is available,
sensitivity analysis allows one to check for this condition. By modifying the data very slightly,
the analyst can discover if dual degeneracy is a problem. For the previous tank example, the
analyst could modify the Army's effectiveness by 1%. If this modification caused serious
changes to the model's results, then dual degeneracy was present.
2. Analytically Reconcile Model Differences
A possible criticism of having two models aid in the development of the PTD is that they
will develop different answers to the same questions. Obviously, they can not both provide the
best solution. The analyst must recognize that these are only tools, however. Using two
different methods to approximate a solution does not invalidate either approximation, it merely
gives the analyst more insight. To maximize the value of the two models it would be helpful to
develop a procedure to reconcile their results. The largest difference in the models will be due to
the myopic view of the dynamic model, which allows overachievement only in the last phase of
a scenario. This overachievement must be distributed to bring the models more closely in
agreement.
One way to achieve this without destroying the integrity of the dynamic model is to use
the results of the dynamic model to fix the assignments for a run of the monolithic model. This
would force the monolithic model to make the same assignments as the dynamic model, but it
could allocate the overassignments in a more advantageous manner. Another option for
spreading the overachievements is to simply divide the overachievements among the phases,
analyzing each modification to ensure that it does not invalidate the results of the dynamic
model.
45

3. Incorporate Costs
The models currently lack any information regarding the costs of the munitions that they
allocate. One goal of the Joint Staff is to incorporate this cost information and a cost goal.
Adding a cost goal to the models will allow the analyst to determine the effects that various
fiscal levels have on the PTD. In addition, cost information will allow the model to provide the
analyst with the total munitions acquisitions requirement for each service without any additional
work.
4. Use Loops to Provide Sensitivity Analysis
Perhaps the easiest modification is to place the models within loops that systematically
change various input data. For example, the loop may increase the value of a selected target
from 50% to 200% of its original value in 10% increments. Solving the model for each new
value provides the analyst with insights otherwise unobtainable.
5. Incorporate the Models Within a Simulation
The dynamic model runs quickly enough that running it within a simulation is a
possibility. The simulation would run the dynamic optimization many times using random draws
from the appropriate distribution to provide data points for any uncertain data. Each time it runs
the optimization, the simulation stores the results. The simulation could then develop a PTD that
is most desirable given uncertainty instead of the PTD most desirable given the expected values
of uncertain data.
E. ACHIEVEMENT OF OBJECTIVE
1. Improving the PTD
The model produces PTDs that vary slightly from those formulated in the past; thus, there
are changes in target and munition allocations. Given the improved development procedure and
46

increased validation capability, the Joint Staff believes PTDs developed using these models are
better than past PTDs. There are obvious changes to the allocations, but how these changes will
affect real world operations is, unfortunately, impossible to know. The only way one could
determine the effects of various allocations would be to use those allocations in identical, real
world scenarios. At some point, simulation may provide a tool with which to measure these
differences.
2. Reducing the Workload
Within six months, the CinCs anticipate that they will be relieved of having to produce
PTDs. Instead, they will be able to concentrate on providing improved data to the Joint Staff.
This data will consist largely of each CinC's concept of operations. The Joint Staff will also
have a reduced workload. They will not be required to validate the CinC's PTDs, and will have
a tool that will ease the development of the outyear PTD.
F. SUMMARY OF RESULTS
This thesis presents the beginning of a work in progress. We have developed two tools
for the Joint Staff to use in developing the PTD. These models produce improved allocations
with much less work and they have been validated by comparisons with existing PTDs. They
will free the CinCs from the burden of producing PTDs and the services will have better data for
planning. Although the tools represent a large improvement over existing procedures, there are
still improvements that can be made upon these tools. These improvements have been outlined.
47

48

APPENDIX A - MONOLITHIC GAMS CODE
$TITLE Monolithic Time Phased Threat Distribution - 02 Feb 98$offsymxref offsymlist offlisting inlinecom$ontext
By:Peter C. ByrneJoint Staff/J8/WADThe Pentagon (lD940)Washington, D.C. 20318-8000tel: 703-693-3248fax: 703-614-6601
Prof Richard E. RosenthalCpt Brian L. Widdowson, USMCNaval Postgraduate SchoolMonterey, CA 93943tel: 408-656-2795 (dsn: 878)fax: 408-656-2595
[email protected]@nps.navy.mil
Monolithic version of the TPTD model.
$offtext
optionslimrow = 00 { controls number of equations listed per blocklimcol = 00solprint = off { controls whether solver output listed }lp = Osliterlim = 150000 { iteration limit }reslim = 75000 { solver running time limit in seconds }
SETSs services and alliesp platform typed target typer major regional contingencyb range bandm munitionst time phases
$include c:\data\ptda.stt
SETSSh(s,p) shootersTa(d,r,b) targetsEs(s,p,d,r,b,m,t) eligible platform-munition-target tuples
49

PARAMETERS"* Target data
inittgt(d,r,b) Initial target inventorytgtval(d,r,b,t) Target valuetgtgoal(d,r,t) Desired target destruction
"* Platform data
initplt(s,p,r) Inital platform inventorypltval(s,p,r,t) Penalty weight for platform availability goalpltgoal(s,p,r,t) Desired platform availability
"* Service data
svcval(s,d,r,t) Penalty weight for service goalsvcgoal(s,d,r,t) Desired target destruction percent by service
ekp(s,p,d,r,m,t) Targets killed per platformatt(s,p,d,r,t) Platforms attrited per assignmentreinf(s,p,r,t) Reinforcements of platformsresuply(s,p,r,m,t) Resupply of munitionsregencap(d,r,t) Max target regeneration capacityregenfrc(d,r,t) Max fraction of dead targets that can be regeneratedmunperasg(d,m) Munitions used per assignment or overassingnment
"* Scaling Data
Overparml { \ Worth of over-achieving goal in one instance)Overparm2 { --- > relative to under-achieving it in another}Overparm3 { / MUST BE LESS THAN 1 FOR BOUNDEDNESS.)
* Report params
PARAMETER REPORT1 (*, *, *,*,*,*,*,*)
PARAMETER TGTREP(*, *, *, *)
PARAMETER PLTREP(, *,*,*,*)
PARAMETER MUNREP(*, *, *, *,*,*)
PARAMETER SUPMUNREP (*,-, *)PARAMETER SVCMUNREP (*,*, *)PARAMETER NUMSREP (*, *)
PARAMETER USEDMUNREP (*)
* Report data
startplt (s,p, r, t)starttgt (d,r,b,t)startmun (s,pr,m,t)finalplt (s,p, r,t)finaltgt (d,r,b,t)finalmun (s,p,r,m,t)
$include c:\data\ptda.dat
* Derived data
parameterRedund(d,r,b,t) Amount of overassignment where requested
Redund(d,r,b,t) = max[ 0, sum(s,svcgoal(s,d,r,t)) - 1 ]set
50
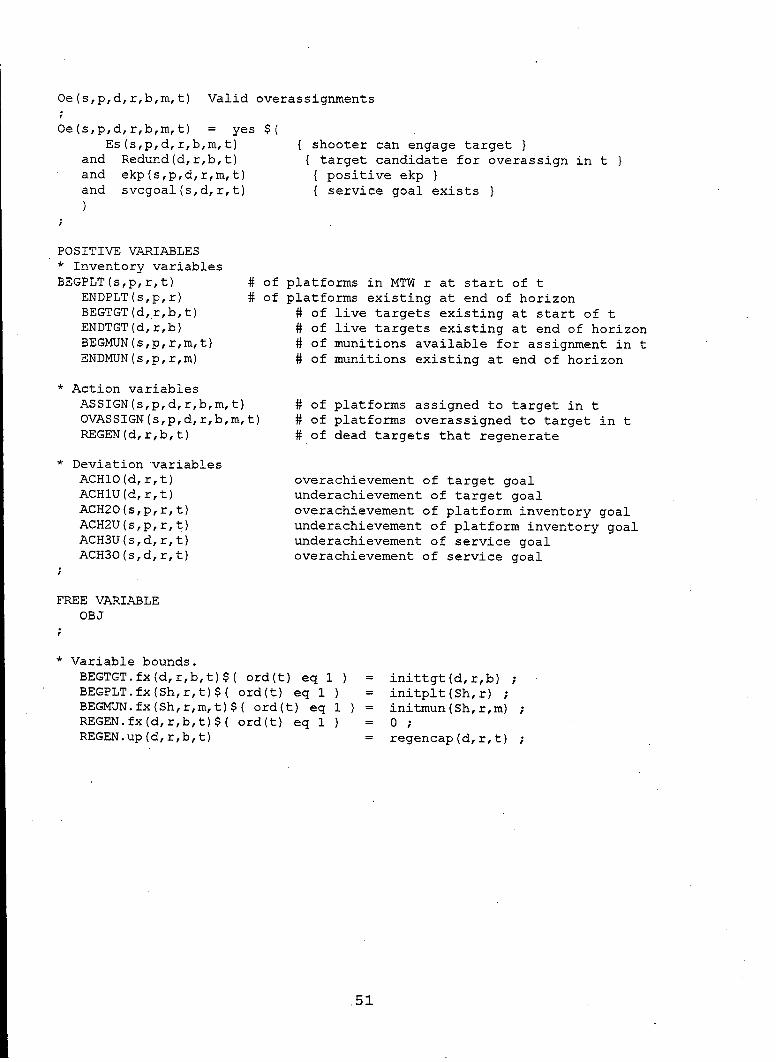
Oe(s,p,d,r,b,m,t) Valid overassignments
Oe(s, p,d,r,b,m,t) = yes $(Es(s,p,d,r,b,m,t) { shooter can engage target
and Redund(d,r,b,t) { target candidate for overassign in tand ekp(s,p,d,r,m,t) { positive ekp Iand svcgoal(s,d,r,t) { service goal exists }
POSITIVE VARIABLES* Inventory variablesBEGPLT(s,p,r,t) # of platforms in MTW r at start of t
ENDPLT(s,p,r) # of platforms existing at end of horizonBEGTGT(d,r,b,t) # of live targets existing at start of tENDTGT(d,r,b) # of live targets existing at end of horizonBEGMUN(s,p,r,m,t) # of munitions available for assignment in tENDMUN(s,p,r,m) # of munitions existing at end of horizon
"* Action variables
ASSIGN(s,p,d,r,b,m,t) # of platforms assigned to target in tOVASSIGN(s,p,d,r,b,m,t) # of platforms overassigned to target in tREGEN(d,r,b,t) # of dead targets that regenerate
"* Deviation variablesACHIO(d,r,t) overachievement of target goalACHlU(d,r,t) underachievement of target goalACH20(s,p,r,t) overachievement of platform inventory goalACH2U(s,p,r,t) underachievement of platform inventory goalACH3U(s,d,r,t) underachievement of service goalACH30 (s, d, r, t) overachievement of service goal
FREE VARIABLEOBJ
* Variable bounds.
BEGTGT.fx(d,r,b,t)$( ord(t) eq 1 ) inittgt(d,r,b) ;BEGPLT.fx(Sh,r,t)$( ord(t) eq 1 ) = initplt(Sh,r) ;BEGMUN.fx(Sh,r,m,t)$( ord(t) eq 1 ) = initmun(Sh,r,m) ;REGEN.fx(d,r,b,t)$( ord(t) eq 1 ) = 0 ;REGEN.up(d,r,b,t) = regencap(d,r,t) ;
.51

EQUATIONSOBJDEF define objectiveETGTGOAL(d,r,t) assignment goal per phase across all bsEPLTGOAL(s,p,r,t) platform availability goal per phase for all bsESVCGOAL (s, d,r, t) service goal per tgt.per phase across all bsETGTBAL Cd, r,b,t) target balance equationREGENBND Cd, r,b,t) regeneration bounded by number of dead targetsPFAVAIL (s, p,r, t) assignment bounded by number of platforms availTGTAVAIL(d,r,,b,t) assignments bounded by number of tgts availPFBAI,(s,p,r,t) platform balance equationMUNBAL(s,p, r,m, t) munition balance equation
OBJDEF..sum( (d,r)$sum((b),,Ta(d,r,b)),
sum((t,b),tgtval(d,r,b,t) * ACHlU(d,r,t))- sum( (d,,r)$sum(b,Ta(d,r,b)),
sum( (t, b),.overparml * tgtval (d, rfb, t) * ACH10 (d, r,t))+ sumn( (Sh,r,t)$( ord(t) gt 1),
pltval(Sh,r,t) * ACH2U(Sh,r,t)- sum ( (Sh, r,,t) $( ord (t) gt 1) ,
overparm2 * pltval(Sh,r,t) * ACH2O(Sh,,r,t)+ sum( (s,,d,r,t)$sum(b,.Ta(d,,r,b)),
svcval(s,d,r,.t) * ACH3U(s,d~r,t)-sum( (s,d,r,,t)$sum(b,Ta(d,,r,,b)),
overparm3 * svcval(s,d,r,t) * ACH3O(s,d~r,t)
OBJ
ETGTGOAL Cd, r,t)..sum( (Sh,m,b)$Es(Sh,d,r,b,m,t),
ekp(Sh,d,.r,m,t) * ASSIGN(Sh,,d,r,,b,.m,t))=E=
tgtgoal (d, r, t)+ ACH10 (d, r, t)-ACHlU (d, r,t)
EPLTGOAL(Sh,r,t) $( ord(t) gt 1)BEGPLT (Sh, r, t)
pltgoal(Sh,,r,t) + ACH2O(Sh,,r,t) -ACH2U(Sh,,r,t)
ESVCGOAL~s,d,r,t)sum( b$ Ta~d,r,b),
sum( (p,m)$(Sh~s,p)$Es~s,,p,d,.r,b,m,t)),ekp~s,,p,d,r,,m,t) * ASSIGN~s,p~d,r,.b,m,t))
+ 1$Redund~d,r,b,t) *sum( (p,m)$(ShCs,p)$Es~s,p,d,r,b,m,,t)),
ekp~s,,p,d,r,,m,.t) * OVASSIGN~s,.p,d,r,b,,m,t))
svcgoal~s,d,r,,t) * sum( b$Ta~d,.r,b), BEGTGT~d,r,b,t)"+ REGEN~d,r,.b,t)"+ ACH30(s, d,r, t)- ACH3U(s, d, r,t);
52

PFAVAIL(Sh,r,t)..sum( (d,b,m)$ (Ta(d,r,b) and Es(Sh,d,r,b,m,,t)),
ASSIGN(Sh,d,r,b.,m,t))+ sumn( (d,b,m)$ (Ta(d,r,b) and oe(Sh,d,r,b,m~t))
OVASSIGN(Sh,d,r,b,m,t)
BEGPLT (Sh, r, t)
TGTAVAIL(Ta,t)..sum( (Sh,m)$Es (Sh,Ta,m,t),
ASSTGN(Sh,Ta,m,t))-L=
BEGTGT (Ta, t)
OVEBN'D(Ta(d,r,b),t) $CTa(d,r,b)$Redu~nd(Ta,t))sum( (Sh,m)$(Oe(Sh,Ta,m,t)$Es(Sh,Ta,m,,t)),,
ekp(Sh,d,r,m,t) * OVASSIGN(Sh,Ta,m,t)
Redund(Ta,t) *(BEGTGT(Ta,t) + REGEN(Ta,t)
ETGTBAL (Ta Cd, r,b) ,t)..BEGTGT (Ta, t+l)
+ ENDTGT(Ta) $( ord(t) eq card(t)
BEGTGT (Ta, t)+ REGEN(Ta,t)-sumi( (Sh,m)$ Es(Sh,Ta,m,t),
ekp(Sh,.d,r,m,t) ASSIGN(Sh,Ta,m,t)
REGEN~BND(Ta(d,r,b) ,t)REGEN (Ta, t)
regenfrc(d,r,t) *Cinittgt(Ta) -BEGTGT(Ta,,t)
PFBAI (Sh, r,t)BEGPLT (Sh, r,t+1)
+ ENDPLT(Sh,r) $( ord(t) eq card(t)-E=
BEGPLT (Sh, r, t)- suxn((d,b,m)$ Es(Sh,d,r,b,m,t),
- suxnC(d,b,m)$ Oe(Sh,d,r,b,m,t),,attCSh,d,r,t) * OVASSIGN(Sh,d,r,b,m,t)
+ reinf(Sh.'r,t)
53

MUNBAL(Sh,r,m,t)..BEGMUN (Sh, r,m, t+l)
+ ENDMUN(Sh,r,m) $( ord(t) eq card(t)=E=
BEGMtJN (Sh, r, m, t)- sum((d,.b)$ Es(Sh,d,r,b,,m,,t),
ASSIGN(Sh,d,r,b,m,.t) * munperasg(d,m)- sum((d,b)$(Oe(Sh,d,r~bm~t)),
OVASSIGN(Sh,d,r,b,m,t) * munperasg(d,m))+ resuply(Sh,r,m,t)
model ptd /all/;solve ptd using ip minimizing OBJ;
SShow reports
NUMSREP("PLT",t) = sum ((Sh,r), BEGPLT.L(Sh,r,t));NUMSREP("TGT",t) = sum (Ta, BEGTGT.L(Ta,t));NUMSREP("ASS",t) = sum ((Sh,Ta,m),ASSIGN.L(ShTa,m,t));NtJMSREP("OvA",t) = sum (CSh,Ta,m),OVASSIGN.L(ShTa,m,,t));NUMSREP("MAX",t) = sum ((Sh,Ta(d,r,,b),,m)$Es(Sh,,Ta,m,t),
min(BEGPLT.L(Sh,r,t),BEGTGT.L(Ta,t) ))
option NUMSREP:O:1:1;display NUMSREP;
TGTREP (d,r,b,t,"S") = BEGTGT.L(d,r,b,t);TGTREP (d,.rb,t,,"F") = BEGTGT.L(d,r,b,t)
+ REGEN.L(d,r,b,t+1)- sum( (Sh,m)$ Es(Sh,d,r,b,m,t),.
ekp(Sh,d,r,,m,t)ASSIGN.L(Sh,d,r,b,m,t) )
option TGTREP:O:3:2;display TGTREP;
PLTREP (s,p,r,t,"S") = BEGPLT.L(s,p,r,t);PLTREP (s,,p,r,t,"F") = BEGPLT.L(s,p,r,t)
- sum((d,b,m)$Es(s,p,d,r~b,m,t),att(s,p,d,r,t) * ASSIGN.L~s,p,d,r,b,m,t)
- sum((d,b,,m)$Oe(s,,p,d,.rb~m,t),
+ reinf(s,p,r,t+1);option PLTREP:O:3:2;display PLTREP;
USEDMUNREP(m) = sum ((Sh~dr,,b,t),ASSIGN.L(Sh,d,,r,,b,in,t)+OVASSIGN.L(Sh,d,r,.b,m,t)
*munperasg(d,m)
option USEDMUNREP:O:O:1;display USEDMTJNREP;MEJNREP (s,p,r,m,t,"S") = BEGMtJN.L(s,p,,r,m,,t);MUNREP (s,p,,r,m,t,,"F") = BEGMtJN.L(s,p,,r,,m,t)
54
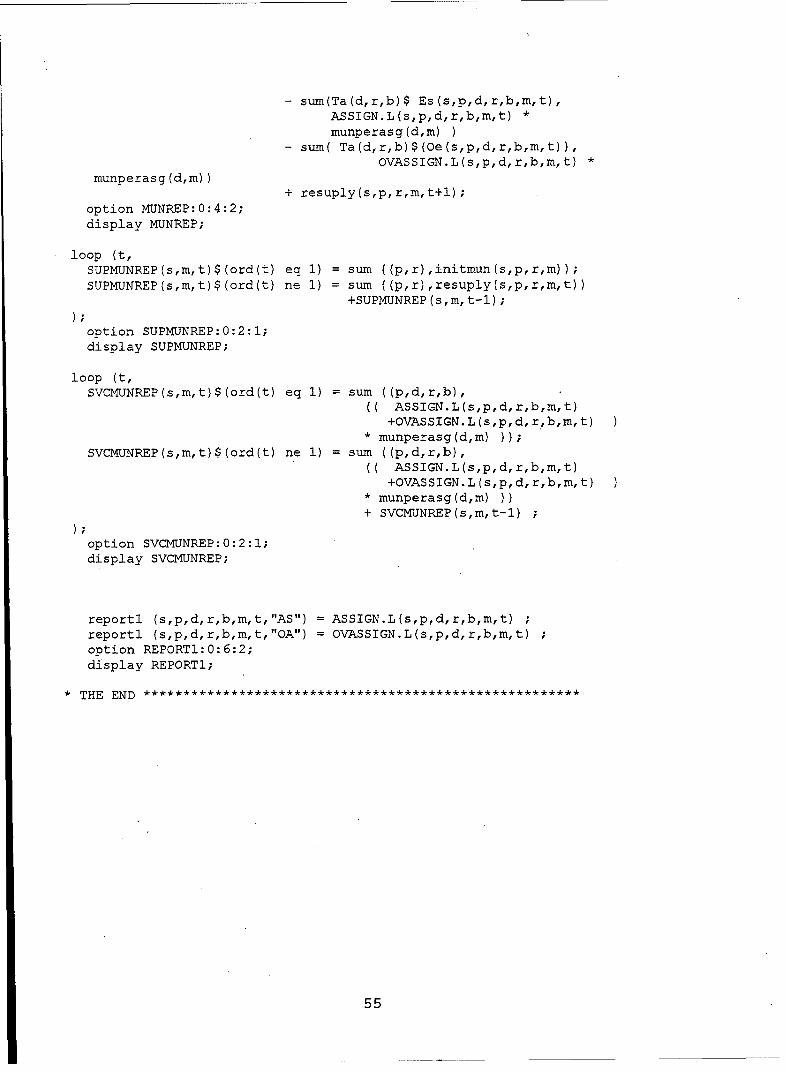
- suxn(Ta(d,r,b)$ Es(s,p,.d,r,b,m,,t),ASSIGN.L(s,p,d,r,b,m,t)*munperasg(d~m))
- sum( Ta(d,r,b)$(Oe(s~p,d,r,b,m,t)),OVASSTGN.L(s,p,,d,,r,b,m,t)
munperasg(d,m))+ resuply(s,p,r~m,t+l);
option MEJNREP:O:4:2;display MtJNREP;
loop (t,SUPMUNREP(s,m,t)$(ord(t) eq 1) = sum ((p,r),initmun(s,p,r,m));SUPMUNREP(s,m,t)$(ord(t) ne 1) = sum ((p,r),.resuply(s,p,r,,m,t))
+SUPMUNREP(s,.m,t-l);
option SUPMUNREP: 0:2:1;display SUPMUNREP;
loop (t,SVCMUNREP(s,m,t)$(ord(t) eq 1) = sum ((p~d,r,.b),,
((ASSIGN.L(s,p,d,r,.b,m,t)+OVASSIGN.L(s,p,d,r,b,m,t)
*munperasg(d,m));
SVCMIJNREP(s,m,t)$(ord(t) ne 1) =sum ((p,.d,r,b),.((ASSIGN.L~s,p,d,,r,b,m~t)+OVASSIGN.L(s,p,d,r,b,,m,t)
*munperasg(d,m) ))+ SVCMUNREP(s,m,t-1);
option SVCMUNREP: 0:2:1;display SVCMUNREP;
reporti (s~p,d~r,,b,m~t,"AS") = ASSIGN.L(s,p,d,r,b,m,t)reporti (s,p,d,r,b,m,t,"OA") = OVASSTGN.L(s,,p,d,,r,b,m,t);option REPORT1:0:6:2;display REPORTi;
*THE END
55

56

APPENDIX B - DYNAMIC GAMS CODE
$TITLE Dynamic Time Phased Threat Distribution -02 Feb 98$offsymxref offsymlist offlisting inlinecom($ ontext
By:
Peter C. ByrneJoint Staff/J8/WADThe Pentagon (1D940)Washington, D.C. 20318-8000tel: 703-693-3248fax: 703-614-6601
Prof Richard E. RosenthalCpt Brian L. Widdowson, USMC
Naval Postgraduate SchoolMonterey, CA 93943tel: 408-656-2795 (dsn: 878)fax: 408-656-2595
[email protected]@nps .navy. mil
Dynamic version of theý TPTD model.
$offtext
optionslimrow = 0 { controls number of equations listed per blocklimcol = 0solprint = off { controls whether solver output listedlp = osliterlim = 100000 {iteration limitreslim = 50000 1solver running time limit in seconds
SETSs services and alliesp platform typed target typer major regional contingencyb range bandm munitionst time phases
$include c:\data\ptd-a.stt
SETSSh(s,p) shootersTa(d,r,b) targetsEs (s,p,.d,,r,b,m,.t) eligible platform-munition-target tuples
57

PARAMETERS
"* Target data
inittgt(d,r,b) Inital target inventorytgtval(d,r,b,t) Target valuetgtgoal(d,r,t) Desired target destruction
"* Platform data
initplt(s,p,r) Inital platform inventorypltval(s,p,r,t) Penalty weight for platform availability goalpltgoal(s,p,r,t) Desired platform availability
"* Service data
svcval(s,d,r,t) Penalty weight for service goalsvcgoal(s,d,r,t) Desired target destruction percent by service
*Operations and Effectiveness data
initmun (s,p,r,m) Initial munition inventorymunperasg(d,m) munitions fired for each assignment madeekp(s,p,d,r,m,t) Targets killed per platformatt(s,p,d,r,t) Platforms attrited per assignment
"* Scaling Data
Overparml { \ Worth of over-achieving goal in one instance}Overparm2 { --- > relative to under-achieving it in another}Overparm3 { / MUST BE LESS THAN 1 FOR BOUNDEDNESS.}
"* Derived data
redund(d,r,b,t) Amount of overassignment where requested
"* Report formats
PARAMETER REPORT1(*,* *r*, * ***)PARAMETER TGTREP(*,*,*, * *)PARAMETER PLTREP(* ** *, *)PARAMETER MUNREP(*,*,*,*,*,*)PARAMETER DEADREP(*I*,*,*)PARAMETER USEDMUNREP(*)PARAMETER SUPMUNREP(*, *,*)PARAMETER SVCMUNREP(*,,* *)PARAMETER NUMSREP(*,*)PARAMETER MARGREP(*,*,*,,** *,* *)PARAMETER GOALREP(*, *,*, *)
"* Inter-phase data
reinf(s,p,r,t) Reinforcements of platformsresuply(s,p,r,m,t) Resupply of munitionsregencap(d,r,t) Max target regeneration capacityregenfrc(d,r,t) Max fraction of dead targets that can be regeneratedmaxregen(d,r,b,t) # of targets that can regenerate based on dead targetsregen(d,r,b,t) #of targets that regenerate: min of maxregen and regencaptotdead(d,r,b,t) total targets killed by the end of t
58

* Report data
startplt(s,p,r,t) platforms alive at the beginning of each phasestarttgt (d,r,b,t) targets alive at the beginning of each phasestartmun (s,p,r,m,t) munitions available at the beginning of each phasefinalplt(s,p,r,t) platforms alive at the end of each phasefinaltgt (d,r,b,t) platforms alive at the end of each phasefinalmun (s,p,r,m,t) platforms alive at the end of each phasemaxmarg maximum marginal value of variablesass (s,p,d,r,b,m,t) assignments made each phaseovass (s,p,d,r,b,m,t) over-assignments made each phasegoallo(d,r,t) goal 1 over-achievementgoal2o(s,p,r,t) goal 2 over-achievementgoal3o(s,d,r,t) goal 3 over-achievementgoallu(d,r,t) goal 1 under-achievementgoal2u(s,p,r,t) goal 2 under-achievementgoal3u(s,d,r,t) goal 3 under-achievement
$include c:\data\ptda.dat
* Dynamic setsSET
tnow(t) current phasetrem(t) all phases except the firsttlast(t) last phasetprev(t) phase one time period before current phasetnext(t) phase one time period after the current phaseOe(s,p, d, r,b,m, t) valid overassignments
trem(t) = yes $ (ord(t) ne 1);tlast(t) = yes $ (ord(t) eq card(t));startplt(Sh,r,t)$(not trem(t)) = initplt(Sh,r);starttgt (Ta,t)$(not trem(t)) = inittgt(Ta);startmun (Sh,r,m,t)$(not trem(t)) = initmun(Sh,r,m);redund(d,r,b,t) = max[ 0, sum(s,svcgoal(s,d,r,t)) - 1
Oe (s,p, d, r,b,m, t) = yes $(Es(s,p,d,r,b,m,t) { shooter can engage target }
and Redund(d,r,b,t) { target candidate for overassign in tand ekp(s,p,d,r,m,t) { positive ekp Iand svcgoal(s,d,r,t) { service goal exists }
POSITIVE VARIABLES* Inventory variables
ENDPLT(s,p,r) # of platforms existing at end of horizonENDTGT(d,r,b) # of live targets existing at end of horizonENDMUN(s,p,r,m) # of munitions existing at end of horizon
59

"* Action variables
ASSIGN(s,p,d,r,b,m) # of platforms assigned to target in tOVASSIGN(s,p,d,r,b,m) # of platforms overassigned to target in t
"* Deviation variablesACHIO(d,r) overachievement of target goalACHlU(d,r) underachievement of target goalACH2U(s,p,r) underachievement of platform inventory goalACH20 (s,p, r)ACH3U(s,d,r) underachievement of service goalACH30(s,d,r) overachievement of service goal
FREE VARIABLEOBJ
EQUATIONSOBJDEF define objectiveETGTGOAL(d,r,t) assignment goal per phase across all bsEPLTGOAL(s,p,r,t) platform availability goal per phase across all bsESVCGOAL(s,d,r,t) service goal per tgt per phase across all bsPFAVAIL(s,p,r,t) assignment bounded by number of platforms availableTGTAVAIL(d,r,b,t) assignments bounded by number of tgts availOVEBND(d,r,b,t) limits overassignments to allowed overlapMUNBAL(s,p,r,m,t) munitions usedTGTBAL(d,r,b,t) tgts destroyedPFBAL(s,p,r,t) platforms destroyed
** Unlike the monolithic model, the rewards for overachievement have been
** removed except for the last phase. This is to prevent greediness.** the reward for the last phase of the platform goal is also still not** applicable, since the original intent was to achieve the proper number
of platforms to begin the next phase, of which there is none. The only** overachievement rewards left then are for the terminal munition and service** goal.
OBJDEF..sum( (d,r)$sum((b),Ta(d,r,b)),
sum((tnow,b),tgtval(d,r,b,tnow) * ACHlU(d,r))- sum( (d,r)$sum(b,Ta(d,r,b)),sum( (tnow,b) $tlast (tnow),
overparml * tgtval(d,r,b,tnow) * ACH1O(d,r))
+ sum( (Sh,r,tnow)$(not tlast(tnow)),pltval(Sh,r,tnow) * ACH2U(Sh,r) )
+ sum( (s,d,r,tnow)$sum(b,Ta(d,r,b)),svcval(s,d,r,tnow) * ACH3U(s,d,r) )- sum( (s,d,r,tnow)$(tlast(tnow)$sum(b,Ta(d,r,b))),overparm3 * svcval(s,d,r,tnow) * ACH30(s,d,r)=E=
OBJ
ETGTGOAL (d, r, tnow)..sum( (Sh,b,m)$Es(Sh,d,r,b,mtnow),
60

ekp(Sh,d,r,m,tnow) * ASSIGN(Sh,d,r,b,m))-E=
tgtgoaJ.(d, r, tnow)+ ACH1O(d,r)
-ACHlU(d,r)
EPLTGOAL(Sh,r,tnow)$ (not tlast(tnow))ENDPLT (Sh, r)
=E=sum (tnext,pltgoal (Sh, r,tnext))
- reinf (Sh,r,tnow)+ ACH2O(Sh,r)-ACH2U(Sh,r)
ESVCGOAL(s,d,r,tnow)sum( b $Ta(d,r,b),
sum( (p,m)$Es(s,p,d,r,b,m,tnow),ekp(s,,p,.d,r,m,tnow) * ASSIGN(s,p,d,r,b,m))
+ 1$Redund(d,r,b,tnow) *sum( (p,m)$Oe(s,p,d,r,,b,m,,tnow),,
ekp(s,,p,,d,r,,m,tnow) * OVASSIGN(s,p,d,r,b,m)
svcgoal(s,d,,r,tnow) * sum( b$Ta(d,r,b), inittgt(d,r,b)+ ACH30O(s, d, r)-ACH3U (s, d,,r)
PFAVAIL(Sh,r,tnow)..sum( (d,b,m)$Es (Sh,.d,,r,b,m,tnow),
ASSIGN(Sh,,d,r,b,m))+ sum( (d,b,,m)$Oe(Sh,d,r,b,,m,,tnow),
OVASSIGN(Sh,d,r,b,m)
initplt (Sh, r)
TGTAVAIL(Ta,tnow)..sun( (Sh,,m) $Es (Sh,,Ta,m,tnow),,
ASSIGN (Sh, Ta, m))
inittgt (Ta)
OVEBND(Ta(d,r,,b) ,tnow)$Redund(Ta,tnow)sum( (Sh,m)$Oe(Sh,Ta,m,tnow),
ekp(Sh,d,r,m,tnow) * OVASSIGN(Sh,Ta,,m)
Redund(Ta,tnow) *inittgt(Ta)
TGTBA-L(Ta Cd, r,b) ,tnow).ENDTGT (Ta)
61

inittgt (Ta)-sum( (Sh,m)$Es(Sh,Ta,m,tnow),
ekp(Sh,d,r,m,tnow) * ASSIGN(Sh,Ta,,m)
PFBAL(Sh,r,tnow)..ENDPLT (Sh, r)
initplt (Sh, r)- sum( (d,,b,m)$ Es (Sh,d,r,b,,m,tnow),
att(Sh,,d,.r,tnow) * ASSIGN(Sh,d,r,b,m)- sum((d,b,m)$ Oe(Sh,d,r~b,.m,tnow),
att(Sh,d,r,tnow) * OVASSIGN(Sh~d,r,b,m)
MUNBAL(Sh,r,m,,tnow)..ENDMUN (S h, r .m)
=E=initmun (Sh, r,m)
- sum( (d,b) $Es (Sh,,d,r,b,m,tnow),ASSIGN(Sh,d,r,b,m) * munperasg(d,m)
- sum((d~b)$Oe(Sh,d,r,,b,m,,tnow),OVASSIGN(Sh,d,r,b,m) * rnunperasg(d,m))
model ptd / all/
loop (t,
tprev(t-l) = yes;tnow(t) = yes;tnext(t+1) =yes;
solve ptd using lp minimizing OBJ;
*REPORT INFOstartplt(Sh,r,t)= initplt (Sh,r);starttgt (d,r,b,t) =inittgt (d,r,b);startmun (Sh,r,m,t) =initmun (Sh,,r,m);
finalplt(Sh,r,t) = ENDPLT.L (Sh~r);finaltgt (d,r,b,t) =ENDTGT.L (d,r,b);finalmun (Sh,r,m,t) =ENDMUN.L (Sh,,r,m);
ass (Sh,,Ta,m,t) = ASSIGN.L(Sh,Ta,,m);ovass (Sh,Ta,m~t) = OVASSIGN.L(Sh,Ta,m);
goallo(d,,r,,t) = ACHlO.L(d,,r);goal2o(s,p,r,t) = ACH2O.L(s,p,r);goal3o(s,d,r,t) = ACH3O.L(s,,d,,r);
goallu(d,,r,t) = ACHlU.L(d,r);goal2u(s,,p,r,t) = ACH2U.L(s,p,r);goal3u(s,d,r,t) = ACH3U.L(s,d,r);
62
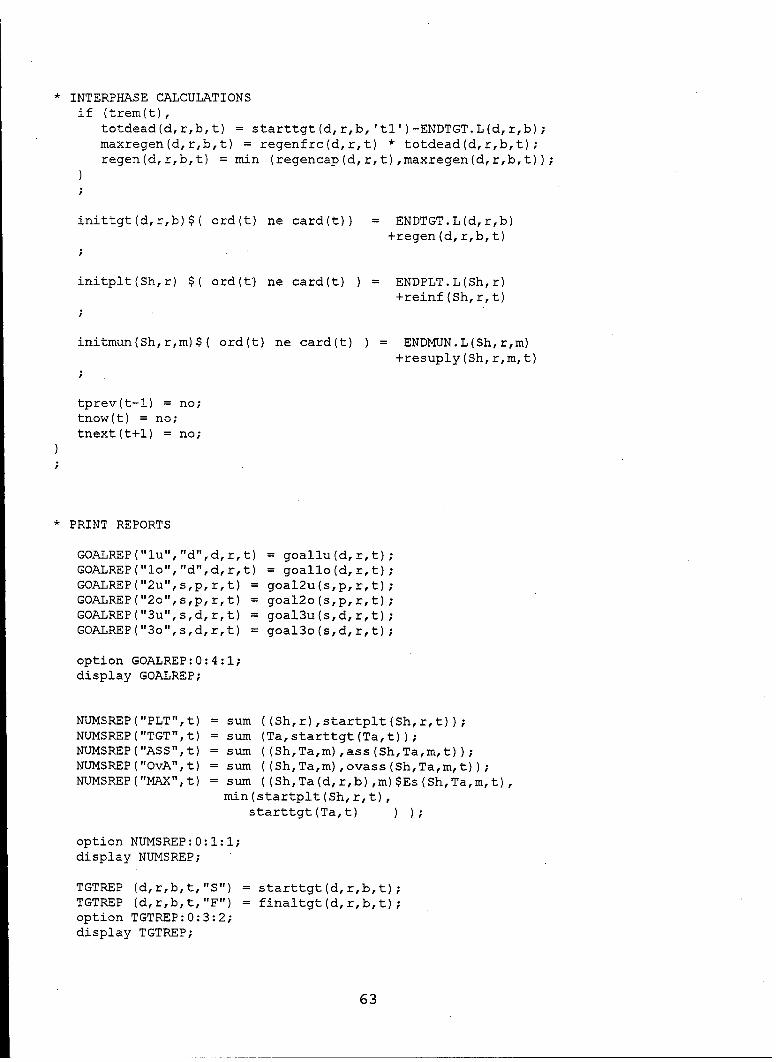
*INTERPHASE CALCULATIONS
if (trem(t),totdead(d,r,b,t) =starttgt(d,r,b, 'tl')-ENDTGT.L(d,r,b);maxregen(d,.r,b,,t) =regenfrc(d,r,t) * totdead(d,r,b,t);regen(d,r,b,,t) = min (regencap(d,r,.t),maxregen(d,r,,b,t));
inittgt(d,,r,b)$( ord(t) ne card(t)) =ENDTGT.L(d,,r,b)+regen (d, r, b, t)
initplt(Sh,r) $( ord(t') ne card(t) )= ENDPLT.L(Sh,r)+reinf (Sh, r, t)
initmun(Sh,r,m)$( ord(t) ne card(t) )=ENDMUN.L(Sh,r,m)+resuply(Sh, r,m, t)
tprev(t-1) = no;tnow(t) = no;tnext(t+l) = no;
*PRINT REPORTS
GOA.LREP ("lu", "d", d, r,.t) = goallu (d, r,t);GOALREP ("lo", "d", d, r,t) = goallo(d,r,t);GOALREP("2u",s,p,,r,,t) = goal2u (s, p, r, t)GOALREP("2o",s,p,r,,t) = goal2o(s,.p,r,t);GOALREP("3u",s,.d,.r,t) = goal3u(s,d,r,t);GOALREP("3o",s,d,r,,t) = goal3o(s,d,r,,t);
option GOALREP:O:4:l;display GOALREP;
NUMSREP("PLT",t) =sum ((Sh,r),startplt(Sh,r,t));NUI4SREP("TGT",t) = sum (Ta,starttgt(Ta,t));NUMSREP("ASS",t) = sum ((Sh,.Ta,m),ass(Sh,,Ta,m~t));NUMSREP("OvA",t) = sum C(Sh,Ta,m),ovass(Sh,Ta~m,.t));NUMSREP("MAX",t) = sum ((Sh,Ta(d,r,b),m)$Es(Sh,Ta,m,t),
min(startplt(Sh,,r,.t),
starttgt(Ta,t) ))
option NUMSREP:O:l:l;display NUMSREP;
TGTREP (d,r,b,t,"S") = starttgt(d,r,b,t);TGTREP (d,r,b,t,"F") = finaltgt(d,r,b,t);option TGTREP:O:3:2;display TGTREP;
63

PLTREP (s~pr,t,,"S") = startplt(s,p,r,t);PLTREP (s,p,r,t,"F") = finalplt(s,p,.r,t);option PLTREP:0:3:2;display PLTREP;
MtJNREP (s,p,r,m,t,"S") = startmun(s,p, r,m,t);MUNREP (s,.p,r,m~t,"F") = finalmun(s,p,r~mt);option MtJNREP:0:4:2;display MUNREP;
DEADREP (d,r,.b,t) = totdead (d,r,b,t);option DEADREP:0:3:l;display DEADREP;
USEDMUNREP(m) = sum ((Sh,d,,r,,b,t),ass(Sh,d,r,b,m,t)
+ovass(Sh,d,r,b,m,t)*munperasg(d,m)
option USEDMtJNREP: 0:0:1;display USEDMtJNREP;
loop (t,SUPMUNREP(s,m,t)$(ord(t) eq 1) = sum ((p,r),initmun(s~p,r,m));SUPMUNREP(s,m,.t)$(ord(t) ne 1) =sum ((p,r),resuply(s,p,r,m,t))
+SUPMUNREP(s,m,t-1);
option SUPMLJNREP: 0:2:1;display SUPMtJNREP;
loop (t,SVCMUNREP(s,m,.t)$(ord(t) eq 1) = sum ((p,d,r,b),,
(Cass(s,p,d,r,b,m,t)+ovass (s ,pj,d. r.b,rm, t)
* munperasg(d,m) ));SVCMtJNREP(s,m,t)$(ord(t) ne 1) = sum (Cp,d,,r,,b),,
C(ass(s,p,d,r,b,m,t)+ovass~s,,p,,d,r,b,m,.t)
* munperasg(d,m) )+ SVCMtJNREP~s,m,t-1);
option SVCMIJNREP: 0:2:1;display SVCMtJNREP;
reportl (s,p,d,r,b,m,t,"AS") = ass~s,,p.d~rb,.mt);reporti Cs,,p,d,r,b,m,.t,"OA") = ovass(s,p,d,r~b,,m,t)option REPORT1:0:6:2;display REPORTl;
64

maxmarg max Csmax ((Sh,r),ENDPLT.m(Sh,r)),smax (Ta,ENDTGT.m(Ta)),,smax ((Sh,r,m) ,ENDMU.N.m(Sh,r,m)),smax ((Sh,Ta,m) ,ASSIGN.m (Sh,Ta,m)),smax ((Sh,Ta,m) ,OVASSIGN.m (Sh,Ta,m)),smax ((d,r),ACH1O.m (d,r)),smax ((d,r),ACH1U.m (d,r)),smax ((Sh,r),ACH2U.m (Sh,r)),smax ((s,d,r),ACH3U.m (s,d,r)),smax ((s,d,r),ACH3O.m (s,d,r))
MARGREP("'ENDPLT",s,p,r,' ',' 1'? 1)ENDPLT.m(s,p,r)$(ENDPLT.m(s,p,r)>O.9*maxmarg);
ENDTGT.m(d,r,b)$(ENDTGT.m(d,.r,b)>O.9*maxmarg);MAPRGREP ("EI'DMUN",s,p,r,m,' ',' ') =ENDMtJN.m(s,p,r,m)$(ENDMUN.m(s,p,r,m)>O.9*maxmarg);MARGREP ("ASSIGN", sop, d.r,b,m) =
ASSIGN.m(s,p,d,r,b,m).$(ASSIGN.m(s,p,d,r,b,m)>O.9*maxmarg);MARGREP ("OVASSIGN",s,p,d,r,b,m) =
OVASSIGN.m(s,p,d,r,b,m)$(OVASSIGN.m(s,p,d,r,b,m)>O.5*maxmarg);MARGREP ("ACH1O",d,r,b, I. I' If ) =
ACHlO.m~d,r)$(ACHlO.mn(d,r)>O.5*maxmarg);MARGREP ("ACH1U",d,r,b, I I,' If, 1) =ACH1U.m(d,r).$(ACH1U.m(d,r)>O.5*maxmarg);MARGREP (VFACHUIfs,pfr. 1 I,1 If' I)
-ACH2U.m(s,p,r)$(ACH2U.m(s,p,r)>O.5*maxmarg);
MARGREP ("ACH3U"-,s,d,r, 1 1,1 1, 1 =
ACH3U.m(s,d,r)$(ACH3U.m(s,d,r)>O.5*maxmarg);MARGREP ("ACH3O",s,d,r, I If, I', ') =
ACH3O.m(s,d,r)$(ACH3O.m(s,d,,r)>O.5*maxmarg);
option MARGREP:O:1:6;display MARGREP;
*THE END ************************
65

66
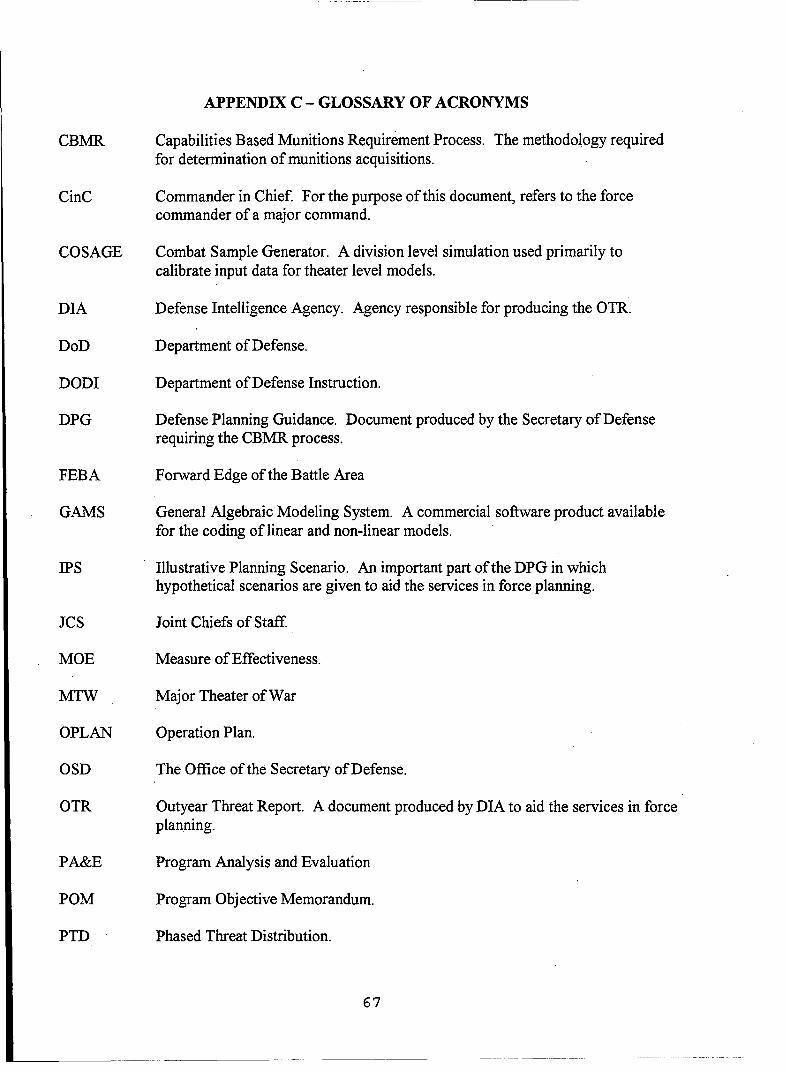
APPENDIX C - GLOSSARY OF ACRONYMS
CBMR Capabilities Based Munitions Requirement Process. The methodology requiredfor determination of munitions acquisitions.
CinC Commander in Chief. For the purpose of this document, refers to the forcecommander of a major command.
COSAGE Combat Sample Generator. A division level simulation used primarily tocalibrate input data for theater level models.
DIA Defense Intelligence Agency. Agency responsible for producing the OTR.
DoD Department of Defense.
DODI Department of Defense Instruction.
DPG Defense Planning Guidance. Document produced by the Secretary of Defenserequiring the CBMR process.
FEBA Forward Edge of the Battle Area
GAMS General Algebraic Modeling System. A commercial software product availablefor the coding of linear and non-linear models.
IPS Illustrative Planning Scenario. An important part of the DPG in whichhypothetical scenarios are given to aid the services in force planning.
JCS Joint Chiefs of Staff.
MOE Measure of Effectiveness.
MTW Major Theater of War
OPLAN Operation Plan.
OSD The Office of the Secretary of Defense.
OTR Outyear Threat Report. A document produced by DIA to aid the services in forceplanning.
PA&E Program Analysis and Evaluation
POM Program Objective Memorandum.
PTD Phased Threat Distribution.
67

TACWAR Tactical Warfare Model. A theater level deterministic combat model.
USFK United States Forces, Korea.
USSOCOM United States Special Operations Command.
WORRM Weapons Optimization Resource Requirements Model. An optimization modelthat determines the optimal munition choice for air-to-ground interactions.
68

LIST OF REFERENCES
Brooke, A., Kendrick, D., and Meeraus, A., GAMS, A User's Guide, The Scientific Press,1988.
Brown, G., Dell, R., and Wood, "Optimization and Persistence," Interfaces, Vol. 27, No. 5(September-October), pp. 15-37.
Chames, A., and Cooper, W.W. Management Models and Industrial Applications of LinearProgramming, pp. 215-223, John Wiley and Sons, New York. 1961.
DoD Instruction 3000.4, Capabilities-BasedMunitions Requirements (CBMR) Process, 16 June1997.
Gass, S., and Harris, C., Encyclopedia of Operations Research and Management Science, pp.
173, 264. Kluwe Academic Publishers, 1996.
J8, WORRM Working Papers, 14 March 1996.
Lovelace, D., and Young, T., U.S. DEPARTMIENT OF DEFENSE STRA TEGIC PLANNING:THE MISSING NEXUS, Internet copy,http://carlislewww.army.mil/usassi/ssipubs/pubs95/nexus/dodspp3.htm#B24,1 February 1998.
Rosenthal, R., "Goal Programming - A Critique," New Zealand Operations Research, Vol 11,No. 1 (January), pp. 1-7, 1983.
U.S. Army Concepts Analysis Agency, COSAGE User's Manual Volume 1 -Main Report,CAA-D-93-1, April 1993, revised August 1995, Defense Information Technical Center (DTIC)code AD-A3 11219.
U.S. Army Training and Doctrine Command. What is TACWAR?, Internet copy,http://www.trac.army.mil/TACWAR/gnrlinfol.htm, 1 February 1998.
69

70

INITIAL DISTRIBUTION LIST
Defense Technical Information Center ............................................................. 28725 John J. Kingman Road, Suite 0944Fort Belvoir, VA 22060-6218
2. D udley K nox Library ....................................................................................... 2Naval Postgraduate School411 Dyer RoadMonterey, CA 93943-5101
3. D irector, Training and Education ........................................................................... 1MCCDC, Code C461019 Elliot RoadQuantico, VA 22134-5027
4. Director, M arine Corps Research Center ........................................................... 2MCCDC, Code C40RC2040 Broadway StreetQuantico, VA 22134-5107
5. D irector, Studies and Analysis D ivision ................................................................. 1MCCDC, Code C453300 Russell RoadQuantico, VA 22134-5130
6. M arine Corps R epresentative ................................................................................. 1Naval Postgraduate SchoolCode 037, Bldg. 234, HA-220699 Dyer RoadMonterey, CA 93940
7. Marine Corps Tactical Systems Support Activity ................................................... 1Technical Advisory BranchAttn: Maj J.C. CummiskeyBox 555171Camp Pendleton, CA 92055-5080
8. Professor Richard E. Rosenthal, OR/Ro ................................................................. 1Department of Operations ResearchNaval Postgraduate SchoolMonterey, CA 93943-5221
71

9. Lieutenant Colonel Kirk A. Yost, OR/Yo ...........................Department of Operations ResearchNaval Postgraduate SchoolMonterey, CA 93943-5221
10. Joint Staff ........................................................................................................ . . 4J8 / Warfighting Analysis DivisionAttn: Mr. Pete ByrneThe Pentagon (1D940)Washington, DC 20318-8000
11. Captain Brian Widdowson ................. ........ ................. 211365 Spruce StreetChesterland, OH 44026
12. M ajor E ric D am m .............................................................................................. 1Department of Operations ResearchNaval Postgraduate SchoolMonterey, CA 93943-5221
72