third quarter 2013 earnings presentation -...
TRANSCRIPT
Third Quarter 2013 Earnings Presentation November 1, 2013
2 CBOE HOLDINGS
Agenda
Strategic Review Edward Tilly Chief Executive Officer
Financial Review Alan Dean Executive Vice President, CFO and Treasurer
Questions and Answers Edward Tilly Alan Dean Edward Provost President and Chief Operating Officer
3 CBOE HOLDINGS
Forward-Looking Statements
This presentation may contain forward-looking statements, within the meaning of the Private Securities Litigation Reform Act of 1995. Forward-looking statements are those statements that reflect our expectations, assumptions or projections about the future and involve a number of risks and uncertainties. These statements are only predictions based on our current expectations and projections about future events. There are important factors that could cause actual results to differ materially from that expressed or implied by the forward-looking statements, including: the loss of our right to exclusively list certain index option products; increasing price competition in our industry; compliance with legal and regulatory obligations and obligations under agreements with regulatory agencies; our ability to operate our business, monitor and maintain our systems or program them so that they operate correctly, including in response to increases in trading volume and order transaction traffic; decreases in the amount of trading volumes or a shift in the mix of products traded on our exchanges; legislative or regulatory changes; increasing competition by foreign and domestic entities; economic, political and market conditions; our ability to operate our business without violating the intellectual property rights of others and the costs associated with protecting our intellectual property rights; our ability to maintain access fee revenues; our ability to protect our systems and communication networks from security risks, including cyber-attacks; our ability to attract and retain skilled management and other personnel; our ability to maintain our growth effectively; our dependence on third party service providers; and the ability of our compliance and risk management methods to effectively monitor and manage our risks. More detailed information about factors that may affect our performance may be found in our filings with the SEC, including in our Annual Report on Form 10-K for the year ended December 31, 2012 and other filings made from time to time with the SEC.

Strategic Review Edward Tilly CEO
5 CBOE HOLDINGS
Strong Earnings for 3Q13
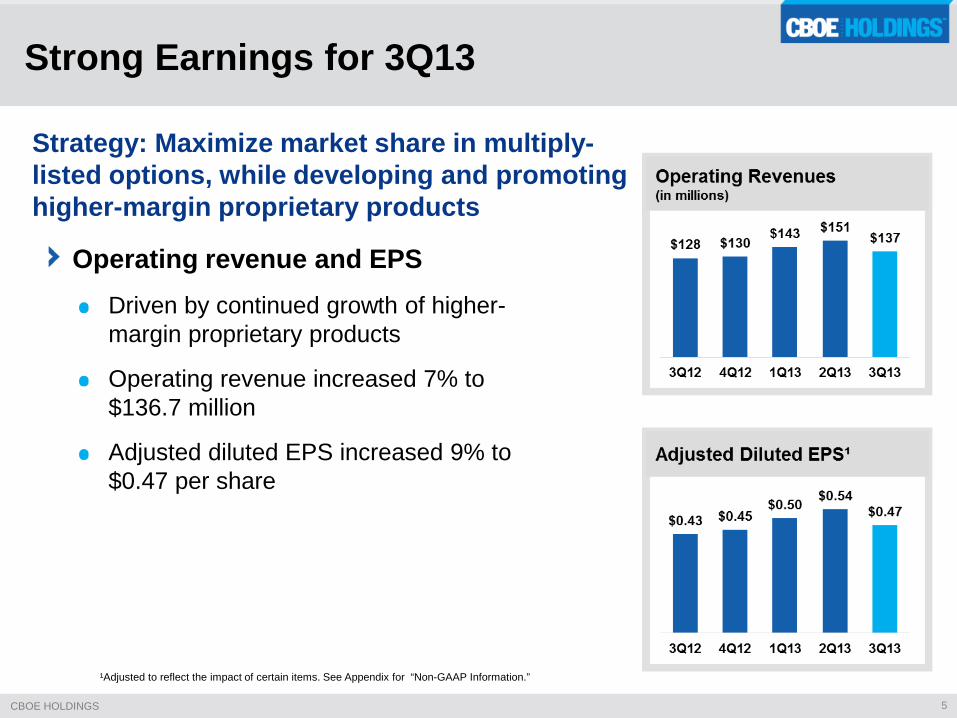
Strategy: Maximize market share in multiply- listed options, while developing and promoting higher-margin proprietary products
Operating revenue and EPS Driven by continued growth of higher-margin proprietary products
Operating revenue increased 7% to $136.7 million
Adjusted diluted EPS increased 9% to $0.47 per share
¹Adjusted to reflect the impact of certain items. See Appendix for “Non-GAAP Information.”

6 CBOE HOLDINGS
Total Options ADV Grew 5% YOY in 3Q13
Strong growth in proprietary products
Options ADV 3Q13 vs 3Q12: Index products increased 20%
ETNs and ETFs were up 18%
Equity options declined 10%
7 CBOE HOLDINGS
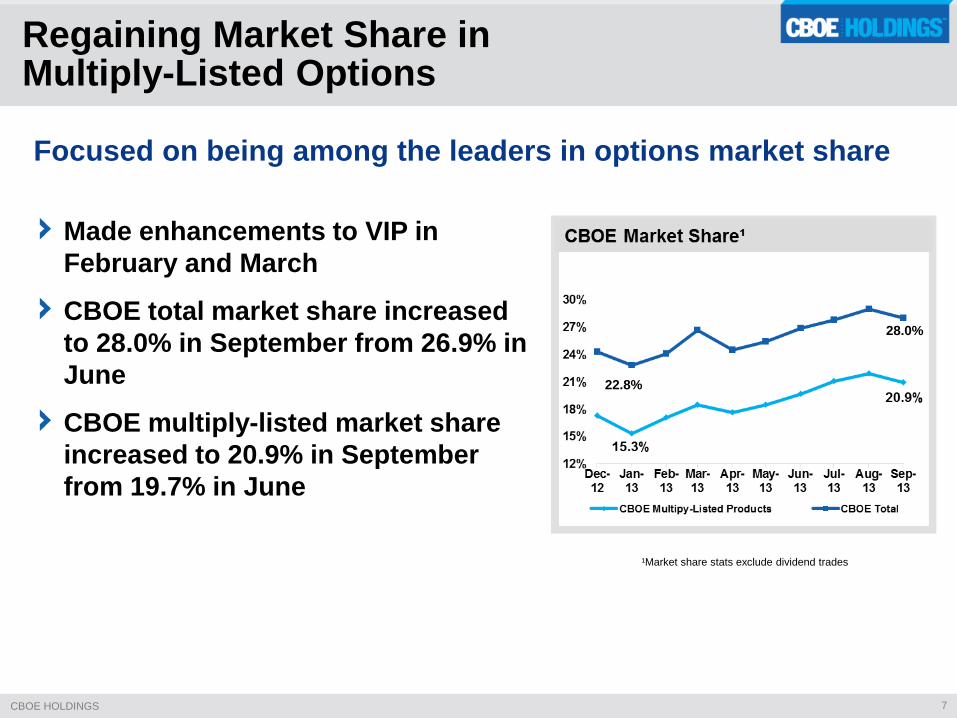
Regaining Market Share in Multiply-Listed Options
Made enhancements to VIP in February and March
CBOE total market share increased to 28.0% in September from 26.9% in June
CBOE multiply-listed market share increased to 20.9% in September from 19.7% in June
Focused on being among the leaders in options market share
28.0%
22.8%
¹Market share stats exclude dividend trades
8 CBOE HOLDINGS
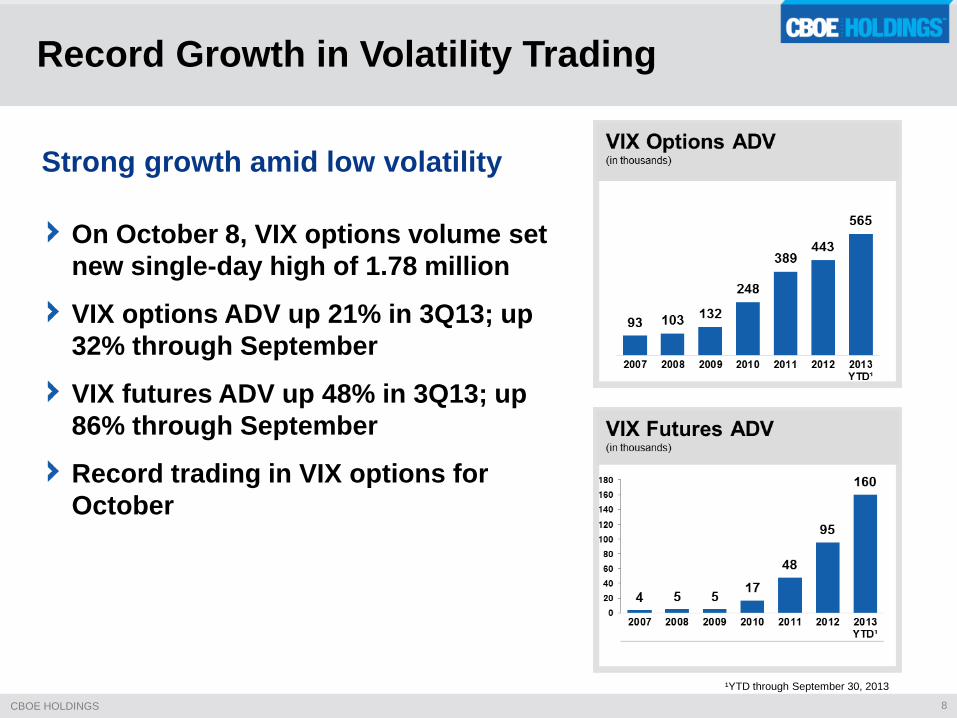
On October 8, VIX options volume set new single-day high of 1.78 million
VIX options ADV up 21% in 3Q13; up 32% through September
VIX futures ADV up 48% in 3Q13; up 86% through September
Record trading in VIX options for October
Record Growth in Volatility Trading
¹YTD through September 30, 2013
Strong growth amid low volatility

9 CBOE HOLDINGS
Broadening Global Customer Reach
Extending trading hours for VIX futures Implemented first phase of rollout on October 28th
Adds a 45-minute trading session after current close of VIX futures
Meets demand from U.S. customers for a post-settlement trading period
Phase two to be implemented on November 4th Adds another five hours to the trading day
Allows European-based customers to access VIX futures during their local trading hours
Trading will begin at 2:00 a.m. CT; aligns with open of London markets
Expect our entire global base of VIX users to benefit from extended trading hours
10 CBOE HOLDINGS
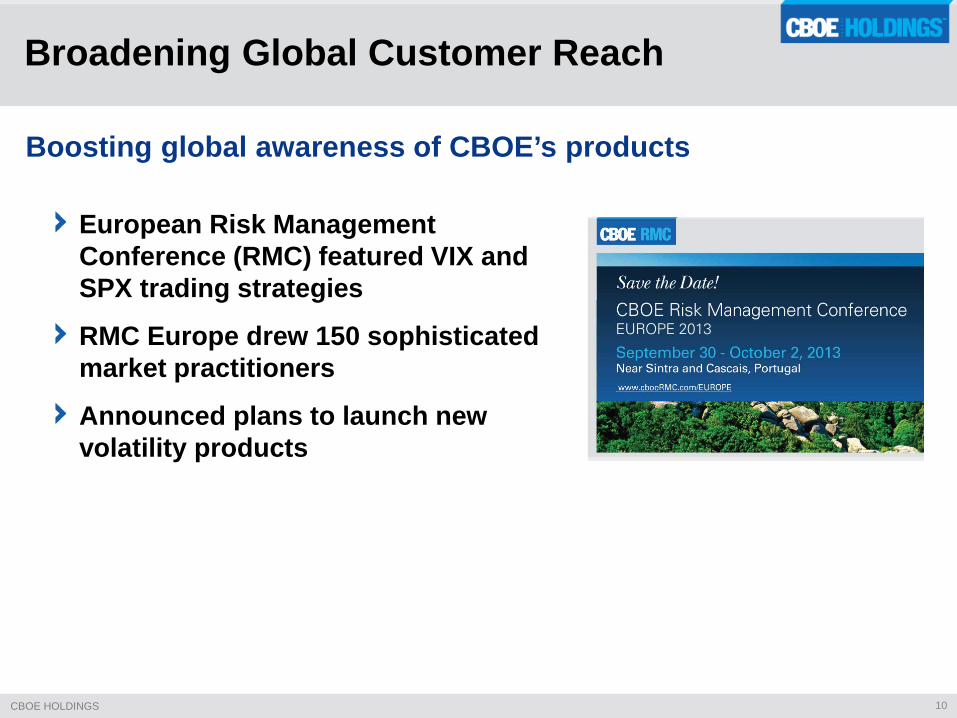
Broadening Global Customer Reach
Boosting global awareness of CBOE’s products
European Risk Management Conference (RMC) featured VIX and SPX trading strategies
RMC Europe drew 150 sophisticated market practitioners
Announced plans to launch new volatility products
11 CBOE HOLDINGS
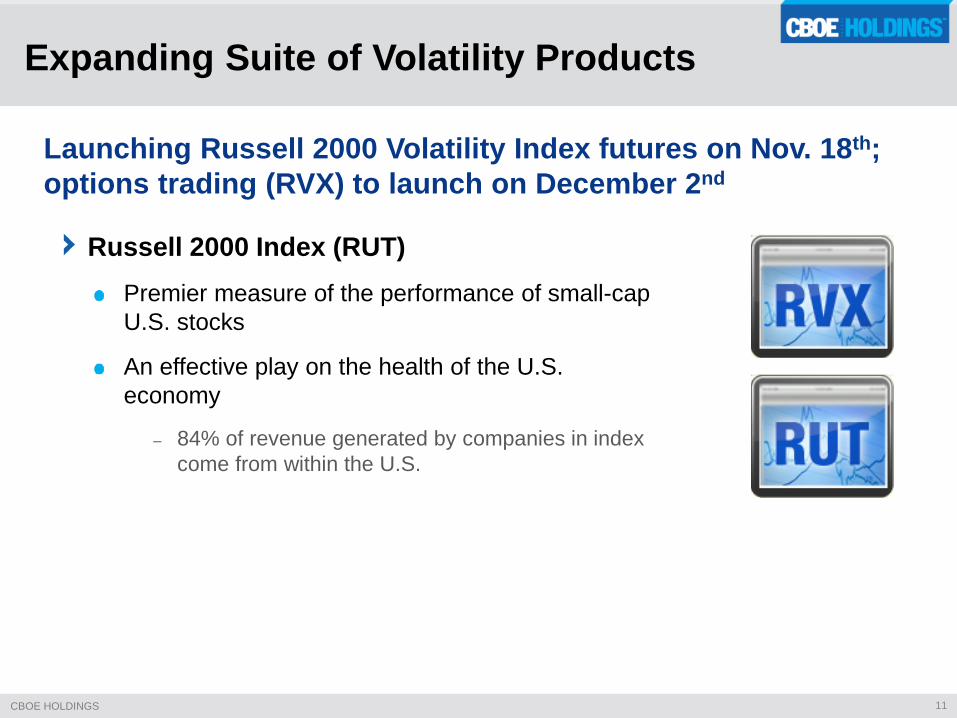
Launching Russell 2000 Volatility Index futures on Nov. 18th; options trading (RVX) to launch on December 2nd
Russell 2000 Index (RUT) Premier measure of the performance of small-cap U.S. stocks
An effective play on the health of the U.S. economy
– 84% of revenue generated by companies in index come from within the U.S.
Expanding Suite of Volatility Products

12 CBOE HOLDINGS
Launching new CBOE S&P 500 Short-Term Volatility Index (VXST)
First-ever gauge of the expected short-term volatility of the S&P 500 Index
Same index calculation methodology as our flagship VIX Index
Expect to launch VXST Weeklys options and futures in 1Q14, pending regulatory approval
Expanding Suite of Volatility Products

13 CBOE HOLDINGS
SPX Weeklys volume primarily represents incremental business from new SPX customer base
Tabb Group predicts that Weeklys will reach 25% of total industry-wide volume by the end of 2013
CBOE created the Weeklys concept with the introduction of SPX Weeklys in 2005
SPX Weeklys up 127% through September 2013
SPX Weeklys appeal to both retail investors and semi-pros
Weeklys Attracting New SPX Users
14 CBOE HOLDINGS
Investors worldwide use SPX and VIX Index products to hedge global economic risk
Global Interest in SPX Products Mirrors that of VIX Options and Futures
15 CBOE HOLDINGS
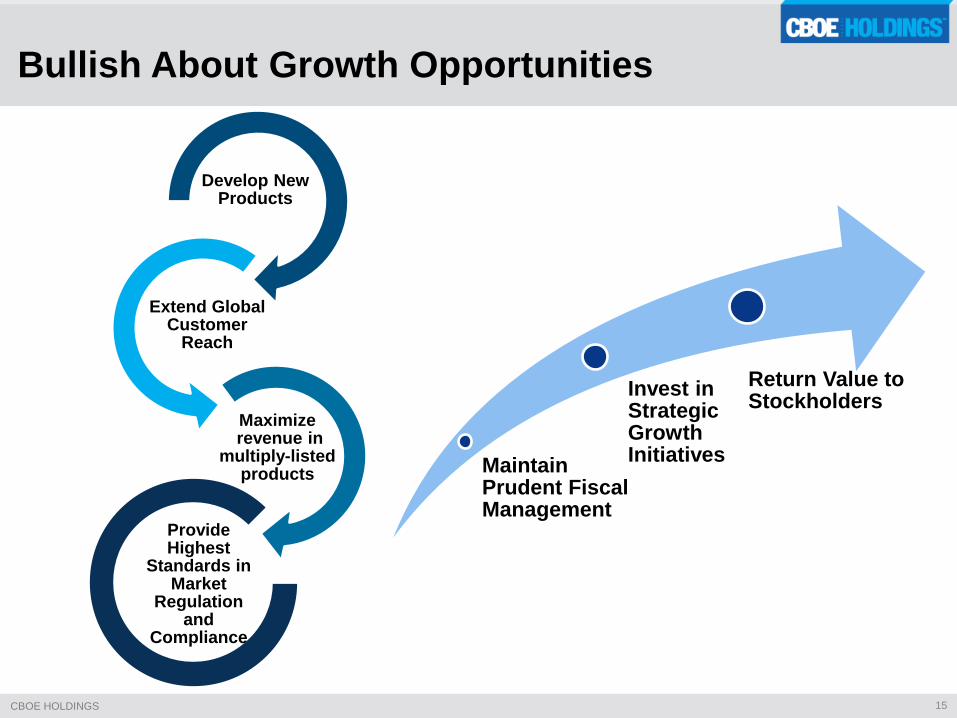
Bullish About Growth Opportunities
Develop New Products
Extend Global Customer
Reach
Maximize revenue in
multiply-listed products
Provide Highest
Standards in Market
Regulation and
Compliance
Maintain Prudent Fiscal Management
Invest in Strategic Growth Initiatives
Return Value to Stockholders

Financial Review Alan Dean EVP, CFO and Treasurer
17 CBOE HOLDINGS
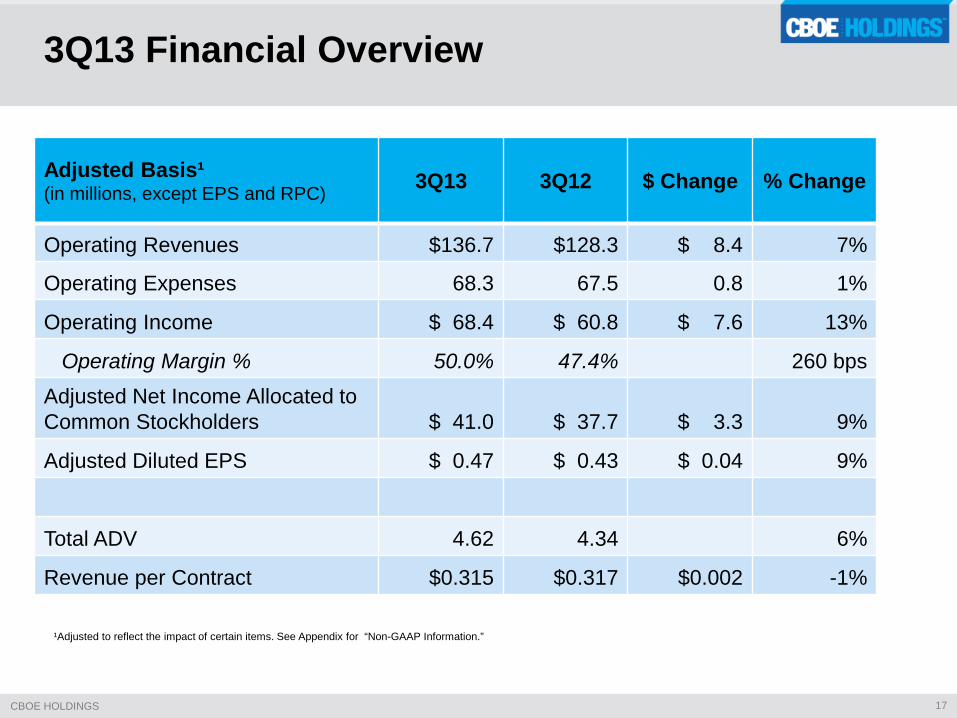
3Q13 Financial Overview
Adjusted Basis¹ (in millions, except EPS and RPC) 3Q13 3Q12 $ Change % Change
Operating Revenues $136.7 $128.3 $ 8.4 7%
Operating Expenses 68.3 67.5 0.8 1%
Operating Income $ 68.4 $ 60.8 $ 7.6 13%
Operating Margin % 50.0% 47.4% 260 bps Adjusted Net Income Allocated to Common Stockholders
$ 41.0
$ 37.7
$ 3.3
9%
Adjusted Diluted EPS $ 0.47 $ 0.43 $ 0.04 9%
Total ADV 4.62 4.34 6%
Revenue per Contract $0.315 $0.317 $0.002 -1%
¹Adjusted to reflect the impact of certain items. See Appendix for “Non-GAAP Information.”
18 CBOE HOLDINGS
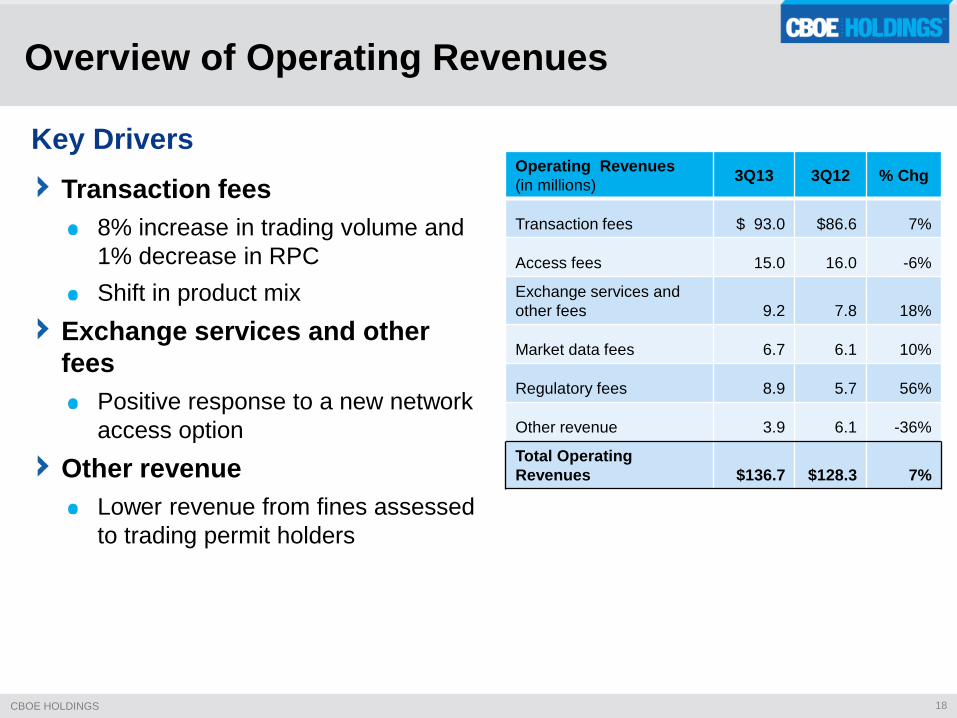
Overview of Operating Revenues
Key Drivers Transaction fees
8% increase in trading volume and 1% decrease in RPC Shift in product mix
Exchange services and other fees
Positive response to a new network access option
Other revenue Lower revenue from fines assessed to trading permit holders
Operating Revenues (in millions) 3Q13 3Q12 % Chg
Transaction fees $ 93.0 $86.6 7%
Access fees 15.0 16.0 -6%
Exchange services and other fees 9.2 7.8 18%
Market data fees 6.7 6.1 10%
Regulatory fees 8.9 5.7 56%
Other revenue 3.9 6.1 -36%
Total Operating Revenues $136.7 $128.3 7%

19 CBOE HOLDINGS
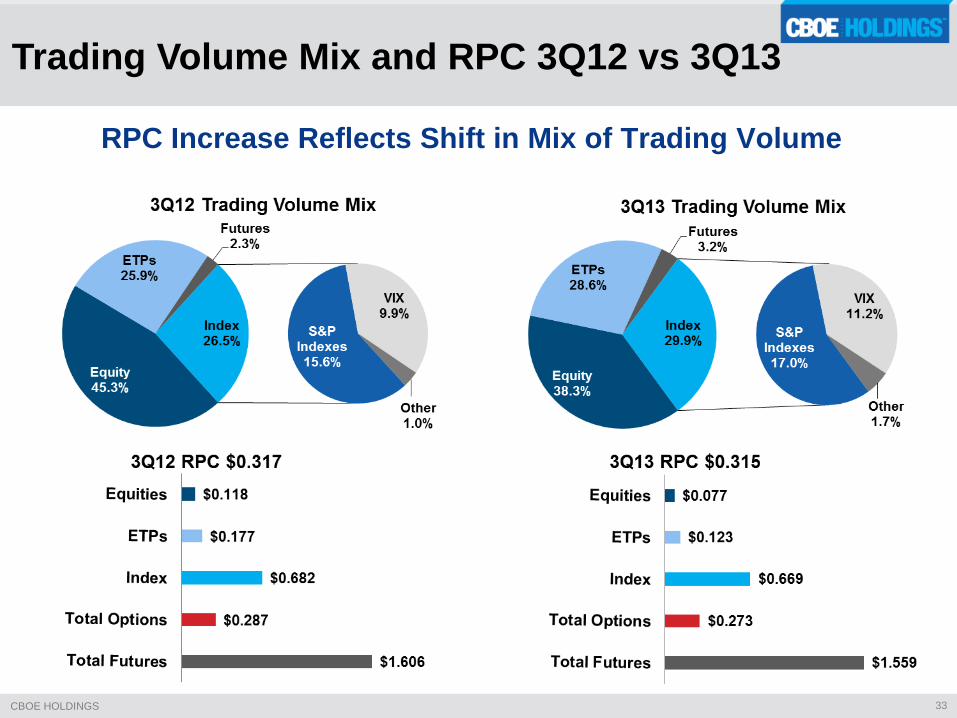
Shift in Trading Volume Mix Significantly Offset RPC Decline in Multiply-listed Options
Trading Volume Mix and RPC 3Q12 vs 3Q13
20 CBOE HOLDINGS
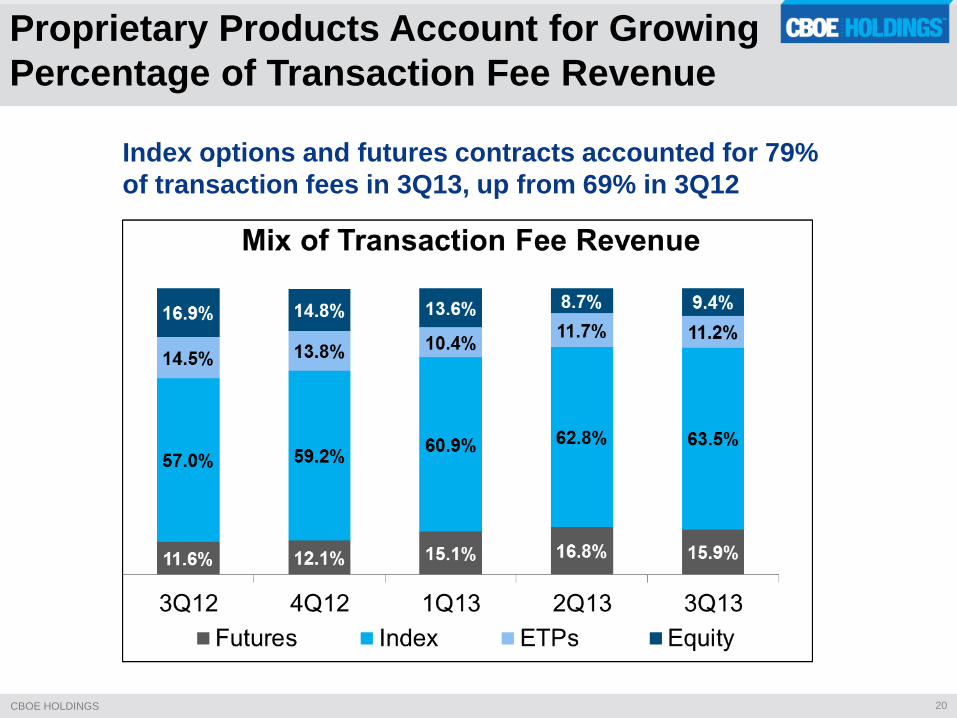
Proprietary Products Account for Growing Percentage of Transaction Fee Revenue
Index options and futures contracts accounted for 79% of transaction fees in 3Q13, up from 69% in 3Q12

21 CBOE HOLDINGS
Other Revenue Drivers
Regulatory fees up $3.2MM Higher volume and increase in ORF rate
Other revenue down $2.2MM Lower fines accessed
Exchange services up $1.4MM Driven by positive response to a new network access option
Access fees down $1.0MM Reflects introduction of new credit and rebate programs, offset somewhat by higher trading permits
(in millions) 3Q13 3Q12 % Chg
Regulatory fees $ 8.9 $ 5.7 56%
Other revenue $ 3.9 $ 6.1 -36%
Exchange services and other fees $ 9.2 $ 7.8 18%
Access fees $15.0 $16.0 -6%
22 CBOE HOLDINGS
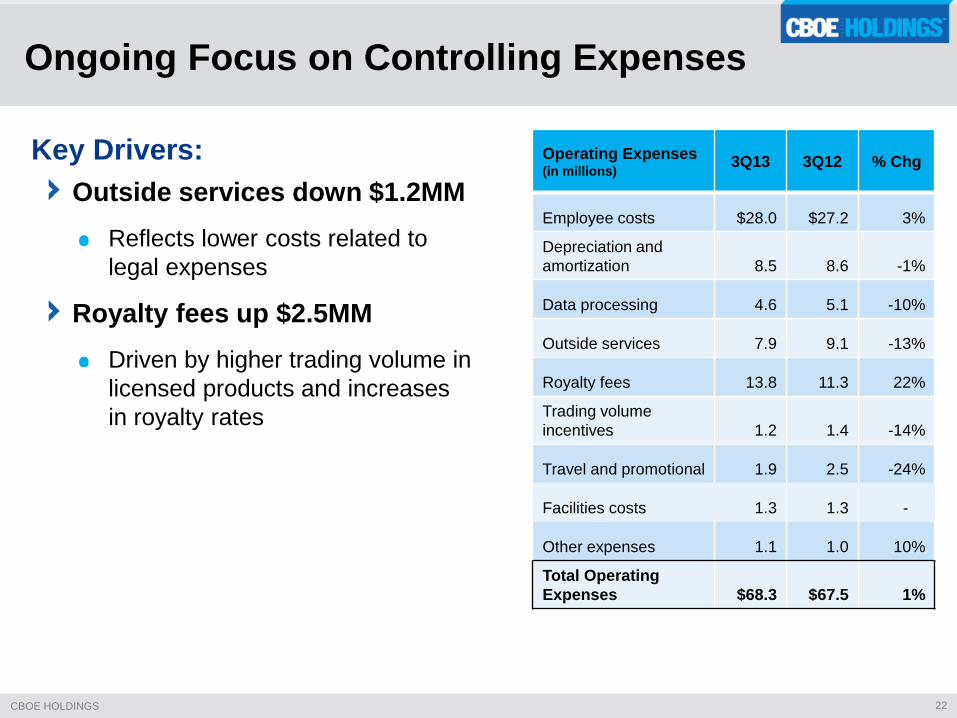
Ongoing Focus on Controlling Expenses
Key Drivers: Outside services down $1.2MM
Reflects lower costs related to legal expenses
Royalty fees up $2.5MM Driven by higher trading volume in licensed products and increases in royalty rates
Operating Expenses (in millions) 3Q13 3Q12 % Chg
Employee costs $28.0 $27.2 3%
Depreciation and amortization 8.5 8.6 -1%
Data processing 4.6 5.1 -10%
Outside services 7.9 9.1 -13%
Royalty fees 13.8 11.3 22%
Trading volume incentives 1.2 1.4 -14%
Travel and promotional 1.9 2.5 -24%
Facilities costs 1.3 1.3 -
Other expenses 1.1 1.0 10%
Total Operating Expenses $68.3 $67.5 1%
23 CBOE HOLDINGS
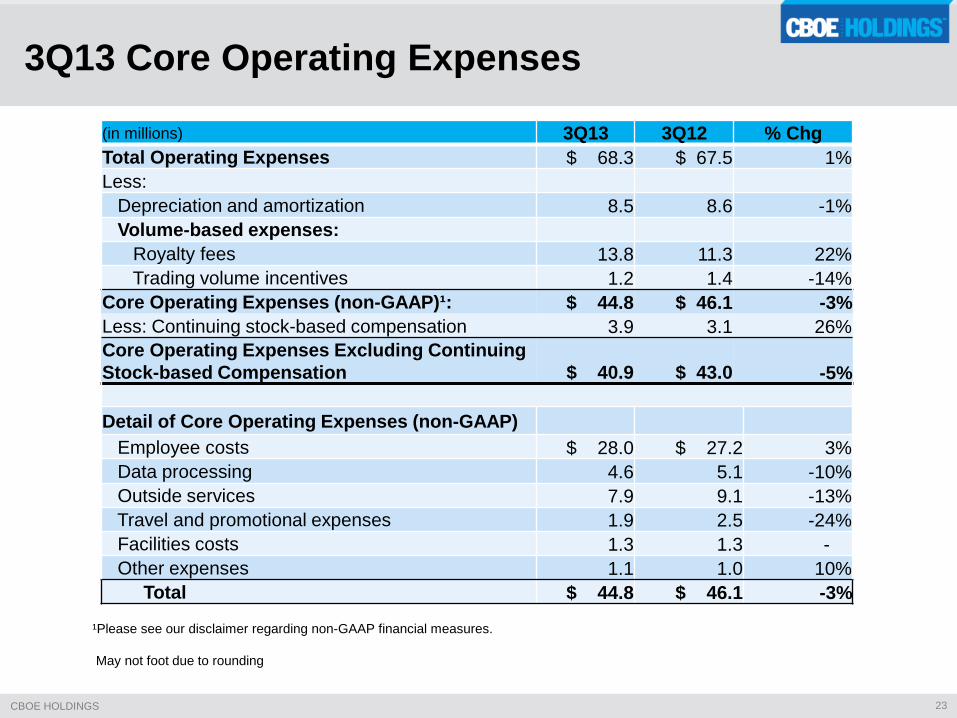
3Q13 Core Operating Expenses
(in millions) 3Q13 3Q12 % Chg Total Operating Expenses $ 68.3 $ 67.5 1% Less: Depreciation and amortization 8.5 8.6 -1% Volume-based expenses: Royalty fees 13.8 11.3 22% Trading volume incentives 1.2 1.4 -14% Core Operating Expenses (non-GAAP)¹: $ 44.8 $ 46.1 -3% Less: Continuing stock-based compensation 3.9 3.1 26% Core Operating Expenses Excluding Continuing Stock-based Compensation $ 40.9 $ 43.0 -5%
Detail of Core Operating Expenses (non-GAAP) Employee costs $ 28.0 $ 27.2 3% Data processing 4.6 5.1 -10% Outside services 7.9 9.1 -13% Travel and promotional expenses 1.9 2.5 -24% Facilities costs 1.3 1.3 - Other expenses 1.1 1.0 10% Total $ 44.8 $ 46.1 -3%
¹Please see our disclaimer regarding non-GAAP financial measures. May not foot due to rounding
24 CBOE HOLDINGS
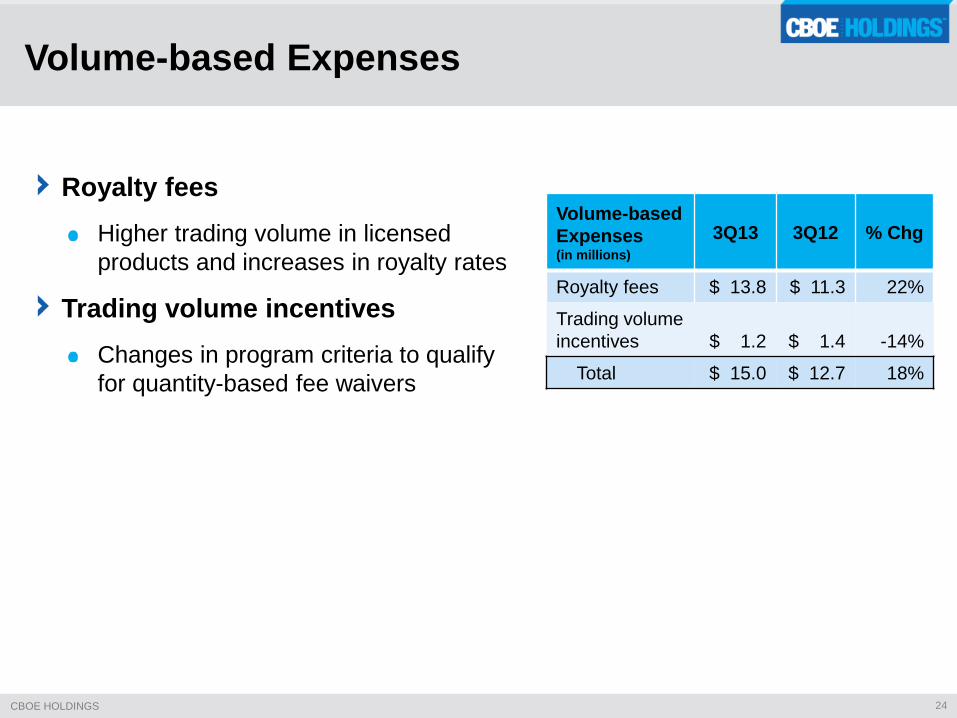
Volume-based Expenses
Royalty fees Higher trading volume in licensed products and increases in royalty rates
Trading volume incentives Changes in program criteria to qualify for quantity-based fee waivers
Volume-based Expenses (in millions)
3Q13 3Q12 % Chg
Royalty fees $ 13.8 $ 11.3 22%
Trading volume incentives $ 1.2 $ 1.4 -14%
Total $ 15.0 $ 12.7 18%

25 CBOE HOLDINGS
3Q13 3Q12¹ Change YTD ‘13 YTD ‘12¹ Change Full-Year 2013 Guidance
GAAP 39.1% 24.4% 1470 bps 38.6% 35.8% 280 bps 39.0% to 39.5%
Adjusted 39.1% 37.1% 200 bps 38.4% 39.9% -150 bps
Third Quarter Effective Tax Rate
¹3Q12 and year-to-date 2012 GAAP effective tax rate reflects the benefit of significant discrete items. Adjusted effective tax rate for 3Q12 and year-to-date 2012 excludes benefit of $7.7 million for significant discrete items related to prior years.
26 CBOE HOLDINGS
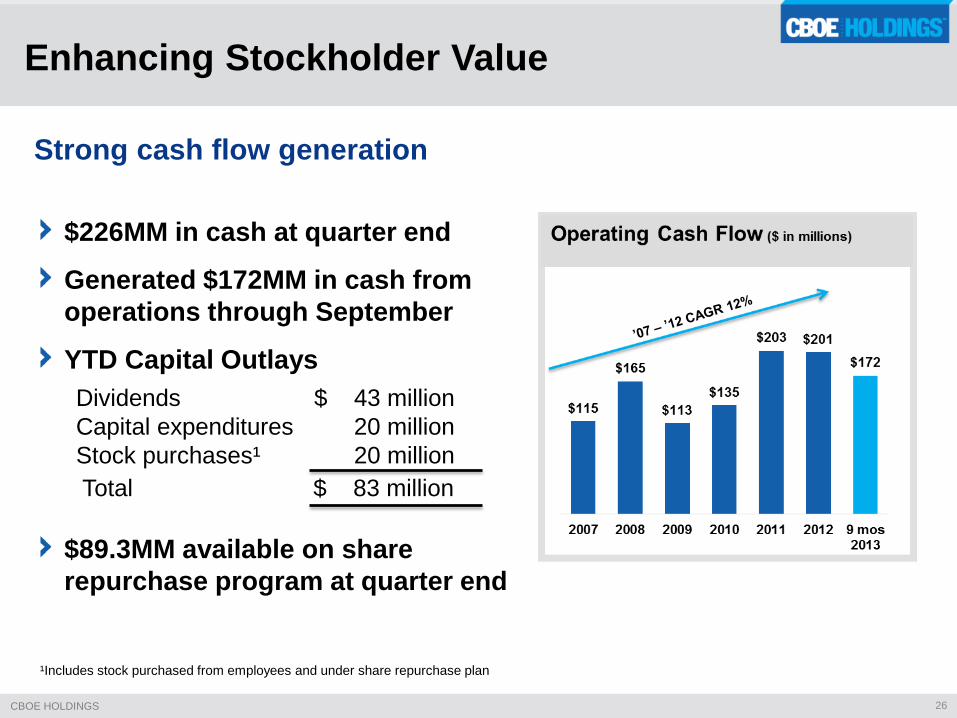
Enhancing Stockholder Value
Strong cash flow generation
$226MM in cash at quarter end
Generated $172MM in cash from operations through September
YTD Capital Outlays Dividends $ 43 million Capital expenditures 20 million Stock purchases¹ 20 million Total $ 83 million
¹Includes stock purchased from employees and under share repurchase plan
$89.3MM available on share repurchase program at quarter end
27 CBOE HOLDINGS
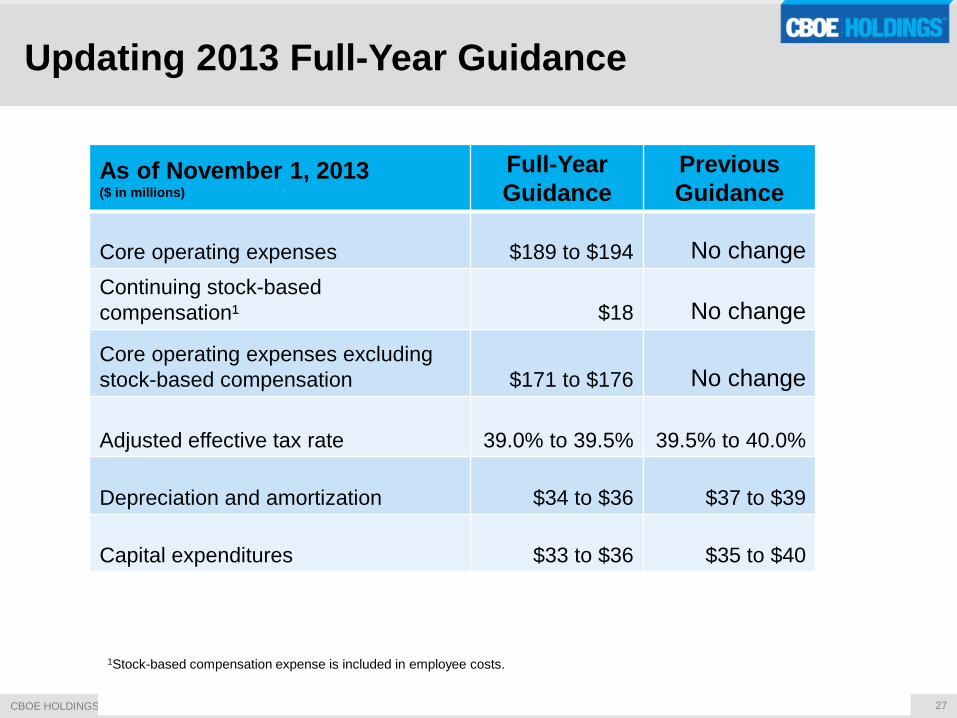
Updating 2013 Full-Year Guidance
As of November 1, 2013 ($ in millions)
Full-Year Guidance
Previous Guidance
Core operating expenses $189 to $194 No change Continuing stock-based compensation¹ $18 No change
Core operating expenses excluding stock-based compensation
$171 to $176 No change
Adjusted effective tax rate
39.0% to 39.5%
39.5% to 40.0%
Depreciation and amortization $34 to $36 $37 to $39
Capital expenditures $33 to $36 $35 to $40
1Stock-based compensation expense is included in employee costs.

28 CBOE HOLDINGS
Well Positioned for Long-Term Growth
¹Adjusted to reflect the impact of certain items. See appendix for “Non-GAAP Information.”

Questions & Answers

Appendix Materials

31 CBOE HOLDINGS
Quarterly Adjusted Operating Income and Margin¹ ($ in millions)
¹Adjusted to reflect the impact of certain items. See Appendix for “Non-GAAP Information.”
Well Positioned to Gain Additional Leverage
30%
35%
40%
45%
50%
55%
$0
$10
$20
$30
$40
$50
$60
$70
$80
1Q10 2Q10 3Q10 4Q10 1Q11 2Q11 3Q11 4Q11 1Q12 2Q12 3Q12 4Q12 1Q13 2Q13 3Q13
Operating Income Margin

32 CBOE HOLDINGS
CBOE Holdings Quarterly Options ADV (contracts in millions)
Quarterly Options ADV
33 CBOE HOLDINGS
Trading Volume Mix and RPC 3Q12 vs 3Q13
RPC Increase Reflects Shift in Mix of Trading Volume

34 CBOE HOLDINGS
CBOE Holdings Rolling 3-Month RPC
2013 Jan Feb Mar Apr May Jun Jul Aug Sep Oct Nov DecEquities $0.149 $0.153 $0.140 $0.114 $0.094 $0.090 $0.082 $0.081 $0.077Indexes 0.665 0.670 0.671 0.679 0.674 0.675 0.670 0.671 0.669Exchange-traded products 0.194 0.181 0.155 0.127 0.119 0.119 0.121 0.122 0.123 Total options RPC 0.340 0.341 0.333 0.308 0.295 0.289 0.282 0.278 0.273Futures 1.484 1.560 1.618 1.598 1.594 1.544 1.544 1.533 1.559 Total RPC $0.376 $0.382 $0.378 $0.357 $0.341 $0.334 $0.324 $0.321 $0.315
2012 Jan Feb Mar Apr May Jun Jul Aug Sep Oct Nov DecEquities $0.151 $0.128 $0.110 $0.112 $0.117 $0.123 $0.124 $0.122 $0.118 $0.121 $0.124 $0.134Indexes 0.640 0.651 0.658 0.667 0.673 0.677 0.680 0.684 0.682 0.675 0.670 0.670Exchange-traded products 0.206 0.188 0.171 0.172 0.176 0.180 0.177 0.177 0.177 0.180 0.183 0.186 Total options RPC 0.297 0.275 0.261 0.267 0.279 0.288 0.289 0.286 0.287 0.294 0.309 0.322Futures 1.474 1.610 1.697 1.655 1.650 1.607 1.598 1.626 1.606 1.573 1.473 1.442 Total RPC $0.308 $0.289 $0.280 $0.290 $0.304 $0.314 $0.316 $0.315 $0.317 $0.326 $0.342 $0.355
2011 Jan Feb Mar Apr May Jun Jul Aug Sep Oct Nov DecEquities $0.170 $0.164 $0.160 $0.163 $0.168 $0.169 $0.171 $0.159 $0.159 $0.155 $0.163 $0.167Indexes 0.592 0.601 0.604 0.615 0.618 0.627 0.624 0.606 0.605 0.605 0.621 0.631Exchange-traded products 0.223 0.215 0.207 0.207 0.208 0.202 0.197 0.187 0.192 0.194 0.205 0.212 Total options RPC 0.276 0.272 0.275 0.282 0.289 0.295 0.303 0.300 0.301 0.300 0.308 0.312Futures 1.657 1.591 1.507 1.493 1.514 1.477 1.437 1.376 1.371 1.348 1.328 1.329 Total RPC $0.286 $0.282 $0.285 $0.293 $0.301 $0.308 $0.316 $0.313 $0.313 $0.311 $0.317 $0.321
2010 Jan Feb Mar Apr May Jun Jul Aug Sep Oct Nov DecEquities $0.177 $0.180 $0.184 $0.172 $0.163 $0.162 $0.170 $0.180 $0.182 $0.180 $0.179 $0.177Indexes 0.576 0.590 0.597 0.584 0.578 0.580 0.590 0.597 0.598 0.592 0.592 0.590Exchange-traded products 0.234 0.237 0.236 0.225 0.215 0.217 0.222 0.233 0.236 0.228 0.228 0.224 Total options RPC 0.282 0.290 0.297 0.282 0.274 0.277 0.288 0.296 0.300 0.296 0.292 0.284Futures 2.092 2.004 1.952 1.879 1.832 1.717 1.694 1.600 1.661 1.669 1.674 1.679 Total RPC $0.286 $0.294 $0.300 $0.286 $0.279 $0.281 $0.293 $0.301 $0.306 $0.302 $0.300 $0.293
35 CBOE HOLDINGS
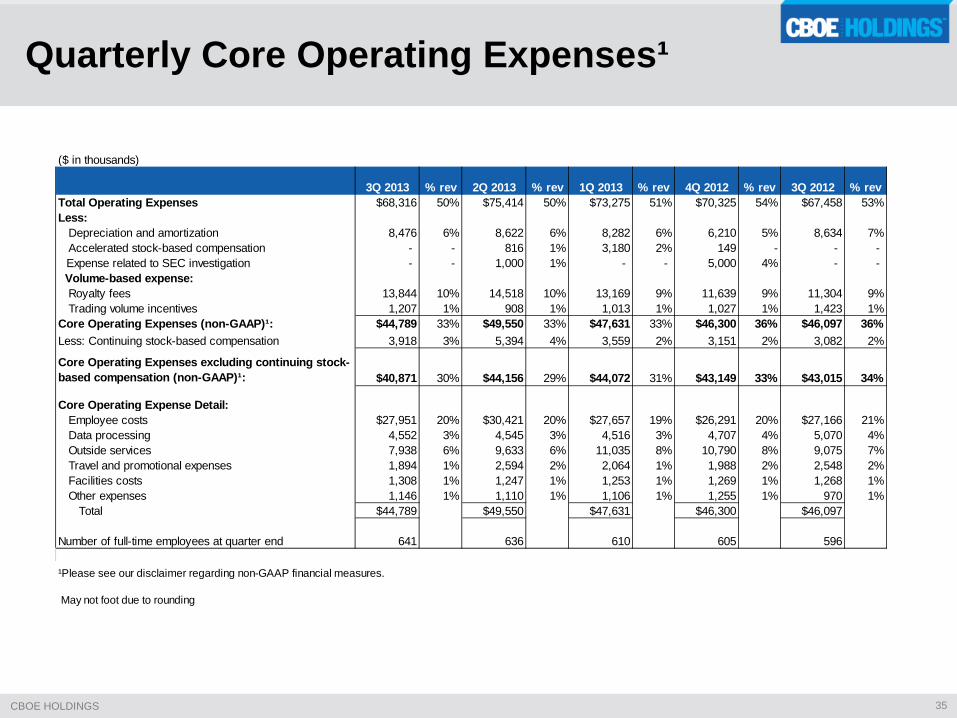
Quarterly Core Operating Expenses¹
3Q 2013 % rev 2Q 2013 % rev 1Q 2013 % rev 4Q 2012 % rev 3Q 2012 % revTotal Operating Expenses $68,316 50% $75,414 50% $73,275 51% $70,325 54% $67,458 53%Less: Depreciation and amortization 8,476 6% 8,622 6% 8,282 6% 6,210 5% 8,634 7% Accelerated stock-based compensation - - 816 1% 3,180 2% 149 - - -
Expense related to SEC investigation - - 1,000 1% - - 5,000 4% - - Volume-based expense: Royalty fees 13,844 10% 14,518 10% 13,169 9% 11,639 9% 11,304 9% Trading volume incentives 1,207 1% 908 1% 1,013 1% 1,027 1% 1,423 1%Core Operating Expenses (non-GAAP)¹: $44,789 33% $49,550 33% $47,631 33% $46,300 36% $46,097 36%Less: Continuing stock-based compensation 3,918 3% 5,394 4% 3,559 2% 3,151 2% 3,082 2%
Core Operating Expenses excluding continuing stock-based compensation (non-GAAP)¹: $40,871 30% $44,156 29% $44,072 31% $43,149 33% $43,015 34%
Core Operating Expense Detail: Employee costs $27,951 20% $30,421 20% $27,657 19% $26,291 20% $27,166 21% Data processing 4,552 3% 4,545 3% 4,516 3% 4,707 4% 5,070 4% Outside services 7,938 6% 9,633 6% 11,035 8% 10,790 8% 9,075 7% Travel and promotional expenses 1,894 1% 2,594 2% 2,064 1% 1,988 2% 2,548 2% Facilities costs 1,308 1% 1,247 1% 1,253 1% 1,269 1% 1,268 1% Other expenses 1,146 1% 1,110 1% 1,106 1% 1,255 1% 970 1% Total $44,789 $49,550 $47,631 $46,300 $46,097
Number of full-time employees at quarter end 641 636 610 605 596
May not foot due to rounding
¹Please see our disclaimer regarding non-GAAP financial measures.
($ in thousands)

36 CBOE HOLDINGS
9 mos 2013 % rev 2012 % rev 2011 % rev 2010 % rev 2009 % revTotal Operating Expenses $217,005 50% $268,241 52% $266,512 52% $269,763 62% $248,497 62%Less: Depreciation and Amortization 25,380 6% 31,485 6% 34,094 7% 29,891 7% 27,512 7% Accelerated stock-based compensation 3,996 1% 343 - 453 - 12,968 3% - - Severance - - - - 3,709 1% - - - - Estimated liability/expense related to SEC investigation 1,000 0% 5,000 1% - - - - - - Exercise Right Appeal Settlement - 0% - - - - - - 2,086 1% Volume-based Expense: 0% Royalty Fees 41,531 10% 46,135 9% 47,822 9% 41,353 10% 33,079 8% Trading Volume Incentives 3,128 1% 6,275 1% 14,239 3% 21,294 5% 28,631 7%Core Operating Expenses (non-GAAP)¹: $141,970 33% $179,003 35% $166,195 33% $164,257 38% $157,189 39%Less: Continuing stock-based compensation 12,871 3% 12,005 2% 12,166 2% 7,833 2% - - Core Operating Expenses excluding continuing stock-based compensation (non-GAAP)¹: $129,099 30% $166,998 33% $154,029 30% $156,424 36% $157,189 39%
Core Operating Expense Detail (excluding stock-based compensation): Employee Costs $86,029 20% $91,848 18% $88,126 17% $85,442 20% $84,481 21% Data Processing 13,613 3% 19,603 4% 17,933 4% 19,501 5% 20,475 5% Outside Services 28,606 7% 36,300 7% 27,310 5% 31,245 7% 30,726 8% Travel and Promotion Expenses 6,552 2% 10,006 2% 9,812 2% 9,569 2% 10,249 3% Facilities Costs 3,808 1% 5,066 1% 5,400 1% 5,801 1% 5,624 1% Other Expenses 3,362 1% 4,175 1% 5,448 1% 4,866 1% 5,634 1%
Number of Full Time Employees 641 605 596 581 597
May not foot due to rounding
¹Please see our disclaimer regarding non-GAAP financial measures.
($ in thousands)
Annual Core Operating Expenses¹
37 CBOE HOLDINGS
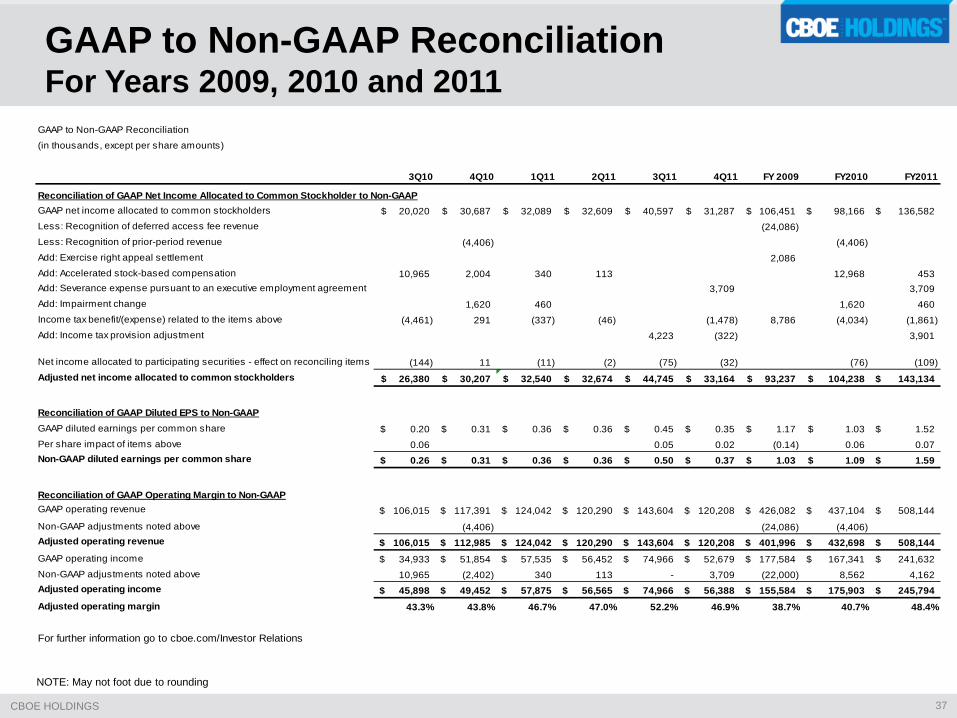
NOTE: May not foot due to rounding
GAAP to Non-GAAP Reconciliation For Years 2009, 2010 and 2011
GAAP to Non-GAAP Reconciliation
(in thousands, except per share amounts)
3Q10 4Q10 1Q11 2Q11 3Q11 4Q11 FY 2009 FY2010 FY2011
Reconciliation of GAAP Net Income Allocated to Common Stockholder to Non-GAAPGAAP net income allocated to common stockholders 20,020$ 30,687$ 32,089$ 32,609$ 40,597$ 31,287$ 106,451$ 98,166$ 136,582$ Less: Recognition of deferred access fee revenue (24,086) Less: Recognition of prior-period revenue (4,406) (4,406) Add: Exercise right appeal settlement 2,086 Add: Accelerated stock-based compensation 10,965 2,004 340 113 12,968 453 Add: Severance expense pursuant to an executive employment agreement 3,709 3,709 Add: Impairment change 1,620 460 1,620 460 Income tax benefit/(expense) related to the items above (4,461) 291 (337) (46) (1,478) 8,786 (4,034) (1,861) Add: Income tax provision adjustment 4,223 (322) 3,901
Net income allocated to participating securities - effect on reconciling items (144) 11 (11) (2) (75) (32) (76) (109) Adjusted net income allocated to common stockholders 26,380$ 30,207$ 32,540$ 32,674$ 44,745$ 33,164$ 93,237$ 104,238$ 143,134$
Reconciliation of GAAP Diluted EPS to Non-GAAPGAAP diluted earnings per common share 0.20$ 0.31$ 0.36$ 0.36$ 0.45$ 0.35$ 1.17$ 1.03$ 1.52$ Per share impact of items above 0.06 0.05 0.02 (0.14) 0.06 0.07 Non-GAAP diluted earnings per common share 0.26$ 0.31$ 0.36$ 0.36$ 0.50$ 0.37$ 1.03$ 1.09$ 1.59$
GAAP operating revenue 106,015$ 117,391$ 124,042$ 120,290$ 143,604$ 120,208$ 426,082$ 437,104$ 508,144$
Non-GAAP adjustments noted above (4,406) (24,086) (4,406) Adjusted operating revenue 106,015$ 112,985$ 124,042$ 120,290$ 143,604$ 120,208$ 401,996$ 432,698$ 508,144$ GAAP operating income 34,933$ 51,854$ 57,535$ 56,452$ 74,966$ 52,679$ 177,584$ 167,341$ 241,632$ Non-GAAP adjustments noted above 10,965 (2,402) 340 113 - 3,709 (22,000) 8,562 4,162 Adjusted operating income 45,898$ 49,452$ 57,875$ 56,565$ 74,966$ 56,388$ 155,584$ 175,903$ 245,794$ Adjusted operating margin 43.3% 43.8% 46.7% 47.0% 52.2% 46.9% 38.7% 40.7% 48.4%
For further information go to cboe.com/Investor Relations
Reconciliation of GAAP Operating Margin to Non-GAAP
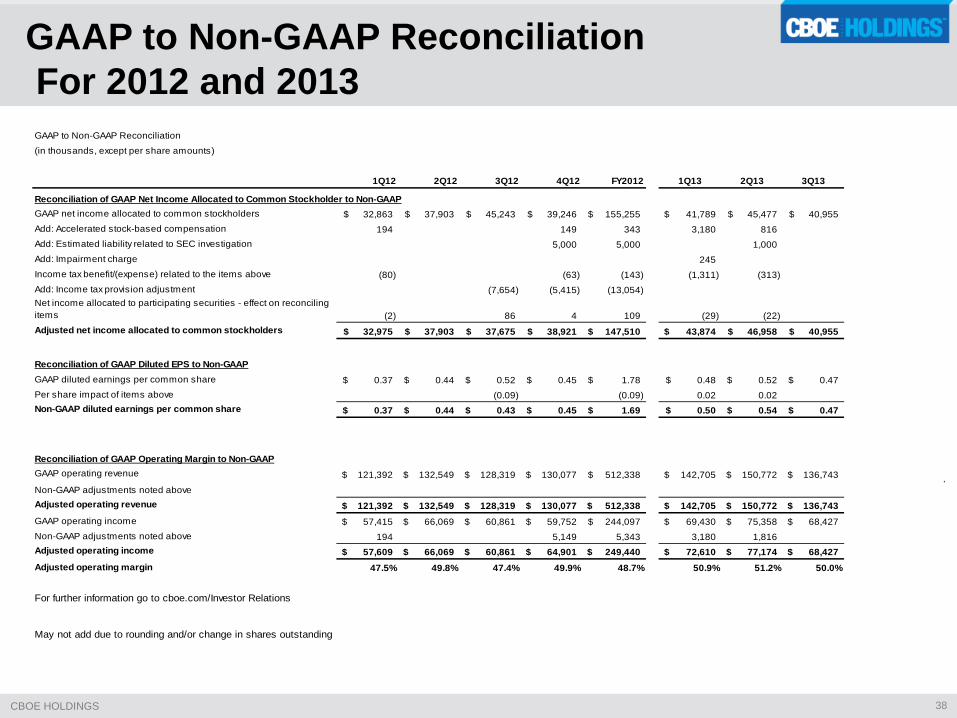
38 CBOE HOLDINGS
GAAP to Non-GAAP Reconciliation For 2012 and 2013
GAAP to Non-GAAP Reconciliation
(in thousands, except per share amounts)
1Q12 2Q12 3Q12 4Q12 FY2012 1Q13 2Q13 3Q13
Reconciliation of GAAP Net Income Allocated to Common Stockholder to Non-GAAPGAAP net income allocated to common stockholders 32,863$ 37,903$ 45,243$ 39,246$ 155,255$ 41,789$ 45,477$ 40,955$ Add: Accelerated stock-based compensation 194 149 343 3,180 816 Add: Estimated liability related to SEC investigation 5,000 5,000 1,000 Add: Impairment charge 245 Income tax benefit/(expense) related to the items above (80) (63) (143) (1,311) (313) Add: Income tax provision adjustment (7,654) (5,415) (13,054) Net income allocated to participating securities - effect on reconciling items (2) 86 4 109 (29) (22) Adjusted net income allocated to common stockholders 32,975$ 37,903$ 37,675$ 38,921$ 147,510$ 43,874$ 46,958$ 40,955$
Reconciliation of GAAP Diluted EPS to Non-GAAPGAAP diluted earnings per common share 0.37$ 0.44$ 0.52$ 0.45$ 1.78$ 0.48$ 0.52$ 0.47$ Per share impact of items above (0.09) (0.09) 0.02 0.02 Non-GAAP diluted earnings per common share 0.37$ 0.44$ 0.43$ 0.45$ 1.69$ 0.50$ 0.54$ 0.47$
Reconciliation of GAAP Operating Margin to Non-GAAPGAAP operating revenue 121,392$ 132,549$ 128,319$ 130,077$ 512,338$ 142,705$ 150,772$ 136,743$
Non-GAAP adjustments noted aboveAdjusted operating revenue 121,392$ 132,549$ 128,319$ 130,077$ 512,338$ 142,705$ 150,772$ 136,743$ GAAP operating income 57,415$ 66,069$ 60,861$ 59,752$ 244,097$ 69,430$ 75,358$ 68,427$ Non-GAAP adjustments noted above 194 5,149 5,343 3,180 1,816 Adjusted operating income 57,609$ 66,069$ 60,861$ 64,901$ 249,440$ 72,610$ 77,174$ 68,427$ Adjusted operating margin 47.5% 49.8% 47.4% 49.9% 48.7% 50.9% 51.2% 50.0%
For further information go to cboe.com/Investor Relations
May not add due to rounding and/or change in shares outstanding

39 CBOE HOLDINGS
In addition to disclosing results determined in accordance with GAAP, CBOE Holdings has disclosed certain non-GAAP measures of operating performance. The non-GAAP measures provided in this presentation include core operating expenses, adjusted operating revenue, adjusted operating expenses, adjusted operating income, adjusted operating margin, adjusted effective tax rate, adjusted net income, adjusted net income allocated to common stockholders and adjusted diluted earnings per share.
Management believes that the non-GAAP financial measures presented in this presentation, including adjusted net income and core operating expenses, provide useful and comparative information to assess trends in our core operations and a means to evaluate period-to-period comparisons. Non-GAAP financial measures disclosed by management, including adjusted diluted EPS, are provided as additional information to investors in order to provide them with an alternative method for assessing our financial condition and operating results. These measures are not in accordance with, or a substitute for, GAAP, and may be different from or inconsistent with non-GAAP financial measures used by other companies.
Core operating expenses is the company’s operating expenses after excluding (i) volume-based expenses, (ii) depreciation and amortization expense, (iii) accelerated stock-based compensation expense and (iv) other unusual or one-time expenses.
Non-GAAP Information
CBOE 400 South LaSalle Street Chicago, Illinois 60605 www.cboe.com