mic fourth quarter 2013 earnings call
TRANSCRIPT

Fourth Quarter Earnings Conference Call Support Slides
February 2014
Macquarie Infrastructure Company
These materials are intended to be viewed in connection with the specific earnings conference call to which they refer, and are qualified in their entirety by reference to that earnings conference call and to the Company’s underlying report on Form 10-Q and Form 10-K.
Disclaimer
This presentation by Macquarie Infrastructure Company LLC (MIC) is proprietary and all rights are reserved. Any reproduction, in whole or in part, without the prior written consent of Macquarie Infrastructure Company is prohibited.
This presentation is based on information generally available to the public and does not contain any material, non-public information. The presentation has been prepared solely for information purposes, it is not a solicitation of any offer to buy or sell any security or instrument.
This presentation contains forward-looking statements. Forward-looking statements in this presentation are subject to a number of risks and uncertainties, some of which are beyond our control. Our actual results, performance, prospects or opportunities could differ materially from those expressed in or implied by the forward-looking statements. A description of known risks that could cause our actual results to differ appears under the caption “Risk Factors” in our Form 10-K and Form 10-Q. Additional risks of which we are not currently aware could also cause our actual results to differ.
These forward-looking statements are made as of the date of this presentation. We undertake no obligation to publicly update or revise any forward-looking statements whether as a result of new information, future events or otherwise, except as required by law.
“Macquarie Group” consists of Macquarie Group Limited and its worldwide subsidiaries and affiliates.
MIC is not an authorised deposit-taking institution for the purposes of the Banking Act 1959 (Commonwealth of Australia) and its obligations do not represent deposits or other liabilities of Macquarie Bank Limited ABN 46 008 583 542. Macquarie Bank Limited does not guarantee or otherwise provide assurance in respect of the obligations of MIC.
2
MIC – Cash Generation
3
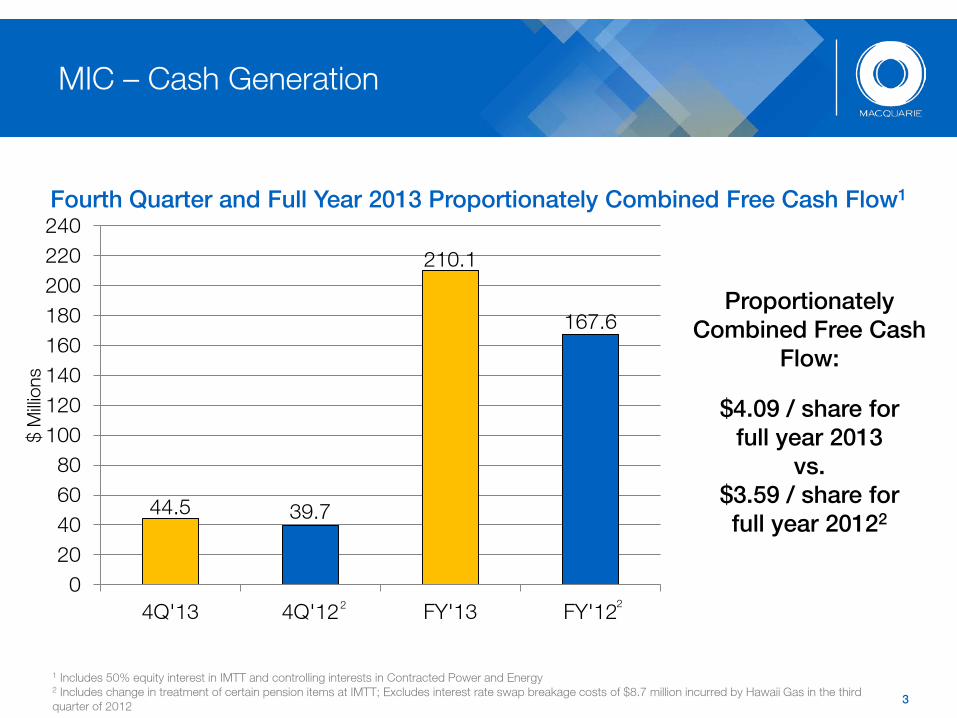
1 Includes 50% equity interest in IMTT and controlling interests in Contracted Power and Energy 2 Includes change in treatment of certain pension items at IMTT; Excludes interest rate swap breakage costs of $8.7 million incurred by Hawaii Gas in the third quarter of 2012
Fourth Quarter and Full Year 2013 Proportionately Combined Free Cash Flow1
Proportionately Combined Free Cash
Flow:
$4.09 / share for full year 2013
vs. $3.59 / share for full year 20122
44.5 39.7
210.1
167.6
0 20 40 60 80
100 120 140 160 180 200 220 240
4Q'13 4Q'12 FY'13 FY'12
$ M
illion
s
2 2
MIC – Cash Generation
4
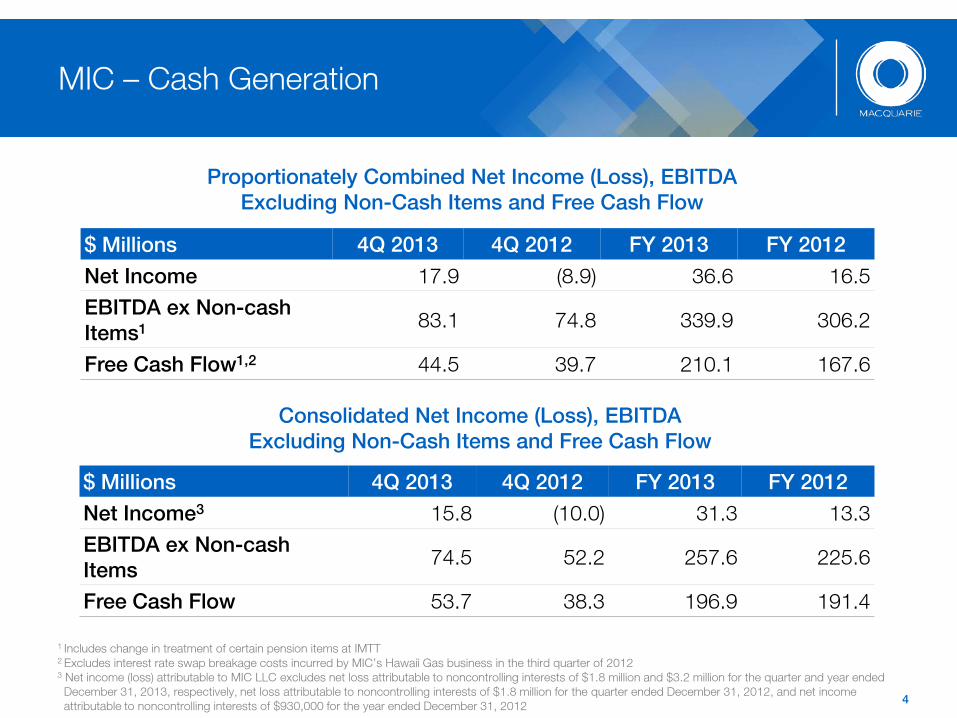
$ Millions 4Q 2013 4Q 2012 FY 2013 FY 2012
Net Income3 15.8 (10.0) 31.3 13.3 EBITDA ex Non-cash Items
74.5 52.2 257.6 225.6
Free Cash Flow 53.7 38.3 196.9 191.4
$ Millions 4Q 2013 4Q 2012 FY 2013 FY 2012
Net Income 17.9 (8.9) 36.6 16.5 EBITDA ex Non-cash Items1
83.1 74.8 339.9 306.2
Free Cash Flow1,2 44.5 39.7 210.1 167.6
Proportionately Combined Net Income (Loss), EBITDA Excluding Non-Cash Items and Free Cash Flow
Consolidated Net Income (Loss), EBITDA Excluding Non-Cash Items and Free Cash Flow
1 Includes change in treatment of certain pension items at IMTT
2 Excludes interest rate swap breakage costs incurred by MIC’s Hawaii Gas business in the third quarter of 2012
3 Net income (loss) attributable to MIC LLC excludes net loss attributable to noncontrolling interests of $1.8 million and $3.2 million for the quarter and year ended December 31, 2013, respectively, net loss attributable to noncontrolling interests of $1.8 million for the quarter ended December 31, 2012, and net income attributable to noncontrolling interests of $930,000 for the year ended December 31, 2012
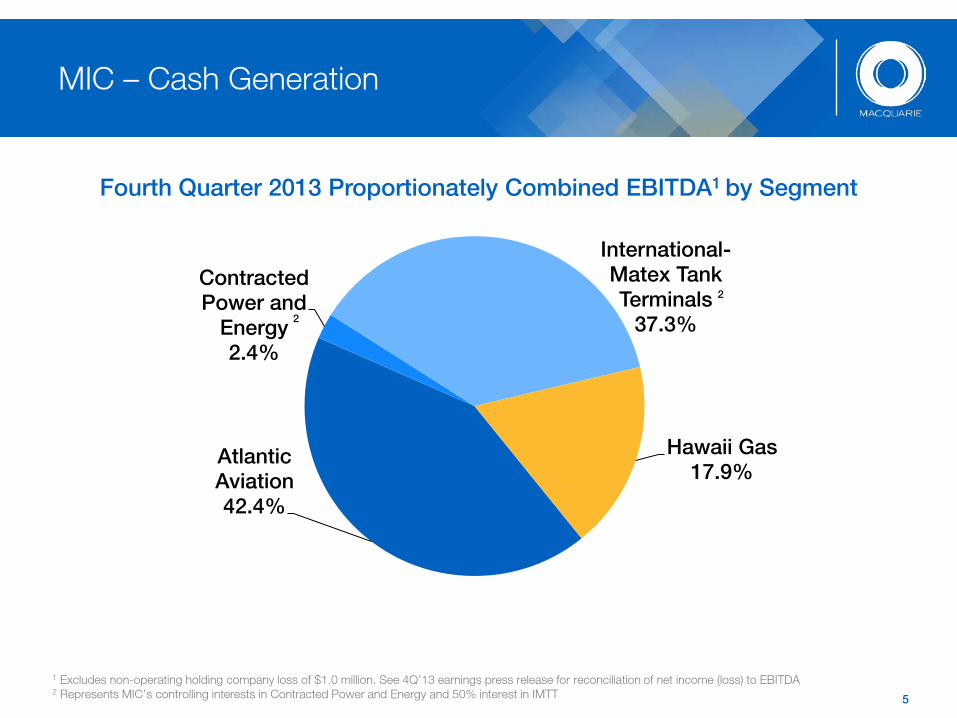
Atlantic Aviation 42.4%
Contracted Power and
Energy 2.4%
International-Matex Tank Terminals
37.3%
Hawaii Gas 17.9%
MIC – Cash Generation
5
1 Excludes non-operating holding company loss of $1.0 million. See 4Q’13 earnings press release for reconciliation of net income (loss) to EBITDA 2 Represents MIC’s controlling interests in Contracted Power and Energy and 50% interest in IMTT
Fourth Quarter 2013 Proportionately Combined EBITDA1 by Segment
2
2
MIC – Performance Overview
FY’13 - Key Elements in Results
• Proportionately Combined FCF up 25.4%1
• Proportionately Combined FCF per share up 11.7% to $4.091
• Lower interest expense and operational improvement at Atlantic Aviation
• Increase in terminal revenue at IMTT
• Contribution from Contracted Power and Energy (“CP&E”) on operations of contracted power facilities acquired in 2012
• 4.7 million share (10.2%) increase in weighted average shares outstanding
• Public equity offerings in May and December
• Management and performance fees re-invested in shares
6
1 Excludes interest rate swap breakage costs incurred by MIC’s Hawaii Gas business in the third quarter of 2012
MIC – Performance Overview
4Q’13 - Key Elements in Results
• Proportionately Combined FCF up 12.2%
• Operational improvement at Atlantic Aviation, partially offset by increased interest expense and higher taxes
• Increase in terminal revenue at IMTT, offset by cost increases
• Contribution related to full quarter of operations by contracted power facilities acquired in 2012
• Cash dividend of $0.9125 ($3.65 annualized) per share declared
• Record date: March 3, 2014
• Payable date: March 6, 2014
7
MIC – Acquisition of Boca Raton Fixed Base Operation
On February 14, 2014, Atlantic Aviation signed an agreement to acquire Fixed Base Operation (“FBO”) at Boca Raton Florida Airport
• Expected to close at the end of Q1 2014 along with the proposed Galaxy Aviation acquisitions announced in December
• Projected to generate annualized adjusted EBITDA of ~$3.2 million
• Together, proposed acquisitions expected to:
• Increase the total number of FBOs in the network to 69
• Make Atlantic Aviation the second largest FBO operator in Florida – the largest general aviation market in the U.S.
• Increase the weighted average lease life to 19.6 years from 19.0 years
8
MIC – 2014 Full Year Guidance
MIC initiates 2014 guidance for Proportionately Combined FCF between $4.35 and $4.50 per share for the full year
• Increase in FCF at Atlantic Aviation driven by:
• Ongoing recovery in general aviation flight activity
• Growth in EBITDA pending successful closing of proposed acquisitions
• Normalization of maintenance capex at IMTT
• Supply stabilization at Hawaii Gas
• Contribution from Contracted Power and Energy related to operations by contracted power facilities acquired in 2013
• Proportionately Combined EBITDA expected to be ~$385.0 million
• Proportionately Combined Maintenance Capex expected to be ~$45.0 million
9

MIC 4Q and FY’13 – Atlantic Aviation Operations
Increased Flight Movements and Market Share Growth Drive Cash in Q4
• Gross profit up 11.4% on increase in fuel sales, rental rates and de-icing revenue
• EBITDA up 13.7%
• FCF down 7.3% primarily due to expected increases in maintenance capex and higher taxes
Strong FY ’13 Results
• Cash interest expense (excluding swap breakage costs) declined to $18.8 million from $42.7 million following the successful refinancing in May of 2013
• Higher fuel gross profit primarily due to higher margin per gallon and an increase in gallons sold:
• Total gross profit up 5.8%
• Same store volume of GA fuel sold up 3.3%
• Same store average fuel margin up 2.1%
• FCF up 44.1% primarily due to lower interest expense
10
MIC 4Q and FY’13 – IMTT (100%) Operations
Increased Operating Expenses Offset Growth in Terminal Revenue in Q4
• Terminal revenue up 4.4%
• Terminal operating costs higher primarily due to higher labor and benefits costs
• FCF up 33.1% primarily on growth in EBITDA and lower maintenance capex
• Results reflect a change in treatment of certain pension items
• Excluding the change, FCF would have been up 17.8%
FY ’13 Results Broadly in Line with MIC’s Expectations
• Terminal revenue up 7.6%
• EBITDA up 15.9% reflecting improved operating results and the above mentioned change in treatment of certain pension items
• Excluding the pension change, EBITDA would have been up 10.9%
• FCF up 1.4%
• Partially offset by increase in maintenance capex due to Hurricane Sandy
• Excluding the pension change, FCF would have been down 4.5%
11
MIC 4Q and FY’13 – Hawaii Gas Operations
Volume Uplift in Q4
• Contribution margin rose 1.3% on increase in volume of gas sold of 2.0%
• EBITDA flat on Q4 2012
• FCF down 52.6% primarily due to increased provision for income taxes
• Cost of $2.7 million vs. income tax benefit of $7.9 million in Q4 2012
FY ’13 Performance Affected by Supply Disruptions
• Volume of gas sold up 0.5%
• Non-utility volume increased by 0.6% driven by customer mix
• EBITDA down 2.3% due to increases in production costs related to higher labor expenses
• FCF down 7.2% on changes in provision for income taxes
• The ~$5.3 million full year federal tax will be offset in consolidation
12

MIC 4Q and FY’13 – Contracted Power and Energy (100%) Operations
Contracted Power Contributions Boost Gross Profit in Q4
• Investments in solar facilities and district energy business combined
• Gross profit up 45.1% on contribution from solar facilities acquired in 2012
Strong FY ’13 Results
• Five solar facilities in operation at year end
• Three were commissioned late in the year, having minimal impact on revenue
• SG&A expenses down primarily on reduced legal and professional fees
• Gross profit up 28.2% on contribution from contracted power facilities acquired in 2012
• EBITDA up 45.7%
• FCF increases to $13.7 million from $8.4 million
13
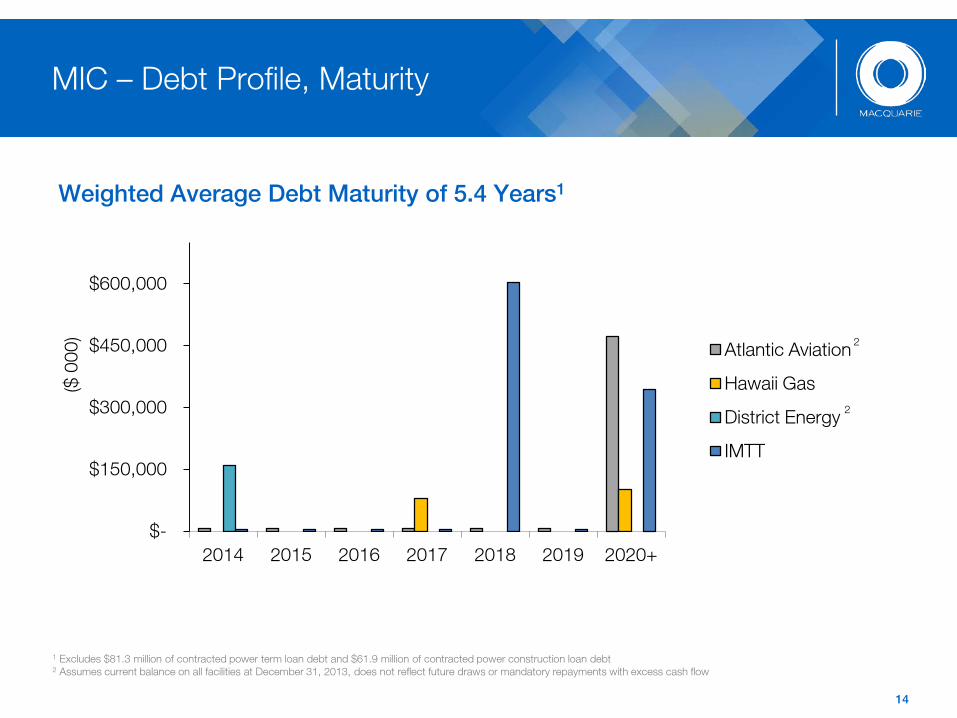
Weighted Average Debt Maturity of 5.4 Years1
MIC – Debt Profile, Maturity
14
1 Excludes $81.3 million of contracted power term loan debt and $61.9 million of contracted power construction loan debt 2 Assumes current balance on all facilities at December 31, 2013, does not reflect future draws or mandatory repayments with excess cash flow
2
2
$-
$150,000
$300,000
$450,000
$600,000
2014 2015 2016 2017 2018 2019 2020+
($ 0
00)
Atlantic Aviation
Hawaii Gas
District Energy
IMTT
Amount Weighted Average($000) All-in Rate
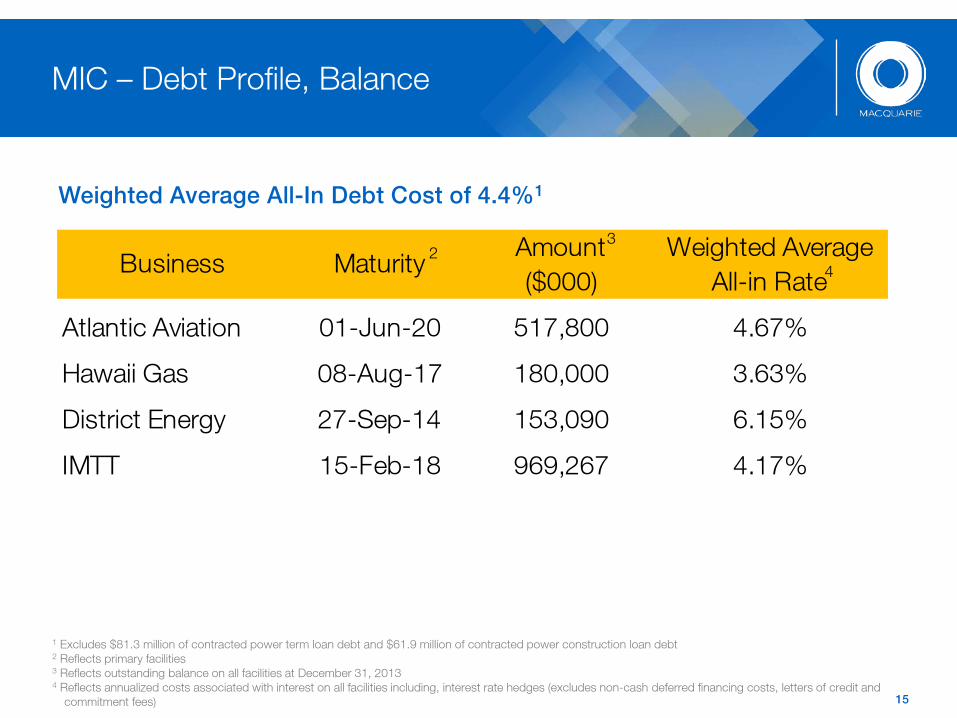
Atlantic Aviation 01-Jun-20 517,800 4.67%
Hawaii Gas 08-Aug-17 180,000 3.63%
District Energy 27-Sep-14 153,090 6.15%
IMTT 15-Feb-18 969,267 4.17%
Business Maturity
MIC – Debt Profile, Balance
15
1 Excludes $81.3 million of contracted power term loan debt and $61.9 million of contracted power construction loan debt 2 Reflects primary facilities 3 Reflects outstanding balance on all facilities at December 31, 2013 4 Reflects annualized costs associated with interest on all facilities including, interest rate hedges (excludes non-cash deferred financing costs, letters of credit and
commitment fees)
4 2
3
Weighted Average All-In Debt Cost of 4.4%1
Appendix: Reconciliation of Segment Financial Data, Fourth Quarter 2013

Atlantic Aviation
17
2013 2012 2013 2012 $ $ $ % $ $ $ %
Quarter Ended December 31, Change
Favorable/(Unfavorable)
Year Ended December 31, Change
Favorable/(Unfavorable)
($ In Thousands) (Unaudited)
RevenueFuel revenue 139,082 140,513 (1,431) (1.0) 556,387 560,710 (4,323) (0.8)Non-fuel revenue 44,558 38,643 5,915 15.3 169,093 159,145 9,948 6.3
Total revenue 183,640 179,156 4,484 2.5 725,480 719,855 5,625 0.8 Cost of revenueCost of revenue-fuel 96,544 100,584 4,040 4.0 386,417 396,384 9,967 2.5 Cost of revenue-non-fuel 4,040 4,001 (39) (1.0) 15,889 18,037 2,148 11.9
Total cost of revenue 100,584 104,585 4,001 3.8 402,306 414,421 12,115 2.9 Fuel gross profit 42,538 39,929 2,609 6.5 169,970 164,326 5,644 3.4 Non-fuel gross profit 40,518 34,642 5,876 17.0 153,204 141,108 12,096 8.6 Gross profit 83,056 74,571 8,485 11.4 323,174 305,434 17,740 5.8
Selling, general and administrative expenses 47,453 43,209 (4,244) (9.8) 178,182 174,039 (4,143) (2.4)Depreciation and amortization 14,461 14,920 459 3.1 56,378 56,681 303 0.5 Loss (gain) on disposal of assets - 21 21 100.0 226 (1,358) (1,584) (116.6)Operating income 21,142 16,421 4,721 28.7 88,388 76,072 12,316 16.2 Interest expense, net(1) (1,945) (4,515) 2,570 56.9 (22,151) (27,963) 5,812 20.8 Loss on extinguishment of debt - - - NM (2,472) - (2,472) NM Other (expense) income (56) 931 (987) (106.0) (2) 969 (971) (100.2)Provision for income taxes (7,209) (5,525) (1,684) (30.5) (25,218) (21,340) (3,878) (18.2)Net income(2) 11,932 7,312 4,620 63.2 38,545 27,738 10,807 39.0
( ) ( )
_____________________
NM - Not meaningful(1) Interest expense, net, includes adjustments to derivative instruments, non-cash amortization of deferred financing fees and interest rate swap breakage fees.(2) Corporate allocation expense, intercompany fees and the tax effect have been excluded from the above table as they are eliminated on consolidation at the MIC Inc. level.
Atlantic Aviation
18
2013 2012 2013 2012 $ $ $ % $ $ $ %
Quarter Ended December 31, Change
Favorable/(Unfavorable)
Year Ended December 31, Change
Favorable/(Unfavorable)
($ In Thousands) (Unaudited)
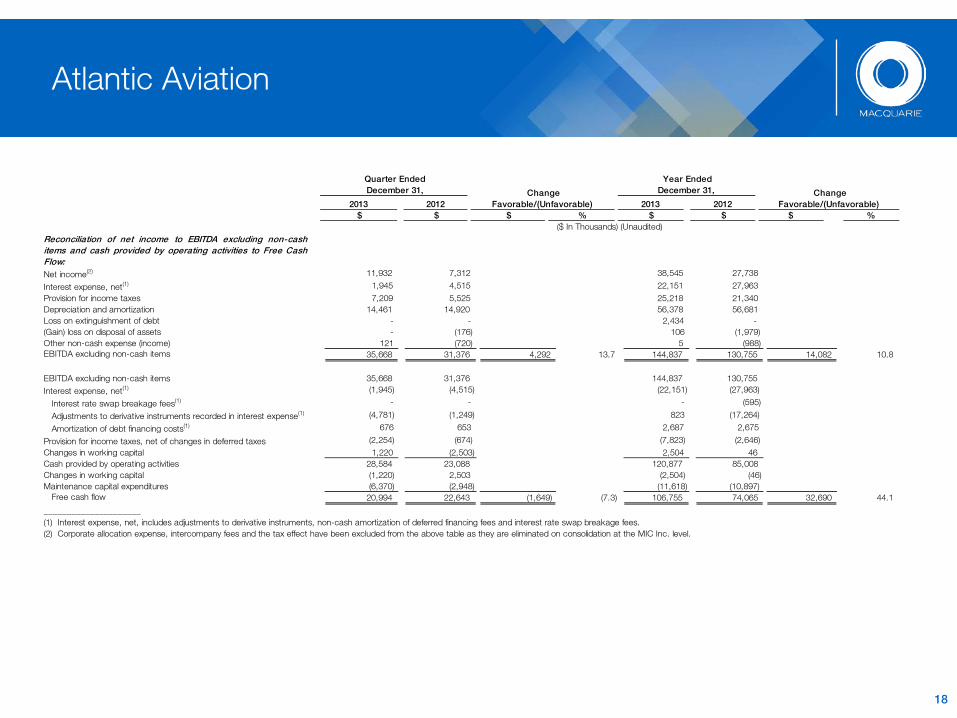
Reconciliation of net income to EBITDA excluding non-cashitems and cash provided by operating activities to Free CashFlow:Net income(2) 11,932 7,312 38,545 27,738
Interest expense, net(1) 1,945 4,515 22,151 27,963 Provision for income taxes 7,209 5,525 25,218 21,340 Depreciation and amortization 14,461 14,920 56,378 56,681 Loss on extinguishment of debt - - 2,434 - (Gain) loss on disposal of assets - (176) 106 (1,979)Other non-cash expense (income) 121 (720) 5 (988)EBITDA excluding non-cash items 35,668 31,376 4,292 13.7 144,837 130,755 14,082 10.8
EBITDA excluding non-cash items 35,668 31,376 144,837 130,755 Interest expense, net(1) (1,945) (4,515) (22,151) (27,963)
Interest rate swap breakage fees(1) - - - (595)
Adjustments to derivative instruments recorded in interest expense(1) (4,781) (1,249) 823 (17,264)
Amortization of debt financing costs(1) 676 653 2,687 2,675
Provision for income taxes, net of changes in deferred taxes (2,254) (674) (7,823) (2,646)Changes in working capital 1,220 (2,503) 2,504 46 Cash provided by operating activities 28,584 23,088 120,877 85,008 Changes in working capital (1,220) 2,503 (2,504) (46)Maintenance capital expenditures (6,370) (2,948) (11,618) (10,897)
Free cash flow 20,994 22,643 (1,649) (7.3) 106,755 74,065 32,690 44.1
_____________________
(1) Interest expense, net, includes adjustments to derivative instruments, non-cash amortization of deferred financing fees and interest rate swap breakage fees.(2) Corporate allocation expense, intercompany fees and the tax effect have been excluded from the above table as they are eliminated on consolidation at the MIC Inc. level.
International-Matex Tank Terminals (100%)
19
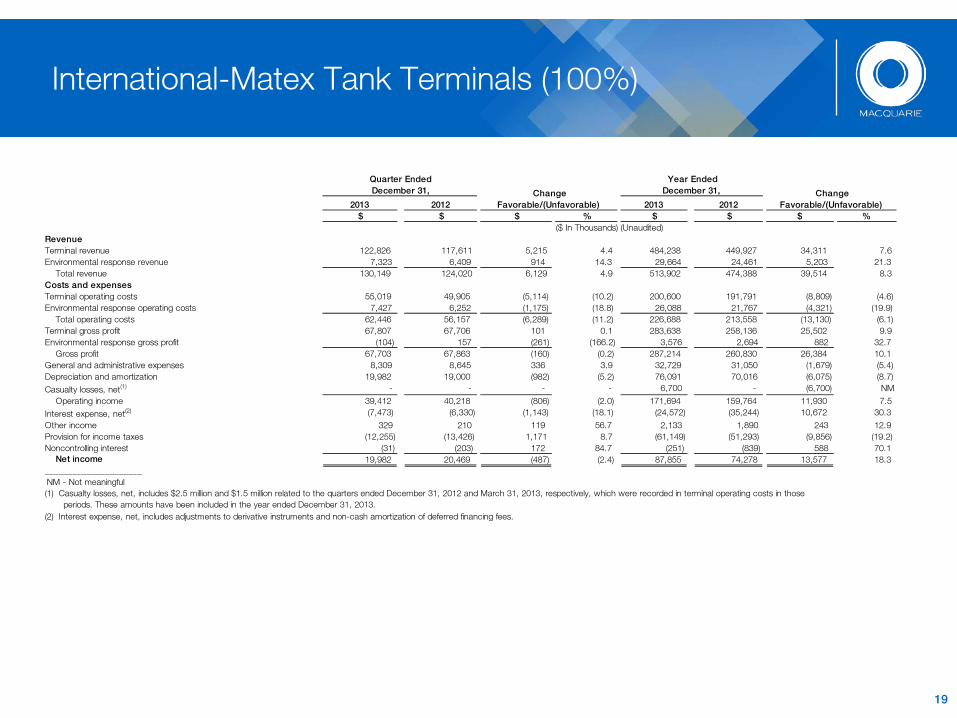
_____________________NM - Not meaningful
(1) Casualty losses, net, includes $2.5 million and $1.5 million related to the quarters ended December 31, 2012 and March 31, 2013, respectively, which were recorded in terminal operating costs in those periods. These amounts have been included in the year ended December 31, 2013.(2) Interest expense, net, includes adjustments to derivative instruments and non-cash amortization of deferred financing fees.
2013 2012 2013 2012 $ $ $ % $ $ $ %
122,826 117,611 5,215 4.4 484,238 449,927 34,311 7.6 7,323 6,409 914 14.3 29,664 24,461 5,203 21.3
130,149 124,020 6,129 4.9 513,902 474,388 39,514 8.3
55,019 49,905 (5,114) (10.2) 200,600 191,791 (8,809) (4.6) 7,427 6,252 (1,175) (18.8) 26,088 21,767 (4,321) (19.9)
62,446 56,157 (6,289) (11.2) 226,688 213,558 (13,130) (6.1) 67,807 67,706 101 0.1 283,638 258,136 25,502 9.9
(104) 157 (261) (166.2) 3,576 2,694 882 32.7 67,703 67,863 (160) (0.2) 287,214 260,830 26,384 10.1
8,309 8,645 336 3.9 32,729 31,050 (1,679) (5.4) 19,982 19,000 (982) (5.2) 76,091 70,016 (6,075) (8.7)
- - - - 6,700 - (6,700) NM 39,412 40,218 (806) (2.0) 171,694 159,764 11,930 7.5
(7,473) (6,330) (1,143) (18.1) (24,572) (35,244) 10,672 30.3 329 210 119 56.7 2,133 1,890 243 12.9
(12,255) (13,426) 1,171 8.7 (61,149) (51,293) (9,856) (19.2) (31) (203) 172 84.7 (251) (839) 588 70.1
19,982 20,469 (487) (2.4) 87,855 74,278 13,577 18.3
Quarter Ended December 31, Change
Favorable/(Unfavorable)
Year Ended December 31, Change
Favorable/(Unfavorable)
($ In Thousands) (Unaudited)
RevenueTerminal revenue Environmental response revenue
Total revenue Costs and expensesTerminal operating costs Environmental response operating costs
Total operating costs Terminal gross profit Environmental response gross profit
Gross profit General and administrative expenses Depreciation and amortization Casualty losses, net(1)
Operating income Interest expense, net(2) Other income Provision for income taxes Noncontrolling interest
Net income
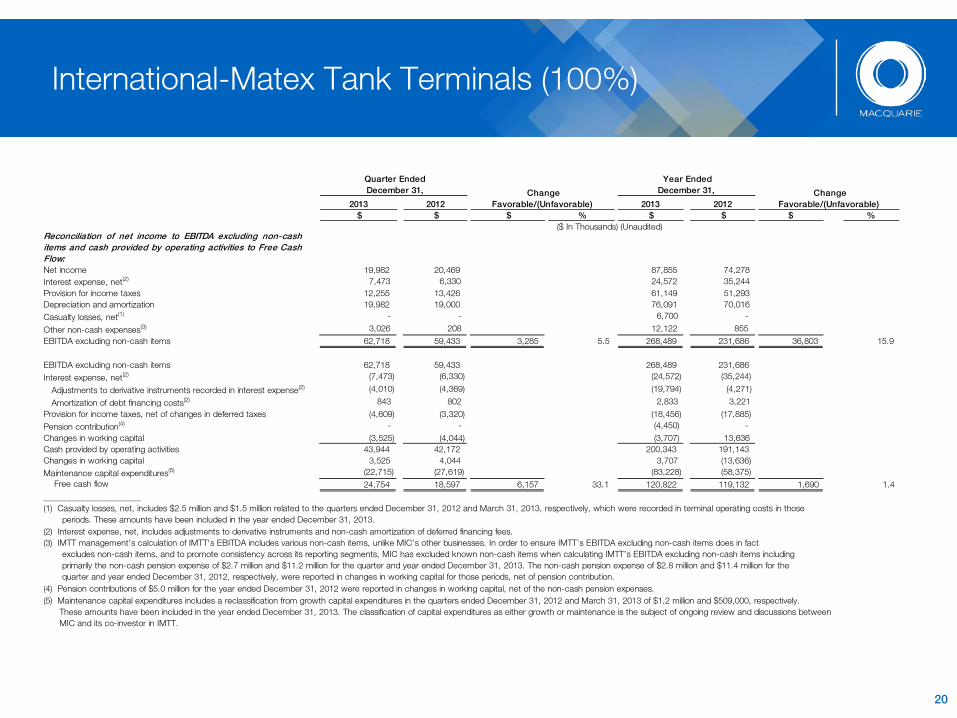
Reconciliation of net income to EBITDA excluding non-cashitems and cash provided by operating activities to Free CashFlow:Net income 19,982 20,469 87,855 74,278 Interest expense, net(2) 7,473 6,330 24,572 35,244 Provision for income taxes 12,255 13,426 61,149 51,293 Depreciation and amortization 19,982 19,000 76,091 70,016 Casualty losses, net(1) - - 6,700 -
Other non-cash expenses(3) 3,026 208 12,122 855 EBITDA excluding non-cash items 62,718 59,433 3,285 5.5 268,489 231,686 36,803 15.9
EBITDA excluding non-cash items 62,718 59,433 268,489 231,686 Interest expense, net(2) (7,473) (6,330) (24,572) (35,244)
Adjustments to derivative instruments recorded in interest expense(2) (4,010) (4,369) (19,794) (4,271)
Amortization of debt financing costs(2) 843 802 2,833 3,221 Provision for income taxes, net of changes in deferred taxes (4,609) (3,320) (18,456) (17,885)Pension contribution(4) - - (4,450) - Changes in working capital (3,525) (4,044) (3,707) 13,636 Cash provided by operating activities 43,944 42,172 200,343 191,143 Changes in working capital 3,525 4,044 3,707 (13,636)Maintenance capital expenditures(5) (22,715) (27,619) (83,228) (58,375)
Free cash flow 24,754 18,597 6,157 33.1 120,822 119,132 1,690 1.4 _____________________
International-Matex Tank Terminals (100%)
20
2013 2012 2013 2012 $ $ $ % $ $ $ %
Quarter Ended December 31, Change
Favorable/(Unfavorable)
Year Ended December 31, Change
Favorable/(Unfavorable)
($ In Thousands) (Unaudited)
(1) Casualty losses, net, includes $2.5 million and $1.5 million related to the quarters ended December 31, 2012 and March 31, 2013, respectively, which were recorded in terminal operating costs in those periods. These amounts have been included in the year ended December 31, 2013.(2) Interest expense, net, includes adjustments to derivative instruments and non-cash amortization of deferred financing fees.(3) IMTT management's calculation of IMTT's EBITDA includes various non-cash items, unlike MIC’s other businesses. In order to ensure IMTT’s EBITDA excluding non-cash items does in fact excludes non-cash items, and to promote consistency across its reporting segments, MIC has excluded known non-cash items when calculating IMTT’s EBITDA excluding non-cash items including primarily the non-cash pension expense of $2.7 million and $11.2 million for the quarter and year ended December 31, 2013. The non-cash pension expense of $2.8 million and $11.4 million for the quarter and year ended December 31, 2012, respectively, were reported in changes in working capital for those periods, net of pension contribution. (4) Pension contributions of $5.0 million for the year ended December 31, 2012 were reported in changes in working capital, net of the non-cash pension expenses.(5) Maintenance capital expenditures includes a reclassification from growth capital expenditures in the quarters ended December 31, 2012 and March 31, 2013 of $1.2 million and $509,000, respectively. These amounts have been included in the year ended December 31, 2013. The classification of capital expenditures as either growth or maintenance is the subject of ongoing review and discussions between MIC and its co-investor in IMTT.
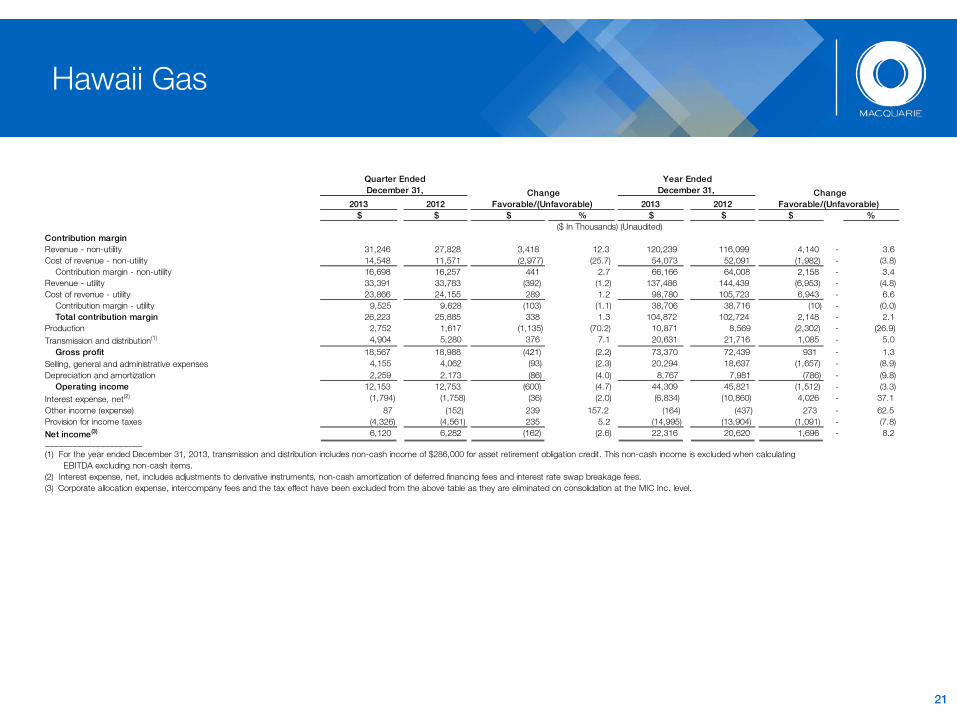
Contribution marginRevenue - non-utility 31,246 27,828 3,418 12.3 120,239 116,099 4,140 - 3.6 Cost of revenue - non-utility 14,548 11,571 (2,977) (25.7) 54,073 52,091 (1,982) - (3.8)
Contribution margin - non-utility 16,698 16,257 441 2.7 66,166 64,008 2,158 - 3.4 Revenue - utility 33,391 33,783 (392) (1.2) 137,486 144,439 (6,953) - (4.8)Cost of revenue - utility 23,866 24,155 289 1.2 98,780 105,723 6,943 - 6.6
Contribution margin - utility 9,525 9,628 (103) (1.1) 38,706 38,716 (10) - (0.0) Total contribution margin 26,223 25,885 338 1.3 104,872 102,724 2,148 - 2.1
Production 2,752 1,617 (1,135) (70.2) 10,871 8,569 (2,302) - (26.9)Transmission and distribution(1) 4,904 5,280 376 7.1 20,631 21,716 1,085 - 5.0
Gross profit 18,567 18,988 (421) (2.2) 73,370 72,439 931 - 1.3 Selling, general and administrative expenses 4,155 4,062 (93) (2.3) 20,294 18,637 (1,657) - (8.9)Depreciation and amortization 2,259 2,173 (86) (4.0) 8,767 7,981 (786) - (9.8)
Operating income 12,153 12,753 (600) (4.7) 44,309 45,821 (1,512) - (3.3)Interest expense, net(2) (1,794) (1,758) (36) (2.0) (6,834) (10,860) 4,026 - 37.1 Other income (expense) 87 (152) 239 157.2 (164) (437) 273 - 62.5 Provision for income taxes (4,326) (4,561) 235 5.2 (14,995) (13,904) (1,091) - (7.8)Net income(3) 6,120 6,282 (162) (2.6) 22,316 20,620 1,696 - 8.2
Hawaii Gas
21
2013 2012 2013 2012 $ $ $ % $ $ $ %
Quarter Ended December 31, Change
Favorable/(Unfavorable)
Year Ended December 31, Change
Favorable/(Unfavorable)
($ In Thousands) (Unaudited)
_____________________
(1) For the year ended December 31, 2013, transmission and distribution includes non-cash income of $286,000 for asset retirement obligation credit. This non-cash income is excluded when calculating EBITDA excluding non-cash items.(2) Interest expense, net, includes adjustments to derivative instruments, non-cash amortization of deferred financing fees and interest rate swap breakage fees.(3) Corporate allocation expense, intercompany fees and the tax effect have been excluded from the above table as they are eliminated on consolidation at the MIC Inc. level.

Hawaii Gas
22
2013 2012 2013 2012 $ $ $ % $ $ $ %
Quarter Ended December 31, Change
Favorable/(Unfavorable)
Year Ended December 31, Change
Favorable/(Unfavorable)
($ In Thousands) (Unaudited)
Reconciliation of net income to EBITDA excluding non-cashitems and cash provided by operating activities to Free CashFlow:Net income(3) 6,120 6,282 22,316 20,620
Interest expense, net(2) 1,794 1,758 6,834 10,860 Provision for income taxes 4,326 4,561 14,995 13,904 Depreciation and amortization 2,259 2,173 8,767 7,981 Other non-cash expenses(1) 524 269 2,116 2,940 EBITDA excluding non-cash items 15,023 15,043 (20) (0.1) 55,028 56,305 (1,277) (2.3)
EBITDA excluding non-cash items 15,023 15,043 55,028 56,305 Interest expense, net(2) (1,794) (1,758) (6,834) (10,860)
Interest rate swap breakage fees(2) - - - (8,701) expense(2) (4) (51) (430) 3,038
Amortization of debt financing costs(2) 113 112 455 858 Provision for income taxes, net of changes in deferred taxes (2,744) 7,862 (6,705) 1,974 Pension contribution(4) (900) - (3,150) - Changes in working capital 3,808 (7,829) 2,248 (6,712)Cash provided by operating activities 13,502 13,379 40,612 35,902 Changes in working capital (3,808) 7,829 (2,248) 6,712 Maintenance capital expenditures (979) (2,822) (6,316) (8,063)
Free cash flow 8,715 18,386 (9,671) (52.6) 32,048 34,551 (2,503) (7.2)_____________________
(1) For the year ended December 31, 2013, transmission and distribution includes non-cash income of $286,000 for asset retirement obligation credit. This non-cash income is excluded when calculating EBITDA excluding non-cash items.(2) Interest expense, net, includes adjustments to derivative instruments, non-cash amortization of deferred financing fees and interest rate swap breakage fees.(3) Corporate allocation expense, intercompany fees and the tax effect have been excluded from the above table as they are eliminated on consolidation at the MIC Inc. level.(4) Pension contribution of $1.6 million and $3.8 million for the quarter and year ended December 31, 2012, respectively, were reported in changes in working capital for those periods.
CP&E (100%)
23
2013 2012 2013 2012 $ $ $ % $ $ $ %
Quarter Ended December 31, Change
Favorable/(Unfavorable)
Year Ended December 31, Change
Favorable/(Unfavorable)
($ In Thousands) (Unaudited)
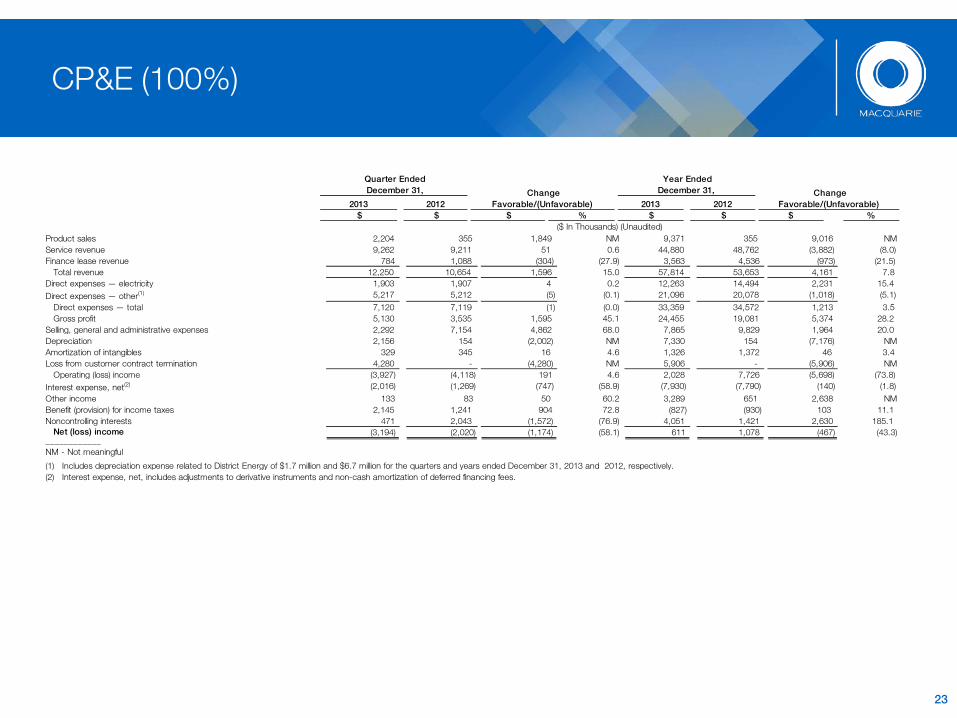
Product sales 2,204 355 1,849 NM 9,371 355 9,016 NM Service revenue 9,262 9,211 51 0.6 44,880 48,762 (3,882) (8.0)Finance lease revenue 784 1,088 (304) (27.9) 3,563 4,536 (973) (21.5)
Total revenue 12,250 10,654 1,596 15.0 57,814 53,653 4,161 7.8 Direct expenses — electricity 1,903 1,907 4 0.2 12,263 14,494 2,231 15.4 Direct expenses — other(1) 5,217 5,212 (5) (0.1) 21,096 20,078 (1,018) (5.1)
Direct expenses — total 7,120 7,119 (1) (0.0) 33,359 34,572 1,213 3.5 Gross profit 5,130 3,535 1,595 45.1 24,455 19,081 5,374 28.2
Selling, general and administrative expenses 2,292 7,154 4,862 68.0 7,865 9,829 1,964 20.0 Depreciation 2,156 154 (2,002) NM 7,330 154 (7,176) NM Amortization of intangibles 329 345 16 4.6 1,326 1,372 46 3.4 Loss from customer contract termination 4,280 - (4,280) NM 5,906 - (5,906) NM
Operating (loss) income (3,927) (4,118) 191 4.6 2,028 7,726 (5,698) (73.8)Interest expense, net(2) (2,016) (1,269) (747) (58.9) (7,930) (7,790) (140) (1.8)Other income 133 83 50 60.2 3,289 651 2,638 NM Benefit (provision) for income taxes 2,145 1,241 904 72.8 (827) (930) 103 11.1 Noncontrolling interests 471 2,043 (1,572) (76.9) 4,051 1,421 2,630 185.1
Net (loss) income (3,194) (2,020) (1,174) (58.1) 611 1,078 (467) (43.3)
____________NM - Not meaningful
(2) Interest expense, net, includes adjustments to derivative instruments and non-cash amortization of deferred financing fees.
(1) Includes depreciation expense related to District Energy of $1.7 million and $6.7 million for the quarters and years ended December 31, 2013 and 2012, respectively.
CP&E (100%)
2013 2012 2013 2012 $ $ $ % $ $ $ %
Quarter Ended December 31, Change
Favorable/(Unfavorable)
Year Ended December 31, Change
Favorable/(Unfavorable)
($ In Thousands) (Unaudited)
24
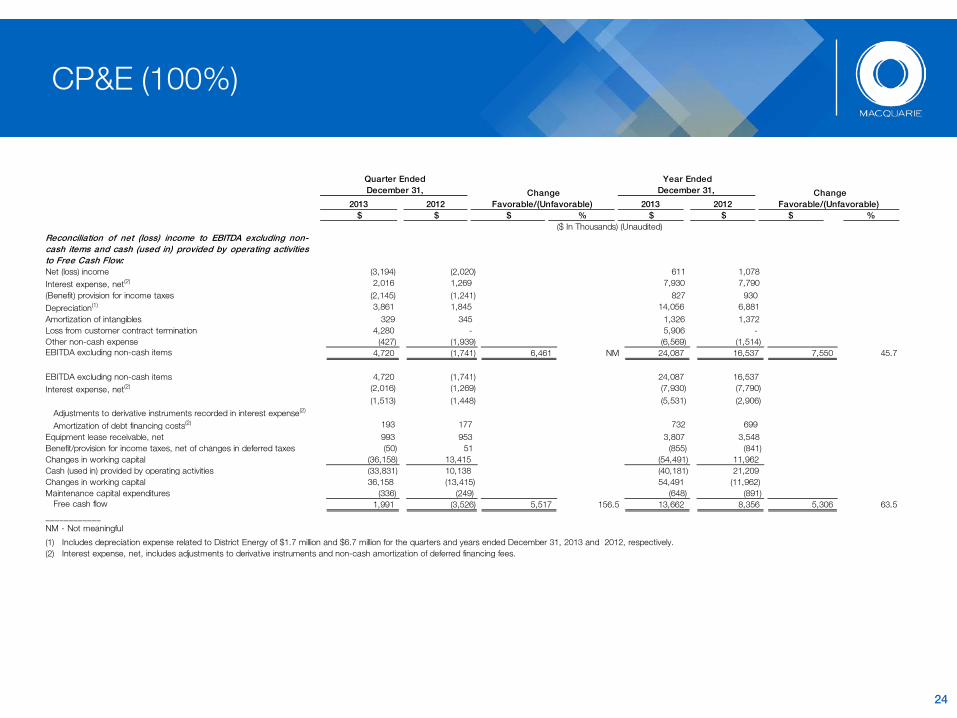
Reconciliation of net (loss) income to EBITDA excluding non-cash items and cash (used in) provided by operating activitiesto Free Cash Flow:Net (loss) income (3,194) (2,020) 611 1,078 Interest expense, net(2) 2,016 1,269 7,930 7,790 (Benefit) provision for income taxes (2,145) (1,241) 827 930 Depreciation(1) 3,861 1,845 14,056 6,881 Amortization of intangibles 329 345 1,326 1,372 Loss from customer contract termination 4,280 - 5,906 - Other non-cash expense (427) (1,939) (6,569) (1,514)EBITDA excluding non-cash items 4,720 (1,741) 6,461 NM 24,087 16,537 7,550 45.7
EBITDA excluding non-cash items 4,720 (1,741) 24,087 16,537 Interest expense, net(2) (2,016) (1,269) (7,930) (7,790)
Adjustments to derivative instruments recorded in interest expense(2) (1,513) (1,448) (5,531) (2,906)
Amortization of debt financing costs(2) 193 177 732 699 Equipment lease receivable, net 993 953 3,807 3,548 Benefit/provision for income taxes, net of changes in deferred taxes (50) 51 (855) (841)Changes in working capital (36,158) 13,415 (54,491) 11,962 Cash (used in) provided by operating activities (33,831) 10,138 (40,181) 21,209 Changes in working capital 36,158 (13,415) 54,491 (11,962)Maintenance capital expenditures (336) (249) (648) (891)
Free cash flow 1,991 (3,526) 5,517 156.5 13,662 8,356 5,306 63.5 ____________NM - Not meaningful
(2) Interest expense, net, includes adjustments to derivative instruments and non-cash amortization of deferred financing fees.
(1) Includes depreciation expense related to District Energy of $1.7 million and $6.7 million for the quarters and years ended December 31, 2013 and 2012, respectively.
Corporate
25
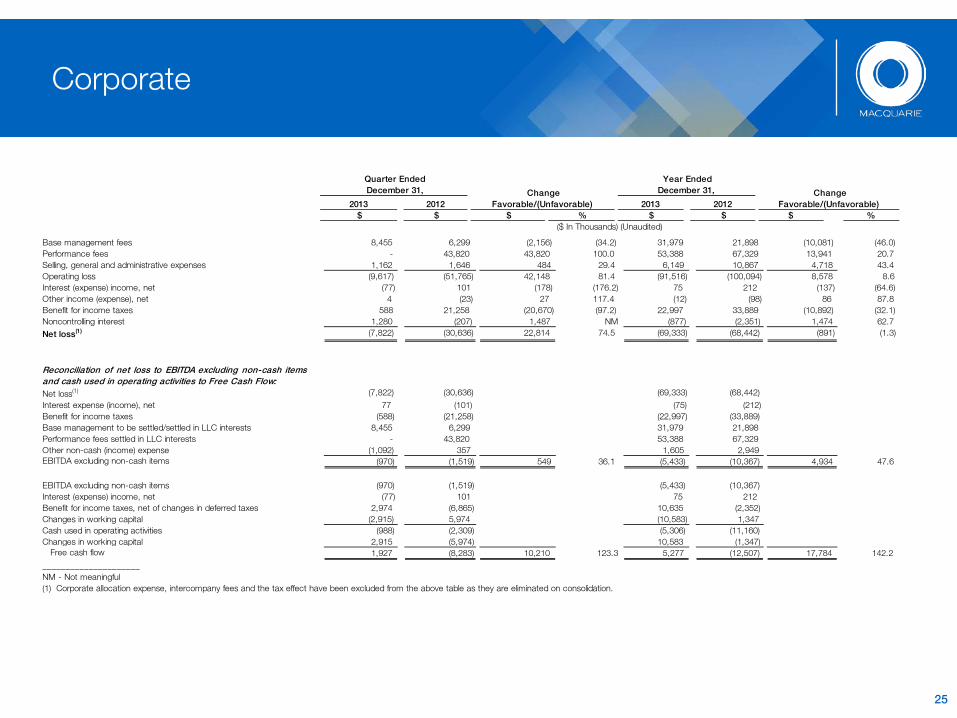
Base management fees 8,455 6,299 (2,156) (34.2) 31,979 21,898 (10,081) (46.0)Performance fees - 43,820 43,820 100.0 53,388 67,329 13,941 20.7 Selling, general and administrative expenses 1,162 1,646 484 29.4 6,149 10,867 4,718 43.4 Operating loss (9,617) (51,765) 42,148 81.4 (91,516) (100,094) 8,578 8.6 Interest (expense) income, net (77) 101 (178) (176.2) 75 212 (137) (64.6)Other income (expense), net 4 (23) 27 117.4 (12) (98) 86 87.8 Benefit for income taxes 588 21,258 (20,670) (97.2) 22,997 33,889 (10,892) (32.1)Noncontrolling interest 1,280 (207) 1,487 NM (877) (2,351) 1,474 62.7 Net loss(1) (7,822) (30,636) 22,814 74.5 (69,333) (68,442) (891) (1.3)
Reconciliation of net loss to EBITDA excluding non-cash itemsand cash used in operating activities to Free Cash Flow:Net loss(1) (7,822) (30,636) (69,333) (68,442)Interest expense (income), net 77 (101) (75) (212)Benefit for income taxes (588) (21,258) (22,997) (33,889)Base management to be settled/settled in LLC interests 8,455 6,299 31,979 21,898 Performance fees settled in LLC interests - 43,820 53,388 67,329 Other non-cash (income) expense (1,092) 357 1,605 2,949 EBITDA excluding non-cash items (970) (1,519) 549 36.1 (5,433) (10,367) 4,934 47.6
EBITDA excluding non-cash items (970) (1,519) (5,433) (10,367)Interest (expense) income, net (77) 101 75 212 Benefit for income taxes, net of changes in deferred taxes 2,974 (6,865) 10,635 (2,352)Changes in working capital (2,915) 5,974 (10,583) 1,347 Cash used in operating activities (988) (2,309) (5,306) (11,160)Changes in working capital 2,915 (5,974) 10,583 (1,347)
Free cash flow 1,927 (8,283) 10,210 123.3 5,277 (12,507) 17,784 142.2 _____________________NM - Not meaningful(1) Corporate allocation expense, intercompany fees and the tax effect have been excluded from the above table as they are eliminated on consolidation.
2013 2012 2013 2012 $ $ $ % $ $ $ %
Quarter Ended December 31, Change
Favorable/(Unfavorable)
Year Ended December 31, Change
Favorable/(Unfavorable)
($ In Thousands) (Unaudited)