this file has been cleaned of potential threats. if you...
TRANSCRIPT
This file has been cleaned of potential threats.
If you confirm that the file is coming from a trusted source, you can send the following SHA-256
hash value to your admin for the original file.
98aba086a41c5a4d31745f71f1eefee54d701bac53755b1170fb516302035011
To view the reconstructed contents, please SCROLL DOWN to next page.
USER’S MANUAL
Virtual Lab for Basic Electronics,
Indian Institute of Technology, Kharagpur
April, 2011

Revision Sheet Release No. Date Revision Description
Rev.1 08/04/2011 Second Version

1.0 GENERAL INFORMATION 1.1 System Overview
Basic Electronics Virtual Laboratory is a MHRD initiative driven from Indian Institute of Technology, Kharagpur. The objective of this tool is to perform experiments in a Basic Electronics laboratory virtually. The tool is developed using Adobe AIR Technology. 1.2 Authorized Use Permission
This software and documentation contain confidential and proprietary information that is the property of MHRD. The software and documentation are furnished under a license agreement and may be used or copied only in accordance with the terms of the license agreement. No part of the software and documentation may be reproduced, transmitted, or translated, in any form or by any means, electronic, mechanical, manual, optical, or otherwise, without prior written permission of MHRD or as expressly provided by the license agreement. 1.3 Points of Contact 1.3.1 Help Desk For any assistance, please email your queries to [email protected]

2.0 SYSTEM SUMMARY
Virtual Laboratory for Basic Electronics is an AIR based desktop application. The objective of this tool is to perform experiments in a Basic Electronics laboratory virtually. The virtualization of the experiments is being done through accurate spice based simulation. The basic components of this tool are – Virtual Lab Platform Virtual Lab Management System Basic Electronics Lab Virtual Lab Collaboration System
The subsequent sections each one of these would be discussed in
detail. This tool will be focused on the learning aspects as much as on performing the basic electronics experiments in a virtual setting. This tool is aimed at fresh students who do not have an experience with basic electronics lab. It requires a solution which should not only be easy to use and easy to understand but should also meet all instructional objectives fully.
Fig 2.0.1 List of Experiments

2.1 System Configuration
The application is currently available on Windows XP/Windows 7/Windows Vista. The application requires these executables to be pre-installed:
1. Adobe AIR Runtime, version 2.5. It can be downloaded from here 2. Adobe Flash Player, version 10.0. It can be downloaded from here
2.2 Data Flows
The application is purely desktop based and runs simulation and stores result and other db operations natively. 2.3 User Access Levels
Currently, the Application is available for Students to conduct experiments and save steps as history 2.4 Installation
User need to follow this procedure to run the Application: 1) Install the Adobe Flash Player. 2) Install the Adobe AIR Runtime. 3) Install the vLab Application.

3.0 GETTING STARTED
Once the Application is installed, on clicking the vLab (Installed Application Icon) on desktop, the application starts with a Login Screen. User needs to add his/her information Login and Password to get access to the System. In case of an invalid Login/Password, a valid error is thrown.
Fig 3.0.1 Login Screen 3.1 Logging On
Once the user successfully logins, he can view the various options available for him to work on Virtual Labs.

Fig 3.1.1 Logged-in state
Figure 3.1.2 Various Menu Options
3.2 Exit System
User needs to click the Start. Click Logout to exit from the Application. On Logout, the Login screen appears.

Figure 3.2.1 Logout Option
4.0 DOING THE EXPERIMENT
These sections briefly talk about how a user can do an experiment. 4.1 Using the components
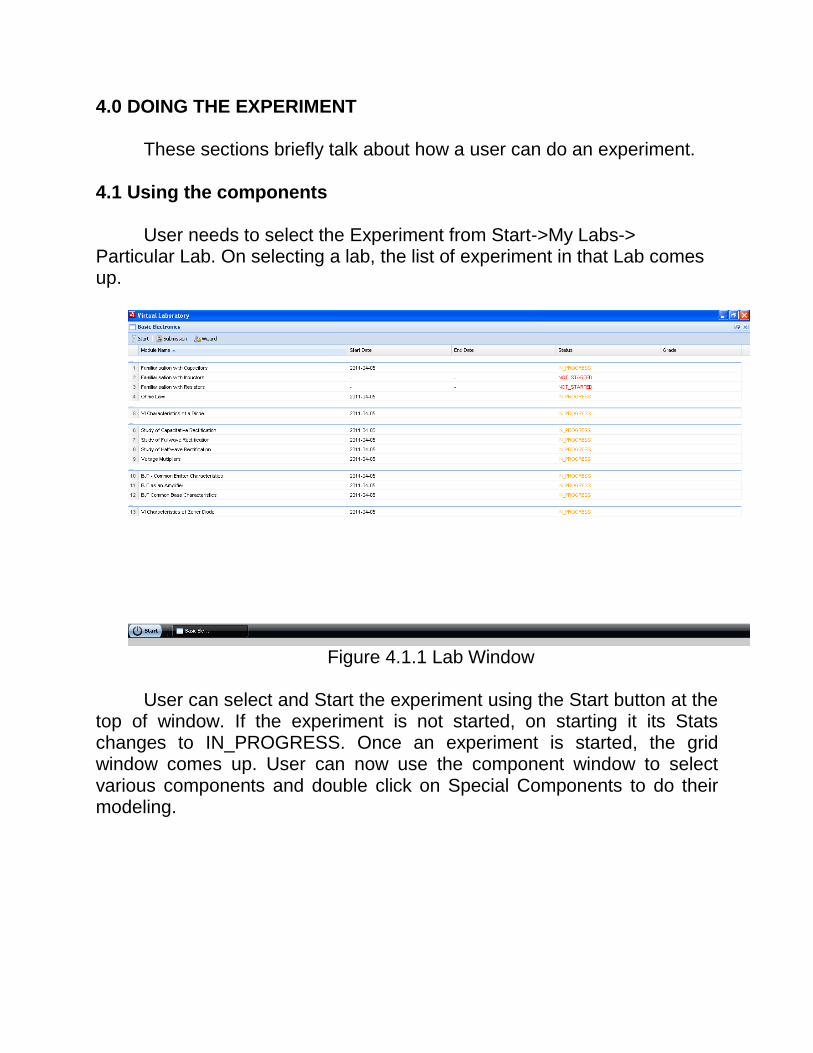
User needs to select the Experiment from Start->My Labs->
Particular Lab. On selecting a lab, the list of experiment in that Lab comes up.
Figure 4.1.1 Lab Window
User can select and Start the experiment using the Start button at the
top of window. If the experiment is not started, on starting it its Stats changes to IN_PROGRESS. Once an experiment is started, the grid window comes up. User can now use the component window to select various components and double click on Special Components to do their modeling.
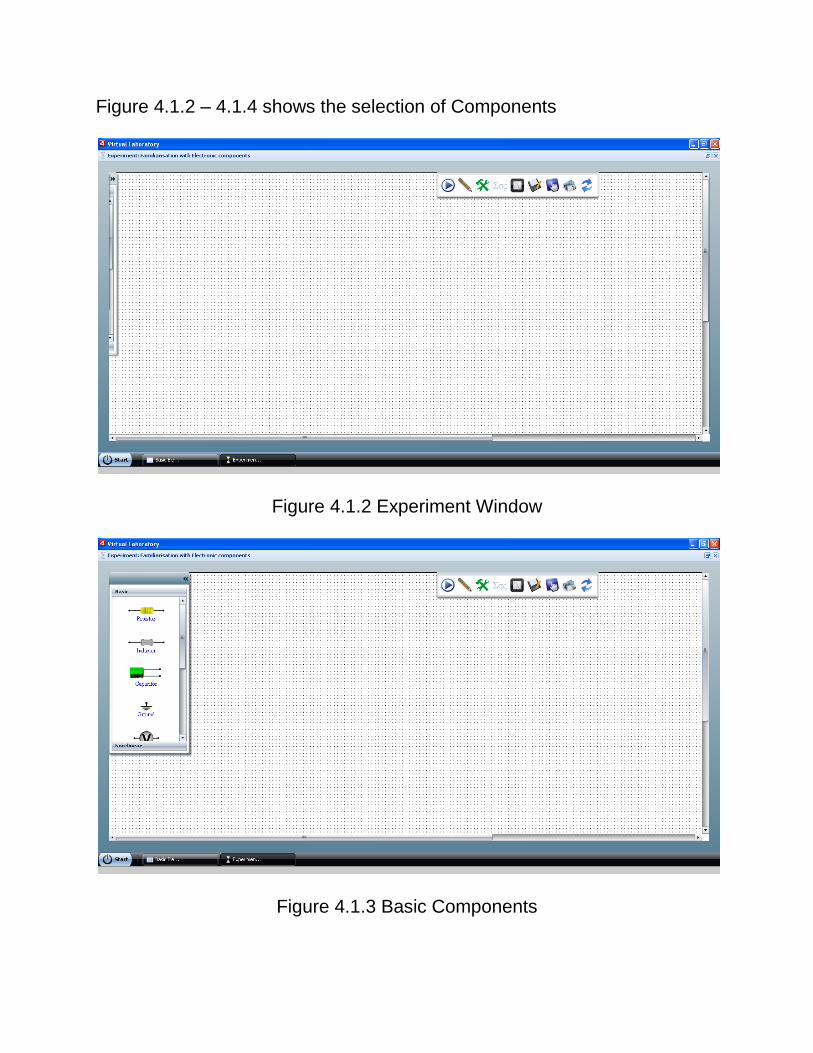
Figure 4.1.2 – 4.1.4 shows the selection of Components
Figure 4.1.2 Experiment Window
Figure 4.1.3 Basic Components

Figure 4.1.4 Nonlinear Components
4.1.1 Configuring component Properties
Each component has a set of configurable properties, which changed to obtain the desired results. Most of the components are modeled in a generic manner, and their properties can be changed in the properties panel. The properties panel can be opened by simply “right clicking” on the instance, and selecting the “Edit Properties” from the menu.

The panel shows the description for each of the properties and the corresponding units wherever applicable. The user may change the Value or the Unit (using the dropdown). The user can also reset the values to the default with the “Set Default Values” button.
Much attention has been paid to resistors, as they are the most commonly used components. Resistors come in different series, like E6, E12, E24, E48 etc. Each of these series has a different tolerance and should be carefully used depending on the need. The user may select the series and the corresponding value from the resistor properties panel.
4.2 Virtual Instruments
Instruments DC Source, Oscilloscope, Function Generator have been modeled virtually and have same look and feel as real devices. User can access these and configure them by double clicking on the instrument icon on the Bread Board.
Figure 4.2.1 DC Source

Figure 4.2.2 Oscilloscope
Figure 4.2.3 Function Generator

4.3 Wizard Each experiment is provided with a Learning Wizard. The wizard
guides the learning of concepts for the Experiment.
Figure 4.3.1 Wizard
4.4 Equations Panel Provision has been provided for the user to add mathematical
equations. Any equations added will be processed at the time of the simulation and the output can be viewed after simulation in the data analyzer.
The equations panel can be opened by selecting the “Equations”
button from the tool bar at the top. As the name suggests, equation has an LHS and a RHS. The LHS is the name that the user wants to store for this equation (for example, when measuring gain, the user may choose the LHS as gain). The right hand cannot be edited by keyboard, but the buttons available in the panel can be used to fill the same. Once having entered the equations, the user can save it by pressing the tick button. Consequently equation gets displayed in the “User Equations” panel.

Figure 4.4.1 Equation Panel The user can add the following type of equations:
1. Simple numerical functions 2. Trigonometric functions 3. Complex mathematical functions 4. Device based functions
Various examples have been provided in the “Sample Equations” panel to assist the user in writing equations. The first three are quite simple; however the 4th
needs a little more explanation. Using devices based functions.
When the user adds any measurement devices to the circuit (for example: Ammeter, Voltmeter, Oscilloscope etc.), then it automatically adds the corresponding variables in the equations panel. For example adding the Voltmeter instance VMeter0, will add the corresponding variable in this panel. Similarly adding an oscilloscope provides two variables, one for each channel of the oscilloscope, i.e. if you add an oscilloscope instance “Osc0”, then the corresponding variables would be “OSC0_CH1” and “OSC0_CH2” respectively.

Figure 4.4.2 – 4.4.3 shows the circuit and corresponding variables in equations panel.
Once an equation is saved, a corresponding variable for that is also created, which can be used in further equations.

4.5 Simulation 4.5.1 Simulation Properties
The simulation panel provides the means the control the simulation parameter, and type of analysis that the user wants to do. Currently, the user can do the following analyses:
• Time Domain Analysis • Frequency Domain Analysis • Advanced Analysis
Each of the above can be selected from the combo-box provided at
the top of the Simulation Panel. Depending upon the type of simulation selected by user, certain parameters will be provided, that the user can modify to control simulation properties.
In addition to the basic simulation properties, the user can also
perform “Sweep Analysis” for any type of simulation. To do this, the user should select the “Sweep Analysis” checkbox provided at the bottom. This displays a list of all the components, whose parameters can be selected to vary.

A single parameter sweep can be performed for Time Domain
Analysis and Frequency Domain analysis. However, if the user wants to perform an even more advanced parametric analysis, that can be done using Advanced Analysis, wherein two parameters can be varied by selecting the “Sweep Analysis 1” and “Sweep Analysis 2” checkboxes.
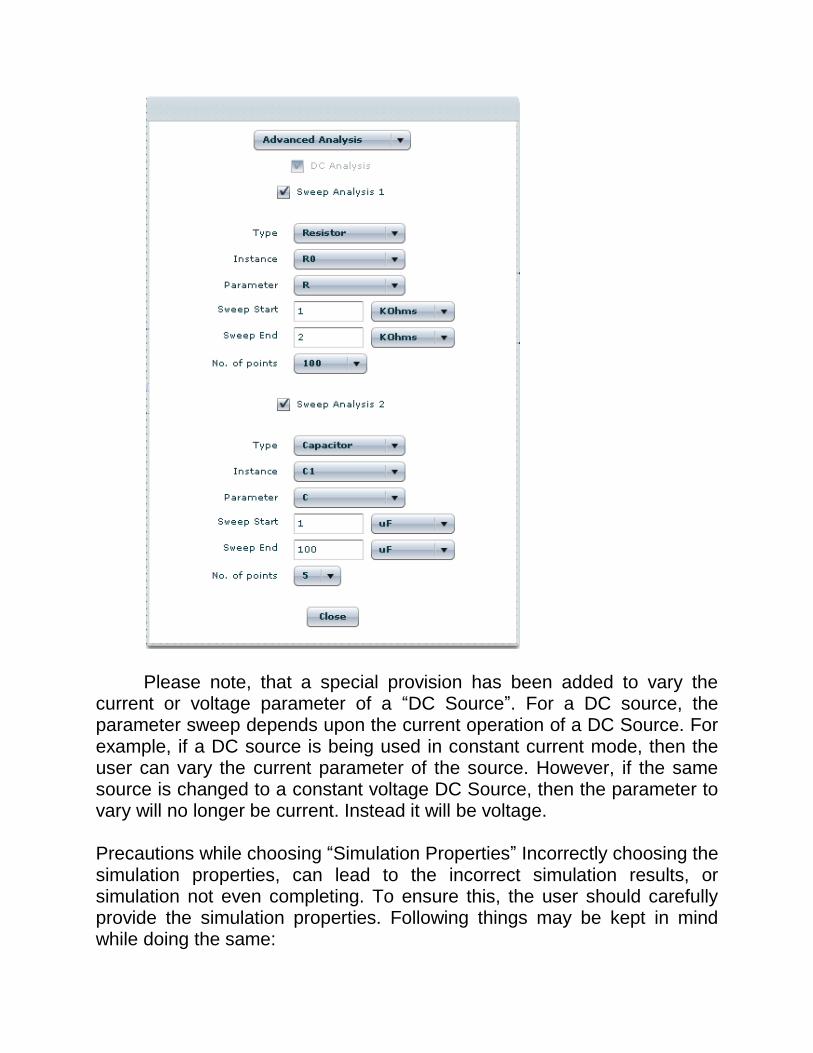
Please note, that a special provision has been added to vary the
current or voltage parameter of a “DC Source”. For a DC source, the parameter sweep depends upon the current operation of a DC Source. For example, if a DC source is being used in constant current mode, then the user can vary the current parameter of the source. However, if the same source is changed to a constant voltage DC Source, then the parameter to vary will no longer be current. Instead it will be voltage.
Precautions while choosing “Simulation Properties” Incorrectly choosing the simulation properties, can lead to the incorrect simulation results, or simulation not even completing. To ensure this, the user should carefully provide the simulation properties. Following things may be kept in mind while doing the same:

The sample size of the simulation may not be too high, as it leads to huge amount of data crunching. This would lead to long simulation times, and may even slow down the system.
Proper values should be chosen for simulation, for example, in case of “Frequency Domain Analysis” the “step increment size” should never be zero, as it would lead to an incorrect frequency sweep. Similarly choosing the value too less would lead to a huge number of frequency sweep points, which may lead to a very long simulation time.
In “Advanced Analysis” while doing dual “Sweep Analysis”, two sweeps should not be done for the same component. For example, the following is an incorrect behavior.

4.6 Saving the Schematic
User at any stage can save the schematic for a particular experiment. Later once he starts that experiment, the same schematic is restored. Figure 4.6.1 – 4.6.2 shows how to save a schematic
Figure 4.6.1 Save Schematic button
Figure 4.6.2 Schematic Saved
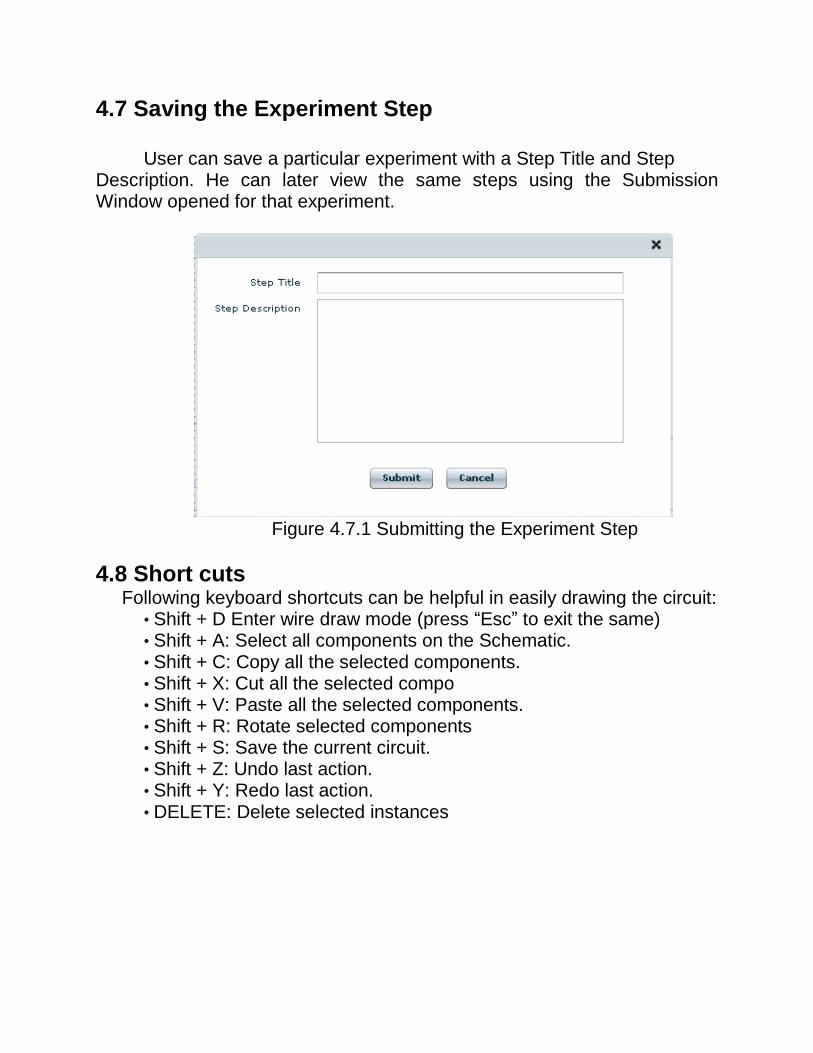
4.7 Saving the Experiment Step
User can save a particular experiment with a Step Title and Step Description. He can later view the same steps using the Submission Window opened for that experiment.
Figure 4.7.1 Submitting the Experiment Step
4.8 Short cuts Following keyboard shortcuts can be helpful in easily drawing the circuit:
• Shift + D Enter wire draw mode (press “Esc” to exit the same) • Shift + A: Select all components on the Schematic. • Shift + C: Copy all the selected components. • Shift + X: Cut all the selected compo • Shift + V: Paste all the selected components. • Shift + R: Rotate selected components • Shift + S: Save the current circuit. • Shift + Z: Undo last action. • Shift + Y: Redo last action. • DELETE: Delete selected instances

4.9 Troubleshooting
A lot of attention has been paid to warn the user of any errors that may happen during circuit creation. Some of the things are:
• Sanity checks for ground • Sanity checks for sources • Sanity checks for measurement devices • Sanity checks for any open connections etc. Even though a lot of sanity checking has been built into the tool, there
may be times when things may not work as expected. The user may follow the following checklist that all the things are in the correct order:
Component properties Please check weather permissible values for the components have
been entered. For example, entering negative values for “diode junction potential” is not allowed and may result in incorrect simulation
Simulation Properties Following things may be kept in mind while doing the same: The sample size of the simulation may not be too high, as it
leads to huge amount of data crunching Proper values should be chosen for simulation, for example, in
case of “Frequency Domain Analysis” the “step increment size” should never be zero, as it would lead to an incorrect frequency sweep.
Similarly choosing the value too less would lead to a huge number of frequency sweep points, which may lead to a very long simulation time.
In “Advanced Analysis” while doing dual “Sweep Analysis”, two sweeps should not be done for the same component. For example, the following is an incorrect behavior.
Equations Panel
Adding any illegal equations may lead to a failure in simulation. Attention should also be paid to the equation variables being used in other equations. For example, if the user added “equation1” and used it in “equation2”, and then removed “equation1”, then it would lead to a

problem, as the variable “equation1” is still being used in “equation2”, but the definition for the same is missing.
Saving/Restoring
If the circuit fails to simulate after restoring it from a saved state, then the user may want to double check weather all the circuit values and that of simulation properties have been restored properly.
5.0 VIEWING THE STEP SUBMISSION This section talks about how to view the steps submit for an experiment.
5.1 Step View User can open the Lab Window for a particular experiment using Start- >My Labs -> Particular Lab. Once you have a Lab Window there, user can select an experiment and view all the Steps Submitted for that experiment using the Submission Button at the Top of Lab Window.
Figure 5.1.1 Submission Window