tilburg university bank competition and stability beck, t
TRANSCRIPT

Tilburg University
Bank Competition and Stability
Beck, T.H.L.; De Jonghe, O.G.; Schepens, G.
Publication date:2012
Link to publication in Tilburg University Research Portal
Citation for published version (APA):Beck, T. H. L., De Jonghe, O. G., & Schepens, G. (2012). Bank Competition and Stability: Cross-countryHeterogeneity (Revised version of EBC DP 2011-019). (EBC Discussion Paper; Vol. 2012-026). EBC.
General rightsCopyright and moral rights for the publications made accessible in the public portal are retained by the authors and/or other copyright ownersand it is a condition of accessing publications that users recognise and abide by the legal requirements associated with these rights.
• Users may download and print one copy of any publication from the public portal for the purpose of private study or research. • You may not further distribute the material or use it for any profit-making activity or commercial gain • You may freely distribute the URL identifying the publication in the public portal
Take down policyIf you believe that this document breaches copyright please contact us providing details, and we will remove access to the work immediatelyand investigate your claim.
Download date: 14. Oct. 2021

BANK COMPETITION AND STABILITY: CROSS-COUNTRY HETEROGENEITY
By Thorsten Beck, Olivier De Jonghe, Glenn Schepens
October, 2012
European Banking Center Discussion Paper
No. 2012-026
This is also a CentER Discussion Paper No. 2012-085
This is a revised version of: European Banking Center Discussion Paper
No. 2011-019
CentER Discussion Paper No. 2011-080
July 2011
ISSN 0924-7815

Bank competition and stability: Cross-country heterogeneity�
Thorsten Becky Olivier De Jonghez Glenn Schepensx
Abstract
This paper documents large cross-country variation in the relationship between bank competition and
bank stability and explores market, regulatory and institutional features that can explain this variation. We
show that an increase in competition will have a larger impact on banks’ fragility in countries with stricter
activity restrictions, lower systemic fragility, better developed stock exchanges, more generous deposit in-
surance and more effective systems of credit information sharing. The effects are economically large and
thus have important repercussions for the current regulatory reform debate.
Keywords: Competition, Stability, Banking, Herding, Deposit Insurance, Information Sharing, Risk
Shifting
JEL Classifications: G21, G28, L51
�The authors would like to thank Charles Calomiris, Fabio Castiglionesi, Hans Degryse, Jakob de Haan, Claudia Girardone, Iftekhar
Hasan, Simon Kwan, Klaus Schaeck, two anonymous reviewers, the editor (Phil Strahan) and seminar participants at ASSA meeting
(Chicago), HEC Paris, Ghent University, Tilburg University, Cass Business School, Roma II Tor Vergata, Université Libre de Bruxelles,
Bangor Business School, the Bank of England, Carefin-Bocconi (Milan) and the FIRS conference (Sydney) for interesting discussions
and helpful comments. Thorsten Beck acknowledges support from the European Commission under Marie Curie Grant, IRG 239469.
Glenn Schepens acknowledges support from the Fund for Scientific Research (Flanders) under FWO project G.0028.08N.yCentER, European Banking Center, Tilburg University and CEPR. [email protected], European Banking Center, Tilburg University. [email protected] of Financial Economics, Ghent University. [email protected]
1

1 Introduction
The impact of bank competition on financial stability remains a widely debated and controversial issue, both
among policymakers and academics.1 The belief that fiercer competition among banks would lead to a more
effective banking system initiated a deregulating spiral in the late1970s and early1980s. While the deregula-
tion of branching and activity restrictions may have resulted in more intense competition among banks, with
positive repercussions for financial depth (Rice and Strahan (2010), Dick and Lehnert (2010)), income distri-
bution (Beck, Levine, and Levkov (2010)), growth (Cetorelli and Gambera (2001)) and efficiency (Bertrand,
Schoar, and Thesmar (2007)), it may as well have had the unintended consequence of increasing banking sector
instability (see e.g., Keeley (1990) and Jayaratne and Strahan (1998)). Similarly, the international process of
banking liberalization has gone hand in hand with an increased occurrence of systemic banking crises in the
last two decades of the20th century2, culminating in the global financial crisis of 2007-2009. However, there is
no academic consensus on whether bank competition leads to more or less stability in the banking system.
A similarly inconclusive debate has been led on the effect of the regulatory framework on banks’ risk-taking
incentives and ultimately bank stability. On the one hand, capital requirements and restrictions on interest rates
and banks’ activities are seen as fostering stability (Hellmann, Murdock, and Stiglitz (2000)); on the other
hand, they might lead to rent-seeking and might prevent banks from reaping necessary diversification and scale
benefits. The role of deposit insurance schemes has been especially controversial. While often introduced
to protect small depositors’ lifetime savings and to prevent bank runs, they also provide perverse incentives
to banks to take aggressive and excessive risks. These perverse incentives are held less in check in weak
supervisory frameworks (Demirguc-Kunt and Detragiache (2002)).
This paper combines the two literatures and provides empirical evidence that the relationship between
1See Group of Ten (2001), Bank for International Settlements (2001), International Monetary Fund (2001) and Beck
(2008) as well as Vives (2001) and Carletti and Vives (2009). For a recent on-line debate on this topic, see
http://www.economist.com/debate/overview/205.
2For a detailed overview of the timing of systemic banking crises and the timing of deregulation, we refer to Laeven and Valencia
(2010) and Abiad, Detragiache, and Tressel (2008), respectively.
2

competition and stability varies across markets with different regulatory frameworks, market structures and
levels of institutional development. While we show, on average, a positive relationship between banks’ market
power, as measured by the Lerner index, and banks’ stability, as measured by the Z-score (a gauge of banks’
distance to insolvency), we find large cross-country variation in this relationship. Our results suggest that an
increase in competition is associated with a larger rise in banks’ fragility in countries with stricter activity
restrictions, lower systemic fragility, better developed stock exchanges, more generous deposit insurance and
more effective systems of credit information sharing.
Exploring the variation in the competition-stability relationship is important for academics and policy mak-
ers alike. The academic debate on the effect of competition on bank stability has been inconclusive to date
and by exploring factors that can explain cross-country variation in the relationship, this paper contributes to
the resolution of the puzzle. Policy makers have been concerned about the effect of deregulation and the con-
sequent impact of competition on bank stability but have also discussed different elements of the regulatory
framework that have both an impact on competition and directly on stability, including deposit insurance, capi-
tal regulation and activity restrictions. After the recent crisis, there are reform suggestions focusing on activity
restrictions, capital standards, deposit insurance and the institutional structure of supervision. This paper shows
a critical role for the regulatory framework in explaining the variation across countries and over time in the
relationship between competition and stability and has therefore important policy repercussions.3 For example,
we conduct a simulation that mimics a post-crisis scenario with more generous deposit insurance schemes and
stronger restrictions on bank activities and, hence, more herding.4 The relationship between market power and
soundness is almost twice as large compared to the average country in the absence of such a change, suggesting
a very negative impact of competition on stability in this scenario. In the base scenario, a one standard devia-
3If such a country-specifc factor affects both competition and banking sector stability, then a spurious relationship between com-
petition and stability may be the outcome. Therefore, by including country-year fixed effects, we only exploit the within country-year
variation in bank market power and bank soundness. More detailed information is in the Methodology section.4This simulation scenario, which reflects recent regulatory reforms or reform suggestions, is based on the results reported in Table
6.
3

tion reduction in market power leads to a drop in the Z-score5 of 17%. In our fictitious post-crisis scenario6, a
similar loss in market power leads to a37% reduction in the average Z-score. This economically large effect of
regulatory reform comes in addition to any direct effect (positive or negative) that such reforms might have on
banks’ stability. It also widens the trade-off between positive effects of competition on efficiency, on the one
hand, and negative effects of competition on stability, on the other hand.
Our paper builds on a rich theoretical and empirical literature exploring the relationship between compe-
tition and stability in the banking system.7 On the one hand, the competition-fragility view posits that more
competition among banks leads to more fragility. This “charter value” view of banking, as theoretically mod-
eled by Marcus (1984) and Keeley (1990), sees banks as choosing the risk of their asset portfolio. Bank owners,
however, have incentives to shift risks to depositors, as in a world of limited liability they only participate in
the up-side part of this risk taking. In a more competitive environment with more pressure on profits, banks
have higher incentives to take more excessive risks, resulting in higher fragility. On the other hand, in systems
with restricted entry and therefore limited competition, banks have better profit opportunities, capital cushions
and therefore fewer incentives to take aggressive risks, with positive repercussions for financial stability. In
addition, in a more competitive environment, banks earn fewer informational rents from their relationship with
borrowers, reducing their incentives to properly screen borrowers, again increasing the risk of fragility (Boot
and Thakor (1993), Allen and Gale (2000), Allen and Gale (2004)). The competition-stability hypothesis, on
the other hand, argues that more competitive banking systems result in more, rather than less, stability. Specif-
ically, Boyd and De Nicolo (2005) show that lower lending rates reduce the entrepreneurs’ cost of borrowing
and increase the success rate of entrepreneurs’ investments. As a consequence, banks will face lower credit risk
on their loan portfolio in more competitive markets, which should lead to increased banking sector stability.
5The Z-score can be interpreted as the number of standard deviations by which returns would have to fall from the mean to wipe out
all equity in the bank. See section 3.2.2 for more information on the Z-score.6The results of this fictitious post-crisis scenario are similar whether or not we include the period 2007-2009 in the estimation. In
a robustness check, we show that neither the 2007-09 crisis in particular or other systemic banking crisis in general affect our main
findings.7For an excellent overview of the existing (pre-2008) models and empirical evidence on the relationship between competition and
stability, see Carletti (2008) and Degryse and Ongena (2008).
4

However, more recent extensions of the Boyd and De Nicolo (2005) model that allow for imperfect correlation
in loan defaults (Martinez-Miera and Repullo (2010); Hakenes and Schnabel (2011)) show that the relationship
between competition and risk is U-shaped. Hence, the impact of an increase in competition can go either way,
depending on other factors and the existing intensity of competition.8
Numerous authors have used different samples, risk measures and competition proxies to discriminate be-
tween the competition-fragility and competition-stability view.9 Empirical studies for specific countries – most
for the U.S. – have not come to conclusive evidence for either a stability-enhancing or a stability-undermining
role of competition. The cross-country literature has found that more concentrated banking systems are less
likely to suffer a systemic banking crisis as are more competitive banking systems (Beck, Demirguc-Kunt, and
Levine (2006); Schaeck, Cihak, and Wolfe (2009)). There is also evidence that banks in more competitive
banking systems hold more capital, thus compensating for potentially higher risks they are taking (Schaeck and
Cihak (2011), Berger, Klapper, and Turk Ariss (2009)).
Unlike previous papers we do not test the validity of one of the two hypotheses on the relationship between
competition and stability, but rather their relative importance and strength as function of the market, regulatory
and institutional framework in which banks operate. Specifically, building on existing literature, we argue that
country-specific features may affect the existing empirical evidence on the relationship between competition
and stability via three possible channels. First, a certain type of regulation may limit the extent to which banks
can or will engage in riskier activities if their franchise values are eroded. This would thus influence the
8Wagner (2010) extends the Boyd and De Nicolo (2005) model and allows for risk choices made by borrowers as well as banks. If
lending rates decline due to more competition, banks have less to lose in case a borrower defaults. Hence, a bank may find it optimal to
switch to financing riskier projects, which overturns the Boyd and De Nicolo (2005) results. Other authors have also shown that more
intense competition may induce banks to (i) switch to more risky, opaque borrowers (Dell’Ariccia and Marquez (2004)), and (ii) acquire
less information on borrowers (Hauswald and Marquez (2006)). Dick and Lehnert (2010) provide empirical evidence of a margin as
well as a risk effect. Exploiting exogenous variation in market contestability, they find that deregulation explains at least 10% of the
rise in bankruptcy rates. However, they also find that credit risk, measured as the loss rate on loans, decreases following deregulation.
Thus, while banks made more bad loans, which explains the increase in bankruptcies, the default risk among all borrowers fell. This
suggests that banks increased credit to both existing low risk customers as well as new, riskier ones, because of banks’ enhanced ability
to discriminate between different levels of risk.9For an overview, see Beck (2008).
5

strength of the competition-fragility relationship. Second, country-specific characteristics may also affect the
adverse selection problem that banks face if they charge higher loan interest rates. This would thus influence the
strength of the competition-stability relationship. Third, institutional characteristics may affect the proportion
of systematic and idiosyncratic risk in loan defaults and may make it hence more likely that the data favor one
theory over the other. The relative importance of each of these three channels may explain why different studies
obtain different results in terms of magnitude or even sign. That is, certain country-specific features may make
the assumptions and predictions of a given theoretical model more realistic. Building on existing theories, we
will relate different country characteristics to the overall impact of market power on stability in section 3.3.
While this paper builds on the cross-country literature on the competition-stability relationship, it is the
first - to the best of our knowledge - to explore the heterogeneity of this link across countries and over time
and thus connects directly to the current debate on regulatory reforms. It is important to note some limitations
of our analysis, however. First, we focus on a specific measure of bank competition, the Lerner index. Since
we want to exploit cross-country heterogeneity of the competition-stability relationship, we cannot use indi-
cators of competition at the country level, such as the H-statistic. Nevertheless, we show that in our sample,
the country-averaged Lerner index is meaningfully and statistically related to other competition and market
structure measures. Second, and for the same reason, we focus on a bank-level indicator of stability rather than
indicators of systemic distress. It is important to stress, therefore, that we do not want to settle the competition-
stability debate, but rather show the importance of cross-country heterogeneity and the need to take into account
regulatory and other policies when assessing the effect of competition on stability. Nevertheless, we conduct
numerous robustness tests regarding the choice of the market power and bank soundness measure and refer
to these results throughout the paper. Third, this paper does not investigate the direct impact of regulation on
competition or risk, questions that have been the topic of previous research. Rather, we focus on the impact
of regulation on the competition-stability trade-off. The former effects are controlled for by including time-
varying country fixed effects, which imply that we only exploit the within-country year information in market
power and stability. Finally, in this study, we focus on the estimated net effect of bank market power on sta-
bility, which is the combination of the three underlying relationships discussed above. We show that certain
6

country-specific features lead to a different estimated impact of market power on stability. Analyzing whether
this change is due to either of these three effects requires an alternative setup in which an (unexpected) change
in regulation is used as a natural experiment.
2 Methodology
In the literature, there are two main approaches to assessing the relationship between competition and stability:
a cross-country or single country setup. In a cross-country setup, one provides insight into the average relation-
ship between competition and stability for the set of countries under investigation (e.g.: developing countries
as in Turk Ariss (2010), developed countries as in Berger, Klapper, and Turk Ariss (2009), the European Union
as in Schaeck and Cihak (2010)), while controlling for other country-specific factors such as macro-economic
conditions, regulation and supervision. However, single country studies (such as Keeley (1990), Salas and Sau-
rina (2003), Jimenez, Lopez, and Saurina (2010), Boyd, De Nicolo, and Jalal (2006)) document a large degree
of variation in the competition-stability relationship. We therefore use the following setup:
Riski;j;t = c+ �j;t � Competitioni;j;t�1 + �Xi;j;t�1 + �j;t + "i;j;t (1)
In this setup, the indicesi; j ; t stand respectively for bank, country and time. The relationship between
competition and risk,�j;t, is allowed to vary across countries and over time. The vector of bank-specific
variables,Xi;j;t�1, characterizes a bank’s business model. In particular, we include proxies for the funding
structure (share of wholesale funding in total funding), asset (loans to assets ratio) and revenue mix (share of
non-interest income in total income) as well as bank size (natural logarithm of total assets), credit risk (loan loss
provisions to interest income) and asset growth. In addition, we include specialization dummies to allow for
different intercepts for commercial banks, saving banks and cooperatives. Summary statistics on these variables
are reported in Table 1.10 Furthermore, time-varying country-fixed effects are also included,�j;t (i.e., a dummy
10These variables are often used in similar studies. See e.g.: Demirguc-Kunt and Huizinga (2010); Laeven and Levine (2009) or
Berger, Klapper, and Turk Ariss (2009). Banks in our sample are on average smaller, have less wholesale funding and a lower share of
non-interest revenue compared to, for example, Demirguc-Kunt and Huizinga (2010). This is due to differences in sample composition.
We include all banks, whereas they focus on listed banks only. If we exclude the smaller banks up to the point that the average bank size
7

variable for each country-year pair).
As hypothesized in the introduction,�j;t is modelled as a function of country-specific factors. To gain
insight in the potential drivers of heterogeneity in�, we run the following regression:
Riski;j;t = c+ (�0 + �1Zj;t) � Competitioni;j;t�1 + Xi;j;t�1 + �j;t + "i;j;t (2)
whereZj;t is either just one of the country-specific characteristics or a vector containing all of them. We
are interested in the�1 coefficients that directly gauge the impact of different country characteristics on the
competition-stability relationship. We also include country-time fixed effects,�j;t. Many other papers have
documented that regulation, supervision and the business cycle may have an impact on competition and market
structure, as well as banking system stability. This could create a spurious correlation between market power
and stability driven by a third country-specific variable. We reduce this possibility by only exploiting the within
country-year variation.11 In addition, the country-year fixed effects also absorb the impact of global factors
affecting the relationship. Furthermore, we also cluster the error terms on the country-year level.
3 Data
3.1 Data sources
To gauge the relationship between bank competition and stability, we combine data from several sources. We
obtain information on banks’ balance sheets and income statements from Bankscope, which is a database
is similar in both samples, we obtain a similar average share of wholesale funding and non-interest revenue. The loans to total assets
ratio is similar to, for instance, Berger, Klapper, and Turk Ariss (2009), who report 0.61 and 0.57 respectively. The loan loss provisions
to net interest revenues is also used by Laeven and Levine (2009). Their sample is restricted to one year (2001) and covers the ten
largest banks in 48 countries. They report an average of 0.23. In our sample, the average is lower (0.15).This need not be surprising as
many countries were in a recession in 2001. When we try to mimic their sample (only using data from 2001 and focus on large banks
(ln(TA)>10), which leaves us approximately the same number of observations as their sample), we obtain a ratio of 0.20, which is in
line with the number they report.11In mathematical terms, an (un)observed country-specific variableZj;t may affect the average level of risk and competi-
tion in a country in a given year (Riskj;t and Competitionj;t). This may create a spurious relationship betweenRiski;j;t
and Competitioni;j;t. This paper’s setup examines the relationship between (Riski;j;t � Riskj;t) and (Competitioni;j;t �
Competitionj;t) and how this relationship varies because ofZj;t.
8

compiled by Fitch/Bureau Van Dijk that contains information on banks around the globe, based on publicly
available data sources. We have data available for the period of1994 � 2009. If banks report information
at the consolidated level, we delete the unconsolidated entries of the group from the sample to avoid double
counting. We apply a number of selection criteria to arrive at our sample. First, we exclude countries for which
we have information on fewer than50 bank-year observations. Second, we limit our analysis to commercial,
saving and cooperative banks, which represent, respectively,53:4%, 28:2% and18:4% of the sample. Third,
we delete banks that report information for fewer than three consecutive years, as our risk measure is computed
over rolling windows of three years.12 Fourth, we drop bank-year observations that do not have data available
on basic variables. This yields a sample of17; 055 banks. Subsequently, we winsorize all variables at the1
percent level to mitigate the impact of outliers. While most of the bank-specific variables are ratios, variables
in levels (such as size) are expressed in 2007 US dollars.
The bank-specific data are linked to various country-level databases that contain information on the regu-
latory framework, strength of supervision and other institutional features. More specifically, we employ data
from the three waves (1997, 2001 and 2005) of the Bank Regulation and Supervision database13 compiled by
the World Bank (Barth, Caprio, and Levine (2008)). Additional information is obtained from the World Devel-
opment Indicators and the Doing Business database. A detailed list of the country-level variables used and the
database from which they are collected can be found in Appendix A. Filtering the bank-specific database and
matching it with the country-level databases yields a sample of banks from79 countries. The sample consists
of a mix of developed and developing countries (see Appendix B).
3.2 Indicators of market power and bank soundness
In order to test for cross-country and cross-time variation in the bank competition-stability relationship, we
need indicators of competition and stability that vary on the bank-level over time, as indicators on the country
12One of the components of the Z-score, the bank soundness measure, is an indicator of profit volatility. As we use accounting
information, we compute volatility of return on assets over a three year (rolling) window. More detailed information on the construction
of the variables follows in the next section.13The four regulatory measures we use are pre-constructed indices. The construction of the indices as well as the underlying survey
questions are described in detail in the book ‘Rethinking Bank Regulation: Till Angels Govern’ by Barth, Caprio, and Levine (2006).
9
level would not allow us to exploit the cross-country heterogeneity in the relationship between the two. We
therefore focus on two standard indicators of banks’ market power and soundness, respectively, which we will
discuss in depth in the following two subsections.
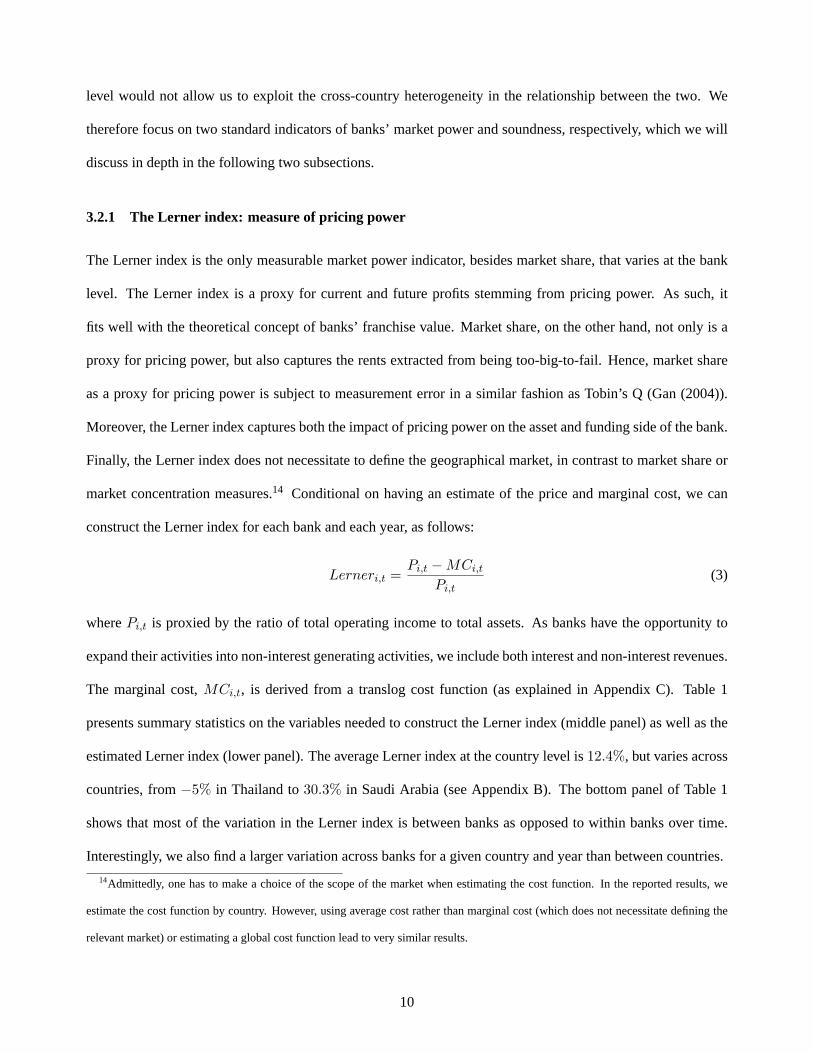
3.2.1 The Lerner index: measure of pricing power
The Lerner index is the only measurable market power indicator, besides market share, that varies at the bank
level. The Lerner index is a proxy for current and future profits stemming from pricing power. As such, it
fits well with the theoretical concept of banks’ franchise value. Market share, on the other hand, not only is a
proxy for pricing power, but also captures the rents extracted from being too-big-to-fail. Hence, market share
as a proxy for pricing power is subject to measurement error in a similar fashion as Tobin’s Q (Gan (2004)).
Moreover, the Lerner index captures both the impact of pricing power on the asset and funding side of the bank.
Finally, the Lerner index does not necessitate to define the geographical market, in contrast to market share or
market concentration measures.14 Conditional on having an estimate of the price and marginal cost, we can
construct the Lerner index for each bank and each year, as follows:
Lerneri;t =Pi;t �MCi;t
Pi;t(3)
wherePi;t is proxied by the ratio of total operating income to total assets. As banks have the opportunity to
expand their activities into non-interest generating activities, we include both interest and non-interest revenues.
The marginal cost,MCi;t, is derived from a translog cost function (as explained in Appendix C). Table 1
presents summary statistics on the variables needed to construct the Lerner index (middle panel) as well as the
estimated Lerner index (lower panel). The average Lerner index at the country level is12:4%, but varies across
countries, from�5% in Thailand to30:3% in Saudi Arabia (see Appendix B). The bottom panel of Table 1
shows that most of the variation in the Lerner index is between banks as opposed to within banks over time.
Interestingly, we also find a larger variation across banks for a given country and year than between countries.
14Admittedly, one has to make a choice of the scope of the market when estimating the cost function. In the reported results, we
estimate the cost function by country. However, using average cost rather than marginal cost (which does not necessitate defining the
relevant market) or estimating a global cost function lead to very similar results.
10

<Insert Table 1 around here>
In many other cross-country studies that examine the bank competition-stability relationship, authors have
relied on country-level measures of market power or market structure. For aforementioned reasons, these
measures can not be used in this setup. However, the results in Table 2 indicate that aggregate Lerner indices
are meaningfully and statistically related with other measures of competition and market structure. Table 2
provides correlations between non-structural measures of market power and concentration, such as the number
of banks, the Hirschmann-Herfindahl index, a CR3 concentration ratio as well as a structural indicator of
competition, the Panzar-Rosse H-statistic (Panzar and Rosse (1987)). All these indicators are measured at
the country-year level. In addition, we also include the country average of the Lerner index and market share.
We define all measures such that an increase in the measure indicates less competition.15
<Insert Table 2 around here>
The Lerner index is positively related to all other indicators and the correlation is significant for all but the
Herfindahl index. In addition, the correlation table shows that all significant correlations are positive (except the
one between the H-statistic and the number of banks). To conclude, the Lerner index is preferred over all other
proxies both from a modelling perspective (variation across banks) as well as from a theoretical perspective
(current and future pricing power constitute a bank’s franchise value, which lies at the core of the theoretical
models). It is reassuring, however, that our preferred competition proxy, the Lerner index, is significantly
related to other competition proxies.
3.2.2 The Z-Score: measure of bank soundness
Bank risk is measured using the natural logarithm of the Z-score (as in e.g. Houston, Lin, Lin, and Ma (2010),
Demirguc-Kunt and Huizinga (2010), Laeven and Levine (2009) and many others). The Z-score measures the
distance from insolvency (Roy (1952)) and is calculated as
Zi;t =ROAi;t + (E=A)i;t
�(ROA)i;t(4)
15More specifically, we take the inverse number of banks and the negative of the Panzar-Rosse H-statistic.
11

whereROA is return on assets,E=A denotes the equity to asset ratio and�(ROA) is the standard deviation of
return on assets. We use a three-year rolling time window, rather than the full sample period, to compute the
standard deviation ofROA to allow for time variation in the denominator of the Z-score. This approach avoids
that the variation in Z-scores within banks over time is exclusively driven by variation in the levels of capital
and profitability (Schaeck and Cihak (2010)). Moreover, given the unbalanced nature of our panel dataset, it
avoids that the denominator is computed over different window lengths for different banks. The Z-score can be
interpreted as the number of standard deviations by which returns would have to fall from the mean to wipe out
all equity in the bank (Boyd and Runkle (1993)). A higher Z-score implies a lower probability of insolvency,
providing a more direct measure of soundness than, for example, simple leverage measures. Because the Z-
score is highly skewed, we use the natural logarithm of Z-score to smooth out higher values.16 Table 1 shows
that the average value of ln(Z-score) slightly exceeds four with a standard deviation of1:32. The average Z-
score ranges from4:97 in Switzerland to2:37 in Uruguay (see Appendix B). The bottom panel of Table 1
shows that - as in the case of the Lerner index - most of the variation is between banks rather than over time
within a given bank. We also find a larger variation across banks within a specific country and year than across
countries.
3.2.3 Lerner index and Z-score: a spurious correlation?
One concern in our empirical analysis is that Lerner index and Z-score both include profitability in the nu-
merator and any positive relationship between the two might thus be mechanical rather than economically
meaningful. As a first approach, we therefore gauge the relationship between the Lerner index and Z-score over
time as well as between Lerner index and the denominator of the Z-score, profit volatility. Figure 1 provides
information on the time series evolution of the Lerner index, the Z-score as well as the denominator of the latter,
i.e. profit volatility. The variables are first averaged by country and then across countries, to give equal weight
to each country. The values of the market power measure (the Lerner index) are measured at the right-hand
16Others have used the transformation ln(1+Z-score) to avoid truncating the dependent variable at zero. We take the natural logarithm
after winsorizing the data at the1% level. As none of the Z-scores is lower than zero after winsorizing, this approach is similar, save
for a rescaling, to the former approach and winsorizing after the transformation.
12

axis, while the values of the Z-score on the left-hand axis.
<Insert Figure 1 around here>
There is a close correspondence between the time series pattern of bank soundness (Z-score) and bank
market power, which documents that competition and fragility are positively correlated over time. The lower
graph, which plots the Lerner index and the volatility of bank profits, confirms this finding. An increase in
market power is associated with a reduction of profit volatility. As both plots yield a similar insight, this
is already a first indication that the empirical relationship between the Lerner index and the Z-score is not
spuriously created by including bank profits in the numerator of the Z-score. Below, we provide further evidence
that our main results are not driven by a spurious relationship between the Z-score and the Lerner index.
3.3 Country-level indicators of herding, regulation and institutional environment
We now discuss how different country-specific factors may create cross-country variation in the competition-
stability relationship and design our hypothesis tests based on existing theories. Table 3 presents descriptive
statistics for the different country-level variables, while Table 4 reports correlations. All variables exhibit
substantial variation, both over time and across countries, as documented by the within-country and between-
countries variation.
<Insert Table 3 around here>
<Insert Table 4 around here>
3.3.1 Institutional and financial development
A first set of country traits that can influence the competition-stability relationship is the institutional framework
and financial system structure in which banks operate. The institutional framework may affect the scope for ad-
verse selection and moral hazard by entrepreneurs, which is one of the crucial ingredients in the model of Boyd
and De Nicolo (2005). First, we use an indicator of theDepth of Information Sharing , which captures the
difference in information content between the credit registries in different countries. Credit registry institutions
are public or private entities which collect information on the creditworthiness of borrowers and can help reduce
13

both adverse selection and moral hazard problems that are inherent to the lending business (Pagano and Jappelli
(1993) and Kallberg and Udell (2003)). The index ranges between 0 and 6, with a higher value indicating that
more information is available, and has an average of3:9 across the countries in our sample. As borrowers
realize that it will be harder to get a loan at another institution when they default on their current loan, they will
have a stronger incentive to repay and they will choose a safer project (Padilla and Pagano (2000), Vercammen
(1995)).17 Hence, a first testable cross-country hypothesis is that in countries with better information sharing
systems an increase in market power is less detrimental to stability18, since better information sharing systems
will lower the entrepreneurs’ incentive to take more risk .
In addition, we consider financial structure and, more specifically, competition for banks coming from
financial markets. Specifically, we useStock Market Turnover , i.e. the ratio of stocks traded to stocks
listed, as an indicator of financial market development and thus an indicator of alternative funding sources for
enterprises. The turnover ranges from zero in countries without stock exchanges to over 16, with an average of
0.54. More developed stock markets make it easier for firms to switch between bank-based and market-based
funding. However, it also implies that firms who behave or default strategically (i.e., moral hazard) will suffer
reputation losses in other markets as well. Moreover, a stock listing also requires more information disclosure
and transparency (even in the absence of credit registries). This could lead to an additional effect of a change
in competition on bank risk behavior. This leads us to hypothesize that, ceteris paribus, it is less likely to find
a negative relationship between market power and bank stability in countries with well developed financial
markets. Stock market turnover and credit information sharing are positively and significantly correlated with
each other.17Houston, Lin, Lin, and Ma (2010) show for a sample of nearly 2400 banks in 69 countries that greater information sharing leads to
higher bank profits and lowers bank risk.18The empirical result that a loss in market power is more detrimental for bank soundness when there is more information sharing
is also consistent with the theoretical predictions of Dell’Ariccia and Marquez (2006). They show that changes in the information
structure of the market can have a significant impact on the likelihood of a banking crisis. More specifically, a reduction in the
information asymmetries across banks may lead to an easing of lending standards (less screening), a deterioration of bank portfolios,
and more volatile profits. Moreover, they show that the introduction of the threat of competition may actually induce the switch from
screening to borrower pooling.
14

3.3.2 Regulatory and supervisory framework
A second group of country traits that influence the relationship between competition and stability consists of
regulation and supervision designed to protect bank charter values and to prevent risk-seeking behavior if char-
ters are eroded. Risk-adjusted deposit insurance or appropriate capital requirements would help to control risk
taking, even in the presence of intense competition (Hellmann, Murdock, and Stiglitz (2000), Matutes and Vives
(2000), Repullo (2004) and Allen, Carletti, and Marquez (2011)). These effects allow us to hypothesize that
more stringent (risk-based) capital regulation may limit the negative influence that competition may have on
stability. We therefore use aCapital Stringency index that indicates whether there are explicit requirements re-
garding the amount and source of capital that a bank should have.19 A higher index indicates greater stringency.
Capital Stringency ranges from2 to 10, with an average of5:8.
Another popular regulatory measure to increase the stability of banking systems is deposit insurance, as it
reduces the risk of bank runs (Matutes and Vives (1996)). On the other hand, too generous deposit insurance
schemes or inappropriately priced deposit insurance might increase moral hazard (see, e.g., Demirguc-Kunt and
Kane (2002) and Demirguc-Kunt and Huizinga (2004)) since the safety net subsidy increases the liquidation
value of the bank. Thus, a generous deposit insurance system will increase banks’ risk-taking incentives in more
competitive environments.Deposit Insurance Coverageis proxied by deposit insurance coverage relative to
GDP per capita. Deposit insurance20 coverage ranges from less than20% of GDP per capita to more than20
times GDP per capita; in the regressions we will use this variable in logs.
In addition to regulation, such as capital requirements and deposit insurance, effective banking supervision
is important. Monitoring banks is costly and difficult for both depositors and shareholders. Therefore, more
effective supervision should provide incentives to limit bank risk taking and thus could soften the effect of
competition on risk taking. HavingMultiple Supervisors may lead to different supervisory approaches, which
can generate useful information which would otherwise be neglected (Llewellyn (1999)). However, it might
19It measures the regulatory approach to assessing and verifying the degree of capital at risk in a bank. Specifically, it includes
information on whether the source of funds that count as regulatory capital can include assets other than cash, government securities,
or borrowed funds, and whether the authorities verify the sources of capital.20Winton (1997)’s model also implies an interaction effect between competition and deposit insurance.
15

also lead to regulatory arbitrage, exacerbating the effect of competition on stability.16% of our sample obser-
vations (country-years) have multiple bank supervisors. Banking supervision may be supplemented by external
governance which serves the same purpose. TheExternal Governance Index includes information on the
effectiveness of external audits, the transparency of financial statements and the evaluations by rating agencies
and the incentives for future monitoring by creditors. This variable thus serves as a proxy for the influence of
private monitoring mechanism. External Governance ranges from6 to 16:5, with an average of12:7.
Interestingly, these four indicators of the regulatory and supervisory framework are not strongly correlated
with each other. The correlation table, however, shows a positive and significant correlation between Depth of
Information Sharing and External Governance as well as between Stock Market Turnover and Multiple Super-
visors. Deposit Insurance Coverage is correlated with both proxies of institutional and financial development.
3.3.3 Herding and market structure
A third important country characteristic that can influence the relationship between competition and stability
is the covariation of banks’ behavior, also known as herding. From a supervisory perspective, an important
factor in deciding whether or not to intervene is whether the whole system or only a minor fraction of banks
are at risk. Acharya and Yorulmazer (2007) and Brown and Dinc (2011) show that the supervisory decision to
intervene a failing bank is subject to an implicit too-many-to-fail problem: when the number of bank failures
is large, the regulator finds it ex-post optimal to bail out some or all failed banks. This, however, gives banks
incentives to herd and increases the risk that many banks may fail together. Hence, herding behavior may affect
banks’ incentives to increase risk-taking in response to an increase in competition. In addition, Martinez-Miera
and Repullo (2010) and Hakenes and Schnabel (2011) show that a lower correlation of loan defaults makes it
more likely that fiercer competition harms stability. When there is herding in risk-taking behavior, there will be
fewer idiosyncratic defaults and the assumption of perfectly correlated loan defaults becomes more plausible.
Therefore, if default correlation is high, we expect to see a reduction in the probability that the competition-
fragility view is favoured over the competition-stability model.
An indicator of the too-many-to-fail and herding problem is the aggregate Z-score, which is the country-
wide Z-score across all banks for a given year and country (i.e., how large is the aggregate capital buffer
16

against industry wide losses). This variable -Systemic Stability- ranges from 0.185 to 6.297, with an average
of 3.60̇4. An alternative indicator refers to activity restrictions, which may have the unwanted consequence
of encouraging herding, as they limit banks’ potential to venture in new markets if the bank faces fiercer
competition in its core market. TheActivity Restrictions index measures the degree to which banks are
prohibited from engaging in fee-based activities related to securities, insurance and real estate and thus diversify
away from more traditional interest spread-based activities. Lower values of the index indicate that fewer
restrictions are placed on this type of diversification by banks; the index ranges from 4 to 15, with an average
of 9.5. Herding can also occur without activity restrictions. When some banks invest in one type of product
that generates high profits, other banks may be forced to imitate them, as otherwise shareholders will hold them
responsible for the lower profitability of the institution.Heterogeneous Bank Revenuesmeasures whether
there are substantial revenue differences among financial institutions within a country and is calculated as the
within-country, within-year standard deviation of the non-interest income share. A higher value indicates that
there is less herding in revenues in the banking system. Heterogeneity-Revenues ranges from0:031 to 0:340,
with a mean of0:180 and a standard deviation of0:059. Activity restrictions is negatively and significantly
correlated with both Heterogeneity-Revenues and Systemic Stability, i.e. countries with more homogenous
and riskier banking systems also experience higher activity restrictions, while the other two variables are not
correlated with each other.
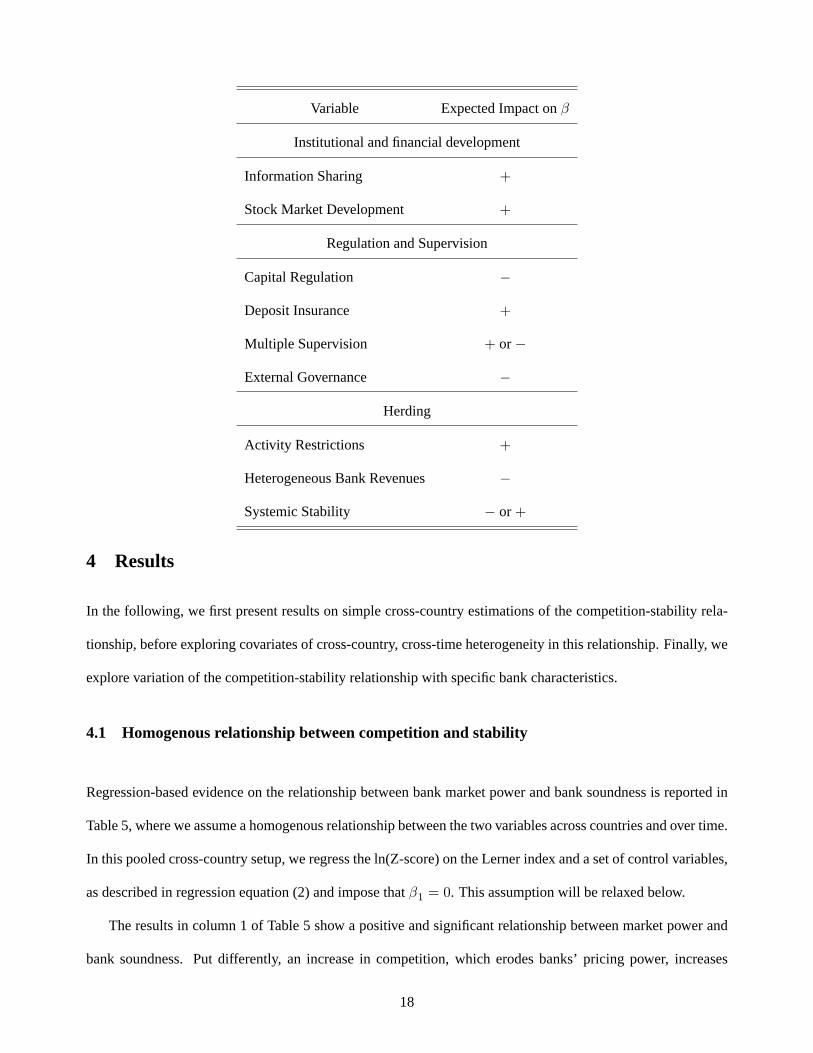
The expected effects of these three sets of variables is summarized in the following table. The first column
represents the variable of interest. The second column contains the expected impact on the market power-
soundness relationship (�). In two cases, theory does not make unambiguous predictions and it will be to the
data to discriminate between competing hypotheses.
17
Variable Expected Impact on�
Institutional and financial development
Information Sharing +
Stock Market Development +
Regulation and Supervision
Capital Regulation �
Deposit Insurance +
Multiple Supervision + or�
External Governance �
Herding
Activity Restrictions +
Heterogeneous Bank Revenues �
Systemic Stability � or+
4 Results
In the following, we first present results on simple cross-country estimations of the competition-stability rela-
tionship, before exploring covariates of cross-country, cross-time heterogeneity in this relationship. Finally, we
explore variation of the competition-stability relationship with specific bank characteristics.
4.1 Homogenous relationship between competition and stability
Regression-based evidence on the relationship between bank market power and bank soundness is reported in
Table 5, where we assume a homogenous relationship between the two variables across countries and over time.
In this pooled cross-country setup, we regress the ln(Z-score) on the Lerner index and a set of control variables,
as described in regression equation (2) and impose that�1 = 0. This assumption will be relaxed below.
The results in column 1 of Table 5 show a positive and significant relationship between market power and
bank soundness. Put differently, an increase in competition, which erodes banks’ pricing power, increases
18

banks’ risk taking behavior and is hence detrimental for financial stability. This result is in line with existing
literature that also uses the Lerner index as a market power proxy (see, e.g., Berger, Klapper, and Turk Ariss
(2009)). In contrast to Figure 1, where we identified the relationship in a time-series dimension, we now
exclusively rely on the heterogeneity in the variables within a country and a given year (as we include time-
varying country fixed effects).
<Insert Table 5 around here>
The effect is not only statistically, but also economically large. As the dependent variable is the natural
logarithm of the Z-score, the point estimate can be interpreted as a semi-elasticity. A one-standard deviation
reduction in the Lerner index, which equals0:142, is associated with a drop in the Z-score of28%. Put dif-
ferently, the number of standard deviations profits have to fall before capital is depleted is reduced by28% if
market power is reduced by one standard deviation.
The results in column 2 of Table 5 show that the positive relationship between banks’ market power and
soundness is not spuriously created by regressing a price markup on a variable related to bank profitability. An
increase in market power is associated with less volatile profits, in line with the lower panel of Figure 1. More
market power (a higher Lerner index) is also positively affecting the capital to asset ratio, which is another
component of the Z-score (column 3).21 Next, we gauge the robustness of our findings to alternative measures
of bank soundness. In the fourth column of Table 5, we employ a Z-score where profit volatility is measured
over five-year rolling windows (instead of three years22). Even though the measure is different and the sample
size is reduced, we do not find that the relationship between competition and stability is significantly different
from the baseline approach in column 1. In column 5, we confirm our results using an IV (2SLS) regression
21We do not report the results for the third component of Z-score, being ROA, as the link between profits and the Lerner index is
mainly mechanical (the coefficient is positive and significant), as we discussed in Section 3.2.3.22In an additional robustness check, available upon request, we examine whether deleting banks with less than three years of data
affects our results. There are multiple reasons why banks are in the sample for only one or two years. Banks may have defaulted, they
could be de novo banks, large acquisitions may result in a new entity, etc. All of these explanations are related to either risk (default) or
competitiveness/market structure (entry or M&A). Hence, it may be a valid concern that this potentially introduces a sample selection
bias and affects our results. Therefore, we also estimate a Heckman selection model to account for this possible sample selection bias.
The results of the latter unreported test confirm that restricting the sample does not affect our results.
19

setup, with loan growth, the cost-income ratio and lagged values of the Lerner index as instruments. In addition,
we also include bank fixed effects. While using lagged independent variables mitigates endogeneity concerns
due to reverse causality, this additional check with fixed effects and instrumental variables should mitigate
endogeneity concerns possibly created by an omitted variable (such as bank ownership). The F-statistic and
J-statistic (not reported) confirm the appropriateness of the instruments and we again find a positive impact of
market power on bank soundness. The estimated coefficient is only slightly smaller compared to the baseline
case, but not significantly different, suggesting that a setup without bank fixed effects or instrumental variables
does not lead to a biased estimate of the market power-bank soundness relationship.
In the following three columns of Table 5, we confirm the pooled sample evidence on the positive rela-
tionship between market power and stability by looking at alternative bank-level competition measures. In
column 6, we simultaneously include the subcomponents of the Lerner index, which is a relative markup of
price over marginal cost. The average price of bank activities is a proxy for market power in the loan market,
while the marginal cost is a proxy for the cost of funding (among other costs). Both price and marginal cost
are significantly associated with banks’ fragility, thus indicating that a reduction in the mark-up (more com-
petition) originating from prices, costs or both are related to less stability. In column 7 and 8, we include the
loan market share and market share in total assets23 in addition to the Lerner index (which proxies for market
power). Banks with more market power behave more prudently, while a large market share has a negative, but
insignificant, impact on bank soundness.24 In the last column we exclude loan loss provisions and annual asset
growth as control variables. These variables capture credit risk and asset expansion, which are in itself first
order drivers of bank risk. The coefficient of the Lerner index is slightly larger in this specification. Dropping
the loans-to-asset ratio does not affect the results.
We verify the sensitivity of this result in two other robustness tests, available upon request. First, we verify
whether or not the results are dominated by countries that constitute the lion’s share of our sample and weigh
23Since we include time-varying country fixed effects and hence look at within country variation, there is a high correlation between
market share and bank size (and the rank correlation is perfect). Therefore, in the latter two specifications, we do not include bank size
as a separate regressor in the regression.24If we do not include the Lerner index in the latter two columns, we obtain that market share picks up the effect of the Lerner index.
Market share has, in these unreported regressions, a positive and significant impact on bank soundness.
20

each observation with the inverse of the number of banks in the corresponding country.25 We again find a
positive and significant relationship between market power and bank stability, though with a slightly smaller
coefficient. Second, we confirm the results for the pre-2007 sample, which is hence not contaminated by the
exceptional events of the 2007-09 global financial crisis.
4.2 The competition-stability relationship across countries
So far, we have shown a conditional positive correlation between banks’ market power and soundness. Behind
this average relationship, however, is a large variation both over time and across countries, as illustrated in
Figures 2 and 3.
<Insert Figure 2 around here>
Figure 2 shows the coefficient estimate on� if the baseline regression (as in Equation (2)) is run separately
for each year in the sample period, including country fixed effects and the same group of bank-level control
variables as discussed above. We find a positive and significant relationship between market power and stability
across all years, but the estimated relationship varies significantly, with coefficient estimates ranging from over
three to (1995) to less than one (1998). The time variation in the estimated relationship is much lower from
2001 onwards.
<Insert Figure 3 around here>
Figure 3 shows the conditional correlation between banks’ market power and soundness across countries,
with a very similar finding. In the first panel of Figure 3, the height of the bars shows the magnitude of the
coefficient of the Lerner index when estimating Equation 1 for each country separately, using ln(Z-score) as the
dependent variable. The coefficients that are significantly different from zero have a lighter shade. The average
of the 79 estimated coefficients equals1:63. Hence, on average, it seems that the franchise value paradigm
dominates the risk-shifting hypothesis. The bar charts show that the conditional correlations in the left hand
25To avoid overrepresentation of US banks in the pooled sample, we already limited the dominant presence of the US banks in the
sample. For each time period, we include the largest 100 US banks as well as 1500 randomly selected banks.
21

side graph are positive in most countries. However, there is a large amount of heterogeneity in the competition-
stability relationship, ranging from a negative and significant relationship to a coefficient estimate of almost six.
The standard deviation of the coefficient across the 79 countries is1:40. A quick look at the country labels26 on
the X-axis also reveals that it is not just a developed versus developing countries story or that countries within
specific regions exhibit similar behavior.
We also rerun the regressions underlying Figure 3 using the negative of profit volatility for each country as
dependent variable. These results are reported in the right hand side graph. On average, the relationship is still
positive, although there are many more countries for which the estimated coefficient is negative compared to
using the ln(Z-score) as the dependent variable. The rank correlation between the two sets of country-specific
gauges of the market power-bank risk relation exceeds0:90. Furthermore, a regression of one on the other
has an R-squared of0:80 and a slope coefficient not significantly different from one. This again confirms that
the relationship between market power and fragility is not driven by having profitability in both dependent and
explanatory variable.27
4.3 The competition-stability relationship: explaining cross-country variation
We first compute the pairwise correlation between the country-specific market power-bank soundness estimates
(as reported in the left panel of Figure 3) and the different country characteristics. This creates some initial
insights in the sources of the cross-country heterogeneity in the market power-bank soundness relationship.
These correlations are reported in the last row of Table 4. The results of this correlation analysis suggest
that competition is more harmful for stability in countries where (i) there are more effective systems of credit
information sharing (pairwise correlation is0:279), (ii) stock markets are more liquid (0:253), (iii) deposit
insurance is more generous (0:654), (iv) there are more restrictions on the permissible range of activities (0:511)
and (v) the banking system is more stable (0:429). The signs of the significant correlations are in line with the
theoretical predictions as explained in Section 3.3. Capital stringency, multiple supervisors, external governance
26Information on the country names, labels and exact numbers can be found in Appendix B.27These results are available upon request. Furthermore, the estimated intercept is not significantly different from1:2 (point estimate
of 1.07 and standard error of 0.09), which is the difference in the coefficient on the Lerner index in columns 10 and 11 of Table 6, where
we further explore this robustness test.
22

and herding in revenues are not significantly correlated with the estimated country-specific competition-stability
trade-off.
Table 6 documents that the preliminary findings of the correlation analysis are confirmed using regression
analysis to estimate equation (2). For ease of comparability of the economic significance, all country-specific
variables are normalized to have zero mean and unit variance, before interacting them with the Lerner index.
<Insert Table 6 around here>
In the first nine columns of Table 6, we analyze one interaction term at a time. The results in Table 6 indicate
that the relationship between banks’ market power and soundness is, on average, positive. This relationship is
stronger in countries and periods where and when (i) there are more effective systems of credit information
sharing (ii) stock markets are more liquid, (iii) deposit insurance is more generous, (iv) there are multiple
supervisors, (v) there are more restrictions on the permissible range of activities, (vi) banks herd more in terms
of revenue structure and (vii) there is more systemic stability. When including the interaction of the Lerner
index with all variables simultaneously (column 10), we continue to find that the relationship between market
power and soundness is stronger in countries with more effective systems of credit information sharing, better
developed stock markets, more generous deposit insurance, higher activity restrictions and more stable banking
systems. This confirms the previously documented evidence of the correlation analysis.
Interestingly, the absolute value of the coefficients of the significant variables varies between0:167 and
0:66. The coefficient on the Lerner index without interaction is1:384. A one standard deviation increase in
one of these variables hence leads to a12% to 48% change28 in the relationship between competition and
fragility. The results in Table 6 are thus not only statistically, but also economically large. This is also indicated
in the right hand side part of the table. Specifically, we report the predicted� coefficients at the 5th and the
95th percentile of the respective country-specific characteristic. We note that in all cases, there is a positive
relationship between banks’ market power and soundness. The magnitude of the relationship, however, varies
28A one standard deviation increase in the stock market turnover ratio (deposit insurance coverage) leads to an estimated impact of
Lerner on bank soundness of1:551 (2:044). This is an12% (48%) increase compared to the average bank in the average country, for
which the impact is1:384.
23
significantly. For example, the magnitude of the market power-soundness relationship is more than twice as
high at the95th percentile of deposit insurance generosity compared to the5th percentile. A similarly large
difference in economic impact is obtained when switching the variables credit information sharing or activity
restrictions from the value at the5th percentile to the95th percentile.
Finally, the two cases mentioned in the lower end of these columns show the impact of a change in compe-
tition corresponding to one of the following two scenarios. Case 1 reports the predicted relationship between
banks’ market power and soundness for a country that is average for each of the country-specific variables. The
predicted value is1:384. A one standard deviation increase in competition (drop in Lerner of0:127) results
in a 17:6% lower Z-score. Case 2 resembles a fictitious post-crisis scenario with generous deposit insurance
schemes (1.65 standard deviations increase) and stronger restrictions on bank activities (a 1.65 standard devi-
ation increase), reflecting recent regulatory reforms or reform suggestions. Compared to the average country
(case 1), the relationship between banks’ market power and soundness is almost110% higher, suggesting a very
negative impact of competition on stability in this scenario. In this scenario, the number of standard deviations
by which profits can fall before equity is depleted drops with37% in response to a one standard deviation re-
duction in market power. The economic magnitude of this scenario analysis is similar if we restrict the sample
to pre-2007 observations.
4.4 Sign of the trade-off
The previous section documents a substantial amount of variation in the competition-stability relationship and
offers insight into the drivers of this heterogeneity. When using the Z-score as the dependent variable, we find
cross-country variation, but the relationship is almost always positive. Hence, one could argue that we mainly
confirm previous empirical evidence that showed that more competition is harmful for bank stability. However,
we offer two more important insights. First, even if the relationship between competition and stability would
not flip sign, the magnitude of this heterogeneity is economically important. A one-standard deviation change
in the Lerner index equals0:127 (within country-year variation). For the average country (across countries,
the average coefficient is1:63, as can be seen in Figure 3), this implies that a one-standard deviation reduction
in market power leads to a21% reduction in the Z-score. The cross-country standard deviation in the market
24

power-stability relationship is1:40. This implies that the impact of a similar change in market power varies
substantially across countries from almost zero (mean,1:63, minus one standard deviation,1:40) to almost40%
(mean plus one standard deviation).
Second, while we follow most of the literature and use the Z-score as the bank soundness measure, we ac-
knowledge that this may cause a mechanical relationship. The Lerner index, our proxy for bank market power,
relies on bank profitability, which is also one of the constituents of the Z-score. Hence, we redo the entire
analysis and use the volatility of profits as the risk measure, thus avoiding the built-in or hard-wired relation-
ship between the Z-score and the Lerner index. We find that on average the relationship is still positive but
much lower. For almost half of the countries, the market power-stability relationship is negative or statistically
indistinguishable from zero (see right hand side graph of Figure 3). More importantly, it does not affect the
coefficient of the interaction terms. The results in column 11 of Table 6 show that the impact of the interactions
between country characteristics and banks’ market power on bank risk are not driven by having a proxy of prof-
itability/revenues in both the dependent and explanatory variable. When using the negative of the denominator
of the logarithmic Z-Score (the log of the standard deviation of ROA) as the dependent variable, the coefficients
on the interaction variables are similar in statistical and economic importance as in column 10.29 Given its
magnitude, the economic impact analysis documented in the right hand side panel of Table 6 indicates that in
some countries an increase in competition might lead to no effect on bank soundness or even an increase in
stability (rather than support for the franchise value hypothesis), depending on the extent of deposit insurance
coverage, depth of information sharing and activity restrictions.
4.5 Additional results: bank failure, contestability, globalization, and too big to fail
So far, we have exploited cross-country and time series variation in the competition-stability relationship. How-
ever, banks’ risk-taking incentives might also be influenced by their own relative position in the market. Specif-
ically, we posit that failing banks have a greater incentive to exploit competition towards more aggressive risk-
taking. Further, banks with a larger market share that therefore consider themselves too-big-to-fail might also
exploit increasing competition to take more aggressive risks. Finally, banks in markets with varying degrees
29We take the negative of profit volatility such that an increase also indicates more stability.
25

of foreign-owned banks might react differently to changes in the competitive environment. This subsection
assesses whether such bank-level variation exists.
<Insert Table 7 around here>
Table 7 shows the relationship between competition and bank stability while controlling for the potential
impact of failing banks and banking crises. The first column shows our baseline competition-stability regres-
sion, as reported in column 10 of Table 6. In the second column, we interact the Lerner index with a distressed
exit dummy. The distressed exit dummy equals one for banks that make losses in the two years before the bank
exits the sample. In this way, we only capture the banks that actually were in distress before they leave the
sample. The significant and positive interaction term between competition and the exit dummy indicates that
banks that are in trouble before leaving the sample react more strongly to a change in competition. Thus, banks
that are in distress gamble even more than others when competition rises, probably because there is not much
left to loose for them. In the third regression, we only look at banks that did not exit the sample (Distressed
Exit Dummy=0), while adding interaction terms between the Lerner index and country-specific characteristics
that potentially influence the competition-stability relationship. The results show that market power still has a
positive relationship with bank stability for these banks. Furthermore, as shown in our previous analysis, banks
operating in a country with overall more effective systems of credit information sharing, generous deposit insur-
ance, higher activity restrictions and higher systemic stability react stronger to a change in competition. This
shows that our main results are not driven by bank-specific distress situations. In the last two columns, we
control for the potential impact of systemic banking crises. Based on Laeven and Valencia (2010), we create a
dummy variable indicating whether a country was experiencing a systemic banking crisis in a specific year. We
then add an interaction term between this variable and the Lerner index to our baseline specification. Column 4
shows that adding this interaction term has a limited impact. The systemic stability variable turns insignificant
(because of the strong negative correlation with the dummy variable), while all other results still hold. The
interaction term itself is not significant. In column 5 we control whether the recent financial crisis is driving our
results. Therefore, we rerun the regression on the pre-2007 period. The majority of our results still hold, only
the credit information sharing variable turns insignificant.
26
<Insert Table 8 around here>
Table 8 shows the results for the baseline competition-stability regression while controlling for the impact
of bank specialisation, bank market share and foreign bank presence. The first column retakes our baseline
results. In the second column, we restrict our sample to commercial banks only. Focussing on one particular
type of banks reduces concerns on the potential impact of differences in the regulatory framework for different
types of banks. We only look at commercial banks as they are the largest subgroup in our sample and allow
us to keep all countries in the sample. The results for the commercial banks mainly confirm our baseline
results for the full sample. The interaction term with two of the herding variables loses significance (activity
restrictions and systemic stability), but the interaction with the other herding variable turns significant with
the expected negative sign. In the third column, we add a squared term of the Lerner index. Including the
squared term does not affect the main results on the interaction variables as can be inferred from comparing
column 1 and 3. The only variable that turns insignificant after including the squared Lerner variable is credit
information sharing. We still obtain that banks operating in a country with more generous deposit insurance,
more liquid stock exchanges, higher activity restrictions and higher systemic stability react stronger to a change
in competition. We estimate a significant and negative coefficient on the squared term, suggesting a non-linear,
inverse U-shaped relationship between market power and bank soundness, which is in line with Martinez-Miera
and Repullo (2010)’s theoretical predictions. However, the relationship does not turn negative until a value of
0:28 for the Lerner index is reached, which is more than one standard deviation above its mean and does not
turn significant and negative below0:33 (which corresponds to only5% of all bank-year observations). In the
subsequent tests, we always include the squared Lerner term to avoid that the measure of market share and
TBTF would spuriously pick up this effect. In the fourth column, we add the interaction of the Lerner index
with a bank’s market share (measured in terms of total assets). This allows us to check whether banks with
a higher market share have an incentive to take more risk in more competitive environments, because they
can potentially see themselves as too-big-to-fail. Since we also include bank size, our interaction term only
captures the extent to which TBTF may affect bank incentives in response to changes in market power. The
results indicate that there is no direct too-big-to-fail effect influencing the competition-stability relationship. In
27

the fifth column, we do a similar exercise, but now using a market share dummy that equals one for banks with
a market share that is larger than 10 percent. Again, we do not find a significant direct effect of a banks’ market
share on the competition-stability relationship. In columns 6 and 7, we use the interaction of the Lerner index
with dummies indicating banks whose assets are above10% or 25% of GDP of its home country. Banks that are
large relative to the country’s GDP are systemically important and could be perceived to be too-big-to-fail. This
may affect their risk-taking incentives as well as the Lerner index through lower funding costs. The interaction
enters significantly in neither case, indicating that these banks do not drive the results nor behave differently.
Overall, we cannot find evidence that competition exacerbates the too-big-to-fail phenomenon.
In the last column, we interact the Lerner index with the share of foreign banks.30 Banking markets with a
higher fraction of foreign banks are more contestable, which should lead to more disciplining of the incumbent
banks. At the same time, the behavior of foreign banks is influenced not only by the structure and competition
in the local market, but also in the home and global market, thus reducing the impact of local market power
on risk-taking. We find a negative and significant interaction term between the Lerner index and the share of
foreign banks, suggesting that a higher share of foreign banks in the total number of banks reduces banks’
incentives to take on risks in response to a drop in market power.
We further subject our findings to a battery of unreported robustness tests.31 While the dependent variable
throughout our analysis is the Z-score in which the denominator, volatility of profits, is measured over a three
year interval, the results are robust to using a Z-score in which the denominator is measured using five year
rolling windows. The findings are also robust to including banks’ market share and its interaction with the
same country-specific factors. Few of the interaction terms with banks’ market share are significant and their
inclusion does not affect the sign, size or significance of the interaction terms of the Lerner index with country-
specific factors. We also run a regression in which we include year and country fixed effects (rather than their
interaction). In such a setup, we can also include the nine country characteristics as independent variables (in
30Measured at the country level as the percentage of foreign banks among total banks, see Claessens and van Horen (2012). Unfor-
tunately, our database does not allow us to measure each bank’s foreign activities.31We also conduct the regressions reported in Table 7 and Table 8 with the volatility of profits as the dependent variable. Almost all
results continue to hold.
28

addition to their interaction with the Lerner index). This alternative setup does not affect the findings on the
interaction terms. In addition, we find that banks are more stable in countries with stricter capital regulation,
a more stable banking system, fewer restrictions on the range of activities, more homogenous bank revenue
structures, and a single supervisor.32 Furthermore, dropping the loan loss provision ratio and asset growth from
the set of bank-specific control variables leads to a slightly higher coefficient on the Lerner index (as in the
case without interaction terms, see the last column of Table 5), but does not affect the interaction variables.
Finally, the number of countries and observations vary in each specification of Table 6 due to the availability
and coverage of different country-specific characteristics. When repeating the regressions reported in columns
1-10 using a common sample (the sample used in column 10), we obtain similar results.
5 Robustness and limitations of the dataset
In various sections of the paper, we talked about robustness tests or potential limitations of the analysis. In order
not to interrupt the flow of the paper, we only discussed them briefly. In what follows, we discuss these and
other robustness tests in more detail. All results are available upon request but not reported to save on space.
5.1 Globalization
One potential limitation of the results and dataset might be that banks have expanded abroad in many dimen-
sions. Nowadays, banks may be funded with foreign deposits, originate foreign loans and are (partly) foreign-
owned. If banks operate internationally, they also compete internationally and price-cost margins should reflect
this. Moreover, this could create a harmonization of the competition-stability trade-off across countries, miti-
gating the scope for country-specific features to explain the remaining heterogeneity. As globalization increased
substantially over the sample period, we indeed observe a decrease over time in the cross-country variation in
32Hence, two of these country-specific factors affect the dependent variable directly, but the impact is related according to the level of
the Lerner index. We find that the negative impact of activity restrictions on bank soundness is reduced the more pricing power a bank
has. Hence, limiting the scope for expansion in non-traditional banking activities will harm the banks with limited market power and
may benefit banks with pricing power. Systemic stability has a positive effect on individual bank soundness and the effect is stronger
for banks with more market power.
29

the competition-stability relationship. The cross-country standard deviation in the competition-stability rela-
tionship reduces from1:80 in the early sample years to approximately1:30 for the latter part of the sample. The
main source of the reduction is the lower mass in the left tail of the competition-stability trade-off. The mini-
mum increases from�4 in the early sample years to�2 in the second half of the sample. Notwithstanding the
reduction in heterogeneity, the variability across countries is still sufficiently large to perform an investigation
into the sources of this variation.
The previous argument assumes that all banks within a country expand abroad to the same extent. This
may not be true. Most smaller banks still operate almost entirely domestically. As we use consolidated data,
this may create a wedge between the measurement of market power for domestic versus international banks.
Unfortunately, bank-level data on the decomposition of assets and liabilities in domestic or cross-border origin
is not available.33 Assuming that there is a strong correlation between size and foreign activities, we run several
robustness checks, both on the specification with and without the interaction terms. We run a regression where
we exclude the10 (20) largest banks of each country, where the top10 (20) is allowed to change every year. We
also run a regression on a reduced sample of banks that have a cumulative market share (after sorting on market
share from low to high, by country and on a yearly basis) of less than50% (20%), such that we only focus
on the smallest banks in a country. The results are similar for these samples of banks which contain mainly
domestically oriented banks.
5.2 Reconciling seemingly conflicting empirical evidence
The majority of the existing papers finds support for the franchise value hypothesis. On the other hand, Boyd,
De Nicolo, and Jalal (2006) obtain support for the competition-stability view. Our setup and results may
provide a framework to rationalize the seemingly conflicting findings. For example, Boyd, De Nicolo, and Jalal
(2006) only include developing countries in their cross-country setup.34 However, the amount of information
33Claessens and van Horen (2012) recently constructed a database on international banking, but only focus on the ownership structure.
However, this need not be informative on cross-border loans or funding.34There are also other differences. We use a bank level measure of market power whereas they use a country-level indicator of
concentration (HHI). In contrast to concentration indices, the Lerner index does not necessarily imply defining the relevant banking
market. In addition, market structure does not need to be related to market power, as has been shown in other studies (see e.g. Claessens
30

sharing and the liquidity of the stock market is significantly lower in developing countries compared to the
countries they omit (US, Japan and Western Europe). In our sample, the difference between the average value
of these two indicators in both groups is approximately0:7 standard deviation (for both measures). These
factors mostly affect the risk-shifting incentives of the entrepreneurs. In addition, deposit insurance coverage
is also significantly lower in developing countries. The difference in means is0:32 standard deviations with
the omitted group of developed countries. The results in column 11 of Table 6 indicate that on average the
coefficient of the Lerner index is0:199. However, a0:70 standard deviation reduction in information sharing
and stock market liquidity and a0:32 drop in deposit insurance coverage yields a coefficient of�0:32.35 Our
results thus indicate that, compared to the average country, combining these three effects can eventually lead
to a negative relationship between the Lerner index and profit volatility, which is in line with the competition-
stability view. When doing a similar analysis on the point estimates of column 10 of Table 6, we see an equally
large drop in the implied market power-bank soundness relationship. However, the point estimate now drops
from an average impact of1:38 to 0:87, which is still significantly positive (but also affected by the hard-
wired effect of profitability). Therefore, we would like to stress that we focus more on the magnitude of the
cross-country variation rather than the exact sign (as the latter is measure specific and the former is not).
5.3 Limiting market power
We document that certain country-specific characteristics mitigate or amplify the effect of market power on sta-
bility and conclude from this that these country characteristics create heterogeneity in the competition-stability
relationship. An alternative explanation would be that certain types of regulation affect the extent to which
banks can exercise market power. While time-varying country fixed effects absorb the direct effect of various
regulations on the level of competition (and stability), it may still be that these regulations lead to the absence of
within-country variation in banks’ market power and hence artificially drive down the impact of market power
on stability (as there would be little variation in the independent variable). To check the validity of this argu-
and Laeven (2004))35I.e.: 0:20 � 0:70 � 0:32 � 0:70 � 0:13 � 0:32 � 0:64, and putting all other interaction terms at zero (as the country variables are
standardized).
31

ment, we first compute the variation in the Lerner index for each country and year. Subsequently, we regress this
variation on the country characteristics used in our analysis. A number of conclusions can be drawn from this
analysis. First, the R-squared of such a regression is low (0:13), indicating that the within country-year variation
in banks’ pricing power is largely unaffected by the country-characteristics. Second, while some coefficients
are significant, they are quite small and leading to a low economic impact. As all right hand side variables are
standardized, we see for instance that even a four standard deviation decrease in deposit insurance would only
lead to a drop in the standard deviation of the Lerner index from0:14 to 0:11, which is still sufficiently large
such as not to cause an automatic zero relationship between market power and bank stability.
5.4 Z-Score decomposition
Other papers have looked at different risk metrics or competition measures. Throughout the paper, we have
motivated substantially why the Lerner and the Z-score are our preferred market power and risk measures.
Nevertheless, we have run numerous robustness checks. We decompose the Z-score in its constituents and find
that a higher Lerner index increases bank profits, as well as lowers the volatility of profits. Moreover, banks
with more market power also hold higher capital buffers (see results reported in Table 5). The latter finding is in
line with Berger, Klapper, and Turk Ariss (2009).36 Hence, the Lerner index is significantly related with each of
the three components of the Z-score individually, with the expected sign. In addition, we check the robustness
of the results when we include the capital ratio as an independent variable. We compare the results obtained by
36A positive relationship between market power and bank capital is in line with the franchise value hypothesis but in contrast to, for
instance, Allen, Carletti, and Marquez (2011). However, the strong and positive relationship between the Lerner index and capital ratio
is also in line with stylized empirical facts about corporate (and bank) capital structure (see e.g.: Frank and Goyal (2009), Gropp and
Heider (2010)). Firms/banks with higher profits (e.g. due to more pricing power) will be able to manage their capital ratio ‘passively’
by means of retained earnings (or dividend distributions), rather than deciding to change leverage actively via external funding. The
choice between active and passive capital management (and hence the relationship between the Lerner index and bank capital) will
also be affected by country characteristics. Passive management will be more frequent in countries where external financing is more
costly (less liquid stock markets), whereas earnings retention may be less in countries where the principal agent problem between bank
equityholders and debtholders is larger (more deposit insurance reduces monitoring incentives). We leave a detailed analysis of the
impact of country characteristics on the profit (market power)-bank capital relationship for further research.
32
including the capital ratio in four alternative specifications (specification with and without interaction between
Lerner and country characteristics; combined with alternating the Z-score and profit volatility as the dependent
variable). All the results reported in the paper still hold. Hence, controlling for bank capital in either a speci-
fication with or without a possible mechanical relationship (due to profitability) between the Lerner index and
bank risk does not affect the results regarding the sources of cross-country variation in the competition-fragility
relationship. We also document throughout the paper that the impact of country characteristics on the market
power-bank soundness relationship is similar when using either the Z-score or profit volatility as the dependent
variable.
6 Conclusion
This paper documents significant cross-country heterogeneity in the competition-stability relationship. While,
on average, it seems that the franchise-value paradigm dominates the risk-shifting hypothesis, this full sample
relationship hides a substantial amount of cross-country heterogeneity, with estimates ranging from significantly
negative, over insignificant to mostly strong positive relationships between market power and stability.
We develop a framework to assess how regulation, supervision and other institutional factors may make it
more likely that the data favor one theory over the other, i.e. the charter-value paradigm over the risk-shifting
paradigm. We show that an increase in competition will have a larger impact on banks’ risk taking incen-
tives in countries with stricter activity restrictions, lower systemic fragility, better developed stock exchanges,
more generous deposit insurance and more effective systems of credit information sharing. Our findings help
understand the seemingly conflicting empirical evidence. Most studies tend to find results in favour of the
competition-fragility view. However, if one would sample banks from countries/regions with less strict ac-
tivity restrictions and capital regulations, less homogenous bank revenue structures, no deposit insurance and
credit registries, obtaining insignificant or the opposite result need not be inconsistent. Understanding the
market, regulatory and institutional framework in which banks operate is thus critical in gauging the effect of
competition on stability.
Our findings have important policy repercussions. They suggest that activity restrictions and herding trends
33

can exacerbate the negative impact of competition on bank stability so that regulatory reforms have to take this
into account. We show that the too-many-to-fail phenomenon is worse in more competitive environments. The
results also stress the importance of the moral hazard risk of generous deposit insurance, exacerbated in more
competitive environments. In the midst of the 2007-2009 crisis, many countries increased the generosity of
the deposit insurance schemes. At the same time, there were calls for restrictions on banks’ activities (as was
the case after the Great Depression when the U.S. imposed the Glass-Steagall Act). Mimicking this post-crisis
scenario in a fictitious ceteris paribus analysis reveals that the relationship between market power and soundness
is almost twice as strong compared to the benchmark case, suggesting a very negative impact of competition
on stability in this scenario. In the base scenario, a one standard deviation reduction in market power leads
to a drop in the Z-score of17:6%. In our fictitious post-crisis scenario, a similar loss in market power leads
to a37% reduction in the average Z-score (which is the buffer of capital against losses expressed in terms of
profit volatility). In the post-crisis scenario with more generous deposit insurance in place, the sensitivity of the
Z-score (or profit volatility) to changes in the Lerner index has increased. Whether this ultimately is good or
bad depends on the direction of the change in the Lerner index. If banks’ pricing power has been reduced after
the crisis, then our results indicate that the regulatory changes after the crisis aggravated the negative impact on
bank instability. Our findings underline the importance of regulatory policies and market structure for stability.
In addition to a direct effect of these policies on risk-taking incentives of banks, they also have an indirect effect
by dampening or exacerbating the effect of competition on banks’ riskiness.
34

References
Abiad, Abdul, Enrica Detragiache, and Thierry Tressel, 2008, A new database of financial reforms,Interna-
tional Monetary Fund, Working Paper 08/266.
Acharya, Viral V., and Tanju Yorulmazer, 2007, Too many to fail–an analysis of time-inconsistency in bank
closure policies,Journal of Financial Intermediation16, 1–31.
Allen, Franklin, Elena Carletti, and Robert Marquez, 2011, Credit market competition and capital regulation,
Review of Financial Studies24, 983–1018.
Allen, Franklin, and Douglas Gale, 2000, Comparing financial systems,Cambridge, MA: MIT Press.
, 2004, Competition and financial stability,Journal of Money Credit and Banking36, 453–480.
Bank for International Settlements, ., 2001, The banking industry in the emerging market economies: Compe-
tition, consolidation and systemic stability,BIS Paper 4.
Barth, James, Gerald Caprio, and Ross Levine, 2006, Rethinking bank regulation: Till angels govern., .
Barth, James, Gerard Caprio, and Ross Levine, 2008, Bank regulation and supervision database (updated june
2008),World Bank.
Beck, Thorsten, 2008, Bank competition and financial stability: friends or foes?, inBank Indonesia and Banco
de Mexico (Eds.): Competition in the Financial Sector.
, Asli Demirguc-Kunt, and Ross Levine, 2006, Bank concentration, competition, and crises: First
results,Journal of Banking and Finance30, 1581–1603.
Beck, Thorsten, Asli Demirguc-Kunt, and R. Levine, 2010, Financial institutions and markets across countries
and over time: The updated financial development and structure database,World Bank Economic Review24,
77–92.
Beck, Thorsten, Ross Levine, and Alexey Levkov, 2010, Big bad banks? the winners and losers from bank
deregulation in the united states,Journal of Finance65, 1637–1667.
35

Berger, Allen N., Leora F. Klapper, and Rima Turk Ariss, 2009, Bank competition and financial stability,
Journal of Financial Services Research35, 99–118.
Bertrand, Marianne, Antoinette Schoar, and David Thesmar, 2007, Banking deregulation and industry structure:
Evidence from the french banking reforms of 1985,Journal of Finance62, 597–628.
Boot, Arnoud W. A., and Anjan V. Thakor, 1993, Self-interested bank regulation,The American Economic
Review83, 206–212.
Boyd, John H., and Gianni De Nicolo, 2005, The theory of bank risk taking and competition revisited,Journal
of Finance60, 1329–1343.
, and Abu M. Jalal, 2006, Bank risk-taking and competition revisited: New theory and new evidence,
IMF Working Paper No. 06/297.
Boyd, John H., and David E. Runkle, 1993, Size and performance of banking firms - testing the predictions of
theory,Journal of Monetary Economics31, 47–67.
Brown, Craig O., and Serdar I. Dinc, 2011, Too many to fail? evidence of regulatory forbearance when the
banking sector is weak,Review of Financial Studies24, 1378–1405.
Carletti, Elena, 2008, Competition and regulation in banking, in Arnoud W. A. Boot,andAnjan V. Thakor, ed.:
Handbook of Financial Intermediation and Banking. pp. 449–482 (Elsevier: San Diego).
, and Xavier Vives, 2009, Regulation and competition policy in the banking sector, in Competition
Policy in the EU, 260–284.
Cetorelli, N., and M. Gambera, 2001, Banking market structure, financial dependence and growth: International
evidence from industry data,Journal of Finance56, 617–648.
Claessens, Stijn, and Luc Laeven, 2004, What drives bank competition? some international evidence,Journal
of Money, Credit and Banking36, 563–83.
36
Claessens, Stijn, and Neeltje van Horen, 2012, Foreign banks: Trends, impact and financial stability,Interna-
tional Monetary Fund, Working Paper 12/10.
Degryse, Hans, and Steven Ongena, 2008, Competition and regulation in the banking sector: A review of the
empirical evidence on the sources of bank rents, in Arnoud W. A. Boot,andAnjan V. Thakor, ed.:Handbook
of Financial Intermediation and Banking. pp. 483–554 (Elsevier: San Diego).
Dell’Ariccia, Giovanni, and Robert Marquez, 2004, Information and bank credit allocation,Journal of Finan-
cial Economics72, 185–214.
, 2006, Lending booms and lending standards,Journal of Finance61, 2511–2546.
Demirguc-Kunt, Asli, and Enrica Detragiache, 2002, Does deposit insurance increase banking system stability?
an empirical investigation,Journal of Monetary Economics49, 1373–1406.
Demirguc-Kunt, Asli, and Harry Huizinga, 2004, Market discipline and deposit insurance,Journal of Monetary
Economics51, 375–399.
, 2010, Bank activity and funding strategies: The impact on risk and returns,Journal of Financial
Economics98, 626–650.
Demirguc-Kunt, Asli, and Edward Kane, 2002, Deposit insurance around the globe: Where does it work?,
Journal of Economic Perspectives16, 175–195.
Demirguc-Kunt, Asli, Baybars Karacaovali, and Luc Laeven, 2005, Deposit insurance around the world: A
comprehensive database,Policy Research Paper , World Bank.
Dick, Astrid A., and Andreas Lehnert, 2010, Personal bankruptcy and credit market competition,The Journal
of Finance65, 655–686.
Frank, Murray Z., and Vidhan K. Goyal, 2009, Capital structure decisions: Which factors are reliably impor-
tant?,Financial Management38, 1–37.
37

Gan, Jie, 2004, Banking market structure and financial stability: Evidence from the texas real estate crisis in
the 1980s,Journal of Financial Economics73, 567–601.
Gropp, Reint, and Florian Heider, 2010, The determinants of bank capital structure,Review of Finance14,
587–622.
Group of Ten, ., 2001, Report on consolidation in the financial sector, .
Hakenes, Hendrik, and Isabel Schnabel, 2011, Capital regulation, bank competition, and financial stability,
Economics Letters, forthcoming.
Hauswald, Robert, and Robert Marquez, 2006, Competition and strategic information acquisition in credit
markets,Review of Financial Studies19, 967–1000.
Hellmann, Thomas F., Kevin C. Murdock, and Joseph E. Stiglitz, 2000, Liberalization, moral hazard in banking,
and prudential regulation: Are capital requirements enough?,American Economic Review90, 147–165.
Houston, Joel F., Chen Lin, Ping Lin, and Yue Ma, 2010, Creditor rights, information sharing, and bank risk
taking,Journal of Financial Economics96, 485–512.
International Monetary Fund, ., 2001, Financial sector consolidation in emerging markets, chapter v, Interna-
tional Capital Market report, Washington DC.
Jayaratne, Jith, and Philip Strahan, 1998, Entry restrictions, industry evolution, and dynamic efficiency: Evi-
dence from commercial banking,Journal of Law and Economics41, 239–273.
Jimenez, Gabriel, Jose A. Lopez, and Jesus Saurina, 2010, How does competition impact bank risk-taking?,
Banco de Espana Working Paper No. 1005.
Kallberg, Jarl G., and Gregory F. Udell, 2003, The value of private sector business credit information sharing:
The u.s. case,Journal of Banking and Finance27, 449–469.
Keeley, Michael C., 1990, Deposit insurance, risk, and market power in banking,American Economic Review
80, 1183–1200.
38

Laeven, Luc, and Ross Levine, 2009, Bank governance, regulation and risk taking,Journal of Financial Eco-
nomics93, 259–275.
Laeven, Luc, and Fabian Valencia, 2010, Resolution of banking crises: The good, the bad, and the ugly,Inter-
national Monetary Fund, Working Paper 10/146.
Llewellyn, David T., 1999, Introduction: The institutional structure of regulatory agencies,in N.Courtis (ed.),
How countries supervise their banks, insurers and securities markets.
Marcus, Alan J., 1984, Deregulation and bank financial policy,Journal of Banking and Finance8, 557–565.
Martinez-Miera, David, and Rafael Repullo, 2010, Does competition reduce the risk of bank failure?,Review
of Financial Studies23, 3638–3664.
Matutes, Carmen, and Xavier Vives, 1996, Competition for deposits, fragility, and insurance,Journal of Finan-
cial Intermediation5, 184–216.
, 2000, Imperfect competition, risk taking, and regulation in banking,European Economic Review44,
1–34.
Padilla, A. Jorge, and Marco Pagano, 2000, Sharing default information as a borrower discipline device,Euro-
pean Economic Review44, 1951–1980.
Pagano, Marco, and Tullio Jappelli, 1993, Information sharing in credit markets,The Journal of Finance48,
1693–1718.
Panzar, John C., and James N. Rosse, 1987, Testing for "monopoly" equilibrium,The Journal of Industrial
Economics35, 443–456.
Repullo, Rafael, 2004, Capital requirements, market power, and risk-taking in banking,Journal of Financial
Intermediation13, 156–182.
Rice, Tara, and Philip E. Strahan, 2010, Does credit competition affect small-firm finance?,Journal of Finance
65, 861–889.
39

Roy, Arthur D., 1952, Safety first and the holding of assets,Econometrica20, 431–449.
Salas, Vicente, and Jesus Saurina, 2003, Deregulation, market power and risk behaviour in spanish banks,
European Economic Review47, 1061–1075.
Schaeck, Klaus, and Martin Cihak, 2010, Competition, efficiency, and soundness in banking:
An industrial organization perspective,European Banking Center Discussion Paper No. 2010-20S,
http://ssrn.com/paper=1635245.
, 2011, Banking competition and capital ratios,European Financial Management, Forthcoming.
, and Simon Wolfe, 2009, Are competitive banking systems more stable?,Journal of Money, Credit and
Banking41, 711–734.
Turk Ariss, Rima, 2010, On the implications of market power in banking: Evidence from developing countries,
Journal of Banking and Finance34, 765–775.
Vercammen, James A., 1995, Credit bureau policy and sustainable reputation effects in credit markets,Eco-
nomica62, 461–478.
Vives, Xavier, 2001, Competition in the changing world of banking,Oxford Review of Economic Policy17,
535–547.
Wagner, Wolf, 2010, Loan market competition and bank risk-taking,Journal of Financial Services Research
37, 71–81.
Winton, Andrew, 1997, Competition among financial intermediaries when diversification matters,Journal of
Financial Intermediation6, 307–346.
40

Figure 1: Evolution over Time of Market Power, Bank Stability and Profit Volatility
This graph contains information on the relationship between bank market power and bank soundness. The upper figure shows the evolutionover time of our two main variables of interest: market power and bank soundness. Market power is proxied by the Lerner index, which is therelative markup of price over marginal cost. Bank soundness is captured by the natural logarithm of the Z-score. The Z-score equals the sum ofequity over total assets and return on assets divided by the three year rolling standard deviation of return on assets. Both indicators are initiallycalculated at the bank-year level and then averaged by country on a yearly basis between 1994 and 2009. The plotted lines correspond withthe yearly averages of these cross-country averages. The evolution of the Z-score is shown on the left axis, whereas the evolution of the Lernerindex is shown on the right axis. The lower figure depicts the evolution, between 1994 and 2009, of the Lerner index and the volatility of returnon assets, which is the denominator of the Z-score. The volatility of bank profits (ROA) is again calculated on a three year rolling windowbasis. Again, we first compute this measure by bank-year observation, before averaging first at the country-year level and subsequently by timeperiod.
.08
.1.1
2.1
4.1
6Le
rner
3.2
3.3
3.4
3.5
3.6
ln(Z
sco
re)
1995 2000 2005 2010Year
ln(Zscore) Market Power
Time series evolution of Average Risk and Average Market Power
.08
.1.1
2.1
4.1
6Le
rner
.6.7
.8.9
1V
olat
ility
of R
OA
1995 2000 2005 2010Year
ROA volatility Market Power
Time series evolution of ROA volatility and Average Market Power
41

Figure 2: Evolution over Time of the Conditional Correlation between Bank Market Power and Stability
This graph shows the evolution of the conditional correlation between a bank market power measure and a bank stabilitymeasure between 1994 and 2009. Bank market power is proxied by the Lerner index, which is the relative markup ofprice over marginal cost. Bank soundness is captured by the logarithm of the Z-score, which equals the number ofstandard deviations bank profits have to fall before the equity cushion is depleted. The height of the bars shows themagnitude of the coefficient of the Lerner index when running year-by-year regressions of the Z-score on the Lernerindex, and a group of bank-specific control variables. We also include country fixed effects to control for unobservedeffects at the country level. Standard errors are robust and clustered at the country level. All depicted correlations aresignificant at the 5 percent level.
01
23
Reg
ress
ion
coef
ficie
nt L
erne
r
1994 1995 1996 1997 1998 1999 2000 2001 2002 2003 2004 2005 2006 2007 2008 2009
Evolution over timeConditional correlation of Bank Market Power and Stability
42

Fig
ure
3:C
orre
latio
nof
Ban
kM
arke
tPow
eran
dS
tabi
lity
Thi
sgr
aph
cont
ains
info
rmat
ion
onth
ere
latio
nshi
pbe
twee
nba
nkm
arke
tpow
eran
dba
nkso
undn
ess
for
all7
9co
untr
ies
inou
rsa
mpl
ebe
twee
n19
94an
d20
09.
Ban
km
arke
tpow
eris
prox
ied
byth
eLe
rner
inde
x.In
the
left
grap
h,ba
nkso
undn
ess
isca
ptur
edby
the
Z-s
core
,w
hich
equa
lsth
enu
mbe
rof
stan
dard
devi
atio
nsba
nkpr
ofits
have
tofa
llbe
fore
the
equi
tycu
shio
nis
depl
eted
.In
the
right
grap
h,ba
nkso
undn
ess
isca
ptur
edby
the
nega
tive
ofth
evo
latil
ityof
bank
profi
ts,
whi
cheq
uals
toon
eov
erth
ede
nom
inat
orof
the
Z-s
core
.In
the
grap
h,th
ehe
ight
ofth
eba
rssh
ows
the
mag
nitu
deof
the
coef
ficie
ntof
the
Lern
erin
dex
whe
nre
gres
sing
bank
soun
dnes
son
the
Lern
erin
dex
and
agr
oup
ofba
nk-s
peci
ficco
ntro
lva
riabl
esfo
rea
chco
untr
yse
para
tely
.T
heba
rsar
eso
rted
from
low
tohi
ghan
dth
eco
untr
yla
bels
are
men
tione
don
the
X-a
xis.
The
coef
ficie
nts
that
are
sign
ifica
ntly
diffe
rent
from
zero
atth
e10
perc
entl
evel
have
alig
hter
shad
e.S
igni
fican
ceis
dete
rmin
edba
sed
onro
bust
stan
dard
erro
rscl
uste
red
atth
eba
nkle
vel.
App
endi
xB
cont
ains
info
rmat
ion
onth
eco
untr
yna
mes
,abb
revi
atio
ns,a
vera
geLe
rner
,ave
rage
Z-s
core
and
the
corr
elat
ion
betw
een
them
.
20246
Regression coefficient Lerner
LUSVCNSGMXLVRU
ILRSAMSEIE
VNPLRONLMDCRHNPABYKZPYAUDEMKUATRARVEPEHKBOECDKGBZAIS
CLTZBGCHID
BRPKDOATBEIT
MYUYHRUSCATHHUESPTJP
GHNGSKGRSABDKRFRSI
NOPHCYMUCOKECZIN
NPTNLK
Cou
ntry
Ave
rage
=1.6
3, C
ount
ry S
tand
ard
Dev
iatio
n=1.
40
Het
erog
enei
ty a
cros
s 79
Cou
ntrie
sC
ondi
tiona
l cor
rela
tion
of B
ank
Mar
ket P
ower
and
Sta
bilit
y
insi
gnifi
cant
sign
ifica
nt42024
Regression coefficient Lerner
LUSGSVIE
VNSEPLCRZACLAURU
ILBGCNLVDERSVEIS
BOMXAMMDDKBEDOTRKZNLPYGBHKBYID
UAHNATMKARROPATZMYPEIT
BRECESIN
PTTHMUCHHUSI
HRPKUYUSSACANGNOJPPHGRCOTNFRGHCZKESKCYBDKRLKNP
Cou
ntry
Ave
rage
=0.3
8, C
ount
ry S
tand
ard
Dev
iatio
n=1.
38
Het
erog
enei
ty a
cros
s 79
Cou
ntrie
sC
ondi
tiona
l cor
rela
tion
of B
ank
Mar
ket P
ower
and
Sta
bilit
y (l
n(sd
(RO
A)))
insi
gnifi
cant
sign
ifica
nt
43

Table 1: Bank-specific Variables: Summary Statistics
This table shows the total sample summary statistics for the bank specific variables used throughout the paper. Bank specific data isretrieved from the Bureau Van Dijck Bankscope database. The full sample contains 80822 observations. The table consists of threeparts. The first panel contains information on the mean and standard deviation of the variables that are used as control variables in thecompetition - stability regressions. The impact of banks’ business model on bank soundness is proxied via its funding structure (shareof wholesale funding equals the share of money market funding in money market funding and total deposits), asset mix (loans to totalassets) and revenue composition (non-interest income in total income). We also control for bank size, credit risk (loan loss provisions tototal interest income) and bank strategy (annual growth in total assets). We have three types of banks in our sample: Commercial Banks,Cooperative Banks and Savings Banks. The second panel summarizes the variables that are needed to construct the Lerner index. TheLerner index is the relative markup of price over marginal cost. The average price of bank activities equals the ratio of total revenuesover total assets. Marginal costs are obtained after estimating a translog cost function. Using a translog specification, we relate banks’total operating cost to three input prices (price of fixed assets, price of labor and price of funding). They are constructed as respectivelythe share of other operating and administrative expenses to total assets, the ratio of personnel expenses to total assets and the ratio ofinterest expenses to total deposits and money market funding. The third panel contains information on the main variables of interest:market power and bank riskiness. Market power is proxied by the Lerner index, whereas our bank stability indicator is the naturallogarithm of the Z-score. The Z-score is calculated as the sum of equity over total assets and return on assets divided by the three yearrolling standard deviation of return on assets. For all variables, we depict the full sample standard deviation. In the lower panel, wealso provide additional information on the variation of market power and bank soundness (i) across bank averages, (ii) within banks,i.e. after subtracting the bank-specific mean, (iii) across banks after subtracting the country-year average, and (iv) between countries(after averaging over banks within a country).
Variable Mean Standard DeviationDeterminants of Bank Soundness
Share of Wholesale Funding 0.0559 0.1347Loans to Total Assets 0.5830 0.1882Non-Interest Revenue Share 0.2635 0.1763ln(Total Assets) 6.4467 1.857Loan Loss Provisions to Interest Income 0.1496 0.1926Annual Growth in Total Assets 0.1028 0.2534Commercial Bank dummy 0.5335 0.4989Cooperative Bank dummy 0.2822 0.4501Savings Bank dummy 0.1844 0.3878
Translog Cost FunctionTotal Operating Cost 280.3789 877.9428Price of Fixed Assets 1.7468 3.2794Price of Labor 0.0158 0.0097Price of Funding 0.0411 0.0338Average Price of bank activities 0.0769 0.0419Marginal Cost 0.0672 0.0386
Bank Soundness and Market Powerln(Z-score) 4.0064 1.321
Between Bank Variation 1.108Within Bank Variation 0.841
Within Country-Year variation 1.146Between Country Variation 0.532
Lerner 0.1239 0.143Between Bank Variation 0.138Within Bank Variation 0.089
Within Country-Year variation 0.127Between Country Variation 0.060
44
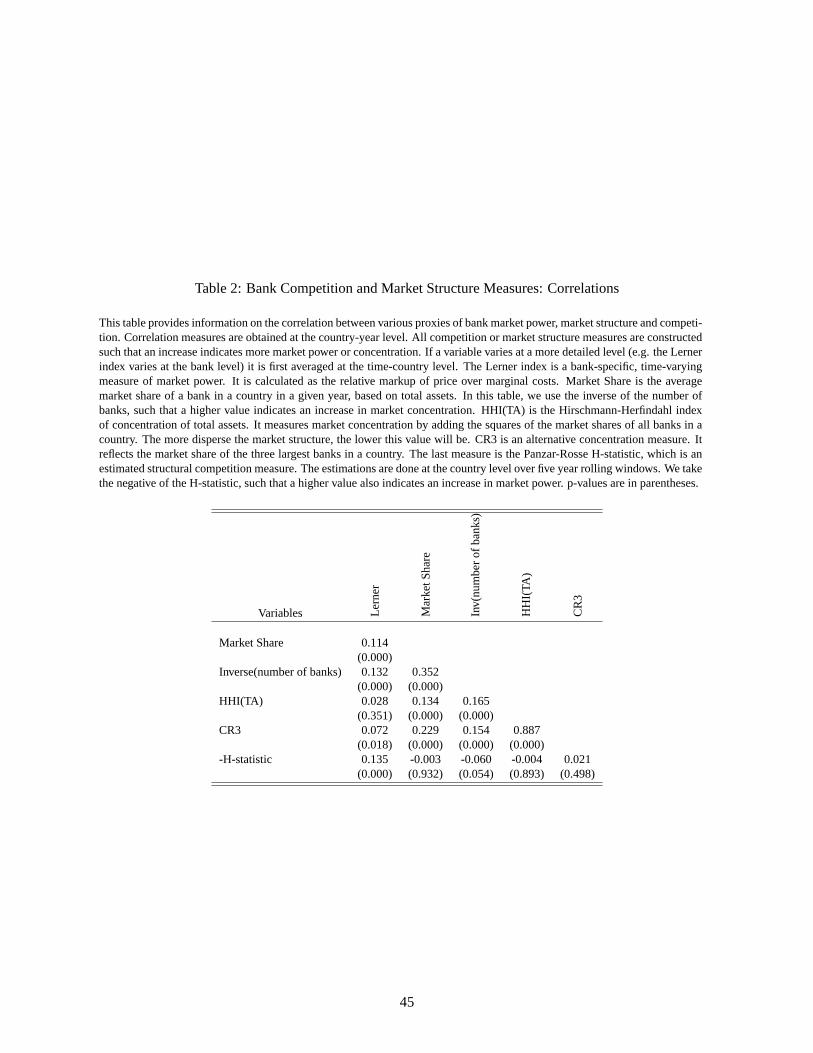
Table 2: Bank Competition and Market Structure Measures: Correlations
This table provides information on the correlation between various proxies of bank market power, market structure and competi-tion. Correlation measures are obtained at the country-year level. All competition or market structure measures are constructedsuch that an increase indicates more market power or concentration. If a variable varies at a more detailed level (e.g. the Lernerindex varies at the bank level) it is first averaged at the time-country level. The Lerner index is a bank-specific, time-varyingmeasure of market power. It is calculated as the relative markup of price over marginal costs. Market Share is the averagemarket share of a bank in a country in a given year, based on total assets. In this table, we use the inverse of the number ofbanks, such that a higher value indicates an increase in market concentration. HHI(TA) is the Hirschmann-Herfindahl indexof concentration of total assets. It measures market concentration by adding the squares of the market shares of all banks in acountry. The more disperse the market structure, the lower this value will be. CR3 is an alternative concentration measure. Itreflects the market share of the three largest banks in a country. The last measure is the Panzar-Rosse H-statistic, which is anestimated structural competition measure. The estimations are done at the country level over five year rolling windows. We takethe negative of the H-statistic, such that a higher value also indicates an increase in market power. p-values are in parentheses.
Variables Lern
er
Mar
ketS
hare
Inv(
num
ber
ofba
nks)
HH
I(TA
)
CR
3
Market Share 0.114(0.000)
Inverse(number of banks) 0.132 0.352(0.000) (0.000)
HHI(TA) 0.028 0.134 0.165(0.351) (0.000) (0.000)
CR3 0.072 0.229 0.154 0.887(0.018) (0.000) (0.000) (0.000)
-H-statistic 0.135 -0.003 -0.060 -0.004 0.021(0.000) (0.932) (0.054) (0.893) (0.498)
45
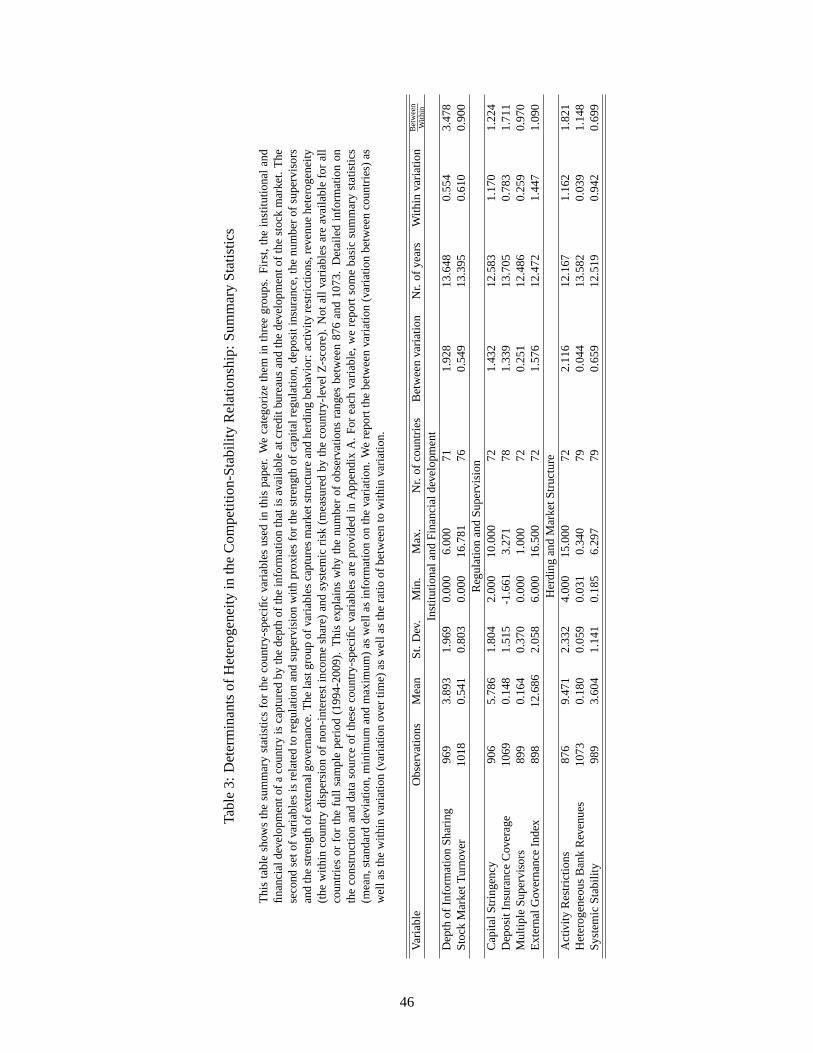
Tabl
e3:
Det
erm
inan
tsof
Het
erog
enei
tyin
the
Com
petit
ion-
Sta
bilit
yR
elat
ions
hip:
Sum
mar
yS
tatis
tics
Thi
sta
ble
show
sth
esu
mm
ary
stat
istic
sfo
rth
eco
untr
y-sp
ecifi
cva
riabl
esus
edin
this
pape
r.W
eca
tego
rize
them
inth
ree
grou
ps.
Firs
t,th
ein
stitu
tiona
land
finan
cial
deve
lopm
ento
faco
untr
yis
capt
ured
byth
ede
pth
ofth
ein
form
atio
nth
atis
avai
labl
eat
cred
itbu
reau
san
dth
ede
velo
pmen
toft
hest
ock
mar
ket.
The
seco
ndse
tofv
aria
bles
isre
late
dto
regu
latio
nan
dsu
perv
isio
nw
ithpr
oxie
sfo
rth
est
reng
thof
capi
talr
egul
atio
n,de
posi
tins
uran
ce,t
henu
mbe
rof
supe
rvis
ors
and
the
stre
ngth
ofex
tern
algo
vern
ance
.T
hela
stgr
oup
ofva
riabl
esca
ptur
esm
arke
tstr
uctu
rean
dhe
rdin
gbe
havi
or:
activ
ityre
stric
tions
,rev
enue
hete
roge
neity
(the
with
inco
untr
ydi
sper
sion
ofno
n-in
tere
stin
com
esh
are)
and
syst
emic
risk
(mea
sure
dby
the
coun
try-
leve
lZ-s
core
).N
otal
lvar
iabl
esar
eav
aila
ble
for
all
coun
trie
sor
for
the
full
sam
ple
perio
d(1
994-
2009
).T
his
expl
ains
why
the
num
ber
ofob
serv
atio
nsra
nges
betw
een
876
and
1073
.D
etai
led
info
rmat
ion
onth
eco
nstr
uctio
nan
dda
taso
urce
ofth
ese
coun
try-
spec
ific
varia
bles
are
prov
ided
inA
ppen
dix
A.
For
each
varia
ble,
we
repo
rtso
me
basi
csu
mm
ary
stat
istic
s(m
ean,
stan
dard
devi
atio
n,m
inim
uman
dm
axim
um)
asw
ella
sin
form
atio
non
the
varia
tion.
We
repo
rtth
ebe
twee
nva
riatio
n(v
aria
tion
betw
een
coun
trie
s)as
wel
las
the
with
inva
riatio
n(v
aria
tion
over
time)
asw
ella
sth
era
tioof
betw
een
tow
ithin
varia
tion.
Varia
ble
Obs
erva
tions
Mea
nS
t.D
ev.
Min
.M
ax.
Nr.
ofco
untr
ies
Bet
wee
nva
riatio
nN
r.of
year
sW
ithin
varia
tion
Bet
wee
nW
ithin
Inst
itutio
nala
ndF
inan
cial
deve
lopm
ent
Dep
thof
Info
rmat
ion
Sha
ring
969
3.89
31.
969
0.00
06.
000
711.
928
13.6
480.
554
3.47
8S
tock
Mar
ketT
urno
ver
1018
0.54
10.
803
0.00
016
.781
760.
549
13.3
950.
610
0.90
0R
egul
atio
nan
dS
uper
visi
onC
apita
lStr
inge
ncy
906
5.78
61.
804
2.00
010
.000
721.
432
12.5
831.
170
1.22
4D
epos
itIn
sura
nce
Cov
erag
e10
690.
148
1.51
5-1
.661
3.27
178
1.33
913
.705
0.78
31.
711
Mul
tiple
Sup
ervi
sors
899
0.16
40.
370
0.00
01.
000
720.
251
12.4
860.
259
0.97
0E
xter
nalG
over
nanc
eIn
dex
898
12.6
862.
058
6.00
016
.500
721.
576
12.4
721.
447
1.09
0H
erdi
ngan
dM
arke
tStr
uctu
reA
ctiv
ityR
estr
ictio
ns87
69.
471
2.33
24.
000
15.0
0072
2.11
612
.167
1.16
21.
821
Het
erog
eneo
usB
ank
Rev
enue
s10
730.
180
0.05
90.
031
0.34
079
0.04
413
.582
0.03
91.
148
Sys
tem
icS
tabi
lity
989
3.60
41.
141
0.18
56.
297
790.
659
12.5
190.
942
0.69
9
46

Tabl
e4:
Det
erm
inan
tsof
Het
erog
enei
tyin
the
Com
petit
ion-
Sta
bilit
yR
elat
ions
hip:
Cor
rela
tion
Tabl
e
Thi
sta
ble
prov
ides
info
rmat
ion
onth
eco
rrel
atio
nbe
twee
nth
eco
untr
y-sp
ecifi
cva
riabl
esus
edth
roug
hout
the
pape
r.T
heva
riabl
esus
edfo
rthi
sta
ble
are
aver
ages
atth
eco
untr
yle
vel.
The
tabl
eco
ntai
nspa
irwis
eco
rrel
atio
nco
effic
ient
sas
wel
las
p-va
lues
(inbr
acke
ts)
that
indi
cate
the
sign
ifica
nce
ofth
eco
rrel
atio
n.W
eal
soin
dica
teth
enu
mbe
rof
coun
trie
sth
atar
eus
edto
calc
ulat
eea
chco
rrel
atio
nco
effic
ient
.D
etai
led
info
rmat
ion
onth
eco
nstr
uctio
nof
thes
eva
riabl
esca
nbe
foun
din
App
endi
xA
.T
hela
stse
tof
row
sco
ntai
nsth
eco
rrel
atio
nbe
twee
nth
eco
untr
ych
arac
teris
tics
and
the
estim
ated
rela
tions
hip
betw
een
mar
ketp
ower
and
bank
soun
dnes
s(a
sre
port
edin
Fig
ure
3(le
ftpa
nel).
Varia
bles
DepthofInformationSharing
StockMarketTurnover
CapitalStringency
DepositInsuranceCoverage
MultipleSupervisors
ExternalGovernance
ActivityRestrictions
Heterogeneity-Revenues
SystemicStability
Sto
ckM
arke
tTur
nove
r0.
260
(0.0
32)
Nb.
Obs
.68
Cap
italS
trin
genc
y-0
.151
0.03
9(0
.231
)(0
.748
)N
b.O
bs.
6570
Dep
osit
Insu
ranc
eC
over
age
0.20
80.
202
-0.1
07(0
.084
)(0
.083
)(0
.374
)N
b.O
bs.
7075
71M
ultip
leS
uper
viso
rs0.
151
0.37
0-0
.093
0.17
3(0
.231
)(0
.002
)(0
.438
)(0
.148
)N
b.O
bs.
6570
7271
Ext
erna
lGov
erna
nce
0.26
90.
074
0.09
8-0
.063
0.05
4(0
.030
)(0
.543
)(0
.412
)(0
.603
)(0
.652
)N
b.O
bs.
6570
7271
72A
ctiv
ityR
estr
ictio
ns0.
045
-0.1
310.
034
0.07
8-0
.064
0.18
1(0
.722
)(0
.281
)(0
.775
)(0
.520
)(0
.593
)(0
.129
)N
b.O
bs.
6570
7271
7272
Het
erog
eneo
usB
ank
Rev
enue
s0.
269
0.11
00.
146
0.07
50.
047
0.14
5-0
.320
(0.0
23)
(0.3
46)
(0.2
20)
(0.5
13)
(0.6
94)
(0.2
24)
(0.0
06)
Nb.
Obs
.71
7672
7872
7272
Sys
tem
icS
tabi
lity
0.11
2-0
.021
0.03
9-0
.146
-0.1
860.
094
-0.2
05-0
.096
(0.3
53)
(0.8
56)
(0.7
47)
(0.2
01)
(0.1
17)
(0.4
32)
(0.0
84)
(0.4
01)
Nb.
Obs
.71
7672
7872
7272
79�
0.27
90.
253
0.06
90.
654
0.11
10.
115
0.51
1-0
.049
0.42
9(0
.019
)(0
.028
)(0
.567
)(0
.000
)(0
.354
)(0
.335
)(0
.000
)(0
.669
)(0
.000
)N
b.O
bs.
7176
7278
7272
7279
79
47

Tabl
e5:
The
Mar
ketP
ower
-Ban
kS
ound
ness
Rel
atio
nshi
p:F
ullS
ampl
eR
egre
ssio
nsT
his
tabl
eco
ntai
nsin
form
atio
non
the
rela
tions
hip
betw
een
bank
com
petit
ion
and
stab
ility
inth
eto
tals
ampl
e.T
heto
tals
ampl
eco
nsis
tsof
79co
untr
ies
and
span
sth
etim
epe
riod
1994
-200
9.B
ank
soun
dnes
s(ln
Z-s
core
)is
the
depe
nden
tvar
iabl
ean
dis
regr
esse
don
aco
mpe
titio
npr
oxy
(Ler
ner
inde
x)an
da
grou
pof
bank
spec
ific
cont
rolv
aria
bles
(incl
udin
gsp
ecia
lizat
ion
dum
mie
s).
For
each
regr
essi
on,
we
cont
rolf
orun
obse
rved
hete
roge
neity
atth
eco
untr
y-ye
arle
velb
yin
clud
ing
coun
try-
year
dum
mie
s.H
ence
,w
eex
ploi
tth
ew
ithin
coun
try-
year
varia
tion
inth
eco
mpe
titio
n-st
abili
tyre
latio
nshi
p.T
hest
anda
rder
rors
are
robu
stan
dcl
uste
red
atth
eco
untr
y-ye
arle
vel.
Als
o,to
miti
gate
the
impa
ctof
reve
rse
caus
ality
,we
use
one
perio
dla
gged
valu
esof
the
inde
pend
entv
aria
bles
.T
hefir
stco
lum
nsh
ows
the
resu
ltsfo
rou
rba
selin
ere
gres
sion
,whe
rew
eus
eou
rpr
efer
red
com
petit
ion
and
stab
ility
mea
sure
,bei
ngth
eLe
rner
inde
xan
dth
eZ
-sco
re.
The
follo
win
gfo
urco
lum
nsco
nfirm
our
base
line
resu
ltsw
hen
usin
gal
tern
ativ
eco
mpe
titio
nor
stab
ility
prox
ies.
Inco
lum
ntw
oan
dth
ree,
we
use
two
subc
ompo
nent
sof
the
Z-s
core
asal
tern
ativ
eris
km
easu
res,
bein
gth
e(n
egat
ive
ofth
e)st
anda
rdde
viat
ion
ofa
bank
’sre
turn
onas
sets
and
the
equi
tyov
eras
sets
ratio
.U
sing
thes
ein
dica
tors
,we
aver
tpot
entia
lspu
rious
corr
elat
ion
prob
lem
sdu
eto
usin
gba
nkpr
ofits
for
calc
ulat
ing
both
the
Lern
erin
dex
and
the
Z-s
core
.In
the
four
thco
lum
n,th
eor
igin
alZ
-sco
rew
ithth
evo
latil
ityof
retu
rns
calc
ulat
edba
sed
ona
thre
eye
arro
lling
win
dow
isre
plac
edby
aZ
-sco
rew
here
the
vola
tility
ofth
ere
turn
sis
calc
ulat
edus
ing
afiv
eye
arro
lling
win
dow
.In
colu
mn
five,
we
run
are
gres
sion
sim
ilar
toth
efir
stco
lum
n,bu
twe
inst
rum
entt
heLe
rner
inde
xby
loan
grow
th,t
heco
st-in
com
era
tioan
dan
inte
ract
ion
term
betw
een
the
Her
finda
hlin
dex
(bas
edon
tota
lass
ets)
and
aba
nks
mar
ket
shar
e(a
lso
base
don
tota
lass
ets)
.In
addi
tion,
we
now
also
incl
ude
bank
fixed
effe
cts.
Whi
leus
ing
lagg
edin
depe
nden
tva
riabl
esm
itiga
tes
endo
gene
ityco
ncer
nsdu
eto
reve
rse
caus
ality
,th
isad
ditio
nalc
heck
shou
ldm
itiga
teen
doge
neity
conc
erns
crea
ted
bya
poss
ible
omitt
edva
riabl
e.In
colu
mn
six
we
repl
ace
the
Lern
erin
dex
with
itstw
osu
bcom
pone
nts,
bein
gth
eav
erag
epr
ice
ofba
nkac
tiviti
esan
dm
argi
nalc
ost.
Inco
lum
nse
ven
and
eigh
twe
cont
rolf
orm
arke
tsha
reus
ing
anin
dica
tor
base
don
tota
lloa
nsor
tota
lass
ets.
Col
umn
nine
show
sth
ere
sults
whe
nle
avin
gou
tloa
nlo
sspr
ovis
ions
toin
tere
stin
com
ean
dan
nual
grow
thin
tota
lass
ets
asco
ntro
lvar
iabl
es.
VAR
IAB
LES
ln(Z
-sco
re)
-ln(s
d(R
OA
))E
q/T
Aln
(Z-s
core
5)ln
(Z-s
core
)ln
(Z-s
core
)ln
(Z-s
core
)ln
(Z-s
core
)ln
(Z-s
core
)Le
rner
1.94
6***
0.84
1***
7.44
3***
1.84
5***
1.81
4***
1.98
7***
1.98
8***
2.32
4***
(0.1
05)
(0.1
17)
(0.4
87)
(0.1
14)
(0.0
862)
(0.1
09)
(0.1
09)
(0.1
39)
Sha
reof
Who
lesa
leF
undi
ng0.
0912
0.02
421.
926*
**0.
0677
-0.0
200
0.08
990.
143
0.14
30.
0794
(0.1
38)
(0.1
44)
(0.4
52)
(0.1
26)
(0.0
837)
(0.1
29)
(0.1
15)
(0.1
15)
(0.1
44)
Loan
sto
Tota
lAss
ets
-0.0
566
0.17
1**
-4.6
64**
*-0
.098
2-0
.116
0.08
24-0
.033
6-0
.034
8-0
.147
*(0
.071
5)(0
.078
8)(0
.345
)(0
.084
3)(0
.072
0)(0
.072
3)(0
.072
2)(0
.072
1)(0
.078
2)N
on-I
nter
estR
even
ueS
hare
-1.0
61**
*-1
.406
***
3.24
7***
-1.0
82**
*-0
.608
***
-0.8
55**
*-1
.020
***
-1.0
20**
*-1
.163
***
(0.0
844)
(0.1
15)
(0.4
80)
(0.0
870)
(0.0
654)
(0.0
695)
(0.0
800)
(0.0
800)
(0.0
859)
ln(T
otal
Ass
ets)
0.02
65**
*0.
137*
**-1
.304
***
0.02
49**
*0.
0045
20.
0255
***
0.01
85*
(0.0
0947
)(0
.011
5)(0
.070
3)(0
.009
09)
(0.0
179)
(0.0
0907
)(0
.010
1)Lo
anLo
ssP
rovi
sion
sto
Inte
rest
Inco
me
-0.5
55**
*-0
.727
***
1.82
2***
-0.4
23**
*-0
.203
***
-0.8
20**
*-0
.532
***
-0.5
32**
*(0
.073
7)(0
.073
8)(0
.219
)(0
.080
5)(0
.041
0)(0
.108
)(0
.073
5)(0
.073
4)A
nnua
lGro
wth
inTo
talA
sset
s-0
.472
***
-0.4
02**
*-1
.035
***
-0.3
78**
*-0
.198
***
-0.5
85**
*-0
.465
***
-0.4
65**
*(0
.043
6)(0
.056
9)(0
.269
)(0
.045
1)(0
.019
8)(0
.053
4)(0
.042
5)(0
.042
5)C
onst
ant
3.87
5***
1.09
2***
19.0
9***
3.57
2***
4.29
6***
4.01
7***
4.01
8***
3.81
7***
(0.0
885)
(0.1
14)
(0.5
94)
(0.0
979)
(0.0
911)
(0.0
610)
(0.0
610)
(0.0
898)
Ave
rage
Pric
eof
bank
activ
ities
7.84
6***
(0.8
62)
Mar
gina
lCos
t-1
2.58
***
(1.0
83)
Mar
ketS
hare
ofLo
ans
-0.1
76(0
.228
)M
arke
tSha
reof
Tota
lAss
ets
-0.2
21(0
.233
)O
bser
vatio
ns80
822
8082
280
822
5948
476
,592
8082
280
822
8082
280
822
R-s
quar
ed0.
336
0.45
20.
437
0.37
50.
052
0.32
20.
335
0.33
50.
326
Type
dum
mie
sY
ES
YE
SY
ES
YE
SY
ES
YE
SY
ES
YE
ST
ime
xC
ount
rydu
mm
ies
YE
SY
ES
YE
SY
ES
YE
SY
ES
YE
SY
ES
YE
SB
ank
FE
NO
NO
NO
NO
YE
SN
ON
ON
ON
ON
umbe
rof
Cou
ntrie
s79
7979
7979
7979
7979
Rob
usts
tand
ard
erro
rsin
pare
nthe
ses
***
p<
0.01
,**
p<0.
05,*
p<0.
1
48

Tabl
e6:
Det
erm
inan
tsof
Het
erog
enei
tyin
the
Com
petit
ion-
Sta
bilit
yR
elat
ions
hip:
Reg
ress
ion
Res
ults
Thi
sta
ble
cont
ains
info
rmat
ion
onth
edr
iver
sof
the
rela
tions
hip
betw
een
com
petit
ion
and
stab
ility
inth
eto
tals
ampl
e.T
hest
artin
gpo
intf
orth
ere
gres
sion
sin
this
tabl
eis
the
base
line
regr
essi
onin
tabl
e5,
i.e.
are
gres
sion
ofa
stab
ility
mea
sure
(Z-s
core
)on
the
Lern
erin
dex
and
agr
oup
ofba
nk-s
peci
ficco
ntro
lvar
iabl
es.
Inth
efir
stni
neco
lum
ns,w
ead
dan
inte
ract
ion
term
ofth
eLe
rner
inde
xw
itha
coun
try-
spec
ific
char
acte
ristic
toth
eba
selin
ere
gres
sion
.In
the
tent
hco
lum
n,w
esh
owth
ere
sult
whe
nw
ead
dal
lint
erac
tion
term
ssi
mul
tane
ousl
y.T
hela
stco
lum
nsh
ows
the
resu
ltsw
hen
usin
gan
alte
rnat
ive
risk
mea
sure
,the
(neg
ativ
eof
the)
stan
dard
devi
atio
nof
the
retu
rnon
asse
ts.
We
empl
oyth
epa
nels
truc
ture
ofth
eda
taba
sean
dco
ntro
lfor
fixed
hete
roge
neity
atth
eco
untr
y-ye
arle
velb
yin
tera
ctin
gco
untr
yan
dtim
efix
edef
fect
s.W
eal
soad
dba
nk-t
ype
dum
mie
sto
the
regr
essi
ons.
Fur
ther
mor
e,to
miti
gate
the
impa
ctof
reve
rse
caus
ality
,w
eus
eon
epe
riod
lagg
edva
lues
ofth
ein
depe
nden
tva
riabl
es.
The
stan
dard
erro
rsar
ero
bust
and
clus
tere
dat
the
coun
try-
year
leve
l.F
orea
seof
com
para
bilit
y(in
term
sof
econ
omic
sign
ifica
nce)
,al
lcou
ntry
-spe
cific
varia
bles
have
been
norm
aliz
edto
have
zero
mea
nan
dun
itva
rianc
e.D
iffer
ence
sin
the
num
ber
ofco
untr
ies
used
inth
ere
gres
sion
sar
edu
eto
diffe
renc
esin
data
avai
labi
lity
for
the
coun
try-
spec
ific
varia
bles
.In
the
right
hand
side
pane
l,w
epr
ovid
ean
indi
catio
nof
the
econ
omic
effe
ctof
each
(sta
tistic
ally
sign
ifica
nt)
char
acte
ristic
onth
em
arke
tpo
wer
-ban
kso
undn
ess
rela
tions
hip.
We
repo
rtth
ees
timat
edim
pact
ofth
eLe
rner
inde
xon
bank
stab
ility
for
coun
trie
sth
atdi
ffer
from
the
aver
age
coun
try
inon
edi
men
sion
only
.W
ere
port
the
impa
ctfo
rth
eco
untr
ies
corr
espo
ndin
gw
ithth
e5t
han
dth
e95
thpe
rcen
tile
whe
nra
nkin
gth
emac
cord
ing
toth
eco
untr
ysp
ecifi
cch
arac
teris
ticof
inte
rest
.F
orea
chch
arac
teris
tic,
we
repo
rtth
eim
pact
ofLe
rner
onbo
thth
eZ
-sco
re(fi
rstr
ow)
and
(the
nega
tive
of)
profi
tvol
atili
ty(s
econ
dro
w).
The
two
case
sm
entio
ned
inth
elo
wer
part
ofth
ese
colu
mns
show
the
impa
ctof
ach
ange
inco
mpe
titio
nco
rres
pond
ing
with
the
follo
win
gtw
osc
enar
ios.
Cas
e1
corr
espo
nds
toth
eef
fect
for
aco
untr
yth
atis
aver
age
inea
chdi
men
sion
.C
ase
2re
sem
bles
afic
titio
uspo
st-c
risis
scen
ario
with
gene
rous
depo
siti
nsur
ance
sche
mes
(1.6
5st
anda
rdde
viat
ions
incr
ease
)an
dst
rong
erre
stric
tions
onba
nkac
tiviti
es(a
1.65
stan
dard
devi
atio
nin
crea
se),
refle
ctin
gre
cent
regu
lato
ryre
form
sor
refo
rmsu
gges
tions
.
VAR
IAB
LES
lnZ
scor
e3ln
Zsc
ore3
lnZ
scor
e3ln
Zsc
ore3
lnZ
scor
e3ln
Zsc
ore3
lnZ
scor
e3ln
Zsc
ore3
lnZ
scor
e3ln
Zsc
ore3
-ln(s
d(R
OA
))Im
pact
ofIf
X=
Lern
eron#
p5
p9
5Le
rner
inde
x1.
654*
**1.
631*
**1.
924*
**1.
650*
**1.
853*
**1.
946*
**1.
993*
**1.
904*
**1.
834*
**1.
384*
**0.
199*
(0.1
03)
(0.1
19)
(0.1
02)
(0.0
980)
(0.1
23)
(0.1
08)
(0.0
864)
(0.0
930)
(0.1
28)
(0.1
21)
(0.1
05)
Dep
thof
Info
rmat
ion
Sha
ring
0.59
8***
0.25
3*0.
322*
**ln
Zsc
ore3
0.8
84
1.6
54
xLe
rner
(0.1
10)
(0.1
46)
(0.1
24)
-ln(s
d(R
OA
))-0
.43
70
.54
3S
tock
Mar
ketT
urno
ver
0.39
8***
0.16
7**
0.13
3*ln
Zsc
ore3
1.2
70
1.8
53
xLe
rner
(0.0
671)
(0.0
796)
(0.0
796)
-ln(s
d(R
OA
))0
.10
70
.57
4C
apita
lStr
inge
ncy
0.12
80.
0436
0.02
52x
Lern
er(0
.105
)(0
.088
1)(0
.095
1)D
epos
itIn
sura
nce
Cov
erag
e0.
761*
**0.
660*
**0.
644*
**ln
Zsc
ore3
0.9
71
2.0
52
xLe
rner
(0.0
905)
(0.1
25)
(0.1
18)
-ln(s
d(R
OA
))-0
.20
30
.85
0M
ultip
leS
uper
viso
rs0.
217*
*-0
.038
80.
103
xLe
rner
(0.0
936)
(0.0
748)
(0.0
764)
Ext
erna
lGov
erna
nce
Inde
x0.
154
-0.0
0701
0.05
54x
Lern
er(0
.150
)(0
.126
)(0
.121
)A
ctiv
ityR
estr
ictio
ns0.
645*
**0.
283*
**0.
426*
**ln
Zsc
ore3
0.8
16
1.6
66
xLe
rner
(0.1
05)
(0.1
01)
(0.1
03)
-ln(s
d(R
OA
))-0
.65
50
.62
3H
eter
ogen
eous
Ban
kR
even
ues
-0.4
87**
*-0
.081
00.
0928
xLe
rner
(0.1
15)
(0.1
30)
(0.1
32)
Sys
tem
icS
tabi
lity
0.29
8***
0.17
1**
0.11
6ln
Zsc
ore3
1.2
35
1.7
03
xLe
rner
(0.1
02)
(0.0
859)
(0.0
833)
-ln(s
d(R
OA
))0
.09
70
.41
6C
onst
ant
3.86
3***
3.87
0***
3.89
2***
3.89
4***
3.88
4***
3.89
1***
3.91
2***
3.85
7***
3.88
6***
3.91
4***
1.19
5***
(0.0
915)
(0.0
934)
(0.0
917)
(0.0
895)
(0.0
945)
(0.0
929)
(0.0
969)
(0.0
892)
(0.0
917)
(0.1
01)
(0.1
30)
Ca
se1
Ca
se2
Obs
erva
tions
7936
580
281
7753
380
767
7742
577
481
7696
780
821
7941
075
333
7533
3 ln
Zsc
ore
31
.38
42
.94
0R
-squ
ared
0.33
30.
337
0.32
50.
339
0.32
50.
324
0.32
70.
337
0.33
10.
320
0.43
7-ln
(sd
(RO
A))
0.1
99
1.9
64
Con
trol
Varia
bles
YE
SY
ES
YE
SY
ES
YE
SY
ES
YE
SY
ES
YE
SY
ES
YE
STy
pedu
mm
ies
YE
SY
ES
YE
SY
ES
YE
SY
ES
YE
SY
ES
YE
SY
ES
YE
SY
ear
xC
ount
rydu
mm
ies
YE
SY
ES
YE
SY
ES
YE
SY
ES
YE
SY
ES
YE
SY
ES
YE
SN
umbe
rof
Cou
ntrie
s71
7672
7872
7272
7979
6060
Rob
usts
tand
ard
erro
rsin
pare
nthe
ses
***
p<
0.01
,**
p<0.
05,*
p<0.
1
49

Table 7: Failing Banks and Banking crises
This table shows regression results for the competition-stability trade-off while controlling for the impact of distressedbanks and banking crises. The first column replicates the results from column 10 in table 6, i.e. regressing the Z-score onthe Lerner index and all interaction terms between the Lerner index and the country-specific variables, while controllingfor bank-specific characteristics and country-year fixed effects. In the second regression, we add an interaction termof the Lerner index with a distressed exit dummy. The distressed exit dummy equals one in the two years before abank leaves the sample and if the bank had a negative ROA in that period. In this way, we only capture the banks thatactually were in distress before they leave the sample. In the third regression, we only include banks that did not exit thesample due to a distressed situation (Distressed Exit Dummy =0). In columns four and five we control for the potentialimpact of a banking crisis. In column 4 we interact the Lerner index with a systemic banking crisis dummy defined asin Laeven and Valencia (2010). Column 5 shows the results when limiting our sample to the pre-2007 period. For eachregression, error terms are clustered at the country-year level.
VARIABLES Baseline Distressed Exit Not Distressed Crisis Indicator Pre2007
Lerner index 1.384*** 1.214*** 1.090*** 1.383*** 1.477***(0.121) (0.126) (0.137) (0.117) (0.116)
Depth of Information Sharing 0.253* 0.261* 0.313** 0.253* 0.191x Lerner (0.146) (0.143) (0.159) (0.146) (0.136)Stock Market Turnover 0.167** 0.0906 0.0291 0.166* 0.0440x Lerner (0.0796) (0.0733) (0.0946) (0.0919) (0.103)Capital Stringency 0.0436 0.0848 0.137 0.0436 0.0713x Lerner (0.0881) (0.0848) (0.101) (0.0876) (0.0817)Deposit Insurance Coverage 0.660*** 0.602*** 0.759*** 0.659*** 0.610***x Lerner (0.125) (0.115) (0.138) (0.153) (0.114)Multiple Supervisors -0.0388 -0.0490 -0.0456 -0.0389 -0.0793x Lerner (0.0748) (0.0696) (0.0833) (0.0747) (0.0778)External Governance Index -0.00701 -0.0380 -0.0427 -0.00719 -0.163x Lerner (0.126) (0.122) (0.143) (0.130) (0.125)Activity Restrictions 0.283*** 0.236** 0.309*** 0.283*** 0.293***x Lerner (0.101) (0.0969) (0.104) (0.100) (0.103)Heterogeneous Bank Revenues -0.0810 -0.0998 -0.00480 -0.0809 -0.0145x Lerner (0.130) (0.126) (0.136) (0.132) (0.132)Systemic Stability 0.171** 0.241*** 0.234** 0.172 0.313***x Lerner (0.0859) (0.0752) (0.0954) (0.120) (0.0929)Last Observation Distressed 1.399***x Lerner (0.212)Systemic Banking Crisis Dummy 0.00573x Lerner (0.413)Constant 3.914*** 3.958*** 3.990*** 3.914*** 3.840***
(0.101) (0.0979) (0.0974) (0.101) (0.0957)
Observations 75333 75333 73233 75333 61870R-squared 0.320 0.322 0.285 0.320 0.305Control Variables YES YES YES YES YESType dummies YES YES YES YES YESYear x Country dummies YES YES YES YES YES
Robust standard errors in parentheses*** p <0.01, ** p<0.05, * p<0.1
50

Table 8: Robustness test - Contestability, globalization, too big to fail and bank specialisation
This table shows regression results for the competition-stability trade-off while controlling for the potential impact of nonlinearities, abanks’ market share, too big to fail status and bank specialisation. The first column replicates the results from column 10 in table 6, i.e.regressing the Z-score on the Lerner index and all interaction terms between the Lerner index and the country-specific variables, whilecontrolling for bank-specific characteristics and country-year fixed effects. In the second column, we limit our sample to commercial banksonly. Using this subset limits the possibility that our results are driven by differences in regulation for the different types of banks in ourbaseline sample. In the following columns, we expand our baseline regression with extra interaction terms. In the third column we controlfor non-linearities in the competition-stability relationship by adding a squared Lerner index. Doing so, we reduce the possibility that theother interaction terms are picking up a non-linear effect. In regression four and five we take into account the potential impact of a banks’market share by adding an interaction term of the Lerner index with a banks‘ market share (column 4) or a dummy indicating whetherthe bank has a market share that is higher than 10 percent (column 5). In the following two regressions, we control for the impact oftoo-big-to-fail banks. We proxy too-big-to-fail by the ratio of bank size to a country’s GDP. We construct a dummy indicating whether thisratio is higher than 10 or 25 percent. We then interact this dummy with the Lerner index to see whether these banks react differently to achange in competition. In the last column we control for the potential impact of the presence of foreign banks. For each regression, errorterms are clustered at the country-year level.
VARIABLES Baseline Commercial Lerner Market Share Large TBTF10 TBTF25 ForeignBanks Market Share Banks
Lerner 1.384*** 1.429*** 1.725*** 1.748*** 1.730*** 1.734*** 1.732*** 1.604***(0.121) (0.116) (0.108) (0.123) (0.113) (0.112) (0.110) (0.105)
Depth of Information Sharing 0.253* 0.333** 0.147 0.141 0.146 0.145 0.146 0.0808x Lerner (0.146) (0.142) (0.122) (0.125) (0.123) (0.123) (0.123) (0.127)Stock Market Turnover 0.167** 0.244*** 0.137** 0.130* 0.135** 0.134** 0.135** 0.0945x Lerner (0.0796) (0.0725) (0.0677) (0.0679) (0.0677) (0.0676) (0.0676) (0.0715)Capital Stringency 0.0436 0.0588 0.00250 -0.00243 0.00118 -0.000848 -0.00122 -0.0520x Lerner (0.0881) (0.0888) (0.0779) (0.0772) (0.0775) (0.0775) (0.0776) (0.0801)Deposit Insurance Coverage 0.660*** 0.587*** 0.389*** 0.388*** 0.389*** 0.387*** 0.385*** 0.320***x Lerner (0.125) (0.129) (0.111) (0.112) (0.111) (0.111) (0.111) (0.112)Multiple Supervisors -0.0388 -0.0857 0.0235 0.0229 0.0234 0.0231 0.0229 0.0727x Lerner (0.0748) (0.0690) (0.0664) (0.0662) (0.0663) (0.0663) (0.0664) (0.0706)External Governance Index -0.00701 -0.00473 -0.0125 -0.00846 -0.0113 -0.00910 -0.00977 0.144x Lerner (0.126) (0.134) (0.106) (0.105) (0.105) (0.105) (0.105) (0.104)Activity Restrictions 0.283*** 0.126 0.249*** 0.254*** 0.250*** 0.250*** 0.249*** 0.281***x Lerner (0.101) (0.0977) (0.0880) (0.0887) (0.0883) (0.0882) (0.0880) (0.0884)Heterogeneous Bank Revenues -0.0810 -0.399*** -0.0712 -0.0719 -0.0716 -0.0713 -0.0699 -0.0162x Lerner (0.130) (0.104) (0.114) (0.113) (0.113) (0.114) (0.114) (0.115)Systemic Stability 0.171** 0.0834 0.353*** 0.348*** 0.352*** 0.353*** 0.354*** 0.341***x Lerner (0.0859) (0.0666) (0.0729) (0.0732) (0.0730) (0.0731) (0.0730) (0.0749)Lerner -3.082*** -3.077*** -3.081*** -3.080*** -3.081*** -3.030***x Lerner (0.314) (0.315) (0.314) (0.314) (0.314) (0.310)Market Share -1.509x Lerner (1.687)Dummy Large Market Share -0.0918x Lerner (0.191)I(Size/GDP> 10%) -0.191x Lerner (0.223)I(Size/GDP> 25%) -0.355x Lerner (0.285)Foreign banks -0.338***x Lerner (0.0920)Constant 3.914*** 4.041*** 4.044*** 4.038*** 4.043*** 4.040*** 4.041*** 4.043***
(0.101) (0.0748) (0.0919) (0.0953) (0.0933) (0.0942) (0.0933) (0.0944)
Observations 75333 38134 75333 75333 75333 75333 75333 73669R-squared 0.320 0.304 0.328 0.328 0.328 0.328 0.328 0.328Control Variables YES YES YES YES YES YES YES YESType dummies YES NO YES YES YES YES YES YESYear x Country dummies YES YES YES YES YES YES YES YES
Robust standard errors in parentheses*** p <0.01, ** p<0.05, * p<0.1
51

AA
ppen
dix
-C
ount
ry-s
peci
ficC
hara
cter
istic
s:D
escr
iptio
nan
dS
ourc
e
Varia
ble
Sou
rce
Des
crip
tion
Inst
itutio
nala
ndfin
anci
alde
velo
pmen
tD
epth
ofIn
form
atio
nS
harin
gD
oing
Bus
ines
sda
taba
seS
tren
gth
ofth
ein
form
atio
nco
nten
toft
hecr
edit
bure
aus
Sto
ckM
arke
tTur
nove
rF
inan
cial
stru
ctur
eda
taba
seR
atio
ofth
eva
lue
ofto
tals
hare
str
aded
Bec
k,D
emirg
uc-K
unt,
and
Levi
ne(2
010)
toav
erag
ere
alm
arke
tcap
italiz
atio
nR
egul
atio
nan
dS
uper
visi
onC
apita
lStr
inge
ncy
Ban
kre
gula
tion
and
supe
rvis
ion
data
base
The
stre
ngth
ofca
pita
lreg
ulat
ion
ina
coun
try
Bar
thet
al.
(200
0,20
03,2
008)
Dep
osit
Insu
ranc
eco
vera
geD
epos
itin
sura
nce
arou
ndth
ew
orld
data
base
,D
epos
itin
sura
nce
cove
rage
rela
tive
toG
DP
per
capi
taD
emirg
uc-K
unt,
Kar
acao
vali,
and
Laev
en(2
005)
Mul
tiple
supe
rvis
ors
Ban
kre
gula
tion
and
supe
rvis
ion
data
base
Dum
my
equa
lto
one
whe
nth
ere
are
Bar
thet
al.
(200
0,20
03,2
008)
mul
tiple
bank
supe
rvis
ors
Ext
erna
lgov
erna
nce
inde
xB
ank
regu
latio
nan
dsu
perv
isio
nda
taba
seT
hest
reng
thof
exte
rnal
audi
tors
,fina
ncia
lsta
tem
ent
Bar
thet
al.
(200
0,20
03,2
008)
tran
spar
ancy
,and
the
exis
tenc
eof
anex
tern
alra
ting
Her
ding
and
Mar
ketS
truc
ture
Act
ivity
rest
rictio
nsB
ank
regu
latio
nan
dsu
perv
isio
nda
taba
seD
egre
eto
whi
chba
nks
can
part
icip
ate
Bar
thet
al.
(200
0,20
03,2
008)
inva
rious
non-
inte
rest
inco
me
activ
ities
.H
eter
ogen
eous
Ban
kR
even
ues
Ban
ksco
pe,o
wn
calc
ulat
ions
With
inye
ar,w
ithin
coun
try
stan
dard
devi
atio
nof
non-
inte
rest
inco
me
shar
eS
yste
mic
Sta
bilit
yB
anks
cope
,ow
nca
lcul
atio
nsZ
-sco
reat
the
coun
try
leve
l
52

BA
ppen
dix
-C
ount
ryLa
bels
,Ler
ner
inde
xan
dZ
-sco
reby
coun
try
Thi
sta
ble
show
sth
eav
erag
eLe
rner
inde
x,Z
-sco
rean
dco
nditi
onal
mar
ket
pow
er-s
tabi
lity
corr
elat
ion
coef
ficie
ntfo
rea
chco
untr
yin
our
sam
ple.
The
tota
lsam
ple
cons
ists
of79
coun
trie
s.W
eca
lcul
ated
the
Lern
erin
dex
and
the
Z-s
core
onth
eba
nk-y
ear
leve
land
then
aver
aged
byco
untr
y.T
heco
nditi
onal
corr
elat
ion
coef
ficie
nteq
uals
the
coef
ficie
ntof
the
Lern
erin
dex
whe
nru
nnin
gco
untr
y-by
-cou
ntry
regr
essi
ons
ofth
eZ
-sco
reon
the
Lern
erin
dex
and
agr
oup
ofba
nk-s
peci
ficco
ntro
lvar
iabl
esw
hile
also
cont
rolli
ngfo
rtim
efix
edef
fect
s.C
ount
ryC
ount
ryco
deLe
rner
ln(Z
scor
e)C
ond.
Cor
r.C
ount
ryC
ount
ryco
deLe
rner
ln(Z
scor
e)C
ond.
Cor
r.A
rgen
tina
AR
0.08
22.
576
1.39
8La
tvia
LV0.
176
2.91
70.
506
Arm
enia
AM
0.19
93.
326
0.17
4Lu
xem
bour
gLU
0.09
83.
746
-2.4
04A
ustr
alia
AU
0.11
73.
665
1.37
9M
aced
onia
,FY
RM
K0.
110
3.61
71.
365
Aus
tria
AT0.
114
3.92
92.
105
Mal
aysi
aM
Y0.
184
3.45
62.
539
Ban
glad
esh
BD
0.13
83.
015
3.14
6M
aurit
ius
MU
0.16
83.
323
3.61
3B
elar
usB
Y0.
172
3.08
61.
547
Mex
ico
MX
0.00
32.
577
-0.2
85B
elgi
umB
E0.
067
3.88
21.
970
Mol
dova
MD
0.21
43.
245
0.92
8B
oliv
iaB
O0.
030
2.91
91.
185
Nep
alN
P0.
164
3.48
93.
677
Bra
zil
BR
0.16
12.
814
1.75
6N
ethe
rland
sN
L0.
151
4.02
30.
924
Bul
garia
BG
0.11
63.
550
1.75
1N
iger
iaN
G0.
165
2.89
42.
717
Can
ada
CA
0.11
13.
792
2.42
6N
orw
ayN
O0.
186
3.73
73.
585
Chi
leC
L0.
187
3.59
31.
916
Pak
ista
nP
K0.
078
3.14
41.
961
Chi
naC
N0.
116
3.59
8-1
.272
Pan
ama
PA
0.14
03.
692
1.21
6C
olom
bia
CO
0.05
22.
700
3.71
9P
arag
uay
PY
0.18
82.
933
1.29
2C
osta
Ric
aC
R0.
067
3.81
90.
310
Per
uP
E0.
089
3.34
80.
652
Cro
atia
HR
0.11
33.
324
2.11
4P
hilip
pine
sP
H0.
114
3.87
53.
195
Cyp
rus
CY
0.10
62.
709
2.78
6P
olan
dP
L0.
126
3.15
90.
332
Cze
chR
epub
licC
Z0.
102
3.15
13.
614
Por
tuga
lP
T0.
078
3.61
22.
442
Den
mar
kD
K0.
191
3.57
82.
032
Rom
ania
RO
0.11
42.
861
0.72
0D
omin
ican
Rep
ublic
DO
0.00
03.
156
1.72
2R
ussi
anF
eder
atio
nR
U0.
117
3.29
6-0
.136
Ecu
ador
EC
0.08
13.
129
1.62
0S
audi
Ara
bia
SA
0.30
33.
860
1.86
3E
lSal
vado
rS
V0.
083
3.83
3-1
.996
Ser
bia
RS
-0.0
392.
726
0.19
6F
ranc
eF
R0.
091
3.93
52.
991
Sin
gapo
reS
G0.
240
3.86
8-0
.235
Ger
man
yD
E0.
083
4.68
21.
032
Slo
vak
Rep
ublic
SK
0.06
73.
095
2.30
6G
hana
GH
0.21
52.
777
2.49
9S
love
nia
SI
0.13
53.
561
2.91
9G
reec
eG
R0.
126
2.93
32.
679
Sou
thA
fric
aZ
A0.
114
3.36
30.
690
Hon
dura
sH
N0.
169
3.84
7-0
.868
Spa
inE
S0.
144
4.20
42.
520
Hon
gK
ong
SA
R,C
hina
HK
0.17
73.
752
1.33
8S
riLa
nka
LK0.
180
3.09
25.
867
Hun
gary
HU
0.12
53.
180
2.02
3S
wed
enS
E0.
232
3.67
3-0
.089
Icel
and
IS0.
172
2.70
22.
644
Sw
itzer
land
CH
0.17
74.
969
1.36
2In
dia
IN0.
152
3.26
43.
502
Tanz
ania
TZ
0.14
62.
757
1.52
0In
done
sia
ID0.
065
3.08
92.
110
Tha
iland
TH
-0.0
502.
419
3.09
1Ir
elan
dIE
0.09
93.
579
0.42
1T
unis
iaT
N0.
111
3.26
73.
984
Isra
elIL
0.11
43.
837
-1.2
96T
urke
yT
R0.
174
2.72
21.
292
Italy
IT0.
154
4.14
92.
029
Ukr
aine
UA
0.11
02.
983
0.71
2Ja
pan
JP0.
040
3.52
62.
647
Uni
ted
Kin
gdom
GB
0.11
53.
758
1.26
0K
azak
hsta
nK
Z0.
104
2.99
81.
592
Uni
ted
Sta
tes
US
0.16
74.
092
2.46
9K
enya
KE
0.14
43.
430
3.50
3U
rugu
ayU
Y0.
037
2.36
82.
467
Kor
ea,R
ep.
KR
0.12
02.
824
1.24
7Ve
nezu
ela,
RB
VE
0.18
22.
719
0.64
9V
ietn
amV
N0.
180
3.82
00.
627
53
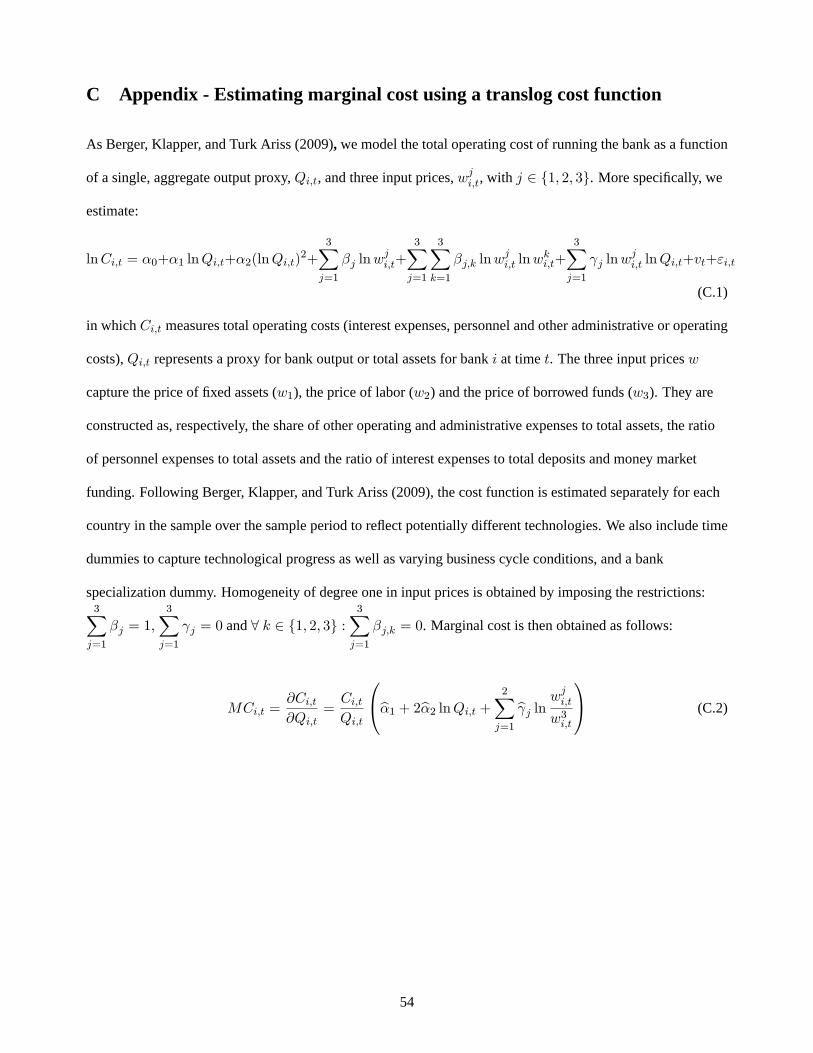
C Appendix - Estimating marginal cost using a translog cost function
As Berger, Klapper, and Turk Ariss (2009), we model the total operating cost of running the bank as a function
of a single, aggregate output proxy,Qi;t, and three input prices,wji;t, with j 2 f1; 2; 3g. More specifically, we
estimate:
lnCi;t = �0+�1 lnQi;t+�2(lnQi;t)2+
3Xj=1
�j lnwji;t+
3Xj=1
3Xk=1
�j;k lnwji;t lnw
ki;t+
3Xj=1
j lnwji;t lnQi;t+vt+"i;t
(C.1)
in whichCi;t measures total operating costs (interest expenses, personnel and other administrative or operating
costs),Qi;t represents a proxy for bank output or total assets for banki at timet. The three input pricesw
capture the price of fixed assets (w1), the price of labor (w2) and the price of borrowed funds (w3). They are
constructed as, respectively, the share of other operating and administrative expenses to total assets, the ratio
of personnel expenses to total assets and the ratio of interest expenses to total deposits and money market
funding. Following Berger, Klapper, and Turk Ariss (2009), the cost function is estimated separately for each
country in the sample over the sample period to reflect potentially different technologies. We also include time
dummies to capture technological progress as well as varying business cycle conditions, and a bank
specialization dummy. Homogeneity of degree one in input prices is obtained by imposing the restrictions:3Xj=1
�j = 1;
3Xj=1
j = 0 and8 k 2 f1; 2; 3g :3Xj=1
�j;k = 0. Marginal cost is then obtained as follows:
MCi;t =@Ci;t@Qi;t
=Ci;tQi;t
0@b�1 + 2b�2 lnQi;t + 2Xj=1
b j ln wji;tw3i;t
1A (C.2)
54