time use in economic and non economic activities by men and women in a few villages in india
TRANSCRIPT

Division of Agricultural Economics, IARI
Time use in economic and non economic activities by men and women in a few villages in India
A Amarender ReddyPrincipal Scientist(Agricultural Economics)
Indian Agricultural Research Institute, New DelhiAnugula N Reddy
National University of Educational Planning and Administration New Delhi
Division of Agricultural Economics, IARI
Objectives
• To assess the labour supply and its determining factors in various economic and non-economic activities in rural India
• To examine the influence of different socioeconomic and personal characteristics of workers on men’s and women’s wage rates
• To examine the determinants of labour market segmentation in different occupations.

Division of Agricultural Economics, IARI
Data
• The data from Rural India. • 18 selected villages in 5 states (Andhra
Pradesh, Maharashtra, Madhya Pradesh, Gujarat and Karnataka).
• The data were collected every 15 days by resident field investigators.

Division of Agricultural Economics, IARI
Division of Agricultural Economics, IARI
Methodology • Historical data from 1975 to 2010 for 6 villages.• 948 men and 631 women in the 18 villages in 2010.• Variations in hours worked and in wage earnings by gender,
level of education, economic activity (self-employed in agriculture, rearing livestock, self-employed in non-agricultural work) and non-economic activity (domestic duties) were analysed.
• The paper also examines the segmentation of labour among major occupations (based on time spent on activities in 2010), namely: (a) self-employed in agriculture; (b) non-farm labour; (c) rearing livestock; (d) regular employment (receiving a monthly salary); (e) attending educational institutions; (f) attending to household domestic duties; (g) small business work; and (h) farm labour.

Division of Agricultural Economics, IARI
• Hours worked = f( physical capital of workers, human capital of workers, social group, personal and work-related variables, location-specific variables)
• Wage received = f(physical capital of workers, human capital of workers, social group, personal and work-related variables, location-specific variables)
• Occupational category = f(physical capital of workers, human capital of workers, social group, personal and work-related variables, location-specific variables)

Division of Agricultural Economics, IARI
Whether parents occupation will determine children's occupation? Occupational Mobility Matrix (% of male workers) for whose occupation is cultivation and agricultural labourer in 1975 (males)
Daughter marriage, health shocks, other shocks – downward movement
Division of Agricultural Economics, IARI
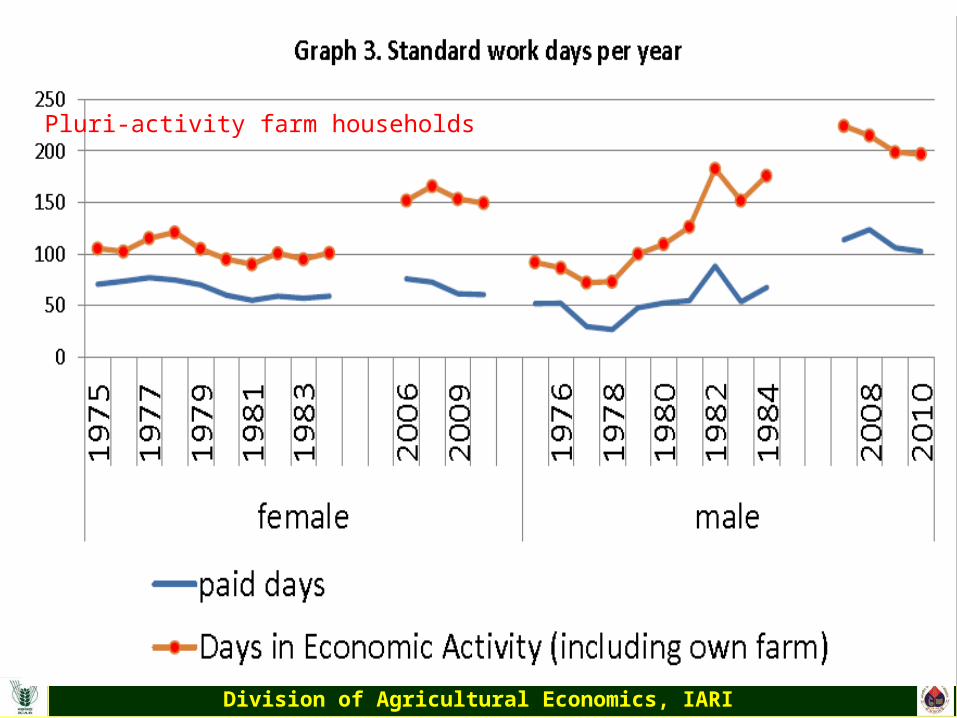
Pluri-activity farm households
Division of Agricultural Economics, IARI
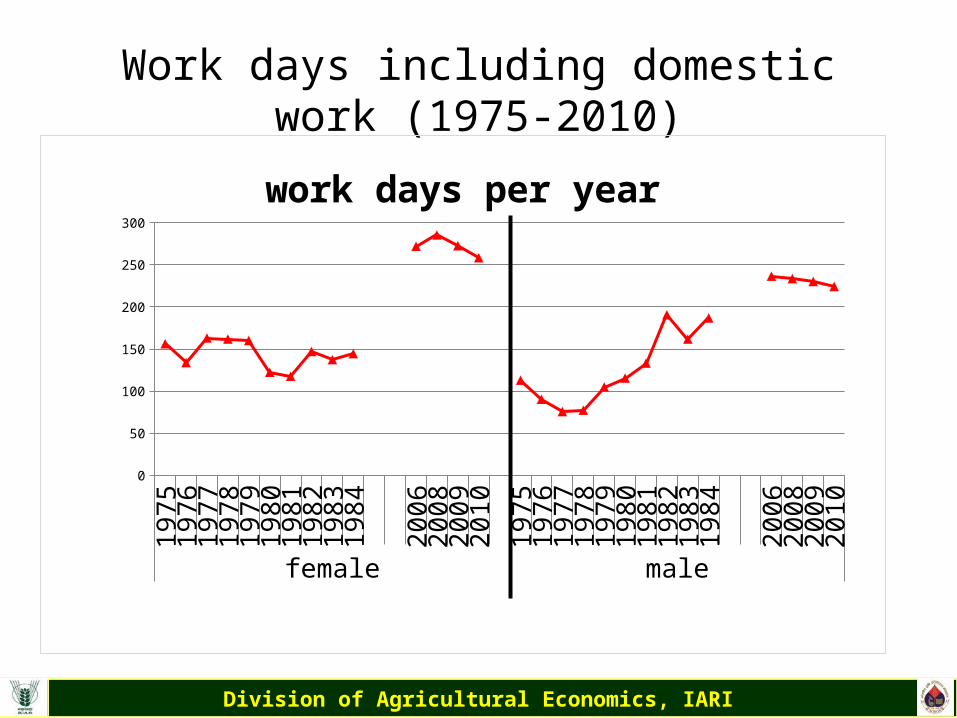
Work days including domestic work (1975-2010)19
7519
7619
7719
7819
7919
8019
8119
8219
8319
84
2006
2008
2009
2010
1975
1976
1977
1978
1979
1980
1981
1982
1983
1984
2006
2008
2009
2010
female male
0
50
100
150
200
250
300
work days per year
Division of Agricultural Economics, IARI
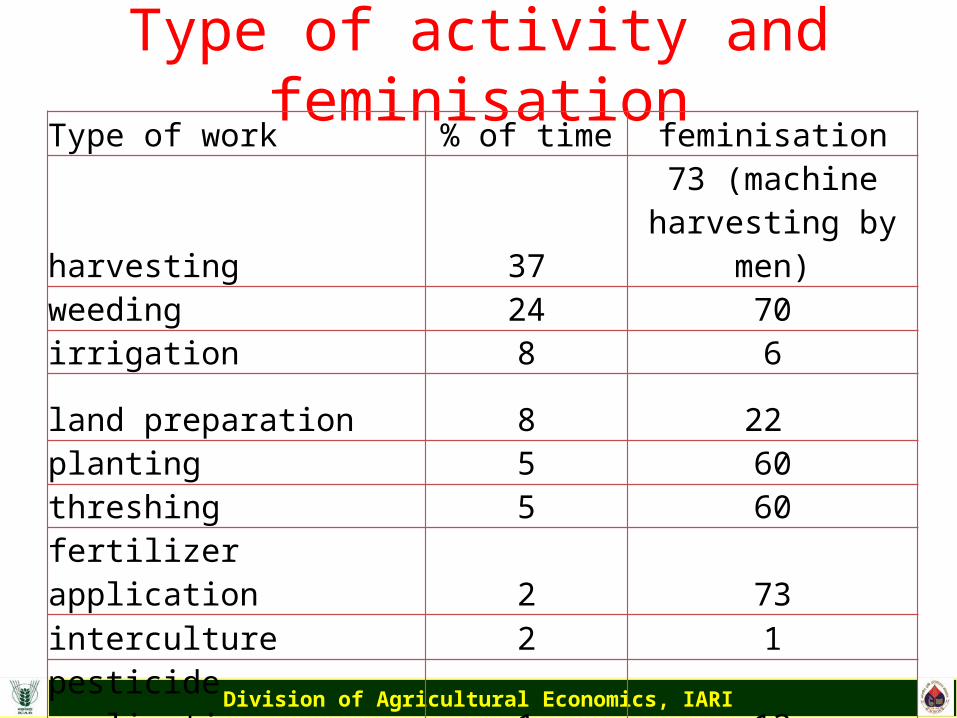
Type of activity and feminisationType of work % of time feminisation
harvesting 3773 (machine
harvesting by men)weeding 24 70irrigation 8 6
land preparation 8 22 planting 5 60threshing 5 60
fertilizer application 2 73interculture 2 1
pesticide application 1 12
manure application 1 33

Division of Agricultural Economics, IARI
Independent variables considered modelVariable Rationale for inclusion
Hours worked per year
Wage rate(Rs/day) Determine supply of labour
Farm size (acre)Indicator for physical capital, source of employment on own farm
Irrigated area (acre) Indicator for land productivityValue of assets (Rs.1000) Economic status of householdsCaste dummies Indicator of social discrimination
Backward caste (reference group)Scheduled tribe Scheduled caste
Forward caste Religion dummies Discrimination based on religion
Muslims (reference group)Christian Christian’s
Hindu Majority Gender (0-women, 1-men)
Gender discrimination
Years of schooling Human capital through education
Experience(age-years of schooling-5)Human capital through experience
Division of Agricultural Economics, IARI
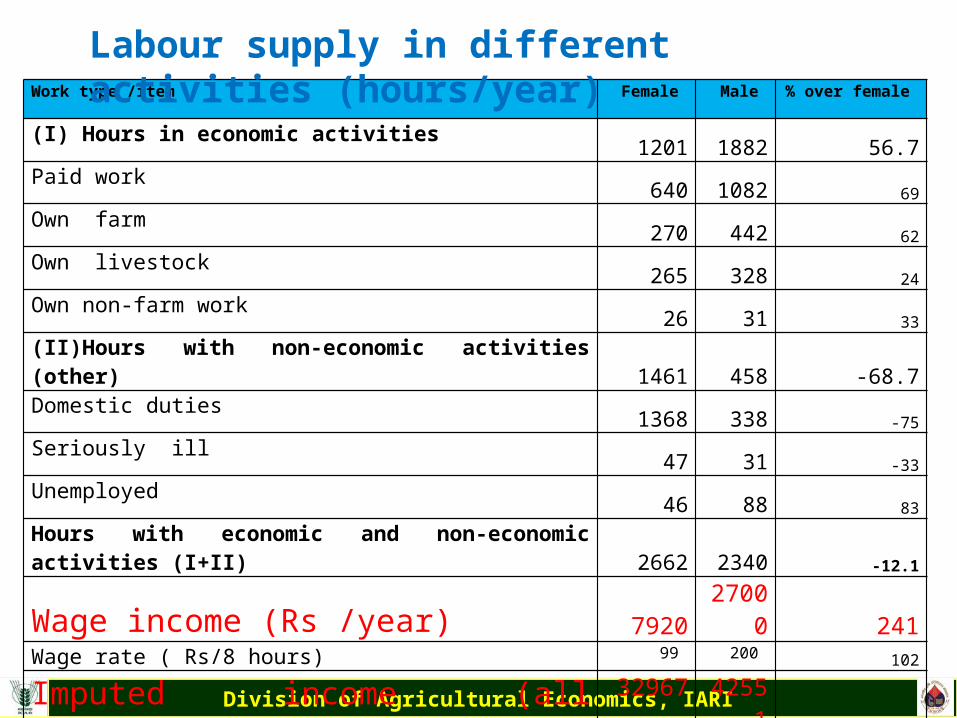
Work type /item Female Male % over female
(I) Hours in economic activities 1201 1882 56.7
Paid work 640 1082 69
Own farm 270 442 62
Own livestock 265 328 24
Own non-farm work26 31 33
(II)Hours with non-economic activities (other)1461 458 -68.7
Domestic duties 1368 338 -75
Seriously ill 47 31 -33
Unemployed 46 88 83
Hours with economic and non-economic activities (I+II) 2662 2340 -12.1
Wage income (Rs /year) 7920 27000 241Wage rate ( Rs/8 hours) 99 200 102
Imputed income (all activities) 32967 42551 29Average level of education 5 8
Labour supply in different activities (hours/year)
Division of Agricultural Economics, IARI
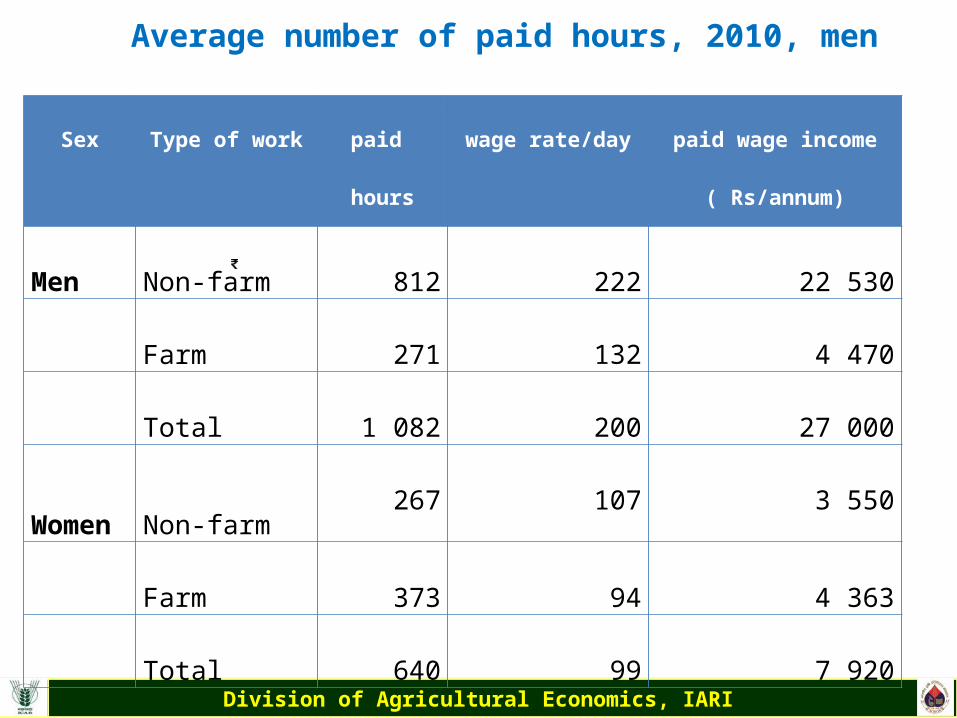
Average number of paid hours, 2010, men and womenSex Type of work paid hours wage rate/day paid wage income
( Rs/annum)
Men Non-farm 812 222 22 530
Farm 271 132 4 470
Total 1 082 200 27 000
Women Non-farm
267 107 3 550
Farm 373 94 4 363
Total 640 99 7 920

Division of Agricultural Economics, IARI
Work-hours and wage rates by level of education, 2010Sex/level of education
Economic activity Non-economic activity
Other Total hours (2010)Paid
work Self-employed in agriculture
Rearing livestock
Self-employed in non-agricultural work
Total Domestic duties
Unemployed
Men
Illiterate 1 100 473 499 26 2 098 365 134 2 623
up to 5 years of schooling
1 110 478 427 26 2 041 355 103 2 52512 years
997 391 175 41 1 604 272 57 1 954Graduate or above 977 370 195 21 1 563 334 41 1 959
Total1 064 442 324 26 1 856 350 93 2 325
Women Illiterate
833 319 344 31 1 527 1 239 57 2 880up to 5 years of schooling
714 329 236 31 1 310 1 578 62 2 98111-12 years of schooling
391 206 144 21 762 1 254 0 2 057Graduate or above 257 62 144 31 494 1 018 46 1 589
Total 627 262 262 26 1 177 1 336 51 2 615
Division of Agricultural Economics, IARI
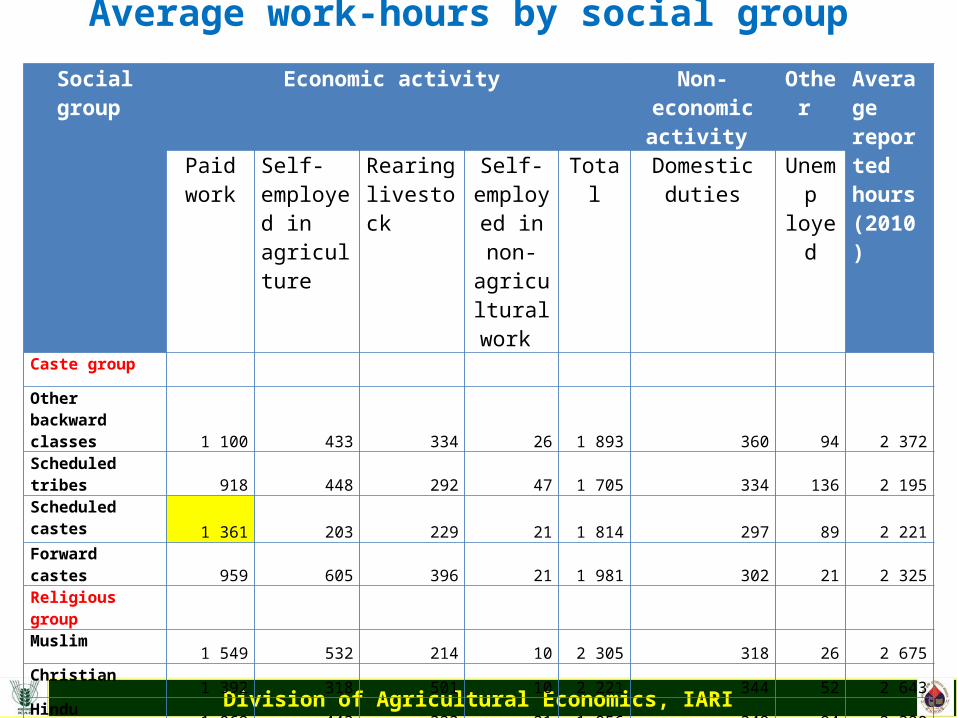
Average work-hours by social group (men), 2010Social group Economic activity Non-economic activity
Other Average reported hours (2010)Paid
workSelf-employed in agriculture
Rearing livestock
Self-employed in non-agricultural work
Total Domesticduties
Unemp
loyed
Caste group
Other backward classes
1 100 433 334 26 1 893 360 94 2 372Scheduled tribes
918 448 292 47 1 705 334 136 2 195Scheduled castes
1 361 203 229 21 1 814 297 89 2 221Forward castes
959 605 396 21 1 981 302 21 2 325Religious group
Muslim
1 549 532 214 10 2 305 318 26 2 675Christian
1 392 318 501 10 2 221 344 52 2 643Hindu
1 069 443 323 21 1 856 349 94 2 320
Division of Agricultural Economics, IARI
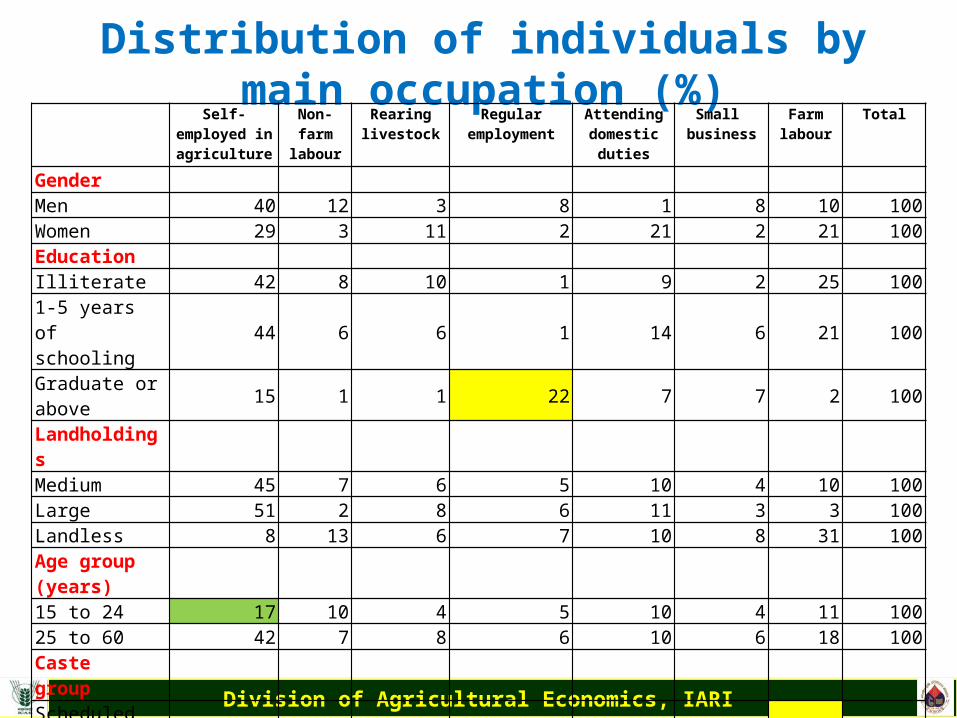
Distribution of individuals by main occupation (%)
Self-employed in agriculture
Non-farm labour
Rearing livestock
Regular employment
Attending domestic
duties
Small business
Farmlabour
Total
Gender Men 40 12 3 8 1 8 10 100Women 29 3 11 2 21 2 21 100Education Illiterate 42 8 10 1 9 2 25 1001-5 years of schooling
44 6 6 1 14 6 21 100
Graduate or above
15 1 1 22 7 7 2 100
Landholdings Medium 45 7 6 5 10 4 10 100Large 51 2 8 6 11 3 3 100Landless 8 13 6 7 10 8 31 100Age group (years)
15 to 24 17 10 4 5 10 4 11 10025 to 60 42 7 8 6 10 6 18 100Caste group Scheduled castes 18 15 4 8 9 5 28 100Forward castes 35 3 7 7 20 7 6 100Total 35 8 7 5 11 5 15 100
Division of Agricultural Economics, IARI
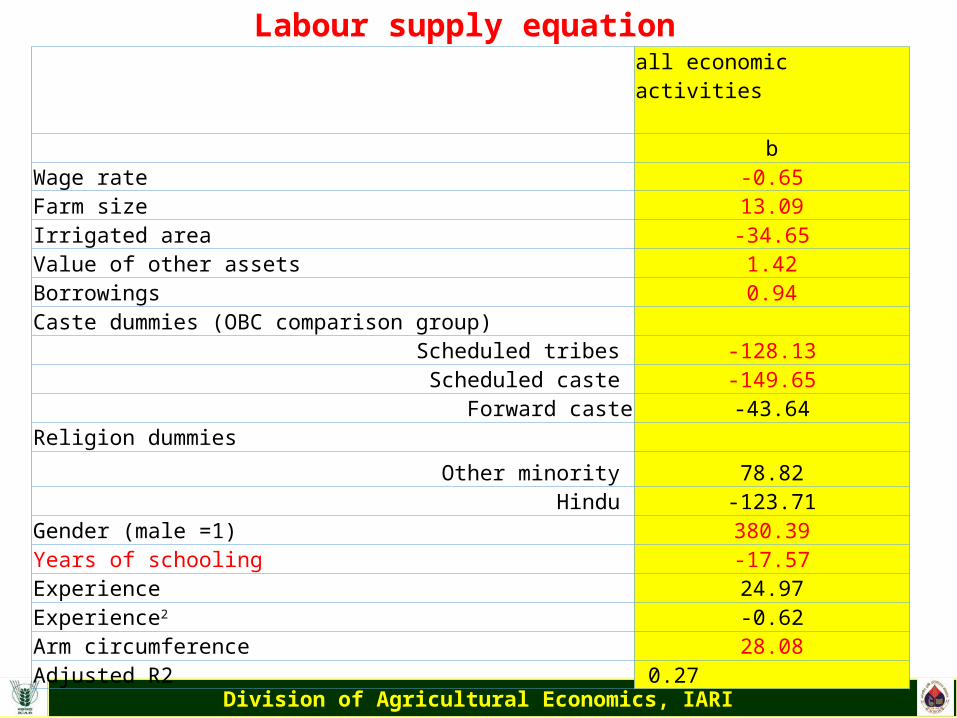
all economic activities
bWage rate -0.65Farm size 13.09Irrigated area -34.65Value of other assets 1.42Borrowings 0.94Caste dummies (OBC comparison group)
Scheduled tribes -128.13Scheduled caste -149.65
Forward caste -43.64Religion dummies
Other minority 78.82Hindu -123.71
Gender (male =1) 380.39Years of schooling -17.57Experience 24.97Experience2 -0.62Arm circumference 28.08Adjusted R2 0.27
Labour supply equation

Division of Agricultural Economics, IARI
log of wage rates women men Coefficient Coefficient Farm size -0.010 0.015Irrigated area 0.024 0.023Value of assets 0.001 -0.002Caste dummies (OBC comparison group)
Scheduled tribe -0.092 0.089Scheduled caste -0.018 -0.043
Forward caste 0.053 0.204Religion dummies (Muslim comparison group)
Other minority -0.085 0.428Hindu 0.065 0.173
Years of schooling -0.016 0.001Experience -0.005 0.024
Experience2 0.000 -0.001
Main occupation Non-farm labour 0.029 0.135
Livestock rearing 0.120 -0.044Regular employment 0.013 0.237
Domestic work -0.089 0.097Petty business -0.115 0.351farm labourer 0.046 0.037
Adj R2 0.34 0.45
Determinants of wage rates
Division of Agricultural Economics, IARI
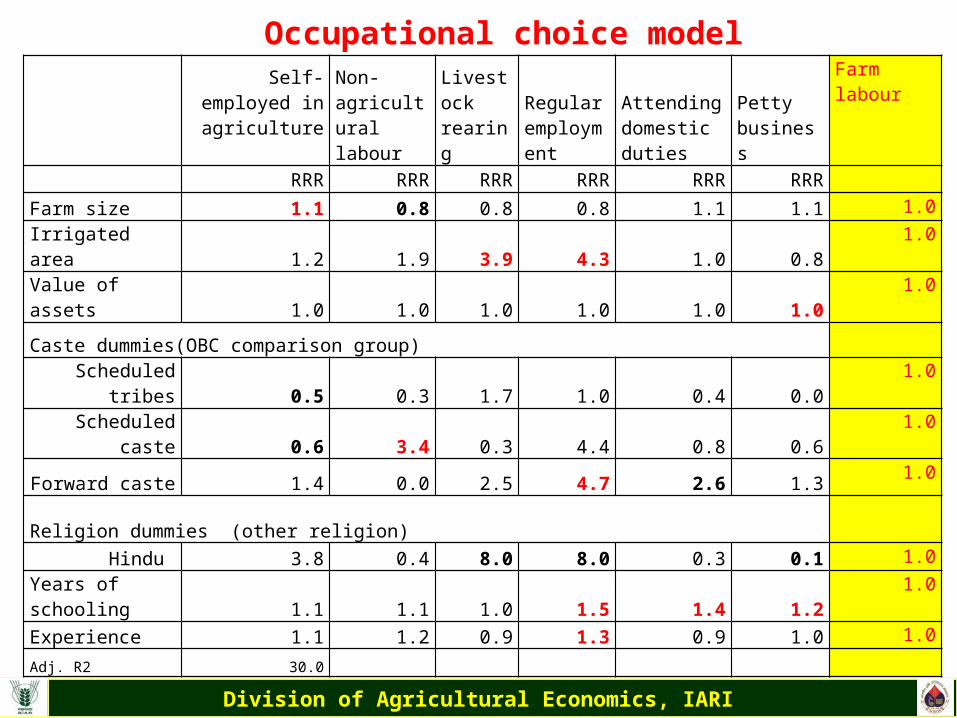
Self-employed in agriculture
Non-agricultural labour
Livestock rearing
Regular employment
Attending domestic duties
Petty business
Farm labour
RRR RRR RRR RRR RRR RRR
Farm size 1.1 0.8 0.8 0.8 1.1 1.1 1.0
Irrigated area 1.2 1.9 3.9 4.3 1.0 0.81.0
Value of assets 1.0 1.0 1.0 1.0 1.0 1.01.0
Caste dummies(OBC comparison group)
Scheduled tribes 0.5 0.3 1.7 1.0 0.4 0.0 1.0
Scheduled caste 0.6 3.4 0.3 4.4 0.8 0.61.0
Forward caste 1.4 0.0 2.5 4.7 2.6 1.31.0
Religion dummies (other religion)Hindu 3.8 0.4 8.0 8.0 0.3 0.1 1.0
Years of schooling 1.1 1.1 1.0 1.5 1.4 1.21.0
Experience 1.1 1.2 0.9 1.3 0.9 1.0 1.0
Adj. R2 30.0
Occupational choice model

Division of Agricultural Economics, IARI
Conclusion Men participated mostly in economic activities, while women in non-
economic activities, such as domestic duties.
Low women wage rates for the same work, with outdated machinery
Low participation of women in paid work
Gender segmentation of labour (farm and non-farm; paid and unpaid)
Unemployed educated youth.

Division of Agricultural Economics, IARI
Conclusion cont..•Economic activities more dependent on land and assets ownership•higher education little relevance (only a few regular employment (teachers, nurses, record keepers or health workers) for women.•Agriculture dominate with more seasonality•Construction and small businesses (self-employment), retail shops, agro-processing, the repair, truck driver- requires only semi-skilled workers with little education.

Division of Agricultural Economics, IARI
Conclusion cont.• Rural labour markets in India were highly
segmented based on caste and gender• labour market for men is developing, but slowly. • The driving forces- semi-skilled and middle-level
education(men), along with the development of the rural non-farm sector.
• Women- informal and low status employment.

Division of Agricultural Economics, IARI
Policy implications
1. Enhancing the ownership of such assets as land and irrigated
areas by providing loans low income groups
2. Enhancing the semi-skills and middle-education emerging
occupations, such as the repair of mobile telephones and electric
motors, and work in computer centres
3. Increasing women’s empowerment by reducing social rigidities in
order to enhance women’s participation in economic activities.

Division of Agricultural Economics, IARI
Women employment • Men’s participation in economic activities was higher than
women. There was a huge gap in monetary income between men and women .
• If we take in to account domestic duties also, women work more hours per week compared to men,.
• The segregation of the rural labour market by sex was particularly visible in rural labour markets in India with men shifting to non-farm occupations with higher wage rates, while women still depend on farm work (either self-employed or as casual labourers and domestic duties).
• Among women, levels of education and experience have little influence on the choice of occupation or the quality of employment.
Division of Agricultural Economics, IARI
Policy options
• Farm machinery in harvesting and weeding to improve women productivity rather than replace women in agriculture
• Skill and entrepreneur development with focus on middle educated rural youth
Division of Agricultural Economics, IARI
Policy options – small farmers
• Encouragement to small farmers to increase their off-farm income and employment opportunities.
• Small farmers and agricultural labourers needs to be given easy loan coupled with skill training to earn additional income from non-farm activities.

Division of Agricultural Economics, IARI
Thanks