title page chronic ethanol consumption lessens the gain of...
TRANSCRIPT

JPET#155168
1
Title Page
Chronic ethanol consumption lessens the gain of body weight, liver triglycerides
and diabetes in obese ob/ob mice.
Bernard Fromenty, Nathalie Vadrot, Julie Massart, Bruno Turlin, Nadège Barri-Ova, Philippe
Lettéron, Alain Fautrel, Marie-Anne Robin.
INSERM, U620, Rennes, France (B.F., J.M., A.F., M.-A.R.); Département d'Anatomie et Cytologie
Pathologiques, Hôpital Pontchaillou, Rennes, France (B.T.); Plate-forme d’Histopathologie, IFR
140, Rennes, France (B.T., A.F.); Université de Rennes 1, Rennes, France (B.F., J.M., B.T., A.F., M.-
A.R.); INSERM, U773, Centre de Recherche Biomédicale Bichat Beaujon CRB3, Paris, France
(N.V., N.B.-O., P.L.); Université Paris 7 Denis Diderot, site Bichat, Paris, France (N.V., N.B-O.,
P.L.).
JPET Fast Forward. Published on July 8, 2009 as DOI:10.1124/jpet.109.155168
Copyright 2009 by the American Society for Pharmacology and Experimental Therapeutics.
This article has not been copyedited and formatted. The final version may differ from this version.JPET Fast Forward. Published on July 8, 2009 as DOI: 10.1124/jpet.109.155168
at ASPE
T Journals on June 4, 2018
jpet.aspetjournals.orgD
ownloaded from

JPET#155168
2
Running Title Page
Running title: Chronic ethanol alleviates diabetes in obese mice
Correspondence: Marie-Anne Robin, INSERM U620, Université de Rennes 1 Bâtiment 8, 2 avenue
du Professeur Léon Bernard, 35043, Rennes, France
Tel: (+33) 2 23 23 30 43 Fax: (+33) 2 23 23 53 85
email: [email protected]
Number of text pages: 17
Number of tables: 2
Number of figures: 6
Number of references: 40
Number of words in Abstract: 248
Number of words in Introduction: 369
Number of words in Discussion: 1062
Abbreviations: ACC, acetyl-CoA carboxylase; ALT, alanine aminotransferase; AMPK, AMP-
activated protein kinase; AST, aspartate aminotransferase; ChREBP, carbohydrate response element
binding protein; CYP2E1, cytochrome P450 2E1; FAS, fatty acid synthase; G6Pase, glucose-6-
phosphatase; H&E, hematoxylin and eosin; IGF-I, insulin-like growth factor-I, IGFBP-1, insulin-like
growth-factor-binding protein-1; L-CPT1, liver carnitine palmitoyltransferase-1; L-PK, liver-type
pyruvate kinase; MCAD, medium-chain acyl-CoA dehydrogenase; MnSOD, manganese superoxide
dismutase; NEFA, non esterified fatty acids; PPARα, peroxisome proliferator-activated receptor-α;
PEPCK, phosphoenolpyruvate carboxykinase; GSH, reduced glutathione, SCD1, stearoyl-CoA
desaturase-1; SREBP1c, sterol response element binding protein-1c; TNF, tumor necrosis factor.
Section assignment: Gastrointestinal, Hepatic, Pulmonary, and Renal
This article has not been copyedited and formatted. The final version may differ from this version.JPET Fast Forward. Published on July 8, 2009 as DOI: 10.1124/jpet.109.155168
at ASPE
T Journals on June 4, 2018
jpet.aspetjournals.orgD
ownloaded from

JPET#155168
3
Abstract
Clinical studies suggest that moderate alcohol consumption can have beneficial effects, in particular
regarding cardiovascular events, insulin resistance and type 2 diabetes. In this study, lean and obese
diabetic ob/ob mice were submitted or not to chronic ethanol intake via the drinking water for 6
months, which was associated with moderate levels of plasma ethanol. Plasma levels of ALT and
AST were not increased by alcohol intake. Ethanol consumption progressively reduced the gain of
body weight in ob/ob mice, but not in lean mice, and this was observed despite higher calorie intake.
Increased plasma free fatty acids and glycerol in ethanol-treated ob/ob mice suggested peripheral
lipolysis. Glycemia and insulinemia were significantly reduced while adiponectinemia was increased
in ethanol-treated ob/ob mice. Liver weight and triglycerides were significantly decreased in ethanol-
treated ob/ob mice and this was associated with less microvesicular steatosis. Hepatic levels of AMP-
activated protein kinase and the phosphorylated form of acetyl-CoA carboxylase were higher in
ethanol-treated ob/ob mice, suggesting better fatty acid oxidation. However, hepatic mRNA
expression of several lipogenic genes was not reduced by ethanol consumption. Finally, mild
oxidative stress was noticed in the liver of ethanol-treated mice, regardless of their genotype. Hence,
our data are in keeping with clinical studies suggesting that moderate ethanol intake can have
beneficial effects on type 2 diabetes and insulin sensitivity, at least in part through increased levels of
plasma adiponectin. However, further studies are needed to determine whether long-term drinking of
light-to-moderate amounts of ethanol is safe for the liver.
This article has not been copyedited and formatted. The final version may differ from this version.JPET Fast Forward. Published on July 8, 2009 as DOI: 10.1124/jpet.109.155168
at ASPE
T Journals on June 4, 2018
jpet.aspetjournals.orgD
ownloaded from
JPET#155168
4
Introduction
Heavy alcohol intake is associated with increased mortality, liver diseases such as
steatohepatitis and cirrhosis, pancreatitis, hypertension, cardiomyopathy and cerebrovascular events
(Robin et al., 2005; Kloner and Rezkalla, 2007). However, although alcohol abuse is undoubtedly
detrimental to human health, there is evidence that light-to-moderate alcohol consumption may have
some beneficial effects, in particular regarding cardiovascular events, insulin resistance and type 2
diabetes (Howard et al., 2004; Ting and Lautt, 2006; Kloner and Rezkalla, 2007). In addition, a
recent study suggests that modest wine drinking could significantly reduce the prevalence of
nonalcoholic fatty liver disease, which is closely related to obesity and metabolic syndrome (Dunn et
al., 2008). Regarding ethanol consumption and diabetes, epidemiological data showed an U-shaped
relationship between alcohol amount and the risk of type 2 diabetes. Indeed, whereas low-to-
moderate alcohol intake decreases the risk of type 2 diabetes, abstinence and heavy alcohol drinking
seem to be associated with an increased risk (Howard et al., 2004; Koppes et al., 2005). Interestingly,
moderate alcohol intake could lower the risk of type 2 diabetes through an improvement of insulin
sensitivity (Howard et al., 2004; Sierksma et al., 2004; Ting and Lautt, 2006). The mechanisms
whereby moderate alcohol consumption ameliorates insulin sensitivity are currently poorly
understood but some studies pointed to a reduction of body weight (in particular in women) and
increased adiponectin levels (Sierksma et al., 2004; Ting and Lautt, 2006; Imhof et al., 2009).
In a previous study, we showed that four repeated ethanol binges via gastric intubation (2.5
g/kg) induced hepatic apoptosis in obese ob/ob mice, but not in lean animals (Robin et al., 2005).
Importantly, plasma levels of ethanol were ca. 1.2 g/L in the obese animals (Robin et al., 2005). In
the present study, we used the same murine model of obesity to determine the hepatic effects of a
chronic consumption of ethanol via the drinking water. Interestingly, this protocol of alcohol intake
was associated with a significant lower gain of body weight, decreased liver triglycerides, reduced
This article has not been copyedited and formatted. The final version may differ from this version.JPET Fast Forward. Published on July 8, 2009 as DOI: 10.1124/jpet.109.155168
at ASPE
T Journals on June 4, 2018
jpet.aspetjournals.orgD
ownloaded from

JPET#155168
5
levels of plasma glucose and insulin and increased plasma adiponectin. This was associated with
higher hepatic levels of AMP-activated protein kinase (AMPK) and phospho-acetyl-CoA carboxylase
(phospho-ACC), which could explain, at least in part, the amelioration of the metabolic profile.
This article has not been copyedited and formatted. The final version may differ from this version.JPET Fast Forward. Published on July 8, 2009 as DOI: 10.1124/jpet.109.155168
at ASPE
T Journals on June 4, 2018
jpet.aspetjournals.orgD
ownloaded from

JPET#155168
6
Methods
Animals and Ethanol Administration
Sixteen 7-weeks old male C57BL/6J-ob/ob mice (henceforth referred to as obese mice),
weighing 35 to 43 g, and 16 C57BL/6J-+/+ mice (wild-type, referred to as lean mice), weighing 21 to
25 g, were purchased from Janvier (Le-Genest-St-Isle, France). Mice were accommodated in an
animal care facility accredited by the French veterinary authorities. Mice were fed ad libitum on a
normal diet bringing 2,820 kcal/kg of food (A04 biscuits, UAR, Villemoisson-sur-Orge, France).
After 1 week of acclimatization, the groups of lean and ob/ob mice were further split into two
subgroups of 8 animals (equally distributed into 2 cages) that subsequently drank water or an ethanol
solution for 6 months. The daily ethanol consumption was 3g/kg of body weight for the first 10 days.
Thereafter, the daily intake of ethanol was regularly incremented by 1 g/kg to finally reach 21g/kg
after 6 months. To achieve this progressive augmentation, we adjusted the percentage of ethanol in
the drinking water every 10 days, taking into account the body weight and the liquid intake of each
mouse. Indeed, consumption of food and liquid was evaluated twice a week, while body weight was
measured every week. Importantly, the liquid intake remained stable during the experiment in lean
mice (between 5 and 6 ml/day), but not in obese mice (from 9ml/day at the beginning to 4 ml/day at
the end of the treatment). Thus, whereas the percentage of ethanol in the drinking water was 1.5% for
both genotypes at the beginning of the treatment (corresponding to 3g/kg), it was respectively 15 and
30% for lean and obese mice in order to reach 21g/kg in both genotypes. At the end of the treatment,
all mice were sacrificed by cervical dislocation. This sacrifice was performed in the morning (around
10 a.m.), hence in the post absorptive state as food intake occurs essentially during nighttime in
mice. The liver was quickly removed and immediately frozen in liquid nitrogen. All experiments
This article has not been copyedited and formatted. The final version may differ from this version.JPET Fast Forward. Published on July 8, 2009 as DOI: 10.1124/jpet.109.155168
at ASPE
T Journals on June 4, 2018
jpet.aspetjournals.orgD
ownloaded from

JPET#155168
7
were performed according to national guidelines for the use of animals in biomedical research, with
the approval of the French National Medical Research Institute (INSERM).
Plasma Studies
Blood was collected from the retroorbitary sinus each month to monitor alanine
aminotransferase (ALT) activity and just before the sacrifice for the measurement of a larger set of
plasma parameters. A sample of blood was also taken one day before the initiation of the treatment to
measure plasma glucose, insulin and adiponectin. Blood was always collected in the post absorptive
state. Blood ethanol concentration was assessed using the NAD-ADH reagent kit from Sigma-
Aldrich (Saint Louis, MO). Plasma ALT and aspartate aminotransferase (AST) activities, iron, total
cholesterol, triglycerides, glucose, nonesterified fatty acids (NEFA), glycerol, β-hydroxybutyrate and
total antioxidant status (expressed as Trolox equivalents) were measured on an automatic analyzer
AU400 (Olympus Diagnostics, Rungis, France). Plasma ALT, AST, iron, total cholesterol,
triglycerides and glucose were measured with the Olympus commercial kits OSR6107, OSR6109,
OSR6186, OSR6116, OSR6133 and OSR6121, respectively. NEFA, glycerol, β-hydroxybutyrate and
total antioxidant status were respectively measured with the kits FA115, GY105, RB1007 and
NX2332, purchased from RANDOX Laboratories (Montpellier, France). Plasma Tumor Necrosis
Factor (TNF)-α was assessed with the KRC 3012 ELISA kit (Biosource International, Camarillo,
CA). Insulin was determined with the INSKR020 ELISA kit from Crystal Chem (Downers Grove,
IL) and adiponectin with the MRP300 mouse ELISA kit from R&D Systems (Lille, France).
Liver Histology, Total Lipids and Triglycerides
This article has not been copyedited and formatted. The final version may differ from this version.JPET Fast Forward. Published on July 8, 2009 as DOI: 10.1124/jpet.109.155168
at ASPE
T Journals on June 4, 2018
jpet.aspetjournals.orgD
ownloaded from

JPET#155168
8
Liver specimens were fixed with 10% neutral formalin and embedded in paraffin. Sections
were stained with hematoxylin and eosin (H&E). Inflammation (polymorphonuclear cells
infiltration) was assessed on 10 different fields at 200x magnification. Steatosis was evaluated as the
percentage of hepatocytes containing vacuoles of fat on 10 different fields at 200x magnification.
The total surface of the vacuoles was also measured with an image analyzer (image J) in 5 different
fields by slide.
Total lipids in liver were measured gravimetrically as previously described (Robin et al.,
2005). Lipids were subsequently resuspended in isopropanol (ca. 10 mg/mL). After removal of
phospholipids with aluminum hydroxide hydrate, triglycerides were determined colorimetrically
using the Nash’s reagent (containing acetylacetone, ammonium acetate and isopropanol) and
periodate (Robin et al., 2005).
Hepatic Glutathione and Enzyme Activities
Reduced glutathione (GSH) levels and the activities of glutathione S-transferase, glutathione
peroxidase and glutathione reductase were assessed in liver homogenates, as previously reported
(Robin et al., 2005). The activity of aconitase, an enzyme highly sensitive to oxidative damage and
located both in cytosol and mitochondria (Missirlis et al., 2003), was assessed as previously
described (Begriche et al. 2008a). CYP2E1 activity was determined by the hydroxylation of aniline
into p-aminophenol (Robin et al., 2005). To assess caspase activities, livers were homogenized in 1
mM EDTA, 5 mM dithiothreitol, 50 mM Hepes, 0.1% 3-[(3-cholamidopropyl) dimethylammonio]-1-
propane-sulfonate, 4 mg/mL leupeptin and 4 mg/mL pepstatin, pH 7.4. The supernatant was
recovered after centrifugation at 14,000g and 4°C for 10 min. Caspase-2, -8, -9 and -3 activities were
measured with the fluorescent ApoAlert Caspase Assay plate (Clontech, Mountain View, CA)
following the manufacturer's instructions.
This article has not been copyedited and formatted. The final version may differ from this version.JPET Fast Forward. Published on July 8, 2009 as DOI: 10.1124/jpet.109.155168
at ASPE
T Journals on June 4, 2018
jpet.aspetjournals.orgD
ownloaded from

JPET#155168
9
RNA Isolation and Gene Expression
Total hepatic RNA was isolated by acid guanidium thiocyanate-phenol-chloroform
extraction. RNA integrity was assessed with the RNA 6000 nano LabChip® kit (Agilent, Waldbronn,
Germany). cDNAs were prepared by reverse transcription of 2 µg of total RNA using the Moloney
murine leukaemia virus (MMLV) enzyme from Invitrogen (Cergy-Pontoise, France), as previously
described (Begriche et al., 2008a). cDNAs were thus amplified with specific primers using the
Master SYBR Green® mix (Sigma-Aldrich), in a Chromo IV® light cycler apparatus (Biorad,
Marnes-La-Coquette, France). The PCR conditions were 1 cycle at 94°C for 3 min, followed by 40
cycles at 94°C for 30 sec and 60°C for 1 min. Amplification of specific transcripts was confirmed by
melting curve profiles generated at the end of each run. Moreover, PCR specificity was further
ascertained with an agarose gel electrophoresis by checking the length of the PCR products.
Expression of the mouse ribosomal protein S6 (S6) was used as reference, and the 2-ΔΔCt method was
employed to express the relative expression of each selected gene. Sequences of primers used for
real-time quantitative PCR have been reported recently for sterol response element binding protein-
1c (SREBP1c), peroxisome proliferator-activated receptor-α (PPARα), stearoyl-CoA desaturase-1
(SCD1), fatty acid synthase (FAS), acetyl-CoA carboxylase-1 (ACC1), phosphoenolpyruvate
carboxykinase (PEPCK), liver-type pyruvate kinase (L-PK), liver carnitine palmitoyltransferase-1
(L-CPT1), medium-chain acyl-CoA dehydrogenase (MCAD) and S6 (Begriche et al., 2008a).
Sequences of primers for carbohydrate response element binding protein (ChREBP), glucose-6-
phosphatase (G6Pase) and insulin-like growth-factor-binding protein-1 (IGFBP-1) were 5’-
CTGGGGACCTAAACAGGAGC-3’(F) and 5’-GAAGCCACCCTATAGCTCCC-3’(R), 5’-
CACACCACCTTCTCTATCAC-3’(F) and 5’-GTTGCCTACCAGACACAG-3’(R), 5’-
This article has not been copyedited and formatted. The final version may differ from this version.JPET Fast Forward. Published on July 8, 2009 as DOI: 10.1124/jpet.109.155168
at ASPE
T Journals on June 4, 2018
jpet.aspetjournals.orgD
ownloaded from

JPET#155168
10
AAATGGAAGGAGCCCTGCC-3’(F) and 5’-CCATTCTTGTTGCAGTTTGGC-3’(R),
respectively.
Western Blot Analyses
Liver homogenates were prepared from 100 µg frozen fragments in a sucrose/Tris HCl buffer
containing 0.1% SDS, 1% Nonidet P40 and protease inhibitors. After protein determination,
homogenates underwent 8% SDS-polyacrylamide electrophoresis for phospho-ACC/ACC and FAS,
10% for phospho-AMPKα/AMPKα, 12% for cytochrome P450 2E1 (CYP2E1) and 14% for SCD1
and manganese superoxide dismutase (MnSOD). Immunoblotting was thus carried out with rabbit
polyclonal antibodies against CYP2E1 (Oxford Biomedical Research, Oxford, MI), MnSOD
(Stressgen, Ann Harbor, MI), phospho-AMPKα (Thr172), AMPKα, SCD1 (Cell Signaling
Technology, Danvers, MA), phospho-ACC (Ser79) and ACC (Upstate Biotechnology, Lake Placid,
NY), FAS (Santa Cruz Biotechnology, Santa Cruz, CA). Blots were incubated with appropriate
secondary antibodies, and protein bands were revealed by enhanced chemiluminescence (Amersham
Pharmacia, Orsay, France). To normalize protein loadings, blots were stripped and incubated with
antibodies against β-actin (Sigma-Aldrich).
Statistical Analyses
Data are presented as means ± SEM (standard error of mean). When four groups were
compared, two-way analysis of variance (ANOVA) with the factors of genotype (+/+ or ob/ob) and
ethanol consumption (absent or present) was performed in order to assess statistical significances.
When the ANOVA indicated a significant interaction between factors, individual means were
This article has not been copyedited and formatted. The final version may differ from this version.JPET Fast Forward. Published on July 8, 2009 as DOI: 10.1124/jpet.109.155168
at ASPE
T Journals on June 4, 2018
jpet.aspetjournals.orgD
ownloaded from

JPET#155168
11
compared with least significant difference (LSD) post hoc test. In experiments with only two sets of
data, the Student’s t-test was used.
This article has not been copyedited and formatted. The final version may differ from this version.JPET Fast Forward. Published on July 8, 2009 as DOI: 10.1124/jpet.109.155168
at ASPE
T Journals on June 4, 2018
jpet.aspetjournals.orgD
ownloaded from

JPET#155168
12
Results
Regular Monitoring of Plasma ALT, Body Weight and Energy Intake
Chronic ethanol administration was well tolerated by lean and obese mice. In contrast, two
naïve ob/ob mice died during the experiment, respectively after 10 and 22 weeks. Unfortunately, an
autopsy was not performed in these obese animals.
Plasma ALT activity was measured each month as an index of hepatic cytolysis. Plasma ALT
was higher in obese mice when compared with their lean counterparts (Figure 1A), reflecting liver
damage as previously reported (Robin et al., 2005; Begriche et al. 2008b). However, ethanol
administration did not change ALT values in both groups of mice (Figure 1A).
Body weight was also monitored throughout the 6-month period of treatment. Ethanol
consumption did not change body weight in lean mice (Figure 1B). Indeed, after 6 months body
weight gain was 9.9 ± 0.70 and 9.3 ± 1.2 g, respectively in naïve and ethanol-treated mice. In
contrast, ethanol intake significantly decreased by 43% the gain of body weight in obese mice as it
was 26.2 ± 0.8 and 14.8 ± 0.5 g, respectively in naïve and ethanol-treated ob/ob mice. Hence, at the
end of the treatment naïve and ethanol-treated ob/ob mice weighted 65.5 ± 1.3 and 52.8 ± 1.0 g,
respectively (Figure 1B). The significant reduction of body weight gain in ethanol-treated obese mice
was already observable after 6 weeks (Figure 1B).
Ethanol consumption brings a significant amount of calories (7 kcal/g) which must be taken
into account in the daily energy intake. Hence, the energy intake was monitored thanks to the
estimation of food consumption for all mice and liquid intake for ethanol-treated animals. During the
6-month protocol, ethanol consumption was responsible for a reduced intake of food-derived calories
in both lean and ob/ob mice, though this reduction was stronger in the obese animals during the last 2
months (Figure 1C). However, when calories from ethanol were considered, the energy intake was
This article has not been copyedited and formatted. The final version may differ from this version.JPET Fast Forward. Published on July 8, 2009 as DOI: 10.1124/jpet.109.155168
at ASPE
T Journals on June 4, 2018
jpet.aspetjournals.orgD
ownloaded from

JPET#155168
13
higher in ethanol-treated animals, although this was significant in lean mice only for the last 2
months (Figure 1C). Thus, lower body weight gain in ethanol-treated obese mice occurred despite
higher energy intake throughout the treatment.
Initial and Final Plasma Levels of Glucose, Insulin and Adiponectin
Three plasma parameters (namely glucose, insulin and adiponectin) were measured both
before the initiation of ethanol administration and at the end of the treatment. The initial levels of
plasma glucose were significantly augmented in ob/ob mice compared with lean animals, thus
confirming the presence of type 2 diabetes (Figure 2). However, plasma levels of glucose after 6
months were lower in naïve obese mice thus indicating an amelioration of the diabetic state, as
previously described (Dubuc et al., 1982; Lindström, 2007). On the other hand, plasma levels of
glucose after 6 months were increased in the naïve lean mice when compared with the initial levels
(Figure 2A). Consequently, plasma glucose after 6 months was slightly but significantly lower in
ob/ob mice when compared with their lean counterparts (Figure 2A). Interestingly, ethanol
administration reduced plasma glucose in both genotypes though the reduction was more pronounced
in the obese animals (Figure 2A).
Initial plasma levels of insulin were dramatically increased in ob/ob mice, reflecting severe
insulin resistance. After 6 months, plasma insulin was less elevated in ob/ob mice while it was
considerably reduced in ethanol-treated obese mice (Figure 2B). We also measured plasma
adiponectin as this adipokine plays a major role in glucose homeostasis in particular by improving
insulin sensitivity (Kadowaki et al., 2006; Begriche et al., 2006). Initial plasma levels of adiponectin
were reduced in ob/ob mice compared with the lean animals (Figure 2C), although the difference was
not significant (P=0.08). However, ob/ob mice after 6 months presented higher plasma adiponectin
than lean mice (Figure 2C), as reported in some studies (Ding et al., 2006; Itoh et al., 2007). In
This article has not been copyedited and formatted. The final version may differ from this version.JPET Fast Forward. Published on July 8, 2009 as DOI: 10.1124/jpet.109.155168
at ASPE
T Journals on June 4, 2018
jpet.aspetjournals.orgD
ownloaded from

JPET#155168
14
addition, plasma adiponectin levels were increased in both lean and obese mice after 6 months, thus
suggesting an aging-dependent effect. Ethanol-administration further augmented adiponectin levels
in both lean and ob/ob mice, though this was more pronounced in obese animals (Figure 2C).
Interestingly, a regression analysis showed a significant inverse relationship between plasma levels
of adiponectin and glucose when all mice (n=26) were considered (r=0.40, P<0.05).
Other Plasma Parameters
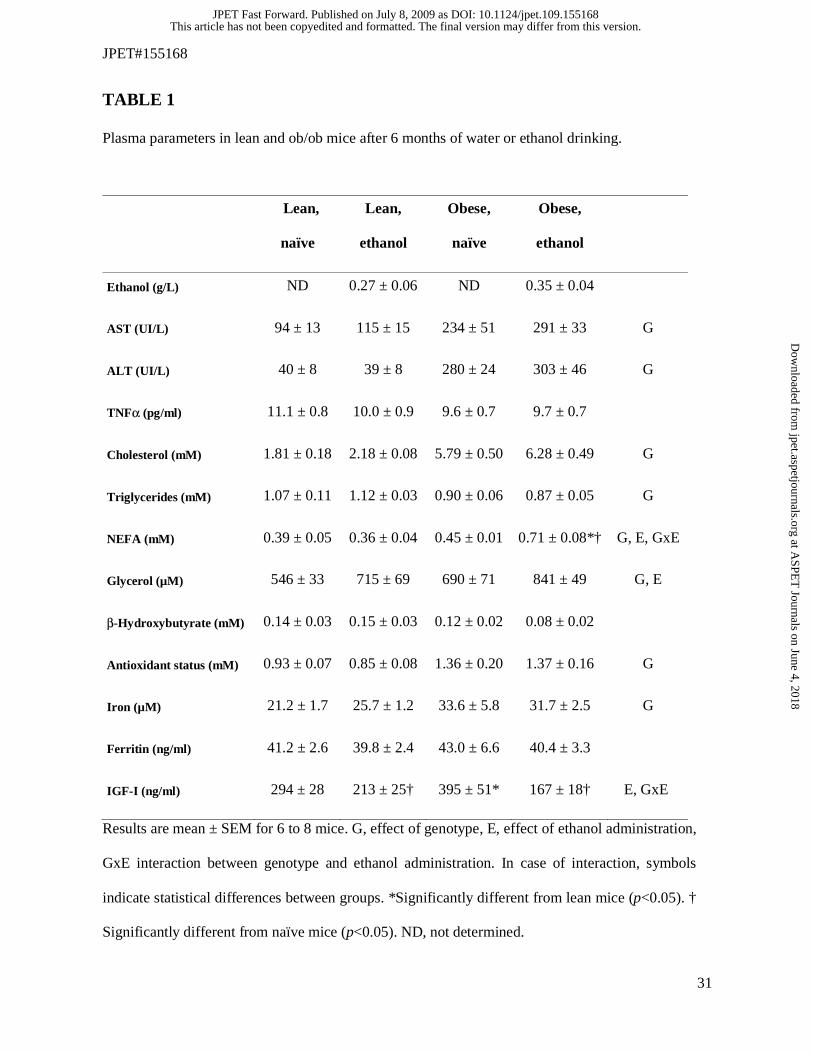
A larger set of plasma parameters were further measured at the end of the treatment.
Importantly, ethanol concentration was not different in lean and obese mice (Table 1). Plasma β-
hydroxybutyrate and ferritin were unchanged whatever the groups of mice (Table 1). Plasma TNFα
levels were similar between obese and lean mice, as already reported (Faggioni et al., 2000; Romics
et al., 2004; Robin et al., 2005), and ethanol administration did not modify TNFα (Table 1). Plasma
ALT, AST, total cholesterol, antioxidant status and iron were significantly increased in obese mice
when compared with lean mice, but ethanol did not change these parameters (Table 1). Importantly,
we previously reported higher plasma antioxidant status in ob/ob mice compared with wild-type
mice, which could be a compensatory adaptation to chronic oxidative stress (Robin et al., 2005).
Ob/ob mice were slightly hypotriglyceridemic, as reported in several studies (Lombardo et al., 1983;
Camus et al., 1988; Lindström, 2007), and ethanol did not modify triglyceride levels (Table 1).
Plasma levels of NEFA and glycerol were higher in ob/ob mice and ethanol intake further increased
both parameters in obese animals (Table 1), while ethanol intake only enhanced plasma glycerol in
lean mice, thus suggesting that lipolysis (i.e. the hydrolysis of adipose triglycerides and the
subsequent release of glycerol and NEFA into the blood) could have been more active in ob/ob mice.
However, further investigations will be needed in order to support this hypothesis. Finally, plasma
insulin-like growth factor-I (IGF-I) was significantly enhanced in ob/ob mice when compared with
This article has not been copyedited and formatted. The final version may differ from this version.JPET Fast Forward. Published on July 8, 2009 as DOI: 10.1124/jpet.109.155168
at ASPE
T Journals on June 4, 2018
jpet.aspetjournals.orgD
ownloaded from

JPET#155168
15
the lean animals and ethanol administration significantly lowered IGF-I in both lean and obese mice
(Table 1).
Liver Weight, Lipids and Histology
Liver weight was dramatically increased in ob/ob mice when compared with lean mice
(Figure 3A). Interestingly, ethanol administration was associated with a significant reduction of liver
weight only in obese mice (Figure 3A). As body weight was also reduced by ethanol in obese mice,
the liver/body weight ratio remained virtually unchanged in the obese animals (data not shown).
Next, total lipids and triglycerides were measured in mouse liver. Hepatic lipids and
triglycerides were considerably enhanced in ob/ob mice compared with lean mice, reflecting massive
steatosis (Robin et al., 2005; Ding et al., 2006). Whereas ethanol administration slightly augmented
liver lipids and triglycerides in lean mice, it decreased significantly liver triglycerides in ob/ob mice
(Figure 3). However, liver lipids were not significantly reduced in ethanol-treated ob/ob mice (Figure
3B), possibly due to a compensatory increase in nontriglyceride lipids.
A histological examination of the livers was subsequently performed in 12 wild-type mice
(including 6 naïve and 6 ethanol-treated animals) and 14 obese mice (including 6 naïve and 8
ethanol-treated animals). In lean mice, ethanol administration did not induce significant histological
changes (including necroinflammation), except for the presence in one mouse of some lipid droplets
in a few hepatocytes (not shown). In both naïve and ethanol-treated ob/ob mice steatosis involved a
large majority (>80%) of the hepatocytes, thus reflecting massive fatty liver. In naïve ob/ob mice,
steatosis was both macrovacuolar and microvesicular in 3 animals (not shown) but was
predominantly microvesicular in the others (Figure 4). In contrast, major microvesicular steatosis
was not observed in ethanol-treated ob/ob mice (Figure 4). Indeed, hepatic steatosis was mainly
macrovacuolar in one mouse and both macrovacuolar and microvesicular in the other ethanol-treated
This article has not been copyedited and formatted. The final version may differ from this version.JPET Fast Forward. Published on July 8, 2009 as DOI: 10.1124/jpet.109.155168
at ASPE
T Journals on June 4, 2018
jpet.aspetjournals.orgD
ownloaded from

JPET#155168
16
obese animals. Importantly, ethanol intake did not aggravate the moderate necroinflammation
observed in the obese mice (not shown). Finally, the total area of the lipid vacuoles was determined
in all ob/ob liver samples thanks to the ImageJ software, as described in the materials and methods
section. This area was slightly but significantly reduced by 10% in ethanol-treated ob/ob mice
compared with the naïve obese animals (data not shown).
mRNA Expression of Hepatic Genes
The mRNA expression of several hepatic genes was also measured in the different groups of
mice. In particular, we sought to determine whether the improvement of diabetes and hepatic
triglycerides in ethanol-treated ob/ob mice was associated with significant change in the expression
of key enzymes and transcription factors involved in carbohydrate and lipid homeostasis. However,
the mRNA expression of several lipogenic genes (SREBP1c, ChREBP, SCD1, FAS, ACC1) was not
reduced by ethanol intake in ob/ob liver (Figure 5). Furthermore, the hepatic mRNA expression of
genes involved in fatty acid oxidation (PPARα, CPT1, MCAD) was not augmented in ethanol-
treated obese animals (Figure 5). Interestingly, the mRNA expression of the gluconeogenic enzyme
G6Pase was significantly decreased by ethanol intake in ob/ob liver (Figure 5). However, the hepatic
mRNA expression of PEPCK (another gluconeogenic enzyme) and L-PK (a glycolytic enzyme) was
unchanged in ethanol-treated obese animals (Figure 5). Finally, the mRNA expression of IGFBP-1
was significantly enhanced by ethanol, in particular in the ob/ob mice (Figure 5).
Protein Expression of Lipogenic Enzymes and AMPK in Liver
The hepatic mRNA expression of the lipogenic genes ACC1, FAS and SCD1 was increased
by ethanol in ob/ob mice (Figure 5), despite lower liver triglycerides (Figure 3). Since some
This article has not been copyedited and formatted. The final version may differ from this version.JPET Fast Forward. Published on July 8, 2009 as DOI: 10.1124/jpet.109.155168
at ASPE
T Journals on June 4, 2018
jpet.aspetjournals.orgD
ownloaded from

JPET#155168
17
lipogenic genes can be regulated at post-transcriptional levels, we also assessed the expression of the
corresponding proteins by western blot. Although ACC, FAS and SCD1 protein levels were
increased in obese mice when compared with the lean animals, only FAS expression was further
augmented by ethanol intake in ob/ob liver (Figure 6). We also measured the expression of the
phosphorylated form of ACC, since phospho-ACC corresponds to the inactivated form of this
lipogenic enzyme. Interestingly, ethanol intake in ob/ob mice was associated with a large increase in
the hepatic expression of phospho-ACC, although total ACC levels were virtually unchanged (Figure
6). Consequently, there was a 3-fold increase in the hepatic phospho-ACC/ACC ratio in ethanol-
treated ob/ob mice compared with naive ob/ob mice. In lean mice, hepatic ACC expression was
significantly reduced by 63% when compared with ob/ob mice and ethanol intake did not modify the
hepatic phospho-ACC/ACC ratio (Figure 6). Lastly, we also assessed the expression of hepatic
AMPK which is able to phosphorylate ACC. Interestingly, AMPK expression was significantly
augmented in ob/ob mice treated with ethanol when compared with the naïve animals though this
was not associated with increased levels of its phosphorylated form (Figure 6). In ethanol-treated and
naïve wild-type mice, hepatic AMPK levels were about similar to those found in naïve ob/ob mice
(Figure 6).
Oxidative Stress and Caspase Activity in Liver
Finally, several parameters related to hepatic oxidative stress and apoptosis were measured in
lean and obese mice. Ethanol intake was associated with increased CYP2E1 protein and activity, as
well as enhanced MnSOD protein (Table 2). Aconitase activity, but not reduced GSH, was lowered
by ethanol intake (Table 2). Ethanol administration also reduced the activity of glutathione
peroxidase, but not that of glutathione reductase and glutathione transferase (Table 2). Interestingly,
both aconitase and glutathione peroxidase can be inactivated by reactive oxygen species (ROS) and
This article has not been copyedited and formatted. The final version may differ from this version.JPET Fast Forward. Published on July 8, 2009 as DOI: 10.1124/jpet.109.155168
at ASPE
T Journals on June 4, 2018
jpet.aspetjournals.orgD
ownloaded from

JPET#155168
18
free radicals (Rouach et al., 1997; Missirlis et al., 2003). The activity of caspases 2, 3, 8 and 9 was
furthermore determined but no difference was found between the four groups of mice (data not
shown).
This article has not been copyedited and formatted. The final version may differ from this version.JPET Fast Forward. Published on July 8, 2009 as DOI: 10.1124/jpet.109.155168
at ASPE
T Journals on June 4, 2018
jpet.aspetjournals.orgD
ownloaded from

JPET#155168
19
Discussion
In this study, we showed that chronic administration of ethanol significantly reduced the gain
of body weight and alleviated type 2 diabetes in obese ob/ob mice. These beneficial effects were
associated with increased plasma adiponectin, lower liver triglycerides and higher hepatic levels of
AMPK and phospho-ACC. Importantly, plasma levels of ethanol were moderate in our murine model
of chronic alcohol intake.
Although heavy alcohol intake is detrimental for human health (Robin et al., 2005; Kloner and
Rezkalla, 2007), there is increasing evidence that light-to-moderate alcohol consumption could have
beneficial effects, in particular regarding insulin resistance and type 2 diabetes (Howard et al., 2004;
Ting and Lautt, 2006; Kloner and Rezkalla, 2007), and possibly NASH as well (Dunn et al., 2008).
The mechanisms whereby moderate alcohol drinking could afford these favorable effects are still
hypothetical but could involve an augmentation of adiponectin levels and a reduction of body weight,
at least in some individuals (Sierksma et al., 2004; Ting and Lautt, 2006; Imhof et al., 2009). A
beneficial effect of ethanol consumption on plasma adiponectin levels is an attractive hypothesis
since this adipokine is known to improve insulin sensitivity and fatty acid oxidation in different
tissues (e.g. skeletal muscle and liver), at least in part through an AMPK-dependent pathway
(Begriche et al., 2006; Kadowaki et al., 2006; Begriche et al., 2009). Thus, our murine model could
recapitulate some of the favorable metabolic effects that have been observed in individuals drinking
reasonable amounts of alcohol.
In this study, ethanol intake lowered the gain of body weight in obese mice, but not in their
lean counterparts, although the total energy intake was enhanced in both groups of animals. The
mechanism whereby ethanol reduced the gain of body weight in ob/ob mice was not investigated.
However, our data suggested lipolysis in ethanol-treated obese mice as reflected by increased plasma
glycerol and NEFAs. Interestingly, a recent study in rats indicated that chronic ethanol intake
This article has not been copyedited and formatted. The final version may differ from this version.JPET Fast Forward. Published on July 8, 2009 as DOI: 10.1124/jpet.109.155168
at ASPE
T Journals on June 4, 2018
jpet.aspetjournals.orgD
ownloaded from

JPET#155168
20
enhanced triglyceride degradation in adipose tissue through a reduction of the anti-lipolytic action of
insulin (Kang et al., 2007). Alternatively, other mechanisms could have contributed to lower body
weight gain in obese mice. Indeed, several studies suggest that ethanol calories are less efficiently
used than calories derived from other nutrients and that ethanol consumption increases resting energy
expenditure and thermogenesis and favors lipid utilization (Klesges et al., 1994; Addolorato et al.,
1998). Finally, the significant reduction of plasma insulin and glucose could have significantly
reduced de novo lipogenesis, in particular in the adipose tissue (Wang et al., 2004; Begriche et al.,
2006).
Reduction of body weight is generally associated with improved insulin sensitivity and
increased plasma levels of adiponectin (Takahashi et al., 2004; Bruun et al., 2006). Hence, reduced
plasma insulin and glucose (suggesting better insulin sensitivity) and higher adiponectin in ethanol-
treated ob/ob mice could be an indirect consequence of lower body weight gain. However, ethanol
administration induced a significant augmentation of adiponectin in lean mice, although they did not
lose body weight. Thus, the amelioration of type 2 diabetes in ethanol-treated ob/ob mice could be
due to the concomitant action of reduced body weight gain and enhanced plasma levels of
adiponectin. Interestingly, several in vitro and in vivo investigations showed that ethanol can augment
adiponectin expression and secretion in adipocytes, as well as its plasma levels (Buechler et al., 2008;
Wandler et al., 2008; Imhof et al., 2009). Furthermore, amelioration of insulin sensitivity and reduced
risk of type 2 diabetes in individuals drinking moderate amounts of alcohol were associated with
increased adiponectin levels (Sierksma et al., 2004; Ting and Lautt, 2006; Englund Ögge et al., 2006;
Beulens et al., 2008). Thus, one important mechanism whereby moderate ethanol consumption
ameliorates insulin sensitivity could be through increased adiponectin secretion and plasma levels.
Plasma IGF-I levels were augmented in obese mice compared with lean animals. Increased
circulating IGF-I could be an adaptive mechanism in the context of insulin resistance since this
hormone favors insulin sensitivity (Ezzat et al., 2008). Interestingly, ethanol administration
This article has not been copyedited and formatted. The final version may differ from this version.JPET Fast Forward. Published on July 8, 2009 as DOI: 10.1124/jpet.109.155168
at ASPE
T Journals on June 4, 2018
jpet.aspetjournals.orgD
ownloaded from
JPET#155168
21
dramatically reduced plasma IGF-I in obese mice and to a lesser extent in lean mice. Thus, lower
IGF-I levels in ethanol-treated ob/ob mice could be, at least in part, the consequence of better insulin
sensitivity in these animals.
Adiponectin is able to induce AMPK activation in liver, which in turn decreases
gluconeogenesis and increases fatty acid oxidation through ACC phosphorylation (Kadowaki et al.,
2006; Begriche et al., 2006). Indeed, phosphorylation of ACC leads to the inactivation of its activity,
thus reducing hepatic levels of malonyl-CoA, the only endogenous inhibitor of CPT-1 (Begriche et
al., 2008b; Begriche et al., 2009). In this study, hepatic phospho-ACC was significantly augmented
in ethanol-treated ob/ob mice and this was associated with enhanced total AMPK levels. These data
suggested higher hepatic fatty acid oxidation, although plasma β-hydroxybutyrate measured in the
post absorptive state was unchanged. Lower insulin and glucose levels and inactivation of hepatic
ACC could also have contributed to decrease liver triglycerides through reduced de novo lipogenesis.
Interestingly, the reduction of liver triglycerides in ethanol-treated ob/ob mice was associated
with a change in the morphology of steatosis. Indeed, none of the ethanol-treated ob/ob mice
presented microvesicular steatosis whereas this liver lesion was predominant in half of the naïve
obese mice. It is noteworthy that microvesicular steatosis reflects mitochondrial dysfunction
(Fromenty and Pessayre, 1995) and that ob/ob mice present some mitochondrial alterations (Melia et
al., 1999; Garcia-Ruiz et al., 2006), although different studies have shown several metabolic and
mitochondrial adaptations in ob/ob liver such as increased PPARα expression, cytochrome c and
mtDNA levels (Robin et al., 2005; Begriche et al., 2008b; Begriche et al., 2009). Thus, the lack of
microvesicular steatosis in ethanol-treated ob/ob mice could reflect improved mitochondrial function
although further investigations will be necessary to confirm this hypothesis.
Oxidative stress is a major mechanism whereby ethanol abuse is able to damage the liver and
other tissues (Mansouri et al., 2001; Hoek and Pastorino, 2002). However, despite the presence of
some oxidative stress in ethanol-treated mice there was no evidence of liver injury as reflected by
This article has not been copyedited and formatted. The final version may differ from this version.JPET Fast Forward. Published on July 8, 2009 as DOI: 10.1124/jpet.109.155168
at ASPE
T Journals on June 4, 2018
jpet.aspetjournals.orgD
ownloaded from

JPET#155168
22
unchanged plasma ALT and AST. Enhanced hepatic mRNA levels of IGFBP-1 in ethanol-treated
mice could have involved c-Jun N-terminal kinase (JNK) activation or metabolic stresses (Magne et
al., 2007). Hence, further investigations will be needed in order to determine whether the
maintenance of moderate ethanol consumption over extensive periods of time cannot eventually
damage the liver despite an amelioration of glucose homeostasis.
This article has not been copyedited and formatted. The final version may differ from this version.JPET Fast Forward. Published on July 8, 2009 as DOI: 10.1124/jpet.109.155168
at ASPE
T Journals on June 4, 2018
jpet.aspetjournals.orgD
ownloaded from

JPET#155168
23
References
Addolorato G, Capristo E, Greco AV, Caputo F, Stefanini GF and Gasbarrini G (1998) Three months
of abstinence from alcohol normalizes energy expenditure and substrate oxidation in alcoholics:
a longitudinal study. Am J Gastoenterol 93: 2476-2481.
Begriche K, Igoudjil A, Pessayre D and Fromenty B (2006) Mitochondrial dysfunction in NASH:
causes, consequences and possible means to prevent it. Mitochondrion 6: 1-28.
Begriche K, Lettéron P, Abbey-Toby A, Vadrot N, Robin MA, Bado A, Pessayre D and Fromenty B.
(2008a) Partial leptin deficiency favors diet-induced obesity and related metabolic disorders in
mice. Am J Physiol Endocrinol Metab 294: E939-951.
Begriche K, Massart J, Abbey-Toby A, Igoudjil A, Lettéron P and Fromenty B (2008b) β-
Aminoisobutyric acid prevents diet-induced obesity in mice with partial leptin deficiency.
Obesity 16: 2053-2067.
Begriche K, Knockaert L, Massart J, Robin MA and Fromenty B (2009) Mitochondrial dysfunction
in nonalcoholic steatohepatitis (NASH): are there drugs able to improve it? Drug Discov Today
Dis Mech (in press).
Beulens JW, Rimm EB, Hu FB, Hendriks HF and Mukamal KJ (2008) Alcohol consumption,
mediating biomarkers, and risk of type 2 diabetes among middle-aged women. Diabetes Care
31: 2050-2055.
Bruun JM, Helge JW, Richelsen B and Stallknecht B (2006) Diet and exercise reduce low-grade
inflammation and macrophage infiltration in adipose tissue but not in skeletal muscle in severely
obese subjects. Am J Physiol Endocrinol Metab 290: E961-967.
Buechler C, Schäffler A, Johann M, Neumeier M, Köhl P, Weiss T, Wodarz N, Kiefer P and
Hellerbrand C (2009) Elevated adiponectin serum levels in patients with chronic alcohol abuse
rapidly decline during alcohol withdrawal. J Gastroenterol Hepatol 24: 558-563.
This article has not been copyedited and formatted. The final version may differ from this version.JPET Fast Forward. Published on July 8, 2009 as DOI: 10.1124/jpet.109.155168
at ASPE
T Journals on June 4, 2018
jpet.aspetjournals.orgD
ownloaded from

JPET#155168
24
Camus MC, Aubert R, Bourgeois F, Herzog J, Alexiu A and Lemonnier D (1988) Serum lipoprotein
and apolipoprotein profiles of the genetically obese ob/ob mouse. Biochim Biophys Acta 961: 53-
64.
Ding X, Saxena NK, Lin S, Gupta NA and Anania FA (2006) Exendin-4, a glucagon-like protein-1
(GLP-1) receptor agonist, reverses hepatic steatosis in ob/ob mice. Hepatology 43: 173-181.
Dubuc PU, Cahn PJ, Ristimaki S and Willis PL (1982) Starvation and age effects on glycoregulation
and hormone levels of C57BL/6Job/ob mice. Horm Metab Res 14: 532-535.
Dunn W, Xu R and Schwimmer JB (2008) Modest wine drinking and decreased prevalence of
suspected nonalcoholic fatty liver disease. Hepatology 47: 1947-1954.
Englund Ogge L, Brohall G, Behre CJ, Schmidt C and Fagerberg B (2006) Alcohol consumption in
relation to metabolic regulation, inflammation, and adiponectin in 64-year-old Caucasian
women: a population-based study with a focus on impaired glucose regulation. Diabetes Care
29: 908-913.
Ezzat VA, Duncan ER, Wheatcroft SB and Kearney MT (2008) The role of IGF-I and its binding
proteins in the development of type 2 diabetes and cardiovascular disease. Diabetes Obes Metab
10: 198-211.
Faggioni R, Jones-Carson J, Reed DA, Dinarello CA, Feingold KR, Grunfeld C and Fantuzzi G
(2000) Leptin-deficient (ob/ob) mice are protected from T cell-mediated hepatotoxicity: role of
tumor necrosis factor alpha and IL-18. Proc Natl Acad Sci USA 97: 2367-2372.
Fromenty B and Pessayre D (1995) Inhibition of mitochondrial beta-oxidation as a mechanism of
hepatotoxicity. Pharmacol Ther 67: 101-154.
García-Ruiz I, Rodríguez-Juan C, Díaz-Sanjuan T, del Hoyo P, Colina F, Muñoz-Yagüe T and Solís-
Herruzo JA (2006) Uric acid and anti-TNF antibody improve mitochondrial dysfunction in
ob/ob mice. Hepatology 44: 581-591.
This article has not been copyedited and formatted. The final version may differ from this version.JPET Fast Forward. Published on July 8, 2009 as DOI: 10.1124/jpet.109.155168
at ASPE
T Journals on June 4, 2018
jpet.aspetjournals.orgD
ownloaded from

JPET#155168
25
Hoek JB and Pastorino JG (2002) Ethanol, oxidative stress, and cytokine-induced liver cell injury.
Alcohol 27: 63-68.
Howard AA, Arnsten JH and Gourevitch MN (2004) Effect of alcohol consumption on diabetes
mellitus: a systematic review. Ann Intern Med 140: 211-219.
Imhof A, Plamper I, Maier S, Trischler G and Koenig W (2009) Effect of drinking on adiponectin in
healthy men and women: A randomised intervention study of water, ethanol, red wine and beer
with or without alcohol. Diabetes Care 32: 1101-1103.
Itoh M, Suganami T, Satoh N, Tanimoto-Koyama K, Yuan X, Tanaka M, Kawano H, Yano T, Aoe
S, Takeya M, Shimatsu A, Kuzuya H, Kamei Y and Ogawa Y (2007) Increased adiponectin
secretion by highly purified eicosapentaenoic acid in rodent models of obesity and human obese
subjects. Arterioscler Thromb Vasc Biol 27: 1918-1925.
Kadowaki T, Yamauchi T, Kubota N, Hara K, Ueki K and Tobe K (2006) Adiponectin and
adiponectin receptors in insulin resistance, diabetes, and the metabolic syndrome. J Clin Invest
116: 1784-1792.
Kang L, Chen X, Sebastian BM, Pratt BT, Bederman IR, Alexander JC, Previs SF and Nagy LE
(2007) Chronic ethanol and triglyceride turnover in white adipose tissue in rats: inhibition of the
anti-lipolytic action of insulin after chronic ethanol contributes to increased triglyceride
degradation. J Biol Chem 282: 28465-28473.
Klesges RC, Mealer CZ and Klesges LM (1994) Effects of alcohol intake on resting energy
expenditure in young women social drinkers. Am J Clin Nutr 59: 805-809.
Kloner RA and Rezkalla SH (2007) To drink or not to drink? That is the question. Circulation 116:
1306-1317.
Koppes LL, Dekker JM, Hendriks HF, Bouter LM and Heine RJ (2005) Moderate alcohol
consumption lowers the risk of type 2 diabetes: a meta-analysis of prospective observational
studies. Diabetes Care 28: 719-725.
This article has not been copyedited and formatted. The final version may differ from this version.JPET Fast Forward. Published on July 8, 2009 as DOI: 10.1124/jpet.109.155168
at ASPE
T Journals on June 4, 2018
jpet.aspetjournals.orgD
ownloaded from

JPET#155168
26
Lindström P (2007) The physiology of obese-hyperglycemic mice [ob/ob mice].
ScientificWordJournal 29: 666-685.
Lombardo YB, Chicco A, Mocchiutti N, de Rodi MA, Nusimovich B and Gutman R (1983) Effect of
sucrose diet on insulin secretion in vivo and in vitro and on triglyceride storage and mobilisation
of the heart of rats. Horm Metab Res 15: 69-76.
Magne L, Blanc E, Marchand A, Fafournoux P, Barouki R, Rouach H and Garlatti M (2007)
Stabilization of IGFBP-1 mRNA by ethanol in hepatoma cells involves the JNK pathway. J
Hepatol 47: 691-698.
Mansouri A, Demeilliers C, Amsellem S, Pessayre D and Fromenty B (2001) Acute ethanol
administration oxidatively damages and depletes mitochondrial dna in mouse liver, brain, heart,
and skeletal muscles: protective effects of antioxidants. J Pharmacol Exp Ther 298: 737-43.
Melia HP, Andrews JF, McBennett SM and Porter RK (1999) Effects of acute leptin administration
on the differences in proton leak rate in liver mitochondria from ob/ob mice compared with lean
controls. FEBS Lett 458: 261-264.
Missirlis F, Hu J, Kirby K, Hilliker AJ, Rouault TA and Phillips JP (2003) Compartment-specific
protection of iron-sulfur proteins by superoxide dismutase. J Biol Chem 278: 47365-47369.
Robin MA, Demeilliers C, Sutton A, Paradis V, Maisonneuve C, Dubois S, Poirel O, Lettéron P,
Pessayre D and Fromenty B (2005) Alcohol increases tumor necrosis factor-α and decreases
nuclear factor-κB to activate hepatic apoptosis in genetically obese mice. Hepatology 42: 1280-
1290.
Romics L Jr, Kodys K, Dolganiuc A, Graham L, Velayudham A, Mandrekar P and Szabo G (2004)
Diverse regulation of NF-κB and peroxisome proliferator-activated receptors in murine
nonalcoholic fatty liver. Hepatology 40: 376-385.
This article has not been copyedited and formatted. The final version may differ from this version.JPET Fast Forward. Published on July 8, 2009 as DOI: 10.1124/jpet.109.155168
at ASPE
T Journals on June 4, 2018
jpet.aspetjournals.orgD
ownloaded from

JPET#155168
27
Rouach H, Fataccioli V, Gentil M, French SW, Morimoto M and Nordmann R (1997) Effect of
chronic ethanol feeding on lipid peroxidation and protein oxidation in relation to liver pathology.
Hepatology 25: 351-355.
Sierksma A, Patel H, Ouchi N, Kihara S, Funahashi T, Heine RJ, Grobbee DE, Kluft C and Hendriks
HF (2004) Effect of moderate alcohol consumption on adiponectin, tumor necrosis factor-α, and
insulin sensitivity. Diabetes Care 27: 184-189.
Takahashi N, Qi Y, Patel HR and Ahima RS (2004) A novel aminosterol reverses diabetes and fatty
liver disease in obese mice. J Hepatol 41: 391-398.
Ting JW and Lautt WW (2006) The effect of acute, chronic, and prenatal ethanol exposure on insulin
sensitivity. Pharmacol Ther 111: 346-373.
Wandler A, Bruun JM, Nielsen MP and Richelsen B (2008) Ethanol exerts anti-inflammatory effects
in human adipose tissue in vitro. Mol Cell Endocrinol 296: 26-31.
Wang Y, Jones Voy B, Urs S, Kim S, Soltani-Bejnood M, Quigley N, Heo YR, Standridge M,
Andersen B, Dhar M, Joshi R, Wortman P, Taylor JW, Chun J, Leuze M, Claycombe K, Saxton
AM and Moustaid-Moussa N (2004) The human fatty acid synthase gene and de novo
lipogenesis are coordinately regulated in human adipose tissue. J Nutr 134:1032-1038.
This article has not been copyedited and formatted. The final version may differ from this version.JPET Fast Forward. Published on July 8, 2009 as DOI: 10.1124/jpet.109.155168
at ASPE
T Journals on June 4, 2018
jpet.aspetjournals.orgD
ownloaded from

JPET#155168
28
Footnotes
This work was supported by the French Institut de REcherches scientifiques sur les Boissons, IREB,
[Contracts 2005-25 and 2006-23].
Julie Massart was supported by a fellowship from Ministère de L’Education Nationale, de la
Recherche et de la Technologie.
This article has not been copyedited and formatted. The final version may differ from this version.JPET Fast Forward. Published on July 8, 2009 as DOI: 10.1124/jpet.109.155168
at ASPE
T Journals on June 4, 2018
jpet.aspetjournals.orgD
ownloaded from

JPET#155168
29
Legends for figures
Fig. 1. Monitoring of plasma ALT, body weight and energy intake. (A) Plasma ALT (mean ± SEM
for 6-8 mice) was recorded each month. (B) Body weight (mean ± SEM for 6-8 mice) was measured
every two weeks. *Significantly different from naïve mice (P < 0.05, 1-way ANOVA). (C) Energy
intake (mean ± SEM for 6-8 mice) was calculated by regular monitoring of food consumption and
ethanol ingestion, if any. *Significantly different from energy intake from food in naïve mice (P <
0.05, 1-way ANOVA).
Fig. 2. (A) Plasma glucose, (B) insulin and (C) adiponectin levels before the onset of the experiment
(Initial) and after 6 months of water or ethanol drinking. For initial levels, results are mean ± SEM
for 16 mice in each group (*Significantly different from lean mice, P < 0.05, Student’s t-test). After
6 months, results are mean ± SEM for 6-8 mice in each group. Letters above the graphs indicate an
effect of the genotype (G), ethanol treatment (E), or an interaction between genotype and ethanol
(GxE) (P<0.05, 2-way ANOVA). In case of interaction, statistical significance between groups was
calculated (P<0.05, LSD post hoc test). *Different from lean mice; †different from naïve mice.
Fig. 3. Liver (A) weight, (B) lipids and (C) triglycerides in lean and obese mice after 6 months of
water or ethanol drinking. Results are mean ± SEM for 6-8 mice in each group. Letters above the
graphs indicate an effect of the genotype (G), ethanol treatment (E), or an interaction between
genotype and ethanol (GxE) (P<0.05, 2-way ANOVA). In case of interaction, statistical significance
between groups was calculated (P<0.05, LSD post hoc test). *Different from lean mice; †different
from naïve mice.
Fig. 4. Evaluation of steatosis in naïve and intoxicated ob/ob mice. H&E staining was performed on
liver slices from 6 naïve and 8 ethanol-treated obese mice. (A and B) Representative pictures of a
This article has not been copyedited and formatted. The final version may differ from this version.JPET Fast Forward. Published on July 8, 2009 as DOI: 10.1124/jpet.109.155168
at ASPE
T Journals on June 4, 2018
jpet.aspetjournals.orgD
ownloaded from

JPET#155168
30
naïve ob/ob mouse liver with predominant microvesicular steatosis at 100x and 250x magnification,
respectively. (C and D) Representative pictures of an ethanol-treated ob/ob mouse liver with
predominant macrovacuolar steatosis at 100x and 250x magnification, respectively. Scales are
indicated on the pictures.
Fig. 5. Hepatic mRNA expression in lean and obese mice after 6 months of water or ethanol
drinking. The mRNA expression of several transcription factors (SREBP1c, ChREBP, and PPARα),
lipogenic enzymes (ACC1, FAS and SCD1), gluconeogenetic (G6Pase and PEPCK) and glycolytic
(L-PK) enzymes, fatty acid oxidation enzymes (MCAD and CPT1) and IGFBP-1 was assessed by
quantitative PCR. Expression of S6 was used to normalize mRNA levels of the different genes.
Results are mean ± SEM for 6-8 mice in each group. Letters above the graphs indicate an effect of
the genotype (G), ethanol treatment (E), or an interaction between genotype and ethanol (GxE)
(P<0.05, 2-way ANOVA). In case of interaction, statistical significance between groups was
calculated (P<0.05, LSD post hoc test). *Different from lean mice; †different from naïve mice.
Fig. 6. Protein expression of lipogenic enzymes and AMP-activated protein kinase (AMPK) in liver
homogenates from naïve and ethanol-treated lean and ob/ob mice. Liver expression of SCD1, FAS,
total ACC, the phosphorylated form of ACC (P-ACC), total AMPKα and the phosphorylated form of
AMPKα (P-AMPKα) were assessed by Western blot analysis. β-Actin was used as a loading
control. Data showed in the graphs are mean ± SEM for 6-8 mice in each group. Relative protein
expressions are represented in percentages of naïve lean animals. Letters above the graphs indicate
an effect of the genotype (G), ethanol treatment (E), or an interaction between genotype and ethanol
(GxE) (P<0.05, 2-way ANOVA). In case of interaction, statistical significance between groups was
calculated (P<0.05, LSD post hoc test). *Different from lean mice; †different from naïve mice.
This article has not been copyedited and formatted. The final version may differ from this version.JPET Fast Forward. Published on July 8, 2009 as DOI: 10.1124/jpet.109.155168
at ASPE
T Journals on June 4, 2018
jpet.aspetjournals.orgD
ownloaded from
JPET#155168
31
TABLE 1
Plasma parameters in lean and ob/ob mice after 6 months of water or ethanol drinking.
Results are mean ± SEM for 6 to 8 mice. G, effect of genotype, E, effect of ethanol administration,
GxE interaction between genotype and ethanol administration. In case of interaction, symbols
indicate statistical differences between groups. *Significantly different from lean mice (p<0.05). †
Significantly different from naïve mice (p<0.05). ND, not determined.
Lean,
naïve
Lean,
ethanol
Obese,
naïve
Obese,
ethanol
Ethanol (g/L) ND 0.27 ± 0.06 ND 0.35 ± 0.04
AST (UI/L) 94 ± 13 115 ± 15 234 ± 51 291 ± 33 G
ALT (UI/L) 40 ± 8 39 ± 8 280 ± 24 303 ± 46 G
TNFα (pg/ml) 11.1 ± 0.8 10.0 ± 0.9 9.6 ± 0.7 9.7 ± 0.7
Cholesterol (mM) 1.81 ± 0.18 2.18 ± 0.08 5.79 ± 0.50 6.28 ± 0.49 G
Triglycerides (mM) 1.07 ± 0.11 1.12 ± 0.03 0.90 ± 0.06 0.87 ± 0.05 G
NEFA (mM) 0.39 ± 0.05 0.36 ± 0.04 0.45 ± 0.01 0.71 ± 0.08*† G, E, GxE
Glycerol (µM) 546 ± 33 715 ± 69 690 ± 71 841 ± 49 G, E
β-Hydroxybutyrate (mM) 0.14 ± 0.03 0.15 ± 0.03 0.12 ± 0.02 0.08 ± 0.02
Antioxidant status (mM) 0.93 ± 0.07 0.85 ± 0.08 1.36 ± 0.20 1.37 ± 0.16 G
Iron (µM) 21.2 ± 1.7 25.7 ± 1.2 33.6 ± 5.8 31.7 ± 2.5 G
Ferritin (ng/ml) 41.2 ± 2.6 39.8 ± 2.4 43.0 ± 6.6 40.4 ± 3.3
IGF-I (ng/ml) 294 ± 28 213 ± 25† 395 ± 51* 167 ± 18† E, GxE
This article has not been copyedited and formatted. The final version may differ from this version.JPET Fast Forward. Published on July 8, 2009 as DOI: 10.1124/jpet.109.155168
at ASPE
T Journals on June 4, 2018
jpet.aspetjournals.orgD
ownloaded from

JPET#155168
32
TABLE 2
Hepatic oxidative stress and antioxidant enzymes in lean and ob/ob mice after 6 months of water
or ethanol drinking.
Results are mean ± SEM for 6 to 8 mice. G, effect of genotype, E, effect of ethanol administration.
Lean,
naïve
Lean,
ethanol
Obese,
naïve
Obese,
ethanol
CYP2E1 expression
(% of lean, untreated) 100.0 ± 6.9 155.6 ± 9.1 103.8 ± 11.5 146.3 ± 3.8 E
Aniline hydroxylase activity
(pmoles/min/ mg proteins) 0.57 ± 0.05 0.81 ± 0.04 0.74 ± 0.11 0.97 ± 0.07 G, E
MnSOD expression
(% of lean, untreated) 100.0 ± 6.0 175.8 ± 8.1 120.5 ± 4.7 166.0 ± 7.7 E
Aconitase
(mU/mg proteins) 8.55 ± 0.42 7.82 ± 0.56 7.2 ± 0.68 4.90 ± 0.17 G, E
Glutathione
(nmoles/mg proteins) 57.3 ± 6.9 41.3 ± 3.4 78.3 ± 4.9 74.5 ± 4.5 G
Glutathione peroxidase activity
(pmoles/min/ mg proteins) 320 ± 16 287 ± 13 301 ± 13 215 ± 12 G, E
Glutathione reductase activity
(pmoles/min/ mg proteins) 57.1 ± 4.4 54.8 ± 2.6 59.3 ± 2.0 54.8 ± 2.0
Glutathione transferase activity
(µmoles/min/ mg proteins) 1.74 ± 0.12 1.50 ± 0.09 1.62 ± 0.14 1.37 ± 0.22
This article has not been copyedited and formatted. The final version may differ from this version.JPET Fast Forward. Published on July 8, 2009 as DOI: 10.1124/jpet.109.155168
at ASPE
T Journals on June 4, 2018
jpet.aspetjournals.orgD
ownloaded from

This article has not been copyedited and formatted. The final version may differ from this version.JPET Fast Forward. Published on July 8, 2009 as DOI: 10.1124/jpet.109.155168
at ASPE
T Journals on June 4, 2018
jpet.aspetjournals.orgD
ownloaded from

This article has not been copyedited and formatted. The final version may differ from this version.JPET Fast Forward. Published on July 8, 2009 as DOI: 10.1124/jpet.109.155168
at ASPE
T Journals on June 4, 2018
jpet.aspetjournals.orgD
ownloaded from

This article has not been copyedited and formatted. The final version may differ from this version.JPET Fast Forward. Published on July 8, 2009 as DOI: 10.1124/jpet.109.155168
at ASPE
T Journals on June 4, 2018
jpet.aspetjournals.orgD
ownloaded from

This article has not been copyedited and formatted. The final version may differ from this version.JPET Fast Forward. Published on July 8, 2009 as DOI: 10.1124/jpet.109.155168
at ASPE
T Journals on June 4, 2018
jpet.aspetjournals.orgD
ownloaded from

This article has not been copyedited and formatted. The final version may differ from this version.JPET Fast Forward. Published on July 8, 2009 as DOI: 10.1124/jpet.109.155168
at ASPE
T Journals on June 4, 2018
jpet.aspetjournals.orgD
ownloaded from

This article has not been copyedited and formatted. The final version may differ from this version.JPET Fast Forward. Published on July 8, 2009 as DOI: 10.1124/jpet.109.155168
at ASPE
T Journals on June 4, 2018
jpet.aspetjournals.orgD
ownloaded from