tn2723 - municipal solid waste generation, recycling, and
TRANSCRIPT
1
The U.S. Environmental Protection Agency (EPA) has collected and reported data on the generation and disposal of waste in the United States for more than 30 years. We use this information to measure the success of waste reduction and recycling programs across the country. These facts and figures are current through calendar year 2010.
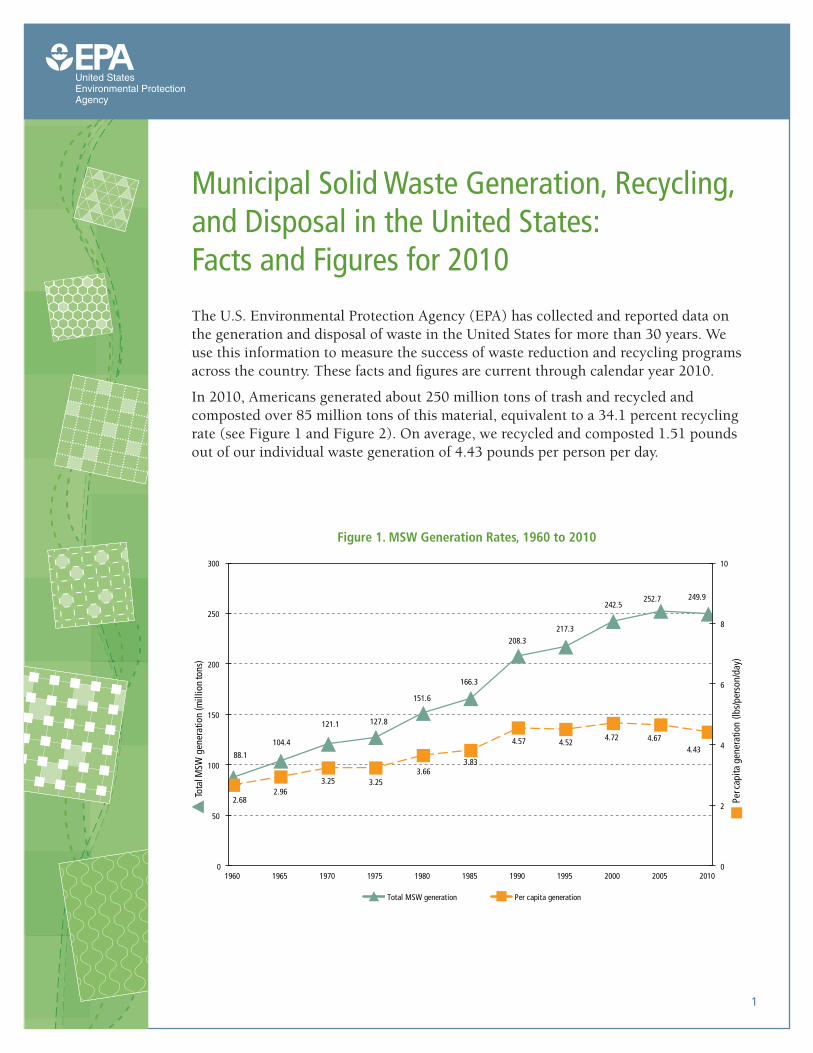
In 2010, Americans generated about 250 million tons of trash and recycled and composted over 85 million tons of this material, equivalent to a 34.1 percent recycling rate (see Figure 1 and Figure 2). On average, we recycled and composted 1.51 pounds out of our individual waste generation of 4.43 pounds per person per day.
Municipal Solid Waste Generation, Recycling, and Disposal in the United States: Facts and Figures for 2010
Figure 1. MSW Generation Rates, 1960 to 2010
88.1
104.4
121.1 127.8
151.6
166.3
208.3217.3
242.5252.7 249.9
2.682.96
3.25 3.253.66
3.83
4.57 4.524.72 4.67
4.43
0
2
4
6
8
10
0
50
100
150
200
250
300
1960 1965 1970 1975 1980 1985 1990 1995 2000 2005 2010
Per c
apita
gen
erat
ion
(lbs/
pers
on/d
ay)
Tota
l MSW
gen
erat
ion
(mill
ion
tons
)
Total MSW generation Per capita generation

2
Trends in Municipal Solid Waste in 2010 Our trash, or municipal solid waste (MSW), is made up of the things we commonly use and then throw away. These materials include items such as packaging, food scraps, grass clippings, sofas, computers, tires, and refrigerators. MSW does not include industrial, hazardous, or construction waste.
In 2010, Americans recovered almost 65 million tons of MSW (excluding composting) through recycling. Composting recovered over 20 million tons of waste. We combusted about 29 million tons for energy recovery (about 12 percent). Sub-tracting out what we recycled and composted, we combusted (with energy recovery) or discarded 2.9 pounds per person per day.
In 2010, newspaper/mechanical papers recovery was about 72 percent (7 million tons), and about 58 percent of yard trimmings were recovered (see Figure 3). Metals were recycled at a rate of about 35 percent (see Table 1). By recycling almost 8 mil-lion tons of metals (which includes aluminum, steel, and mixed metals), we eliminated greenhouse gas (GHG) emissions totaling more than 26 million metric tons of carbon dioxide equivalent (MMTCO
2E).
This is equivalent to removing more than 5 million cars from the road for one year.*
About 136 million tons of MSW (54.2 percent) were discarded in landfills in 2010 (see Figure 4).
Over the last few decades, the generation,
recycling, composting, and disposal of MSW
have changed substantially.
While solid waste generation
has increased from 3.66 to
4.43 pounds per person per
day between 1980 and 2010,
the recycling rate has also increased–from less
than 10 percent of MSW generated in 1980 to
about 34 percent in 2010. Disposal of waste to
a landfill has decreased from 89 percent of the
amount generated in 1980 to about 54 percent
of MSW in 2010.
Figure 2. MSW Recycling Rates, 1960 to 2010
5.6 6.5 8.0 9.314.5
16.7
33.2
55.8
69.5
79.9
85.1
6.4% 6.2% 6.6% 7.3%
9.6% 10.1% 16.0%
25.7%
28.6%
31.6%
34.1%
0%
10%
20%
30%
40%
50%
0
10
20
30
40
50
60
70
80
90
1960 1965 1970 1975 1980 1985 1990 1995 2000 2005 2010
Perc
ent o
f gen
erat
ion
recy
cled
Tota
l MSW
recy
clin
g (m
illio
n to
ns)
Total MSW recycling Percent recycling
* All benefit calculations in this fact sheet are derived from EPA’s Waste Reduction Model (WARM). Please see www.epa.gov/warm

3
Figure 3. Recycling Rates of Selected Products, 2010*
120
0
20
40
60
80
100 96.2
AutoBatteries
71.6
Newspapers/Mechanical
Papers
67.0
SteelCans
57.5
YardTrimmings
49.6
Aluminum Beer& Soda Cans
35.5
Tires
33.4
GlassContainers
27.5
HDPE Natural(White Translucent)
Bottles
29.2
PET Bottles& Jars
Recy
clin
g Ra
te
Products
Figure 4. Management of MSW in the United States, 2010
Discarded54.2%
Combustion withEnergy Recovery
11.7%
Recovery34.1%
Figure 4: Management of MSW in the United States, 2010
*Does not include combustion with energy recovery.

4
Sources of MSWWe estimated residential waste (including waste from apartment houses) to be 55 to 65 percent of total MSW generation. Waste from commercial and institutional locations, such as businesses, schools, and hospitals amounted to 35 to 45 percent.
Analyzing MSWWe analyze waste by material, such as paper and paperboard, yard trimmings, food scraps, and plastics, and by major product categories, which include durable goods (such as furniture), nondurable goods (such as paper or clothing), containers and packaging (such as milk cartons and plastic wrap), and other materials (such as food scraps).
Materials in MSWTotal MSW generation in 2010 was 250 million tons. Organic materials continue to be the largest com ponent of MSW. Paper and paperboard account for 29 percent and yard trimmings and food scraps account for another 27 percent. Plastics comprise 12 percent; metals make up 9 percent; and rubber, leather, and textiles account for 8 percent. Wood follows at around 6 percent and glass at 5 percent. Other mis cellaneous wastes make up approximately 3 percent of the MSW generated in 2010 (see Figure 5).
Figure 5. Total MSW Generation (by material), 2010 250 Million Tons (before recycling)
Paper28.5%
Glass4.6%
Metals9.0%
Plastics12.4%
Rubber, leatherand textiles
8.4%
Wood6.4%
Yardtrimmings
13.4%
Food scraps13.9%
Other 3.4%
Figure 5. Total MSW Generation (by material), 2010250 Million Tons (before recycline)
Nationally, we recycled and composted just over 85
million tons of municipal solid waste. This provides
an annual benefit of more than 186 million metric
tons of carbon dioxide equivalent emissions reduced,
comparable to the annual GHG emissions from over
36 million passenger vehicles.

5
Material Weight Generated Weight RecoveredRecovery as Percent
of Generation
Paper and paperboard 71.31 44.57 62.5%
Glass 11.53 3.13 27.1%
Metals
Steel 16.90 5.71 33.8%
Aluminum 3.41 0.68 19.9%
Other nonferrous metals† 2.10 1.48 70.5%
Total metals 22.41 7.87 35.1%
Plastics 31.04 2.55 8.2%
Rubber and leather 7.78 1.17 15.0%
Textiles 13.12 1.97 15.0%
Wood 15.88 2.30 14.5%
Other materials 4.79 1.41 29.4%
Total materials in products 177.86 64.97 36.5%
Other wastes
Food, other‡ 34.76 0.97 2.8%
Yard trimmings 33.40 19.20 57.5%
Miscellaneous inorganic wastes 3.84 Negligible Negligible
Total other wastes 72.00 20.17 28.0%
Total municipal solid waste 249.86 85.14 34.1 %
Table 1. Generation and Recovery of Materials in MSW, 2010* (in millions of tons and percent of generation of each material)
* Includes waste from residential, commercial, and institutional sources.
† Includes lead from lead-acid batteries.
‡ Includes recovery of other MSW organics for composting.
Details might not add to totals due to rounding.
Negligible = Less than 5,000 tons or 0.05 percent.

6
Significant amounts of material from each category were recycled or composted in 2010. The highest recovery rates were achieved in paper and paperboard, yard trim-mings, and metals. We recycled more than 62 percent of the paper and paperboard we generated. Over 19 million tons of yard trimmings were composted, representing almost a five-fold increase since 1990. Recycling these three materials alone kept almost 29 percent of MSW out of landfills and combustion facilities. Recycling amounts and rates (recovery as a percent of generation) for all materials in 2010 are listed in Table 1.
Products in MSWThe breakdown, by weight, of waste generated in 2010 by product category is shown in Figure 6. Con tainers and packaging made up the largest portion of MSW generated: about 30 percent, or almost 76 million tons. The second largest portion came from nondurable goods, which amounted to 21 per-cent, or about 53 million tons. Durable goods make up the third largest segment, accounting for about 20 percent, or 49 million tons.
The generation and recovery of materials in the product categories, by weight and recovery as a percent of generation, are shown in Table 2. This table shows that the recovery of containers and packaging was the highest of the four product categories, with over 48 percent of the generated materials recycled. Paper prod-ucts, steel, and aluminum were the most recycled materials by percentage in this category. About 71 percent of paper and paperboard containers and packaging was recycled, including 85 percent of all corrugated boxes. Sixty-nine percent of steel packaging (mostly cans) was recycled. The recycling rate for aluminum packaging was about 36 percent, including almost 50 percent of aluminum beverage cans.
Figure 6. Total MSW Generation (by category), 2010 250 million tons (before recycling)
Figure 6: Total MSW Generation (by Category), 2007
249.6 million tons (Before Recycling)
Other Wastes1.5%
Containers & Packaging 30.3%
Nondurable Goods 21.3%
Food Scraps 13.9%
Yard Trimmings 13.4%
Durable Goods 19.6%
Recycling and composting more than 85
million tons of MSW saved more than 1.3
quadrillion Btu of energy,
the equivalent of over
229 million barrels of oil.

7
Products Weight Generated Weight RecoveredRecovery as Percent of
Generation
Durable goods
Steel 14.16 3.82 27.0%
Aluminum 1.31 Negligible Negligible
Other non-ferrous metals† 2.10 1.48 70.5%
Glass 2.17 Negligible Negligible
Plastics 10.96 0.70 6.4%
Rubber and leather 6.74 1.17 17.4%
Wood 5.89 Negligible Negligible
Textiles 3.93 0.50 12.7%
Other materials 1.82 1.41 77.5%
Total durable goods 49.08 9.08 18.5%
Nondurable goods
Paper and paperboard 33.57 17.72 52.7%
Plastics 6.40 Negligible Negligible
Rubber and leather 1.04 Negligible Negligible
Textiles 8.90 1.47 16.5%
Other materials 3.23 Negligible Negligible
Total nondurable goods 53.14 19.19 36.1%
Containers and packaging
Steel 2.74 1.89 69.0%
Aluminum 1.90 0.68 35.8%
Glass 9.36 3.13 33.4%
Paper and paperboard 37.68 26.85 71.3%
Plastics 13.68 1.85 13.5%
Wood 9.94 2.30 23.1%
Other materials 0.34 Negligible Negligible
Total containers and packaging 75.64 36.70 48.5%
Other wastes
Food, other‡ 34.76 0.97 2.8%
Yard trimmings 33.40 19.20 57.5%
Miscellaneous inorganic wastes 3.84 Negligible Negligible
Total other wastes 72.00 20.17 28.0%
Total municipal solid waste 249.86 85.14 34.1%
Table 2. Generation and Recovery of Products in MSW, 2010* (in millions of tons and percent of generation of each product)
* Includes waste from residential, commercial, and institutional sources.† Includes lead from lead-acid batteries.‡ Includes recovery of other MSW organics for composting. Details might not add to totals due to rounding. Negligible = less than 5,000 tons or 0.05 percent.

8
Activity 1960 1970 1980 1990 2000 2005 2007 2008 2009 2010
Generation 88.1 121.1 151.6 208.3 242.5 252.7 255.4 251.4 243.7 249.9
Recovery for recycling
5.6 8.0 14.5 29.0 53.0 59.3 63.1 61.7 61.5 64.9
Recovery for composting*
Negligible Negligible Negligible 4.2 16.5 20.6 21.7 22.1 20.8 20.2
Total materials recovery
5.6 8.0 14.5 33.2 69.5 79.9 84.8 83.8 82.3 85.1
Combustion with energy recovery†
0.0 0.4 2.7 29.7 33.7 31.6 32.0 31.6 29.0 29.3
Discards to landfill, other disposal‡
82.5 112.7 134.4 145.3 139.4 141.2 138.6 136.0 132.4 135.5
Over 33 percent of glass containers were recycled while about 23 percent of wood packaging, mostly wood pallets, was recovered. Over 13 percent of plastic containers and packaging was recycled, mostly from soft drink, milk, and water bottles. Plastic bottles were the most recycled plastic products. Polyethylene terephthalate (PET) bottles and jars were recovered at about 29 percent. Recovery of high density polyethylene (HDPE) natural (white translucent) bottles was estimated at about 28 percent (see 2010 MSW Tables and Figures).
Overall recovery of nondurable goods was just over 36 percent in 2010. Nondurable goods generally last less than three years. Newspapers/mechanical papers and other paper products were the most recycled nondurable goods. Newspapers/mechanical papers include newspapers, directories, inserts, and some advertisement and direct mail printing. About 72 percent of newspapers/mechanical papers were recov-ered. Collectively, the recovery of other paper products such as office paper and magazines was 45 percent in 2010. Clothing, footwear, and other textile products are included in the nondurable goods category. These products were recovered for recycling at a rate of over 14 percent.
Overall, more than 18 percent of durable goods was recovered in 2010. Nonferrous metals other than aluminum had one of the highest recovery rates due to the high rate of lead recov ery from lead-acid
Table 3. Generation, Materials Recovery, Composting, Combustion With Energy Recovery, and Discards of MSW, 1960 to 2010 (in millions of tons)
* Composting of yard trimmings, food scraps, and other MSW organic material. Does not include backyard composting.
† Includes combustion of MSW in mass burn or refuse-derived fuel form, and combustion with energy recovery of source separated materials in MSW (e.g., wood pallets, tire-derived fuel).
‡ Discards after recovery minus combustion with energy recovery. Discards include combustion without energy recovery.
Details might not add to totals due to rounding.
Every ton of mixed paper recycled
can save the energy
equivalent of 165
gallons
of gasoline.

9
Recycling and Composting Collection Programs**
• Approximately 9,000 curbside recycling
programs exist nationwide, up from
8,875 in 2002.
• About 3,090 community composting
programs were documented in 2010, a
decrease from 3,227 in 2002.
batteries. With a 96 percent recycling rate, lead-acid bat-teries continue to be one of the most recovered products. Recovery of steel in all durable goods was 27 percent, with high rates of recovery from appliances and other miscel-laneous items.
Measured by percentage of generation, products with the highest recovery rates in 2010 were lead-acid batteries (96 percent), corrugated boxes (85 percent), newspapers/mechanical papers (72 percent), steel pack-aging (69 percent), major appliances (65 percent), yard trimmings (58 percent), aluminum cans (50 percent), and mixed paper (45 percent) (see 2010 MSW Tables and Figures).
Activity 1960 1970 1980 1990 2000 2005 2007 2008 2009 2010
Generation 2.68 3.25 3.66 4.57 4.72 4.67 4.64 4.53 4.35 4.43
Recovery for recycling
0.17 0.22 0.35 0.64 1.03 1.10 1.15 1.11 1.10 1.15
Recovery for composting*
Negligible Negligible Negligible 0.09 0.32 0.38 0.39 0.40 0.37 0.36
Total Materials Recovery
0.17 0.22 0.35 0.73 1.35 1.48 1.54 1.51 1.47 1.51
Combustion with energy recovery†
0.00 0.01 0.07 0.65 0.66 0.58 0.58 0.57 0.52 0.52
Discards to landfill, other disposal‡
2.51 3.02 3.24 3.19 2.71 2.61 2.52 2.45 2.36 2.40
Population (millions)
179.979 203.984 227.255 249.907 281.422 296.410 301.621 304.060 307.007 309.051
Table 4. Generation, Materials Recovery, Composting, Combustion With Energy Recovery, and Discards of MSW, 1960 to 2010 (in pounds per person per day)
* Composting of yard trimmings, food scraps, and other MSW organic material. Does not include backyard composting.
† Includes combustion of MSW in mass burn or refuse-derived fuel form, and combustion with energy recovery of source separated materials in MSW (e.g., wood pallets, tire-derived fuel).
‡ Discards after recovery minus combustion with energy recovery. Discards include combustion without energy recovery.
Details might not add to totals due to rounding.
** Source: For 2002 data: BioCycle 2006. For 2010 data: EPA, Municipal Solid Waste in the United States: 2010 Data Tables and Figures.

10
Disposing of MSWWhile the number of U.S. landfills has steadily declined over the years, the average landfill size has increased. At the national level, landfill capacity appears to be sufficient, although it is limited in some areas.
• Since 1990, the total amount of MSW going to landfills dropped by almost 10 million tons, from 145.3 mil lion to 135.5 million tons in 2010 (see Table 3).
• The net per capita discard rate (after recycling, composting, and combustion for energy recovery) was 2.40 pounds per per-son per day, lower than the 2.51 per capita rate in 1960, when virtually no recycling occurred in the United States (see Table 4).
The Benefits of RecyclingRecycling has environmental benefits at every stage in the life cycle of a consumer product–from the raw material with which it’s made to its final method of disposal. Aside from reducing GHG emis sions, which contribute to global warming, recycling also reduces air and water pollution associated with making new products from raw materials. By utilizing used, unwanted, or obsolete materials as industrial feedstocks or for new materials or products, we can each do our part to make recycling work. Recycling also provides significant economic and job creation impacts, a topic discussed at www.epa.gov/epawaste/conserve/rrr/rmd/econ.htm.
In 2010, nationally, we recycled and composted over 85 million tons of MSW. This provides an annual benefit of more than 186 million metric tons of carbon dioxide equivalent emissions reduced, comparable to removing the emissions from over 36 million pas senger vehicles. But the ultimate benefits from recycling are cleaner land, air, and water, overall better health, and a more sustainable economy.
ResourcesThe data summarized in this fact sheet characterizes the MSW stream as a whole by using a materials flow methodol-ogy that relies on a mass balance approach. For example, to determine the amounts of paper recycled, information is gathered on the amounts processed by paper mills and made into new paper on a national basis plus recycled paper exported, instead of counting paper collected for recycling on a state-by-state basis. Using data gathered from indus-try associations, businesses, and government sources, such as the U.S. Department of Commerce and the U.S. Census Bureau, we estimate tons of materials and products gener-ated, recycled, and discarded. Other sources of data, such as waste characterizations and research reports performed by governments, industry, or the press, supplement these data.
Recycling just 1 ton of aluminum
cans conserves more than 207
million Btu,
the equivalent
of 36 barrels
of oil, or 1,665
gallons of
gasoline.
Energy Recovered from Waste Combustion
• In 2010, over 29 million tons of
materials, or 11.7 percent, were
combusted for energy recovery.
• MSW combustion for energy re-
covery has decreased from about
34 million tons in 2000 to 29
million tons in 2010.

11
The benefits of recycling and composting, such as elimination of GHG emissions, are calculated using EPA’s WARM methodology. Please see: www.epa.gov/warm.
WARM calculates and totals GHG emissions of baseline and alternative waste management practices including source reduction, recycling, composting, combustion, and landfilling. The model calculates emissions in metric tons of carbon equivalent (MTCE), metric tons of carbon dioxide equivalent (MTCO
2E),
and energy units (million Btu) across a wide range of material types commonly found in MSW. EPA devel-oped GHG emissions reduction factors through a life-cycle assessment methodology. EPA’s report, Solid Waste Management and Greenhouse Gases: A Life-Cycle Assess ment of Emissions and Sinks (EPA-530-R-02-006), describes this methodology in detail (www.epa.gov/climatechange/wycd/waste/downloads/fullreport.pdf).
Full data tables on MSW characterization that support this Report and Summaries of the MSW charac-terization methodology and WARM are available on the EPA website along with information about waste reduction and recycling. Please see:
www.epa.gov/epawaste/nonhaz/municipal/msw99.htm
www.epa.gov/epawaste/conserve/rrr/index.htm.
In percentage of total MSW generation,
recovery for recycling (including composting)
did not exceed 15 percent until 1990.
Growth in the recovery rate to current
levels (34.1 percent) reflects an increase
in infrastructure and market demand for
recovery over the last decade.

12
United States Environmental Protection AgencySolid Waste and Emergency Response (5306P)Washington, DC 20460
Official BusinessPenalty for Private Use $300
EPA-530-F-11-005 December 2011www.epa.gov/wastes