tns media intelligence/ campaign media analysis group march 27, 2008 the “business” of politics...
TRANSCRIPT

TNS Media Intelligence/ Campaign Media Analysis Group
March 27, 2008
The “Business” of Politics
The 2008 Election Forecast Update

2
Located in Arlington, VA
Providing insights on political ad spending since 1997
Track, analyze and forecast political public affairs and issue-advocacy advertising
Experienced political researchers assemble the most reliable comprehensive research and reporting
Help clients better manage their media strategy, media buys, public relations and communications efforts
TNS Media Intelligence/CMAG

3
Elections and the Media Economy
Campaign 2008 Election Spending Forecast
The political marketplace
The spending drivers
The Forecast by the Numbers
The race for the White House
The House and Senate
State and local
The Role New Media
Not a banner year
Ask Chuck

4
Campaign 2008 Election Spending Forecast:
The Political Marketplace

5
The Uniqueness of the Marketplace
Four year business cycle
- Majority of ad spending in final 60 days before an election
Upward growth in ad spending
- Multi-level messaging - Changes to campaign finance laws - More campaigns using TV advertising
Event driven
“The Democrats' project is being considered a new benchmark
in the trend toward ‘permanent campaigns,’ which specialists
said is transforming the political culture.”
- The Boston Globe
The Changing “Business” of Politics:The Political Marketplace

6
The Changing “Business” of Politics:Total Spend in Comparison (2002-2006)
$ billions3
1
2
2002 2004 2006
+62% from 2002
+35% from 2004
$1.0 $1.7 $2.6
Total Ad Spend
Total TV Spend
$2.4
$.2
Total All Other Media*

7
Campaign 2008 Election Spending Drivers
CMAG Forecast: $3 Billion on Campaign Ads
12 percent of total and climbing
Spending Drivers:
Historic presidential race
State and federal races
Well-funded special interest groups
$300-400 million on issue advocacy

8
2008 Forecast By The Numbers
PresidentialOther FederalState and Local

9
Campaign 2008 Election Spending Forecast:By the Numbers
Breakdown of 2008 Forecast vs. Actual 2008
Presidential Race:Candidate $400-460 million $89 million*Party $150-175 million $106,000Groups $100-140 million $14 million
*January-March 18th 2008

10
Campaign 2008 Election Spending Forecast: By the Numbers
2008 Race for the White House
Primary Overview:
Over $210m on TV since February 2007
Democrats combined spending $106m vs. $57m for the GOP
Majority of “group” spending on issues
Ad spending focused on early states
- $87m spent on TV ads in IA, NH and SC
- Contests by contest focused

11
2008 The Democrats:The Strategy
Barack Obama
Spending: $52m on TV - Outspent Clinton in 35 out of 41
states- 41 percent of recent ad spending in
prime timeStrategy: - Go on the air first in key states- Focus buys into population centers- Use local and national surrogates in
some ads- Using niche media to fortify
Hillary Clinton
Spending: $35m on TV
Strategy - Heaviest in the “must win” state - First to use negative ads

12
2008 The Republicans: John McCain
Spending:
- $9.5m on TV- Minimal spending post-Florida
Strategy:
- “All in” in New Hampshire- Ride the momentum
Message Strategy:
- Disciplined - Biography and service

13
2008 The Others
Candidate
No Bloomberg
Yes Nader
Maybe others?
Groups
$50m in primary
Groups pledged $700m
Typically used for issue awareness
Recent ads more tactical
General election ads beginning from groups on the left
14
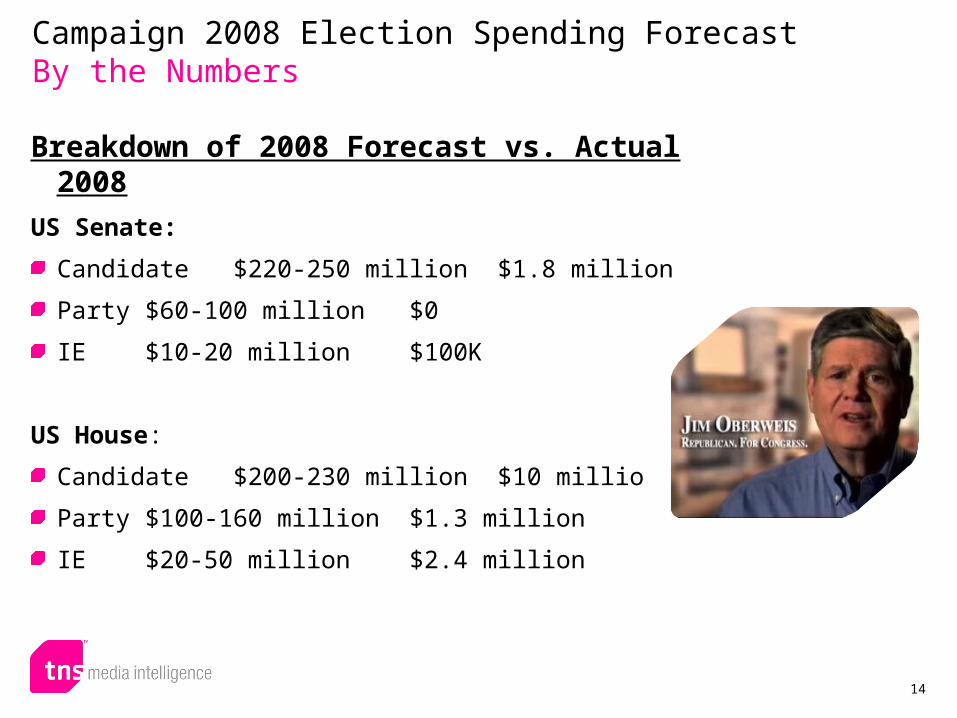
Campaign 2008 Election Spending Forecast By the Numbers
Breakdown of 2008 Forecast vs. Actual 2008
US Senate:
Candidate $220-250 million $1.8 million
Party $60-100 million $0
IE $10-20 million $100K
US House:
Candidate $200-230 million $10 million
Party $100-160 million $1.3 million
IE $20-50 million $2.4 million

15
Campaign 2008 Election Spending Forecast:By the Numbers
US Senate - Sea of red- GOP on defense- Groups engaged
US House- Historic number of competitive
seats - Retirements adding primaries

16
Campaign 2008 Election Spending Forecast: By the Numbers
Breakdown of 2008 Forecast vs. Actual 2008
State and Local
Governors $90-110 million $3.1 million
Ballots $190-230 million $114 million
Judges/AG $50-60 million $3 million
Other $175-250 million $11 million
Issue: $330-400 million $77 million

17
Campaign 2008 Election Spending Forecast: By the Numbers
Governors
- 11 states holding governor elections
Ballot Measures
- 28 States - Affirmative action, abortion,
healthcare, gaming, gay rights, taxes immigration and unions
- Over $100m in CA on round 1 of 3Issue Ad Spending
- Energy, environment, and telecom

18
Campaign 2008 Election Spending Forecast:The Perfect Storm States of 2008
TX
CA
NM
CO
IL
IA
MN
FL
WI
MO
MI
PA
IN
NC
VAKY
OH
ME
RI
NH
MT
ID
UT
WY
AL
AR
MS
SC
VT
NJ
DE
AZ
NV
OR
KS
NE
SD
ND
OK
WA
GA
LA
NY
TN
WV
CT
MD
MA
AK
HI
COLD
MEDIUM
HOT

19
The Role of the New Media

20
Top tier presidential campaigns
Online ads mostly used for fundraising and grassroots
$3-4 million total spent
Top sites – local and national news, ideology, demographic, sports and election
Mistakes and perception
Campaign 2008 Election Spending Forecast:The Role of the Internet in the 2008 Election

21
Looking Ahead: 2009
Start of a new political business cycle
Winning strategies will show the way
Make-up of US House and Senate
2008 issues drive 2009 issue ad spending:
Economy
China and NAFTA trade
Healthcare
Energy
Iraq
2010 redistricting
Rethink primary process

22
Ask Chuck

23
Past, Present, Future