top 10 species groups in global aquaculture 2017 · 2019-06-28 · 3 the latest fao global...
TRANSCRIPT

Top 10 species groups in global aquaculture 2017Written by
Junning Cai,a Xiaowei Zhou,a Xue Yan,b Daniela Lucentea and Camilla Laganaa
a Food and Agriculture Organization of the United Nations (FAO)b Chinese Academy of Fishery Sciences (CAFS)

2
Highlights (2017)
Freshwater fishes– Carps, barbels and other cyprinids: #1 species group, accounting for a quarter of global aquaculture
production quantity (112 million tonnes) and value (USD 250 billion) in 2017; including 38 ASFIS species items farmed in 92 countries (or territories); four carp species (grass carp, silver carp, common carp and bighead carp) are among the top 10 ASFIS species items by quantity and/or value.
– Tilapias and other cichlids: 5.25 percent (#4) of world aquaculture by quantity and 4.42 percent (#4) by value; the most popular species group farmed in 127 countries; Nile tilapia is the #9 ASFIS species item by quantity and #8 by value.
– Catfishes: 4.93 percent (#7) of world aquaculture by quantity and 4.24 percent (#5) by value; including 27 ASFIS species items farmed in 86 countries.
– Freshwater perch-like fishes: 2.85 percent (#9) of world aquaculture by value; a high-value group, including nine ASFIS species items farmed in 30 countries.
– Freshwater fishes nei: 2.19 percent (#10) of world aquaculture by quantity; including miscellaneous freshwater fishes farmed in 65 countries.
Diadromous fishes– Salmons, trouts, smelts: 3.11 percent (#9) of world aquaculture by quantity and 8.94 percent (#3)
by value; a high-value group, including 20 ASFIS species items farmed in 83 countries; Atlantic salmon is the #2 ASFIS species item by value.
Crustaceans– Marine shrimps and prawns: 4.92 percent (#8) of world aquaculture by quantity and 13.71 percent
(#2) by value; a high-value group, including 14 ASFIS species items farmed in 60 countries; whiteleg shrimp is the #6 ASFIS species item by quantity and #1 by value.
– Crayfishes: 4.01 percent (#6) of world aquaculture by value; a high-value group, including seven ASFIS species items farmed in 15 countries; red swamp crawfish is the #5 ASFIS species item by value.
– Freshwater crabs: 3.82 percent (#8) by value; a high-value group, including one species farmed in three countries, the Chinese mitten crab, which is the #6 ASFIS species item by value.
Molluscs– Oysters: 5.10 percent (#5) of world aquaculture by quantity and 2.72 percent (#10) by value, including
12 ASFIS species items farmed in 44 countries; cupped oysters nei is the #4 ASFIS species item by quantity.
– Clams, cockles, arkshells: 5.05 percent (#6) of world aquaculture by quantity and 3.92 percent (#7) by value; including 29 ASFIS species items farmed in 21 countries; Japanese carpet shell is the #7 ASFIS species item by quantity and #10 by value.
Aquatic plants– Red seaweeds: 15.42 percent (#2) of world aquaculture by quantity; including eight ASFIS species
items farmed in 32 countries; Eucheuma seaweeds nei and Gracilaria seaweeds are, respectively, the #2 and #7 ASFIS species item by quantity.
– Brown seaweeds: 12.30 percent (#3) of world aquaculture by quantity; including eight ASFIS species items farmed in 12 countries; Japanese kelp is the #1 ASFIS species item by quantity.
World aquaculture, excluding China– Milkfish: 3.63 percent (#9) of world aquaculture, excluding China, by quantity and 2.41 percent (#10) by
value; a diadromous fish group, including one species farmed in 18 countries.– Marine perch-like fishes: 3.42 percent (#7) of world aquaculture, excluding China, by value; a
high-value marine fish group, including 44 ASFIS species items farmed in 42 countries. – Mussels: 2.6 percent (#10) of world aquaculture, excluding China, by quantity and 3.81 percent (#6)
by value; a molluscs group, including 12 ASFIS species items farmed in 43 countries.
WA
PI
FAC
TS
HE
ET
reduce to 10,5pt so until note in p.2

3
The latest FAO global aquaculture production statistics record 608 species items (under the ASFIS – Aquatic Sciences and Fisheries Information System – list of aquatic species) that have been farmed in global aquaculture during 1950–2017.1, 2 Among them, 424 species items were farmed in 2017, with concrete production statistics recorded in the FAO database (compared to 254 species items in 1990).3
This factsheet examines 2017 global aquaculture production of these 424 species items to identify the top 10 most farmed ASFIS species items (in terms of quantity or value); the top 10 most farmed species groups;4 and the top 10 species groups in world aquaculture, excluding China.5 More information about top 10 aquaculture species (groups) at the regional level and national level (for major aquaculture producers) can be found in the supplementary materials to this factsheet.
TOP 10 ASFIS SPECIES ITEMS BY PRODUCTION QUANTITY
By production quantity (live weight), the ten most produced ASFIS species items in world aquaculture 2017 (Table 1) are the following: three seaweeds (Japanese kelp #1, Eucheuma seaweeds nei6 #2 and Gracilaria seaweeds #7); four freshwater fishes (grass carp #3, silver carp #5, Nile tilapia #9 and common carp #10); two molluscs (cupped oysters nei #4 and Japanese carpet shell #8); and one crustacean (whiteleg shrimp #6). Among them, Eucheuma seaweeds nei, Gracilaria seaweeds and cupped oysters nei are species groups, whereas the other seven ASFIS species items are single species.
The share of these top 10 species items in 2017 world aquaculture production quantity varies from 9.98 percent (Japanese kelp) to 3.69 percent (common carp); and they altogether accounted for half of the world’s aquaculture production tonnage (Table 1).
Among these top 10 species items, Nile tilapia and common carp are the two most popular species farmed in 78 countries (or territories)7 in 2017,8 followed by two carp species: grass carp (farmed in 38 countries) and silver carp (farmed in 37 countries). Whiteleg shrimp, a major international seafood commodity, is also farmed in a number of countries (36 in 2017), whereas the other top 10 ASFIS species items are farmed in a relatively fewer number of countries (Table 1).
TOP 10 ASFIS SPECIES ITEMS BY PRODUCTION VALUE
Of the top 10 farmed species items by quantity in Table 1, only six items remain on the top 10 list in terms of (farmgate) production value (Table 2), whereas the three seaweeds (Japanese kelp, Eucheuma seaweeds nei and Gracilaria seaweeds) and cupped oysters nei drop down from the top 10 value list. This should not be surprising since a large part of the live weight tonnage of these species items reflects water contents (in the case of seaweeds) or shell weight (in the case of oysters). Two of these four “heavy” items still belong to the top 20 ASFIS species items in terms of value (cupped oysters nei #14
JUN
E 2
019
Table 1: Top 10 ASFIS species items by quantity in world aquaculture, 2017
Top 10 ASFIS species items World aquaculture (2017 quantity)
ASFIS species Scientific nameISSCAAP division
Number of countries
farming the species item
World production quantity of the species item
(live weight; tonnes)
Share of world production
quantity of all species (%)
1. Japanese kelp Laminaria japonica Aquatic plants 4 11 174 505 9.98
2. Eucheuma seaweeds nei Eucheuma spp. Aquatic plants 13 8 637 534 7.72
3. Grass carp (= white Amur) Ctenopharyngodon idellus Freshwater fishes 38 5 519 487 4.93
4. Cupped oysters nei Crassostrea spp. Molluscs 9 4 905 215 4.38
5. Silver carp Hypophthalmichthys molitrix Freshwater fishes 37 4 704 673 4.20
6. Whiteleg shrimp Penaeus vannamei Crustaceans 36 4 456 603 3.98
7. Gracilaria seaweeds Gracilaria spp. Aquatic plants 7 4 311 040 3.85
8. Japanese carpet shell Ruditapes philippinarum Molluscs 7 4 228 206 3.78
9. Nile tilapia Oreochromis niloticus Freshwater fishes 78 4 130 281 3.69
10. Common carp Cyprinus carpio Freshwater fishes 78 4 129 100 3.69
Other species n.a. 55 749 978 49.80
All species 196 111 946 623 100.00
Data source: FAO Global Fishery and Aquaculture Production Statistics 1950–2017 (v2019.1.0), published through FishStatJ (March 2019). Available at www.fao.org/fishery/statistics/software/fishstatj/en.
Notes: Constructed by the FAO WAPI Aquaculture Production Module (WAPI-AQPRN); see Table 1.2 in WAPI-AQPRN v.2018.1 for an example (www.fao.org/fishery/statistics/software/wapi/en). ISSCAAP = International Standard Statistical Classification of Aquatic Animals and Plants.
reduce to 10,5pt so until note in p.2

4
and Japanese kelp #17), whereas the two red seaweed species items drop much lower (Gracilaria seaweeds #32 and Eucheuma seaweeds nei #54).
In 2017, whiteleg shrimp (ranked #1 by value and #6 by quantity) was the largest farmed ASFIS species item in terms of farmgate value, followed by Atlantic salmon (ranked #2 by value and #15 by quantity). These are two major international seafood commodities favoured by consumers worldwide.
In contrast, red swamp crawfish (ranked #5 by value and #24 by quantity) and Chinese mitten crab (ranked #6 by value and #34 by quantity) are niche species produced and consumed primarily by a single country – China. In 2017, China cultured over 1 million tonnes of red swamp crawfish (95 percent of the world total), valued at USD 9.8 billion (98 percent of the world total). Its three-quarter million tonnes of farmed Chinese mitten crab production, valued at USD 9.5 billion, accounted for virtually the entire world production.
Besides the three carp species on the top 10 quantity list (Table 1), the top 10 value list (Table 2) includes an additional carp species (i.e. bighead carp), which is ranked #9 by value and #11 by quantity.
TOP 10 SPECIES GROUPS IN WORLD AQUACULTURE
If not careful, one may form a misperception, based on Table 1 and Table 2, that in 2017 seaweeds are the largest aquaculture item in terms of quantity, while shrimps are the largest in terms of value. Indeed, carps are the unchallenged number 1 aquaculture species group in terms of both quantity (Table 3) and value (Table 4).
Carps, barbels and other cyprinids In 2017, the ISSCAAP group “Carps, barbels and other cyprinids” (or carps in short) were farmed in 92 countries with total production of 28 million tonnes (USD 61 billion), accounting for a quarter of world aquaculture in terms of both quantity (Table 3) and value (Table 4). China and India are the two major carp-farming countries, accounting for, respectively, 71 percent and 14 percent of world carp aquaculture production tonnage in 2017.
FAO statistics record 38 carp species items farmed worldwide in 2017;9 they are primarily staple fish for domestic consumption. In addition to the four carp species that appear in Table 1 and Table 2 (grass carp, common carp, silver carp and bighead carp), other carp species items that belong to the top 20 quantity list include Carassius spp. (e.g. crucian carp, Carassius carassius) #12; Catla (Catla catla) #13; and Roho labeo (Labeo rohita) #18.
WA
PI
FAC
TS
HE
ET
Table 2: Top 10 ASFIS species items by value in world aquaculture, 2017
Top 10 ASFIS species items World aquaculture (2017 value)
ASFIS species Scientific name ISSCAAP division
Number of countries
farming the species item
World production value
of the species item (farmgate;
USD 1 000)
Share of world
production value of all species (%)
1. Whiteleg shrimp Penaeus vannamei Crustaceans 36 26 743 265 10.72
2. Atlantic salmon Salmo salar Diadromous fishes 14 16 697 788 6.69
3. Grass carp (= white Amur) Ctenopharyngodon idellus Freshwater fishes 38 12 649 100 5.07
4. Silver carp Hypophthalmichthys molitrix Freshwater fishes 37 10 268 207 4.11
5. Red swamp crawfish Procambarus clarkii Crustaceans 3 10 003 537 4.01
6. Chinese mitten crab Eriocheir sinensis Crustaceans 3 9 540 416 3.82
7. Common carp Cyprinus carpio Freshwater fishes 78 8 635 866 3.46
8. Nile tilapia Oreochromis niloticus Freshwater fishes 78 7 612 374 3.05
9. Bighead carp Hypophthalmichthys nobilis Freshwater fishes 19 7 318 744 2.93
10. Japanese carpet shell Ruditapes philippinarum Molluscs 7 6 957 089 2.79
Other species n.a. 133 152 775 53.35
All species 196 249 579 163 100.00
Data source: FAO Global Fishery and Aquaculture Production Statistics 1950–2017 (v2019.1.0), published through FishStatJ (March 2019). Available at www.fao.org/fishery/statistics/software/fishstatj/en.
Notes: Constructed by the FAO WAPI Aquaculture Production Module (WAPI-AQPRN); see Table 1.2 in WAPI-AQPRN v.2018.1 for an example (www.fao.org/fishery/statistics/software/wapi/en). ISSCAAP = International Standard Statistical Classification of Aquatic Animals and Plants.
5
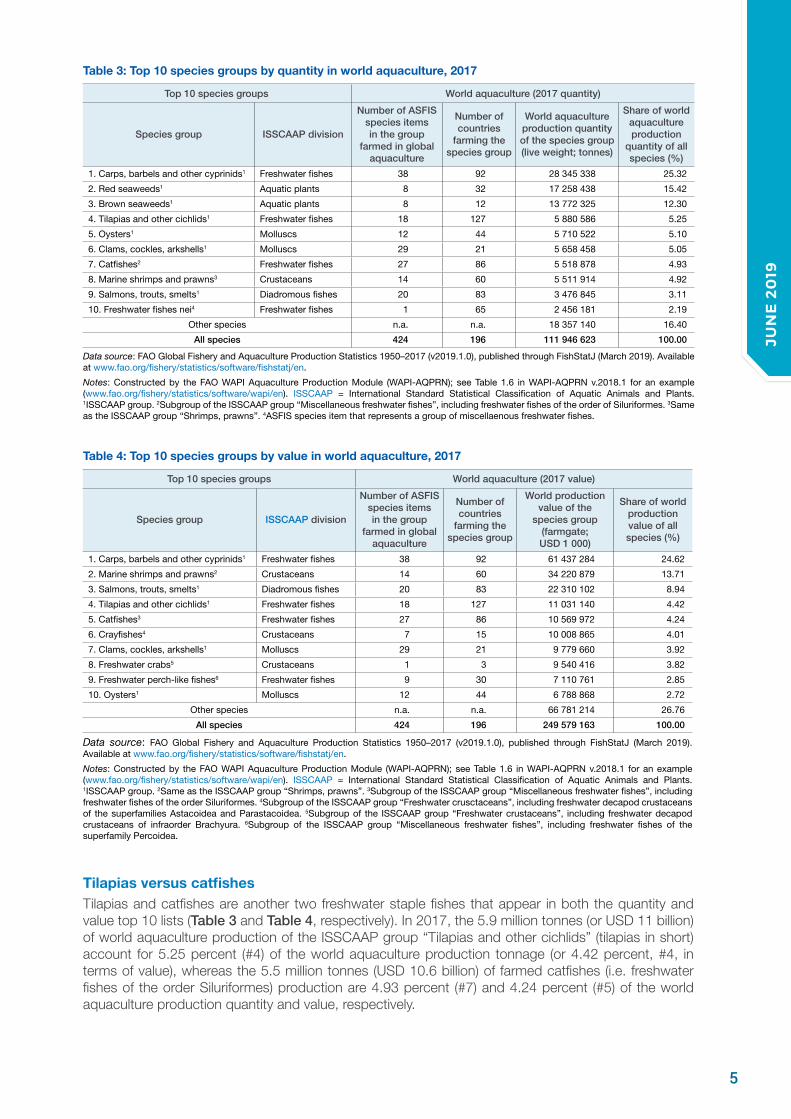
Tilapias versus catfishesTilapias and catfishes are another two freshwater staple fishes that appear in both the quantity and value top 10 lists (Table 3 and Table 4, respectively). In 2017, the 5.9 million tonnes (or USD 11 billion) of world aquaculture production of the ISSCAAP group “Tilapias and other cichlids” (tilapias in short) account for 5.25 percent (#4) of the world aquaculture production tonnage (or 4.42 percent, #4, in terms of value), whereas the 5.5 million tonnes (USD 10.6 billion) of farmed catfishes (i.e. freshwater fishes of the order Siluriformes) production are 4.93 percent (#7) and 4.24 percent (#5) of the world aquaculture production quantity and value, respectively.
JUN
E 2
019
Table 3: Top 10 species groups by quantity in world aquaculture, 2017
Top 10 species groups World aquaculture (2017 quantity)
Species group ISSCAAP division
Number of ASFIS species items in the group
farmed in global aquaculture
Number of countries
farming the species group
World aquaculture production quantity of the species group (live weight; tonnes)
Share of world aquaculture production
quantity of all species (%)
1. Carps, barbels and other cyprinids1 Freshwater fishes 38 92 28 345 338 25.32
2. Red seaweeds1 Aquatic plants 8 32 17 258 438 15.42
3. Brown seaweeds1 Aquatic plants 8 12 13 772 325 12.30
4. Tilapias and other cichlids1 Freshwater fishes 18 127 5 880 586 5.25
5. Oysters1 Molluscs 12 44 5 710 522 5.10
6. Clams, cockles, arkshells1 Molluscs 29 21 5 658 458 5.05
7. Catfishes2 Freshwater fishes 27 86 5 518 878 4.93
8. Marine shrimps and prawns3 Crustaceans 14 60 5 511 914 4.92
9. Salmons, trouts, smelts1 Diadromous fishes 20 83 3 476 845 3.11
10. Freshwater fishes nei4 Freshwater fishes 1 65 2 456 181 2.19
Other species n.a. n.a. 18 357 140 16.40
All species 424 196 111 946 623 100.00
Data source: FAO Global Fishery and Aquaculture Production Statistics 1950–2017 (v2019.1.0), published through FishStatJ (March 2019). Available at www.fao.org/fishery/statistics/software/fishstatj/en.
Notes: Constructed by the FAO WAPI Aquaculture Production Module (WAPI-AQPRN); see Table 1.6 in WAPI-AQPRN v.2018.1 for an example (www.fao.org/fishery/statistics/software/wapi/en). ISSCAAP = International Standard Statistical Classification of Aquatic Animals and Plants. 1ISSCAAP group. 2Subgroup of the ISSCAAP group “Miscellaneous freshwater fishes”, including freshwater fishes of the order of Siluriformes. 3Same as the ISSCAAP group “Shrimps, prawns”. 4ASFIS species item that represents a group of miscellaenous freshwater fishes.
Table 4: Top 10 species groups by value in world aquaculture, 2017
Top 10 species groups World aquaculture (2017 value)
Species group ISSCAAP division
Number of ASFIS species items in the group
farmed in global aquaculture
Number of countries
farming the species group
World production value of the
species group(farmgate; USD 1 000)
Share of world production value of all species (%)
1. Carps, barbels and other cyprinids1 Freshwater fishes 38 92 61 437 284 24.62
2. Marine shrimps and prawns2 Crustaceans 14 60 34 220 879 13.71
3. Salmons, trouts, smelts1 Diadromous fishes 20 83 22 310 102 8.94
4. Tilapias and other cichlids1 Freshwater fishes 18 127 11 031 140 4.42
5. Catfishes3 Freshwater fishes 27 86 10 569 972 4.24
6. Crayfishes4 Crustaceans 7 15 10 008 865 4.01
7. Clams, cockles, arkshells1 Molluscs 29 21 9 779 660 3.92
8. Freshwater crabs5 Crustaceans 1 3 9 540 416 3.82
9. Freshwater perch-like fishes6 Freshwater fishes 9 30 7 110 761 2.85
10. Oysters1 Molluscs 12 44 6 788 868 2.72
Other species n.a. n.a. 66 781 214 26.76
All species 424 196 249 579 163 100.00
Data source: FAO Global Fishery and Aquaculture Production Statistics 1950–2017 (v2019.1.0), published through FishStatJ (March 2019). Available at www.fao.org/fishery/statistics/software/fishstatj/en.
Notes: Constructed by the FAO WAPI Aquaculture Production Module (WAPI-AQPRN); see Table 1.6 in WAPI-AQPRN v.2018.1 for an example (www.fao.org/fishery/statistics/software/wapi/en). ISSCAAP = International Standard Statistical Classification of Aquatic Animals and Plants. 1ISSCAAP group. 2Same as the ISSCAAP group “Shrimps, prawns”. 3Subgroup of the ISSCAAP group “Miscellaneous freshwater fishes”, including freshwater fishes of the order Siluriformes. 4Subgroup of the ISSCAAP group “Freshwater crusctaceans”, including freshwater decapod crustaceans of the superfamilies Astacoidea and Parastacoidea. 5Subgroup of the ISSCAAP group “Freshwater crustaceans”, including freshwater decapod crustaceans of infraorder Brachyura. 6Subgroup of the ISSCAAP group “Miscellaneous freshwater fishes”, including freshwater fishes of the superfamily Percoidea.

6
Notably, the value share of tilapias or catfishes in world aquaculture is lower than their respective quantity share, reflecting the fact that they are generally low-value fish. While produced primarily for local consumption in many countries, tilapias and catfishes are also major international seafood commodities increasingly accepted as substitutes for traditional whitefish products.
According to FAO statistics, tilapias are the most popular aquaculture species group farmed in 127 countries in 2017. Major tilapia farming countries include China (27 percent of world tilapia aquaculture tonnage in 2017), Indonesia (22 percent), Egypt (16 percent), Bangladesh (5.7 percent), Brazil (4.9 percent), the Philippines (4.6 percent) and Viet Nam (4.0 percent).
While FAO statistics record 18 tilapia species items farmed worldwide in 2017, Nile tilapia is the dominant species in the group. Indeed, the Nile tilapia production of 4.1 million tonnes reported in FAO statistics (Table 1) is underestimated because the 1.3 million tonnes production in 2017 accounted under “Tilapia nei” is mostly Nile tilapia.
FAO statistics record 27 catfish species items farmed in 86 countries in 2017, including primarily Pangasius catfishes (51 percent of world catfish aquaculture tonnage) and Clarias catfishes (24 percent). Major catfish farming countries include Viet Nam (24 percent of world tonnage), Indonesia (23 percent), China (20 percent), India (9.9 percent), Bangladesh (9.4 percent), Nigeria (3.5 percent) and the United States of America (2.7 percent).
Red seaweeds versus brown seaweedsRed seaweeds and brown seaweeds (two ISSCAAP groups) are, respectively, the #2 and #3 aquaculture species group in terms of quantity (Table 3), yet they drop down from the top 10 value list (Table 4); in the value list, brown seaweeds fell to #11 whereas red seaweeds fell to #13.
FAO statistics record eight red seaweed species items farmed in 32 countries in 2017, with Indonesia and China being the largest producers, accounting for, respectively, 56 percent and 28 percent of the world production tonnage. In addition to Eucheuma seaweeds – including, primarily, Kappaphycus alvarezii and Eucheuma denticulatum – and Gracilaria seaweeds, which are mostly farmed for industrial use, Nori (Porphyra) are another major red seaweeds (2.6 million tonnes; 2.3 percent of world production of all species), which are primarily farmed for direct human consumption.
FAO statistics record eight brown seaweed species items farmed in 12 countries in 2017, with China being the main producer (accounting for 87 percent of the world production tonnage), followed by the Republic of Korea (8.9 percent) and the Democratic People’s Republic of Korea (4.0 percent). In addition to kelps, which are for both human consumption and industry use, Wakame (Undaria pinnatifida) is another major brown seaweed primarily used for human consumption; its 2.3 million tonnes of production in 2017 (2.1 percent of world production of all species) is ranked #16 among all species.
Oysters versus clamsOysters and another ISSCAAP group “Clams, cockles, arkshells” (or clams in short) are, respectively, the #5 and #6 species groups on the top 10 quantity list (Table 3), with nearly the same production (5.7 million tonnes; 5.1 percent of world production of all species). Yet, clams are ranked #7 in the value list (USD 9.8 billion; 3.92 percent of all species), whereas oysters ranked #10 (USD 6.8 billion; 2.72 percent) (Table 4).
FAO statistics record 12 oyster species items (mostly cupped oysters Crassostrea) farmed in 44 countries in 2017, with China accounting for 85 percent of the world production tonnage, followed by the Republic of Korea (5.5 percent), Japan (3.0 percent), United States of America (2.5 percent) and France (1.1 percent).
FAO statistics record 29 clam species items farmed in 21 countries in 2017, with China accounting for 95 percent of the world production tonnage. Japanese carpet shell (also known as Manila clam) accounts for 75 percent of the total world clam production in 2017, followed by constricted tagelus (Sinonovacula constricta; 15 percent) and blood cockle (Anadara granosa; 7.3 percent).
Marine shrimps and prawns Marine shrimps and prawns, i.e. the ISSCAAP group “Shrimps, prawns”, is ranked #8 by quantity (5.5 million tonnes; 4.92 percent of world tonnage of all species) and #2 in terms of value (USD 34 billion;
WA
PI
FAC
TS
HE
ET

7
13.71 percent of the world production value of all species). The much higher value share than quantity share indicates that marine shrimps and prawns are a high-value species group.
FAO statistics record 14 marine shrimps and prawns species items farmed in 60 countries in 2017, with major producers including China (35.1 percent of the 5.5 million tonnes of world production), Indonesia (13.3 percent), Viet Nam (12.9 percent), India (11.7 percent), Ecuador (7.9 percent) and Thailand (6.2 percent). Whiteleg shrimp and giant tiger prawn (Penaeus monodon) account for, respectively, 81 percent and 13 percent of the world marine shrimps and prawns production tonnage in 2017.
Salmons, trouts, smeltsThe ISSCAAP group “Salmons, trouts, smelts” (i.e. Salmoniformes) is the only diadromous species group on the top 10 lists, ranked #9 by quantity (3.5 million tonnes; 3.11 percent of all species quantity) and #3 by value (USD 22 billion; 8.94 percent of all species value). Like marine shrimps and prawns, Salmoniformes are also a high-value species group and one of the major international seafood commodities.
FAO statistics record 20 Salmoniformes species items farmed in 83 countries, with major producers including Norway (37.5 percent of the 3.5 million tonnes world production), Chile (24.6 percent), United Kingdom of Great Britain and Northern Ireland (5.9 percent), Iran (Islamic Republic of) (4.8 percent), Canada (4.3 percent) and Turkey (3.2 percent). Major species items in this group include Atlantic salmon (68 percent of the 3.5 million tonnes world Salmoniformes production), rainbow trout (Oncorhynchus mykiss; 23 percent) and coho salmon (O. kisutch; 5.2 percent).
CrayfishesCrayfishes, a subgroup of the ISSCAAP group “Freshwater crustaceans” that includes freshwater decapod crustaceans of the superfamilies Astacoidea and Parastacoidea, is ranked #15 by quantity and #6 by value (Table 4). While the FAO statistics report seven crayfish species items farmed in 2017, the world crayfish aquaculture production is virtually attributed entirely to red swamp crawfish (Table 2).
Freshwater crabsFreshwater crabs, a subgroup of the ISSCAAP group “Freshwater crustaceans” that includes freshwater decapod crustaceans of infraorder Brachyura, is ranked #19 by quantity and #8 by value (Table 4). The FAO statistics record only one fresh crab species (i.e. Chinese mitten crab) farmed in 2017, which is nevertheless the #6 ASFIS species item on the top 10 value list (Table 2).
Freshwater perch-like fishesFreshwater perch-like fishes, a subgroup of the ISSCAAP group “Miscellaneous freshwater fishes” that includes freshwater fishes of the superfamily Percoidea, is ranked #18 by quantity (0.8 million tonnes; 0.7 percent of the world production quantity of all species) and #9 by value (USD 7.1 billion; 2.85 percent of the world production value) (Table 4). The much higher value share indicates that this is a high-value species group.
FAO statistics report nine freshwater perch-like fishes farmed in 30 countries worldwide in 2017, with 0.8 million tonnes of total production. Largemouth black bass (Micropterus salmoides) is the number 1 species in this group, accounting for 56 percent of the total production. While FAO statistics record six countries farming the species in 2017, China accounted for 99.7 percent of the world production.
Mandarin fish (Siniperca chuatsi) accounted for 41 percent of the 2017 world aquaculture production of freshwater perch-like fishes, and according to FAO statistics, China was the only producer of the species in 2017.
Freshwater fishes neiThe #10 species group in Table 3 (i.e. freshwater fishes nei; 2.5 million tonnes accounting for 2.19 percent of global production of all species) is an ASFIS species item that represents a group of miscellaneous freshwater fishes. If this miscellaneous group is removed, then the ISSCAAP group “Scallops, pectens” (2.2 million tonnes accounting for 2.0 percent of global production of all species) would take the #10 place.
JUN
E 2
019

8
TOP 10 SPECIES GROUPS IN WORLD AQUACULTURE, EXCLUDING CHINA
China is the largest aquaculture producer, accounting for 57 percent of world aquaculture production in 2017 by live weight quantity and 60 percent by farmgate value. China is one of the major producers of nearly all the top 10 species groups in Table 3 and Table 4 except for “Salmons, trouts, smelts”. Thus, one may wonder what the top 10 species patterns look like in world aquaculture, excluding China, or in other words, in the rest of the world (ROW) as opposed to China.
In terms of quantity, the top 10 species group list for world aquaculture, excluding China (Table 5), looks similar to the one with China included (Table 3). Eight of the ten species groups in Table 3 remain in Table 5; the two exceptions are oysters and clams, which are replaced by milkfish (Chanos chanos) and mussels.
Despite that China accounted for nearly 60 percent of world aquaculture production tonnage in 2017, the ROW accounted for over 60 percent of world production of the following six top 10 species groups in world aquaculture (Table 3): (i) red seaweeds (71.8 percent); (ii) catfishes (79.9 percent); (iii) tilapias (73.1 percent); (iv) marine shrimps and prawns (64.9 percent); (v) Salmoniformes (97.8 percent); and (vi) freshwater fishes nei (76.3 percent) (Table 5).
Among the top 10 species groups in world aquaculture, excluding China (Table 5), the ROW accounts for over half of the world production tonnage for eight species groups except for carps (29.33 percent) and brown seaweeds (13.47 percent).
The first five species groups on the top 10 value list for world aquaculture (Table 4) remain on the list for world aquaculture, excluding China (Table 6), with some changes in the exact ranking. Yet the last five species groups in Table 4 (i.e. crayfishes; clams, cockles, arkshells; freshwater crabs; freshwater perch-like fishes; oysters) are replaced by mussels, marine perch-like fishes, freshwater fishes nei, red seaweeds and milkfish in Table 6.
Nine of the top 10 species groups in the quantity list for world aquacluture, excluding China (Table 5), remain on the top 10 value list (Table 6). Brown seaweeds is the only exception, which is replaced by marine perch-like fishes.
WA
PI
FAC
TS
HE
ET
Table 5: Top 10 species groups by quantity in world aquaculture, excluding China, 2017
Top 10 species groups World aquaculture, excluding China (2017 quantity)
Species groups ISSCAAP division
Number of ASFIS species items in
the group farmed in the ROW
Number of countries
in the ROW farming the
species group
ROW’s production
quantity of the species group(live weight;
tonnes)
Share of ROW’s
production quantity of all species (%)
ROW’s share of world
production of the same
species group (%)
1. Red seaweeds1 Aquatic plants 7 31 12 382 358 26.02 71.75
2. Carps, barbels and other cyprinids1 Freshwater fishes 37 91 8 314 012 17.47 29.33
3. Catfishes2 Freshwater fishes 25 85 4 407 755 9.26 79.87
4. Tilapias and other cichlids1 Freshwater fishes 18 126 4 295 906 9.03 73.05
5. Marine shrimps and prawns3 Crustaceans 14 59 3 575 264 7.51 64.86
6. Salmons, trouts, smelts1 Diadromous fishes 18 82 3 399 530 7.14 97.78
7. Freshwater fishes nei4 Freshwater fishes 1 64 1 873 492 3.94 76.28
8. Brown seaweeds1 Aquatic plants 8 11 1 854 685 3.90 13.47
9. Milkfish 5 Diadromous fishes 1 18 1 728 561 3.63 100.00
10. Mussels1 Molluscs 12 43 1 236 175 2.60 57.13
Other species n.a. n.a 4 520 405 9.50 n.a.
All species 404 195 47 588 142 100.00 42.51
Data sources: FAO Global Fishery and Aquaculture Production Statistics 1950–2017 (v2019.1.0), published through FishStatJ (March 2019). Available at www.fao.org/fishery/statistics/software/fishstatj/en.
Notes: Constructed by the FAO WAPI Aquaculture Production Module (WAPI-AQPRN); see Table 1.6 in WAPI-AQPRN v.2018.1 for an example. (www.fao.org/fishery/statistics/software/wapi/en). ISSCAAP = International Standard Statistical Classification of Aquatic Animals and Plants. 1ISSCAAP group. 2Subgroup of the ISSCAAP group “Miscellaneous freshwater fishes”, including freshwater fishes of the order Siluriformes. 3Same as the ISSCAAP group “Shrimps, prawns”. 4ASFIS species item that represents a group of miscellaenous freshwater fishes. 5Subgroup of the ISSCAAP group “Miscellaneous diadromous fishes”, including the only living species of the family Chanidae, i.e. milkfish (Chanos chanos).

9
MilkfishMilkfish, the #13 species group by quantity in world aquaculture, is ranked #9 by quantity (Table 5) and #10 by value (Table 6) in world aquaculture, excluding China. It is a diadromous fish (the only living species in the family Chanidae) farmed and consumed primarily in South-eastern Asia, with two major producers being Indonesia (73 percent of the 1.7 million tonnes of world milkfish aquaculture production in 2017) and the Philippines (24 percent).
MusselsMussels, an ISSCAAP group of bivalve molluscs ranked #12 by quantity in world aquaculture, is ranked #10 by quantity (Table 5) and #6 by value (Table 6) in world aquaculture, excluding China. FAO statistics record 12 mussel species items farmed in 44 countries worldwide (including China and 43 countries in the ROW) in 2017, with 2.2 million tonnes of total production. China and the ROW account for, respectively, 42.9 percent and 57.1 percent of the total production tonnage. Major farmed mussel producers in the ROW include Chile (15.8 percent of the 2.2 million tonnes of total production), Spain (11.2 percent) and New Zealand (4.6 percent).
Marine perch-like fishes
Marine perch-like fishes, a subgroup of the ISSCAAP group “Miscellaneous coastal fishes” that includes marine fishes of the superfamily Percoidea, is ranked #14 by value in world aquaculture and #7 in world aquaculture, excluding China (Table 6). Similar to freshwater perch-like fishes, marine perch-like fishes are also a high-value species group with a higher value share (1.9 percent) than quantity share (1.1 percent) in world aquaculture.
The FAO statistics report 1.2 million tonnes (USD 4.8 billion) of world farmed marine perch-like fishes production in 2017, contributed by the farming of 45 species items, including primarily seabreams (Sparidae; 30 percent of the 1.2 million tonnes of world production of marine perch-like fishes), drums/croakers/meagres (Sciaenidae; 23 percent), European seabass (Dicentrarchus labrax; 17 percent), groupers (Serranidae; 15 percent) and Japanese seabass (Lateolabrax japonicus; 13 percent).
The farming of five marine perch-like fish species items (large yellow croaker, Larimichthys croceus; Japanese seabass, Lateolabrax japonicus; groupers nei, Epinephelus spp.; porgies, seabreams nei,
JUN
E 2
019
Table 6: Top 10 species groups by value in world aquaculture, excluding China, 2017
Top 10 species groups World aquaculture, excluding China (2017 value)
Species groups ISSCAAP division
Number of ASFIS species items in
the group farmed in the ROW
Number of countries
in the ROW farming the
species group
ROW’s production
value of the species
group(farmgate; USD 1 000)
Share of ROW’s
production value of all species (%)
ROW’s share of world
production value of the
same species group (%)
1. Salmons, trouts, smelts1 Diadromous fishes 18 82 22 114 103 21.98 99.12
2. Marine shrimps and prawns2 Crustaceans 14 59 19 383 158 19.26 56.64
3. Carps, barbels and other cyprinids1 Freshwater fishes 37 91 14 869 677 14.78 24.20
4. Catfishes3 Freshwater fishes 25 85 7 934 388 7.89 75.07
5. Tilapias and other cichlids1 Freshwater fishes 18 126 6 722 395 6.68 60.94
6. Mussels1 Molluscs 12 43 3 835 250 3.81 89.71
7. Marine perch-like fishes4 Marine fishes 44 42 3 439 126 3.42 71.97
8. Freshwater fishes nei5 Freshwater fishes 1 64 2 743 034 2.73 67.90
9. Red seaweeds1 Aquatic plants 7 31 2 473 324 2.46 46.91
10. Milkfish6 Diadromous fishes 1 18 2 428 587 2.41 100.00
Other species n.a. n.a 14 673 002 14.58 n.a.
All species 404 195 100 616 045 100.00 40.31
Data source: FAO Global Fishery and Aquaculture Production Statistics 1950–2017 (v2019.1.0), published through FishStatJ (March 2019). Available at www.fao.org/fishery/statistics/software/fishstatj/en.
Notes: Constructed by the FAO WAPI Aquaculture Production Module (WAPI-AQPRN); see Table 1.6 in WAPI-AQPRN v.2018.1 for an example (www.fao.org/fishery/statistics/software/wapi/en). ISSCAAP = International Standard Statistical Classification of Aquatic Animals and Plants. 1ISSCAAP group. 2Same as the ISSCAAP group “Shrimps, prawns”. 3Subgroup of the ISSCAAP group “Miscellaneous freshwater fishes”, including freshwater fishes of the order Siluriformes. 4Subgroup of the ISSCAAP group “Miscellaneous coastal fishes”, including marine fishes of the superfamily Percoidea. 5ASFIS species item that represents a group of miscellaenous freshwater fishes. 6Subgroup of the ISSCAAP group “Miscellaneous diadromous fishes”, including the only living species of the family Chanidae, i.e. milkfish (Chanos chanos).

10
Sparidae; and red drum, Sciaenops ocellatus) in China accounts for 49.3 percent of the 1.2 million tonnes (or 28.0 percent of the USD 4.8 billion) of world marine perch-like fishes aquaculture production in 2017; the other 50.7 percent of the tonnage (or 72.0 percent of the value) comes from the ROW’s farming of 44 marine perch-like species items in 42 countries (e.g. Turkey, 13.0 percent of the world tonnage; Greece, 8.3 percent; Egypt, 7.3 percent; and Japan, 5.0 percent).
OUTLOOK
SeaweedsSeaweeds account for 28.4 percent of global aquaculture tonnage and 4.8 percent of global aquaculture value in 2017; the contributions are more than tilapias (5.3 percent in tonnage and 4.4 percent in value) and catfishes (4.9 percent in tonnage and 4.2 percent in value). Red seaweeds and brown seaweeds are the #2 and #3 species groups by quantity in 2017 world aquaculture (Table 3); and red seaweeds is the #9 species group by value in world aquaculture, excluding China (Table 6).
However, seaweeds, farmed in 46 countries in 2017 (32 for red seaweeds, 12 for brown seaweeds, 6 for green seaweeds and 5 for seaweeds nei), are less widely farmed than many other top 10 species groups, such as tilapias (127 countries), carps (92 countries), catfishes (86 countries), Salmoniformes (83 countries), and marine shrimps and prawns (60 countries).
There has been increasing recognition of the nutritional value of seaweeds as food, their many industrial applications (cosmetics, biofuels, pharmaceuticals, nutraceuticals, feed ingredients, among others), and their ecosystem services (carbon sequestration, eutrophication mitigation, etc.). Therefore, the popularity of seaweeds as an aquaculture item would tend to increase in the future.
Marine fishesNone of the top 10 species groups in world aquaculture (Table 3 and Table 4) comes from the ISSCAAP division “Marine fishes”. This should not be surprising since marine fishes account for only 2.8 percent of the world aquaculture production tonnage (or 5.2 percent of production value) in 2017.
However, marine perch-like fishes is already on the top 10 value list for world aquaculture, excluding China (Table 6), and it is the #14 species group (by quantity and by value) in world aquaculture. Considering marine fishes as being the largest component in global seafood consumption (thanks to the supply from capture fisheries), it is likely that one or more marine fish groups could become a top 10 species group soon, a prediction that may soon be verified with time.
SUPPLEMENTARY MATERIALS
The factsheet presents information extracted from the latest FAO data and statistics on global aquaculture production with limited discussion. Readers may refer to the forthcoming FAO publication The State of the World’s Aquatic Genetic Resources for Food and Agriculture for a global assessment on aquatic genetic resources for food and agriculture based on national reporting.
More information about the top 10 species (groups) in 2017 at the regional level or national level (for major fish farming countries) can be found in a more comprehensive factsheet available at www.fao.org/3/ca5187en/ca5187en.pdf. The comprehensive factsheet also explains the methodology of WAPI species grouping used in the ranking exercise.
Information on the top 10 species (groups) in global, regional and national aquaculture presented in this factsheet and the more comprehensive factsheet is generated by the WAPI Aquaculture Production Module (WAPI-AQPRN), a data analysis tool developed by FAO. While the factsheets present top 10 species patterns in 2017, the tool allows similar analyses in any year and for any country or area when data are available. A previous version of the module (i.e. WAPI-AQPRN v.2018.1) is available for test use – see more information on the WAPI webpage (www.fao.org/fishery/statistics/software/wapi/en).
ACKNOWLEDGEMENTS
Devin Bartley, PingSun Leung and Xinhua Yuan are acknowledged for their highly valuable review of the factsheet.
WA
PI
FAC
TS
HE
ET

11
Notes1. Information presented in the factsheet is based on FAO Global Fishery and Aquaculture Production
Statistics 1950–2017 dataset (v2019.1.0), released through FishStatJ (March 2019). Available at www.fao.org/fishery/statistics/software/fishstatj/en.
2. ASFIS species items could refer to either individual species, hybrids or groups of related species, such as families (when identification to species is impossible). More information about the ASFIS list of aquatic species can be found at www.fao.org/fishery/collection/asfis/en.
3. The 424 species items do not include two farmed species items with global production in 2017 recorded as negligible (i.e. < 0.5 tonnes) in the FAO database.
4. The species grouping is based on the International Standard Statistical Classification of Aquatic Animals and Plants (ISSCAAP; www.fao.org/fishery/static/ASFIS/ISSCAAP.pdf). Most of the species groups used in the ranking follow the classification of ISSCAAP groups that have a clear taxonomic scope (“Carps, barbels and other cyprinids”, “Tilapias and other cichlids”, etc.), whereas some species groups used in the ranking are subgroups of a miscellaneous ISSCAAP group (e.g. “Catfishes” and “Freshwater perch-like fishes” being two subgroups of the ISSCAAP group “Miscellaneous freshwater fishes”). A species group used in the ranking could be an individual ASFIS species item when the item is essentially a species group (e.g. Freshwater fishes nei) or when there is a lack of other species items to join it into a suitable taxonomic group (e.g. Cobia, Rachycentron canadum). More details about the species grouping used for the ranking are provided in the supplementary materials to this factsheet; see the complete ranking of all the species groups on the back cover.
5. In this document, China refers to mainland China.
6. Nei = not elsewhere included.
7. Unless specified otherwise, in this document the term country includes non-sovereign territory.
8. The number of countries farming Nile tilapia in 2017 should be much more than 78 since most aquaculture production categorized under the ASFIS species item “Tilapia nei” tends to be Nile tilapia.
9. The actual number of carp species farmed in 2017 may be more than the FAO record because some niche carp species may not be reported separately. Other species groups are subject to a similar situation.
JUN
E 2
019

©FA
O, 2
019
C
A52
24EN
/1/0
6.19
Some rights reserved. This work is available under a CC BY-NC-SA 3.0 IGO licence
28 345 338 17 258 438
13 772 325 5 880 586
5 710 522 5 658 458 5 518 878 5 511 914
3 476 845 2 456 181
2 185 243 2 163 784
1 728 561 1 248 728 1 193 760
1 029 126 990 105
818 250 751 003 685 429 583 029 581 402 447 938 423 073 402 523 371 405 358 336 296 913 259 390 236 152 232 524 222 310 181 008 100 379 98 894 98 874 87 721 82 280 81 918 72 023 69 436 49 573 37 115 35 013 29 514 26 253 25 526 22 542 21 010 19 600 2 172 2 070 1 639 1 130 1 010 521 425 261 203 21 20 3 2 0
1. Carps, barbels and other cyprinids (ISSCAAP group)2. Red seaweeds (ISSCAAP group)
3. Brown seaweeds (ISSCAAP group)4. Tilapias and other cichlids (ISSCAAP group)
5. Oysters (ISSCAAP group)6. Clams, cockles, arkshells (ISSCAAP group)
7. Catfishes (Siluriformes)8. Marine shrimps and prawns (ISSCAAP group)
9. Salmons, trouts, smelts (ISSCAAP group)10. Freshwater fishes nei (Osteichthyes)
11. Scallops, pectens (ISSCAAP group)12. Mussels (ISSCAAP group)
13. Milkfish (Chanidae)14. Marine perch-like fishes (Percoidea, marine)
15. Crayfishes (Astacoidea and Parastacoidea)16. Marine molluscs nei (Mollusca)
17. Marine fishes not identified (ISSCAAP group)18. Freshwater perch-like fishes (Percoidea, freshwater)
19. Freshwater crabs (Brachyura)20. Seaweeds nei (Algae)
21. Snakeheads (Channidae)22. Freshwater shrimps and prawns (Natantia, freshwater)
23. Characins (Characiformes)24. Abalones, winkles, conchs (ISSCAAP group)
25. Crabs, sea-spiders (marine) (ISSCAAP group)26. Turtles (ISSCAAP group)
27. Asian swamp eel (Monopterus albus)28. Jacks and pompanos (Carangidae)
29. River eels (ISSCAAP group)30. Mullets (Mugilidae)
31. Sea-urchins and other echinoderms (ISSCAAP group)32. Gouramies (Anabantoidei)
33. Flounders, halibuts, soles (ISSCAAP group)34. Frogs and other amphibians (ISSCAAP group)
35. Chinese mystery snail (Cipangopaludina chinensis)36. Sturgeons, paddlefishes (ISSCAAP group)
37. Aquatic invertebrates nei (Invertebrata)38. Jellyfishes nei (Rhopilema spp)
39. Diadromous perch-like fishes (Percoidea, diadromous)40. Spirulinas (Spirulinaceae)
41. Swan mussel (Anodonta cygnea)42. Cobia (Rachycentron canadum)
43. Tunas, bonitos, billfishes (ISSCAAP group)44. Puffers and filefishes (Tetraodontiformes)
45. Freshwater molluscs nei (Mollusca)46. Basket clams (Corbiculidae)
47. Bony tongues (Osteoglossiformes)48. Scorpionfishes and flatheads (Scorpaeniformes)
49. Green seaweeds (ISSCAAP group)50. Sea-squirts and other tunicates (ISSCAAP group)
51. Pearls, mother-of-pearl, shells (ISSCAAP group)52. Lobsters, spiny-rock lobsters (ISSCAAP group)
53. Aquatic plants nei (Plantae aquaticae)54. Northern pike (Esox lucius)
55. Freshwater gobies and sleepers (Gobioidei, freshwater)56. Cods, hakes, haddocks (ISSCAAP group)
57. Shads (ISSCAAP group)58. Surgeonfishes and relatives (Acanthuroidei)
59. Mackerels, tunas, bonitos (Scombridae)60. Marine crustaceans nei (Crustacea)
61. Freshwater crustaceans nei (Crustacea)62. Burbot (Lota lota)
63. Squids, cuttlefishes, octopuses (ISSCAAP group)64. Green humphead parrotfish (Bolbometopon muricatum)
World aquaculture production quantity (2017): 111 946 623 tonnes
25.3%
15.4%
12.3%5.3%5.1%
5.1%
4.9%
4.9%3.1%
2.2%