total factor productivity - oecd.org - oecd 3 koen mondelaer… · · 2016-03-29agricultural...
TRANSCRIPT
Measurement of EU agricultural total factor
productivity growth
Koen Mondelaers
DG for Agriculture and Rural Development
Unit E.2 – Economic modelling and Outlook
1

Relevancy
General objectives for the CAP1,2:
• Promoting a viable food production, with the focus on agricultural income, agricultural productivity and price stability;
• Promoting sustainable management of natural resources and climate action, with a focus on greenhouse gas emissions, biodiversity, soil and water;
• Promoting balanced territorial development, with a focus on rural employment, growth and poverty in rural areas.
TFP is one of the three impact indicators for the general CAP objective of promoting a viable food production
• TFP growth has to increase compared to the 2009-2011 baseline of 104 (with TFP index for 2005 equalling 100)
1Communication from the Commission on The CAP towards 2020 for the next programming period (2014 – 2020), further specified in the Regulation (EU) No 1306/2013 , Article 110(2)
2Treaty of the Functioning of the European Union (TFEU) Article 39
2
Relevancy
It is also used to evaluate the European Innovation Partnership for Agricultural Productivity and Sustainability (EIP-Ag)
TFP indicator is reported yearly:
• in the Statistical and Economic Information Report on Rural Development in the EU
• in the DG AGRI Management Report
Missing global measure since 2002 when Eurostat stopped calculating it because of land value missing
3
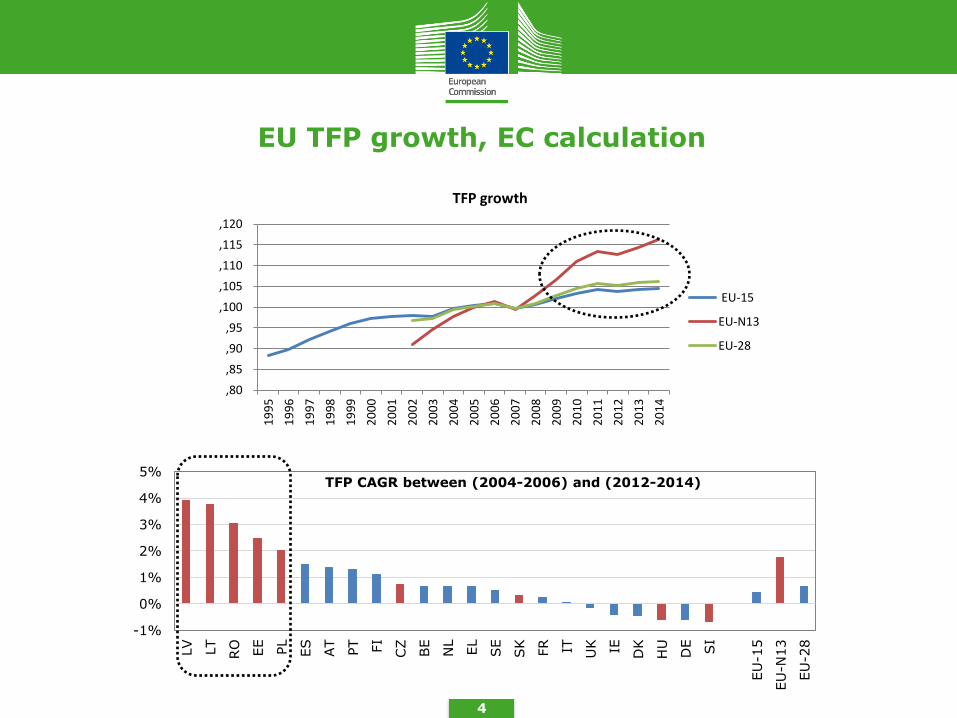
EU TFP growth, EC calculation
4
,80
,85
,90
,95
,100
,105
,110
,115
,120
19
95
19
96
19
97
19
98
19
99
20
00
20
01
20
02
20
03
20
04
20
05
20
06
20
07
20
08
20
09
20
10
20
11
20
12
20
13
20
14
TFP growth
EU-15
EU-N13
EU-28
-1%
0%
1%
2%
3%
4%
5%
LV
LT
RO EE
PL
ES
AT
PT FI
CZ
BE
NL
EL
SE
SK
FR IT UK IE DK
HU
DE SI
EU
-15
EU
-N13
EU
-28
TFP CAGR between (2004-2006) and (2012-2014)

EU TFP growth, FP7 Compete
"Despite the positive TFP development in many countries we did not observe catching up process between the regions.
The metafrontier analysis showed that despite a period of almost 10 years after accession the productivity differences in agriculture among as well as within countries are quite substantial."
Čechura et al. (2014). Total Factor Productivity in
European Agricultural Production, Working paper. Compete FP7
5
Regional TFP differences – Milk production
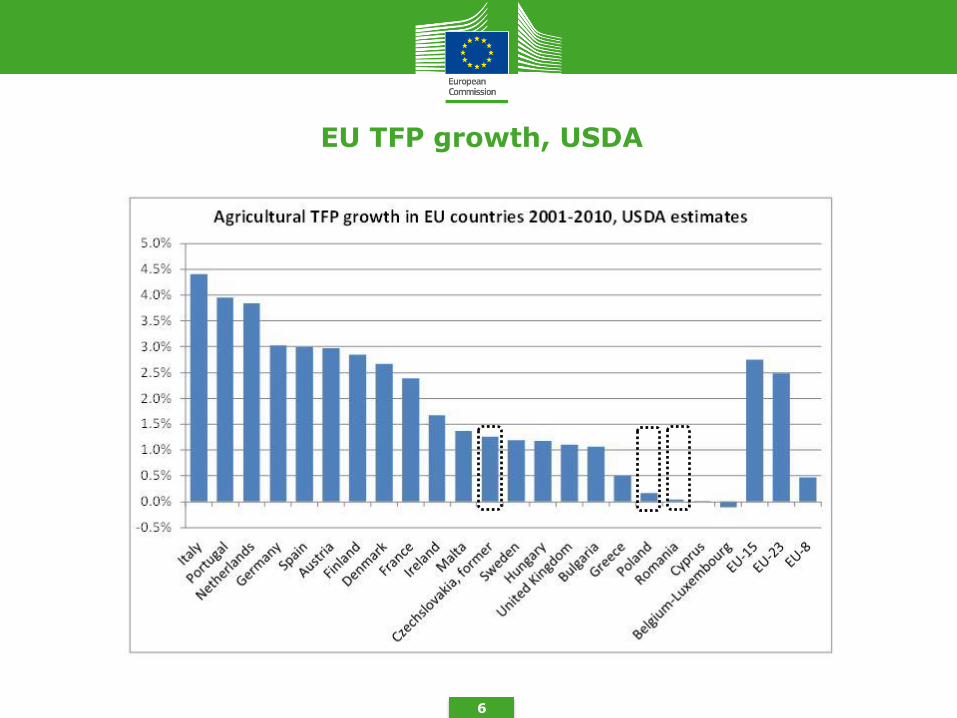
EU TFP growth, USDA
6
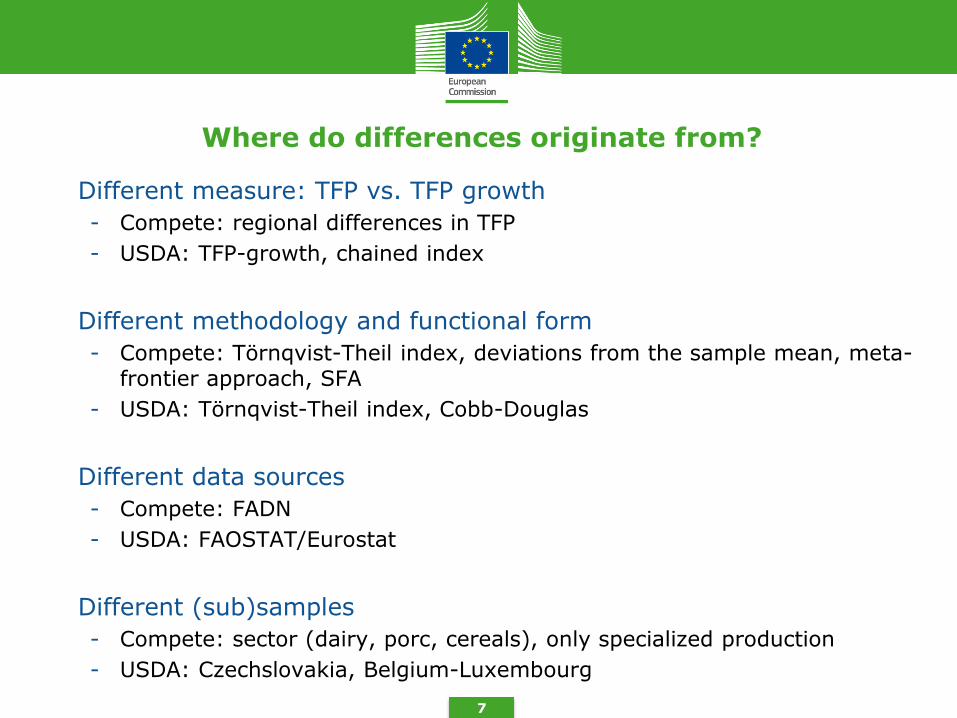
Where do differences originate from?
- Different measure: TFP vs. TFP growth
- Compete: regional differences in TFP
- USDA: TFP-growth, chained index
- Different methodology and functional form
- Compete: Törnqvist-Theil index, deviations from the sample mean, meta-frontier approach, SFA
- USDA: Törnqvist-Theil index, Cobb-Douglas
- Different data sources
- Compete: FADN
- USDA: FAOSTAT/Eurostat
- Different (sub)samples
- Compete: sector (dairy, porc, cereals), only specialized production
- USDA: Czechslovakia, Belgium-Luxembourg
7

Where do differences originate from?
- Different output and input factors
- Compete: y1 milk production, y2 other animal production, y3 plant production, x1 labour, x2 land, x3 capital, x4 specific material and x5 other material
- USDA: crop and livestock commodity outputs and land, labor, livestock, farm machinery, inorganic fertilizers and animal feed inputs
- Different ways to calculate output and input volumes and weights
- USDA: labour quality adjusted for skills; capital: livestock and machinery in use on farm; land: quality weights to adjust permanent pasture and irrigated land into rainfed equivalents
- USDA: cost shares varied per decade, revenu shares constant (base year)
- Different ways to circumvent data gaps and outliers
- …
8
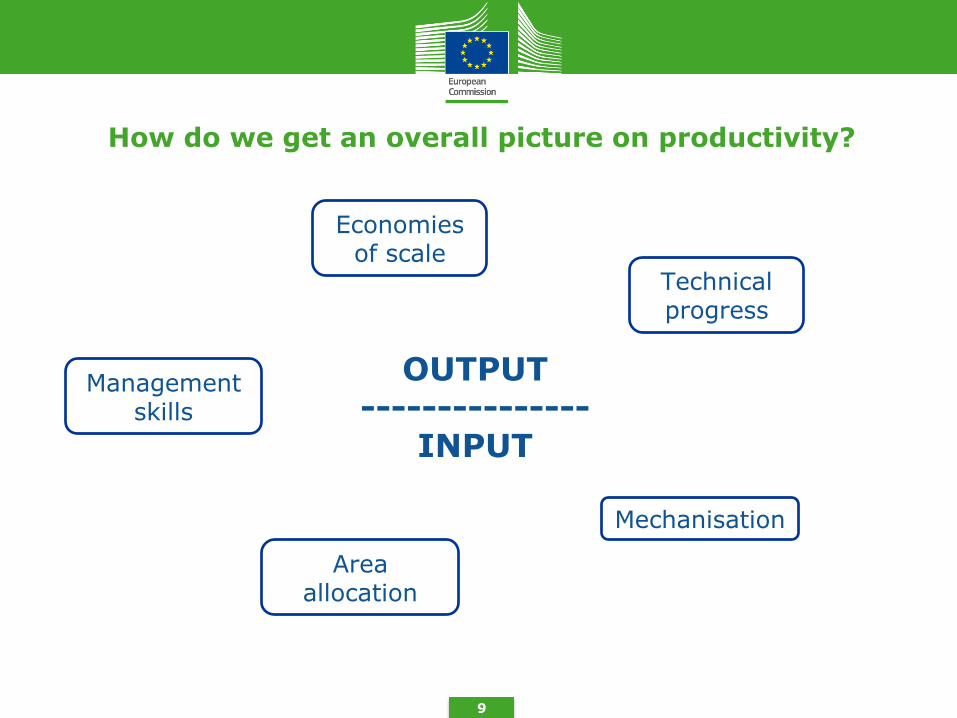
How do we get an overall picture on productivity?
9
OUTPUT ---------------
INPUT
Economies of scale
Management skills
Area allocation
Mechanisation
Technical progress
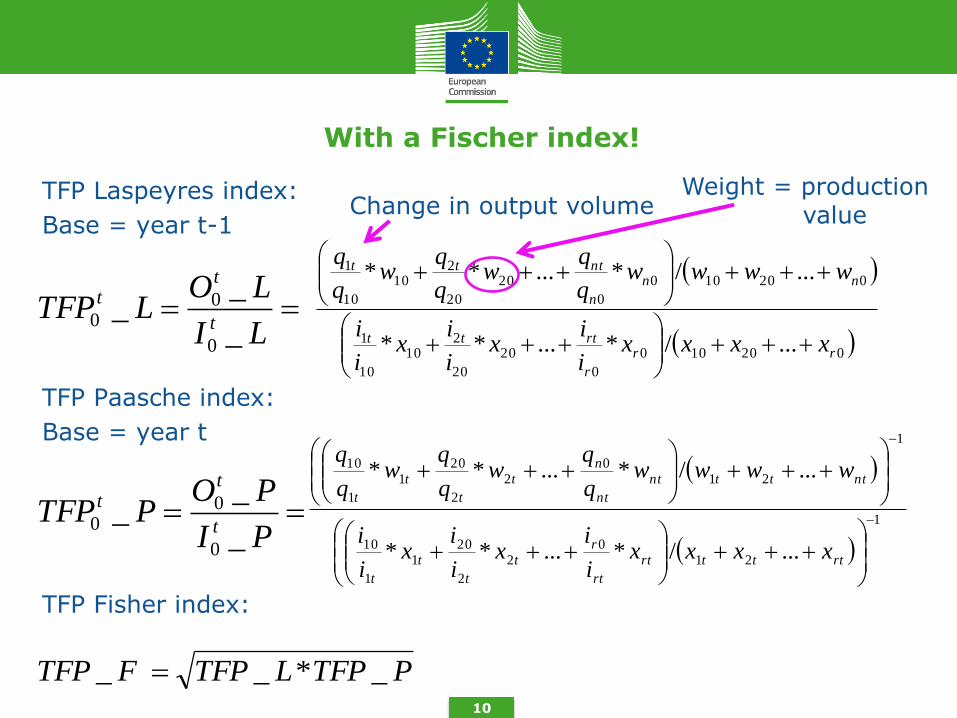
With a Fischer index!
10
020100
0
20
20
210
10
1
020100
0
20
20
210
10
1
.../*...**
.../*...**
rr
r
rttt
nn
n
nttt
xxxxi
ix
i
ix
i
i
wwwwq
qw
q
qw
q
q
TFP Laspeyres index:
Base = year t-1
TFP Paasche index:
Base = year t
TFP Fisher index:
LI
LOLTFP
t
tt
_
__
0
00
PI
POPTFP
t
tt
_
__
0
00
1
210
2
2
201
1
10
1
21
0
2
2
20
1
1
10
.../*...**
.../*...**
rtttrt
rt
rt
t
t
t
ntttnt
nt
n
t
t
t
t
xxxxi
ix
i
ix
i
i
wwwwq
qw
q
qw
q
q
PTFPLTFPFTFP _*__
Change in output volume Weight = production value
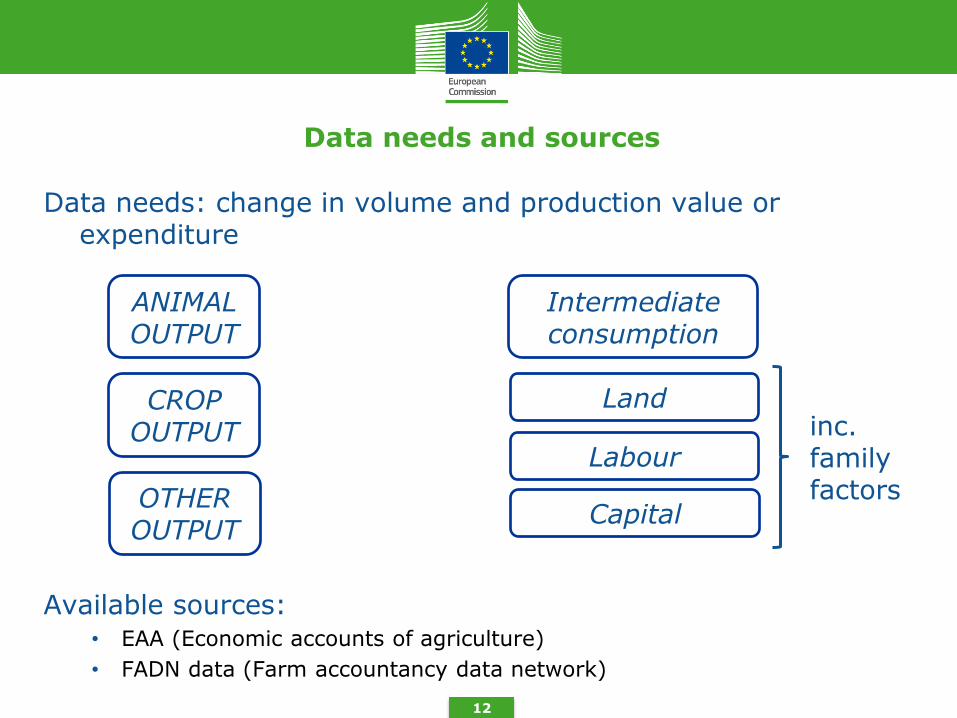
Data needs and sources
Data needs: change in volume and production value or expenditure
inc. family factors
Available sources: • EAA (Economic accounts of agriculture)
• FADN data (Farm accountancy data network)
12
CROP OUTPUT
ANIMAL OUTPUT
OTHER OUTPUT
Intermediate consumption
Land
Labour
Capital
Output
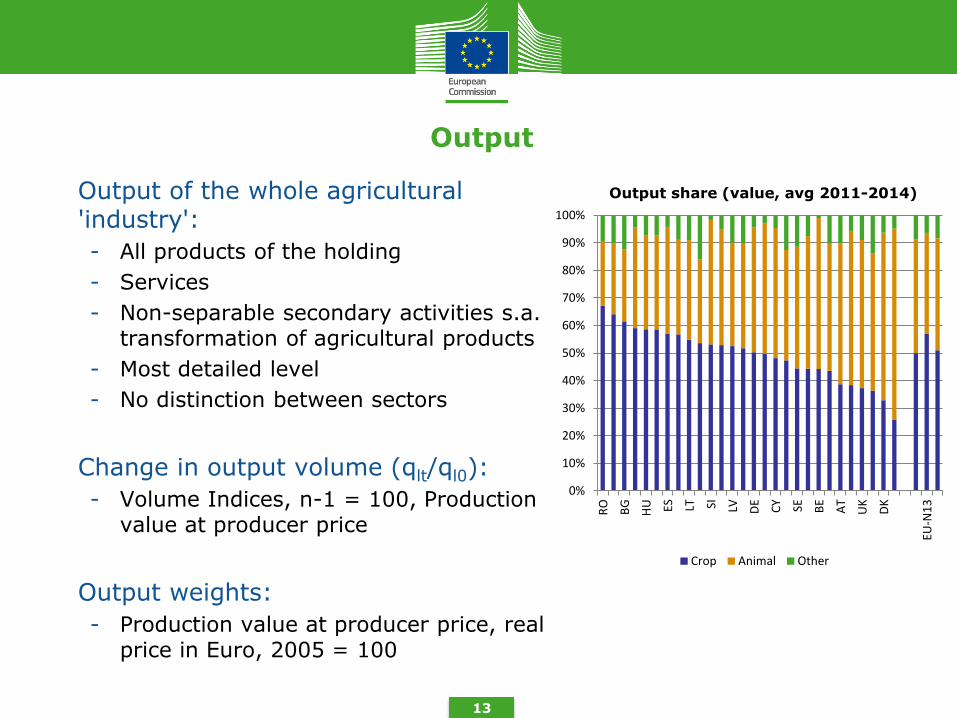
- Output of the whole agricultural 'industry':
- All products of the holding
- Services
- Non-separable secondary activities s.a. transformation of agricultural products
- Most detailed level
- No distinction between sectors
- Change in output volume (qlt/ql0):
- Volume Indices, n-1 = 100, Production value at producer price
- Output weights:
- Production value at producer price, real price in Euro, 2005 = 100
13
0%
10%
20%
30%
40%
50%
60%
70%
80%
90%
100%
RO
BG
HU ES LT SI LV DE
CY SE BE
AT
UK
DK
EU-N
13
Crop Animal Other
Output share (value, avg 2011-2014)
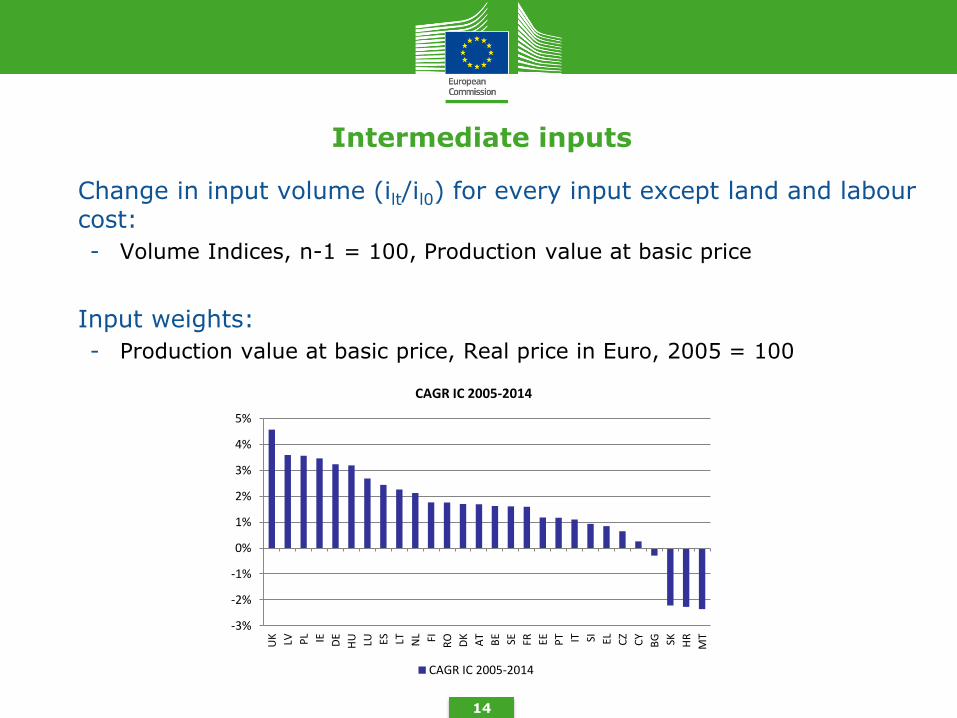
Intermediate inputs
- Change in input volume (ilt/il0) for every input except land and labour cost:
- Volume Indices, n-1 = 100, Production value at basic price
- Input weights:
- Production value at basic price, Real price in Euro, 2005 = 100
14
-3%
-2%
-1%
0%
1%
2%
3%
4%
5%
UK LV PL IE DE
HU LU ES LT NL FI R
O DK
AT
BE SE FR EE PT IT SI EL CZ
CY
BG SK HR
MT
CAGR IC 2005-2014
CAGR IC 2005-2014
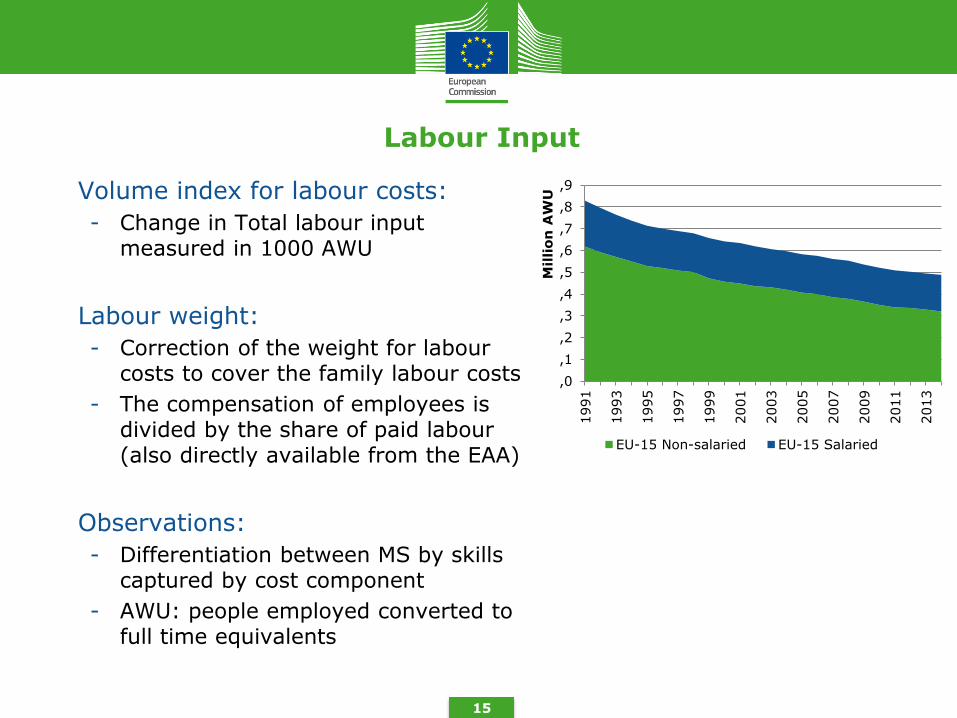
Labour Input
- Volume index for labour costs:
- Change in Total labour input measured in 1000 AWU
- Labour weight:
- Correction of the weight for labour costs to cover the family labour costs
- The compensation of employees is divided by the share of paid labour (also directly available from the EAA)
- Observations:
- Differentiation between MS by skills captured by cost component
- AWU: people employed converted to full time equivalents
15
,0
,1
,2
,3
,4
,5
,6
,7
,8
,9
1991
1993
1995
1997
1999
2001
2003
2005
2007
2009
2011
2013
Millio
n A
WU
EU-15 Non-salaried EU-15 Salaried
Land input
- Volume index for land costs:
- Change in Total UAA available in the EAA
- Land weight:
- Correct the value to include own land: similar procedure compared to labour
- Total UAA (hectares) x average rent
- Average rent: Total expenditure for rents/number of hectares of rented land
- Share of rented land derived from FSS
- Total UAA derived from Agricultural Production Data – Crop products
16
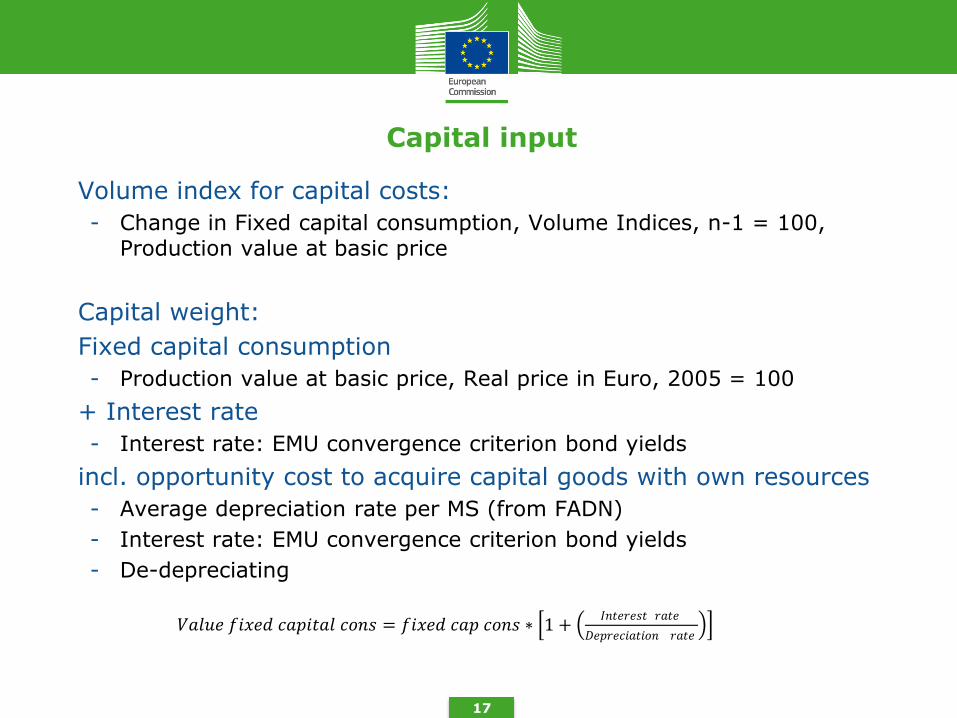
Capital input
- Volume index for capital costs:
- Change in Fixed capital consumption, Volume Indices, n-1 = 100, Production value at basic price
- Capital weight:
- Fixed capital consumption
- Production value at basic price, Real price in Euro, 2005 = 100
- + Interest rate
- Interest rate: EMU convergence criterion bond yields
- incl. opportunity cost to acquire capital goods with own resources
- Average depreciation rate per MS (from FADN)
- Interest rate: EMU convergence criterion bond yields
- De-depreciating
17
𝑉𝑎𝑙𝑢𝑒 𝑓𝑖𝑥𝑒𝑑 𝑐𝑎𝑝𝑖𝑡𝑎𝑙 𝑐𝑜𝑛𝑠 = 𝑓𝑖𝑥𝑒𝑑 𝑐𝑎𝑝 𝑐𝑜𝑛𝑠 ∗ 1 + 𝐼𝑛𝑡𝑒𝑟𝑒𝑠𝑡 𝑟𝑎𝑡𝑒
𝐷𝑒𝑝𝑟𝑒𝑐𝑖𝑎𝑡𝑖𝑜𝑛 𝑟𝑎𝑡𝑒

Why do we apply the 3-y moving average?
18
75
80
85
90
95
100
105
110
115
120
125
75
80
85
90
95
100
105
EU-15 (3y avg)
EU-15
EU-N13
EU-N13 (3y avg)
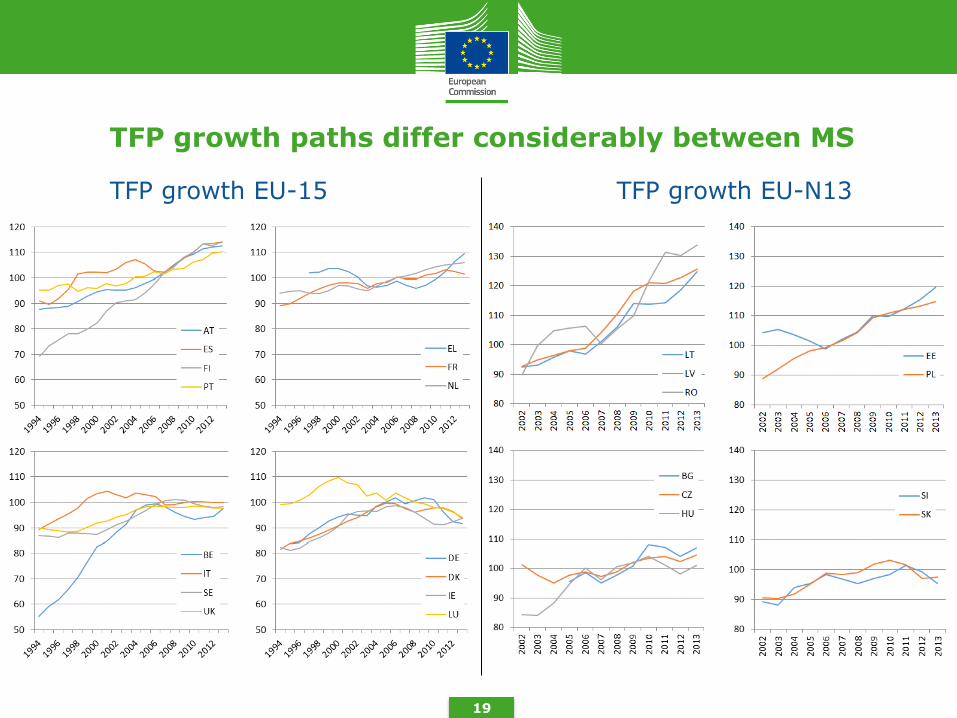
TFP growth paths differ considerably between MS
TFP growth EU-15 TFP growth EU-N13
19

Higher labour productivity is the main factor for TFP increase in the EU-N13…
20
Total factor productivity index, 2005=100, 3 year moving average, 2014 = avg(2012,2013,2014), calculation based mainly on the Economic Accounts of Agriculture
,80
,90
,100
,110
,120
,130
,140
,150
2002 2003 2004 2005 2006 2007 2008 2009 2010 2011 2012 2013 2014
TFP
Labour
Land
Capital
Int. cons.

Conclusion
TFP growth measurement
• Need for harmonisation of approaches
• Adapt methods to objective
• Communicate with care
EA TFP
• Agreement on approach?
• Inputs and bad outputs to consider?
• Data availability?
• Interpretation?
21

How will we proceed
22
o Further thourough data check
o Data issues: ask feedback from MS
o Preparation of a publication in 2016
o Further revision of the methodology
Thank you!
Contact: [email protected]